Article

Investigation of the Failure Response of Masonry Walls Subjected to Blast Loading Using Nonlinear Finite Element Analysis

by
Sipho G. Thango
1,
Georgios E. Stavroulakis
2,* and
Georgios A. Drosopoulos
1,3
1
Discipline of Civil Engineering, University of Kwazulu-Natal, Durban 4041, South Africa
2
Department of Production Engineering and Management, Technical University of Crete, 73100 Chania, Greece
3
Discipline of Civil Engineering, University of Central Lancashire, Preston PR1 2HE, UK
*
Author to whom correspondence should be addressed.
Computation 2023, 11(8), 165; https://doi.org/10.3390/computation11080165
Submission received: 17 July 2023 / Revised: 16 August 2023 / Accepted: 18 August 2023 / Published: 21 August 2023
(This article belongs to the Special Issue Computational Methods in Structural Engineering)

Abstract

:
A numerical investigation of masonry walls subjected to blast loads is presented in this article. A non-linear finite element model is proposed to describe the structural response of the walls. A unilateral contact–friction law is used in the interfaces of the masonry blocks to provide the discrete failure between the blocks. A continuum damage plasticity model is also used to account for the compressive and tensile failure of the blocks. The main goal of this article is to investigate the different collapse mechanisms that arise as an effect of the blast load parameters and the static load of the wall. Parametric studies are conducted to evaluate the effect of the blast source–wall (standoff) distance and the blast weight on the structural response of the system. It is shown that the traditional in-plane diagonal cracking failure mode may still dominate when a blast action is present, depending on the considered standoff distance and the blast weight when in-plane static loading is also applied to the wall. It is also highlighted that the presence of an opening in the wall may significantly reduce the effect of the blasting action.

Graphical Abstract

1. Introduction

Over the years, increasing research efforts have been developed focusing on analyzing the structural behavior of masonry walls. Masonry is defined as a set of stone units that are connected using mortar joints that are organized to form a regular pattern [1]. Masonry is commonly used in monuments, masonry arches, and also in low-cost houses. For these structural systems, the low tensile resistance of masonry or mortar interfaces may lead to a compromised response when in- and out-of-plane lateral forces reach high values.
Among several loading conditions, ongoing research aims to investigate the impact of blasting forces on masonry structures. In particular, research on this type of loading focuses on mining activities using blasting operations, which comprise the first phase of the production cycle in most of the mining processes. Blasting is used to fragment the rock overlying the coal seams in most mines. When the explosives are detonated, most of the energy is consumed in rock fragmentation [2]. According to [3], energy not used to break rock radiates out from the blast site in the form of ground vibrations and air blasts. Additionally, when explosives are ignited in rock, a shock wave is produced that breaks the rock and then a force in the form of gas pressure is formed [4]. An explosion or blast activity is defined as the release of a significant amount of energy that takes place in a short time period.
Computer advancement in the past decades has enabled researchers to model masonry with its complexities using finite element analysis. The finite element (FE) method is one of the advanced numerical techniques that is commonly applied to analyze complex structural engineering problems. Research work presented in [5,6,7,8,9] and others indicate that by using the FE method, the failure modes that occur in masonry due to blast loading can be successfully analyzed.
According to [10], the collapse modes of masonry walls that are exposed to blast actions may include flexural failure, direct shear failure, and flexural–shear failure. Collapse modes are further discussed in this section and elaborated in the analysis section of this article. It is noted that these collapse modes were used for the validation of the proposed numerical model.
D’Altri et al. [11] considered a masonry wall with dimensions of 1190 mm × 795 mm with a brick size of 112 mm × 53 mm × 36 mm. The boundary conditions were taken as fixed on all four sizes of the wall. The wall was loaded with a 20 KN/m2 out-of-plane load. Their research aimed to assess the effectiveness of the micro-modeling approach and assess the out-of-plane response of the masonry walls. As defined by Lourenço [12], micro-modeling is where “masonry units and mortar joints are represented by continuum elements, where the unit-mortar interface is represented by a discontinuous constitutive description”. A quasi-static (transient dynamic) procedure was used for the numerical study. Furthermore, the brick–mortar bond failures were accounted for using brick–mortar nonlinear cohesive interfaces. The failure pattern in the wall indicated that the maximum displacement often occurs at the center of the wall.
The discrete element method was used in [13] to investigate the behavior of masonry structures under blast actions. A 2400 mm × 2400 mm wall, fixed on all sides, was simulated, and typical modes of failure, including out-of-plane failure, were observed. Furthermore, the study depicted the complete failure of the wall under a load of 810 kg TNT explosive weight at a standoff distance of 37 m. According to Masi et al. [13], the geometry of the blocks and the interfaces may be directly modeled using the discrete element method. Their study was conducted using 3DEC software and the empirical model CONWEP to simulate the blast action. They used a soft-contact technique to simulate joint interactions between adjacent blocks. It is worth mentioning that the magnitude of the wall failure is dependent on various factors such as standoff distance, wall dimensions/properties, and boundary conditions.
Hao [5] conducted a numerical analysis of a 2880 mm × 2820 mm masonry wall subject to blast load corresponding to a TNT explosive weight W = 2000 kg using AUTODYN software. In that study, the four sides of the wall were modeled as fixed, with a mortar layer between the fixed boundary and the masonry units of the wall, which, in turn, was assigned homogenized material properties. It was shown that for higher explosive weight and shorter standoff distances, the wall would collapse, and the center portion of the wall failed out-of-plane as one brick flew out as a single piece. The wall was also observed to be damaged near the boundary.
Shamim et al. [14] conducted a numerical study investigating the effect of a blast on a 3000 mm × 3000 mm × 230 mm masonry wall, which had a reinforced concrete frame of 230 mm × 235 mm cross-section dimensions. In their macro-approach, masonry units, mortar joints, and the brick–mortar interface were modeled as a single material. They investigated the effect of 100 kg TNT explosive weight over 20 m, 30 m, and 40 m distances from the wall. Furthermore, their study considered a wall without an opening as well as a wall with a window opening at its center. The boundary conditions were defined such that the top of the wall was restrained in the direction parallel to the blast, simulating the restrain obtained from a slab due to its high in-plane stiffness. The results for the wall without the window showed that the peak values of displacements are found at mid-span. The peak displacement values were equal to 267.8 mm, 95.1 mm, and 59.9 mm for the three mentioned standoff distances between the blast source and the wall, respectively. For the wall with the window, the values of peak displacement at the top of the opening when out-of-plane failure arose were equal to 353.6 mm, 121.9 mm, and 73.2 mm, respectively. Overall, they observed that peak values on the wall with the window were higher than those of the wall without the window; however, the standoff distances were not the same when the opening was considered.
In a similar investigation presented in [15], it was shown that a wall subjected to blast actions developed the highest displacement in the midsection of the masonry infill panel, while the reinforced concrete frame remained undamaged. It was shown that when the blasting source was close to the wall, the masonry panel collapsed completely, depicting displacements greater than the thickness of the wall (>230 mm). Their study also looked at the effect of changing blast load sizes, considering a TNT equivalent weight of charge equal to W1 = 25 kg, W2 = 50 kg, W3 = 75 kg, and W4 = 100 kg for a constant standoff distance of 20 m. It was observed that peak displacement increases with increasing weight of charge (at constant standoff distance of 20 m) and decreases with increasing distance.
In [16], a numerical study was conducted on a masonry wall with dimensions of 1700 mm × 1550 mm × 100 mm. The model was constructed with 23 courses of solid clay bricks and analyzed using a simplified micro-modeling approach within finite element analysis. The simulation was implemented in steps, involving vertical displacements and cyclic out-of-plane actions. The failure mode was due to the formation of diagonal cracks caused by in-plane loading. As derived from the mentioned literature, the type of failure modes of masonry walls under in-plane and blasting, out-of-plane loading, are influenced by various characteristics—such as the load application, geometry, boundary conditions, and the quality of materials.
Some recent efforts aim at investigating the response of different types of reinforced masonry walls under blast actions. In [17], a masonry wall connected with two transverse walls, one at each end, was numerically tested using the micro-modeling technique within non-linear finite element analysis. The work proposed numerical models to reinforce the wall using CFRP wrapping and a steel angle-strip system. In [18], the behavior of unreinforced masonry walls with CFRP wrapping and mild welded steel wire mesh, under blast with low standoff distance, was investigated using non-linear finite element analysis. In [19], a fragility analysis of masonry walls was proposed, illustrating the vulnerability of the structures against blast load, focusing on different types of unreinforced masonry walls and reinforced walls, using finite element analysis. In [20], for masonry walls made of autoclaved aerated concrete and polymer-reinforced concrete that are subjected to heavy TNT explosive loads, both experimental and numerical testing were provided. In the numerical models, non-linear finite element analysis was used with cohesive zone models to depict damage to the wall.
Based on this short review of recent results, it seems that there is still space for more research investigating the collapse modes of masonry walls under blast actions. In particular, one of the goals of this article, which also highlights its innovative points, is to provide further insight into the way in-plane failure modes, such as diagonal cracking and out-of-plane damage, may appear in masonry walls subjected to blast actions. From another point of view, this article proposes a modeling technique using non-linear constitutive descriptions, incorporating opening-sliding failure modes adopting contact mechanics, as well as compressive/tensile damage, using continuum damage laws, all within finite element analysis. The proposed models can be implemented in commercial software.
Within the given framework, a numerical investigation of the mechanical response of masonry walls under blast actions, with and without openings, is presented. Non-linear finite element models are proposed to simulate all the joints between masonry units by introducing unilateral contact–friction interfaces. For the simulation of the blast action, an empirical model is used, and explicit dynamic analysis is adopted implementing this loading type. Various loading cases are tested, resulting in different failure modes.
In Section 2 of this article, failure modes of masonry walls are provided and modeling approaches that can be used to capture these modes are briefly discussed. In Section 3, all the details of the numerical model that is proposed in this article are presented. Among others, the details of the blast load simulation, the material constitutive description, and the geometry of the walls are given in this section. In Section 4, a validation of the proposed model is conducted using a comparison of some results with published output. In Section 5, results and discussions derived from the suggested approach are provided, and in Section 6, the conclusions of this investigation are presented.

2. Failure Modes and Modeling Approaches of Masonry Walls

In this section, a preliminary discussion of failure modes for masonry walls that occur under various loading scenarios is provided. Both in-plane and out-of-plane damage patterns are recognized. In the next sections, it will be shown that some of these modes arise also under blast actions, depending on the load combination.
In addition, general concepts elaborating modeling approaches, which are used to capture the mentioned failure modes, are discussed. Within this framework, the proposed model will be identified.

2.1. In-Plane Response of Masonry Walls

Three types of failure modes of masonry walls under static loading are discussed below, and these are sliding shear, flexural failure, and diagonal shear. These failure modes are illustrated in Figure 1.
According to [21], the in-plane failure of a wall is generally shear failure, as can be seen by the diagonal cracking, and this is often ruled by the tensile resistance or capacity of the masonry unit or mortar joints. Additionally, a wall’s failure can be observed as the crushing of units under compression. The capacity for large displacement and average energy dissipation is related to unit crushing [22], contrary to failure involving sliding shear, which is more ductile as a higher amount of energy is dissipated. This energy dissipation is more common under seismic/blast loading actions. The above modes of failure have been proven by many researchers to be the common failure modes when horizontal displacement and vertical pressure loading are applied to walls.

2.2. Out-of-Plane Response of Masonry Walls

Subject to blast loadings, the failure mode of masonry walls is often out-of-plane flexural failure. This may be accompanied by a flexural cracking pattern, which consists of horizontal cracks arising at halfway of the wall and stepped diagonal cracks toward all corners of the wall, as can be seen in Figure 2, where a typical out-of-plane response of a masonry wall under blast loading is shown. It is noted that these descriptions of the failure modes will be used later in this article to verify the results that are obtained from the proposed numerical scheme.

2.3. General Modeling Approaches for Masonry Structures

The mechanical behavior of masonry buildings has been described using two broad numerical approaches: macro-modeling and micro-modeling [12]. In the macro-modeling method, masonry is analyzed as a uniform material that obtains its average (effective) material properties by a homogenization scheme. Thus, in the macro-modeling technique, masonry units (concrete blocks, stone units) and the mortar joints are modeled as solitary materials using homogenization concepts. According to [23], when using the macro-modeling approach, the detailed failure mechanisms may generally not be reproduced well.
According to micro-modeling, masonry consists of joints connecting individual units, and using appropriate constitutive laws, simulation of such walls is conducted. Due to the different compression or tensile strength of brick vs. mortar, it is worth noting that mortar joints become the weakest link in masonry walls. According to [12], the unit–mortar interface controls the nonlinear response of the joints, and this is one of the most pertinent features of masonry wall behavior. Different modeling techniques used to simulate the response of masonry structures are depicted schematically in Figure 3.
The masonry units are modeled as continuum elements, while the mortar joints are modeled as interface elements in this article. Zero tensile resistance between the joints is introduced, using unilateral contact and friction interfaces. More details about the model used in this article are provided in the following sections.

3. The Numerical Model Proposed in the Present Article

A non-linear finite element model is proposed for this study to simulate the response of masonry walls to blasts. For the evaluation of the failure response that is derived from the masonry unit interfaces, a unilateral contact and friction constitutive description is assigned to these interfaces. Thus, both in-plane and out-of-plane opening and/or sliding between the masonry units can be depicted with the proposed model. Since all the contact conditions between the blocks in the wall are simulated using principles taken from contact mechanics, it can be stated that the micro-modeling approach is used.
The unilateral contact law, provided in Equations (1)–(3) for a single degree of freedom system, is assigned in the interfaces between masonry blocks. Equation (1) is the non-penetration relation, Equation (2) states that only compressive stresses (tn) can be developed in the interfaces, and Equation (3) is the complementarity relation, stating that either contact takes place (ug = 0, where u is a single degree of freedom and g is an initial gap) or separation in the interface occurs (tn = 0).
h = u g 0 h     0
t n   0
t n   u g = 0
For the response in the tangential direction of the interfaces, a static version of Coulomb’s friction law is considered. Thus, sliding in the interfaces is initiated when the shear stress tt reaches the critical value τcr, according to Equation (4):
t t   = τ c r   = ± μ t n
where μ is the friction coefficient and tn the normal stress (contact pressure) in the interfaces.
To represent the failure response of the masonry units, a continuum concrete damage plasticity model is used. Compressive and tensile failure modes developed at the masonry blocks are then depicted. In the following sections, the details related to the implementation of the blast loading, the material properties, and the dimensions of the walls that are studied in this article are provided.

3.1. Blast Shock Wave Modeling

An explosion loading wave is defined by three parameters, namely, the shape of a wave, the maximum pressure (Pro), and the positive wave duration (to), which is the time that pressure reaches zero [24]. Various research efforts have shown that depending on the source of the explosion, the generated waves are divided into shock and pressure waves. In a shock wave, the pressure of gasses from the explosion or blasting is developed by emission from the source of the explosion [24,25]. The pressure increases to the maximum value Pro and decreases to the environmental pressure, as shown in Figure 4. Mining activities involving blasting generate blast pressures on neighboring structures. The pressure distribution from a blasting source at a particular distance is considered nearly consistent over a normal reflecting surface. According to [26], a close-in explosion produces a pressure distribution that changes significantly in magnitude over the reflecting surface. This creates more complexity due to the non-uniform of pressure.
To determine the magnitude of peak overpressure, two major parameters are used: the charge weight and the distance between the blast source and the structure. By observing the pressure–time diagram depicted in Figure 4, two main phases can be identified. The positive part of the diagram is called the positive phase and has a duration to, as shown in Figure 4, while the negative part is called the negative phase and has a duration to−, also shown in Figure 4. According to [13], when a primary shock strikes a target, the reflected overpressure Pr instigates. The negative phase exists for a longer duration with lower intensity pressure than the positive phase. As the standoff distance increases, it can be noted that the duration/period of the positive blast wave phase increases, and that results in lower amplitude and a significantly longer-duration shock pulse.
Using the Friedlander equation, the time evolution of the positive phase of the reflected pressure is analyzed (Friedlander, 1946):
P r t = P r o 1 t * t o H t * 1 H t * t o   H t * exp d t * t o
where H[t*] represents the step function, d is the exponential decay coefficient, and t* = t − tA, where tA is depicted in Figure 4. According to Rigby et al. [28], the impulse iro or ir associated with the positive phase, which symbolizes the area under the pressure curve, can be formulated as:
i r o = t A t A + t 0 P r d t = e d   + d 1   P r o   t o d 2
One of the most effective means of representing a blast impact is the use of the CONWEP model. According to [29], CONWEP is a model used to simulate the effects of a collection of conventional weapons, including air blast routines, breach, cratering, ground shock, and fragment and projectile penetration. The CONWEP charge property parameter is used in this study to simulate an air-based explosion using empirical data [30]. Furthermore, according to this consideration, a time history diagram of the pressure loading is built. In order to utilize this empirical model, one would need to define the equivalent TNT (trinitrotoluene) mass of the explosive as well as the source point (i.e., where the explosive is located). The initial process in calculating the explosive wave from a blast source other than TNT is to convert the charge mass to TNT equivalent mass [31].
Therefore, the CONWEP charge property is used in this study within commercial finite element software to simulate an air-based explosion by developing a time history pressure loading, similar to the one shown in Figure 4. The data, which were entered to define the blast charge properties, include the equivalent mass of TNT, a multiplication factor to convert from that mass unit into kilograms, and multiplication factors to convert from the standoff distance, time, or pressure to meter, second, or pressure in Pascals, respectively.

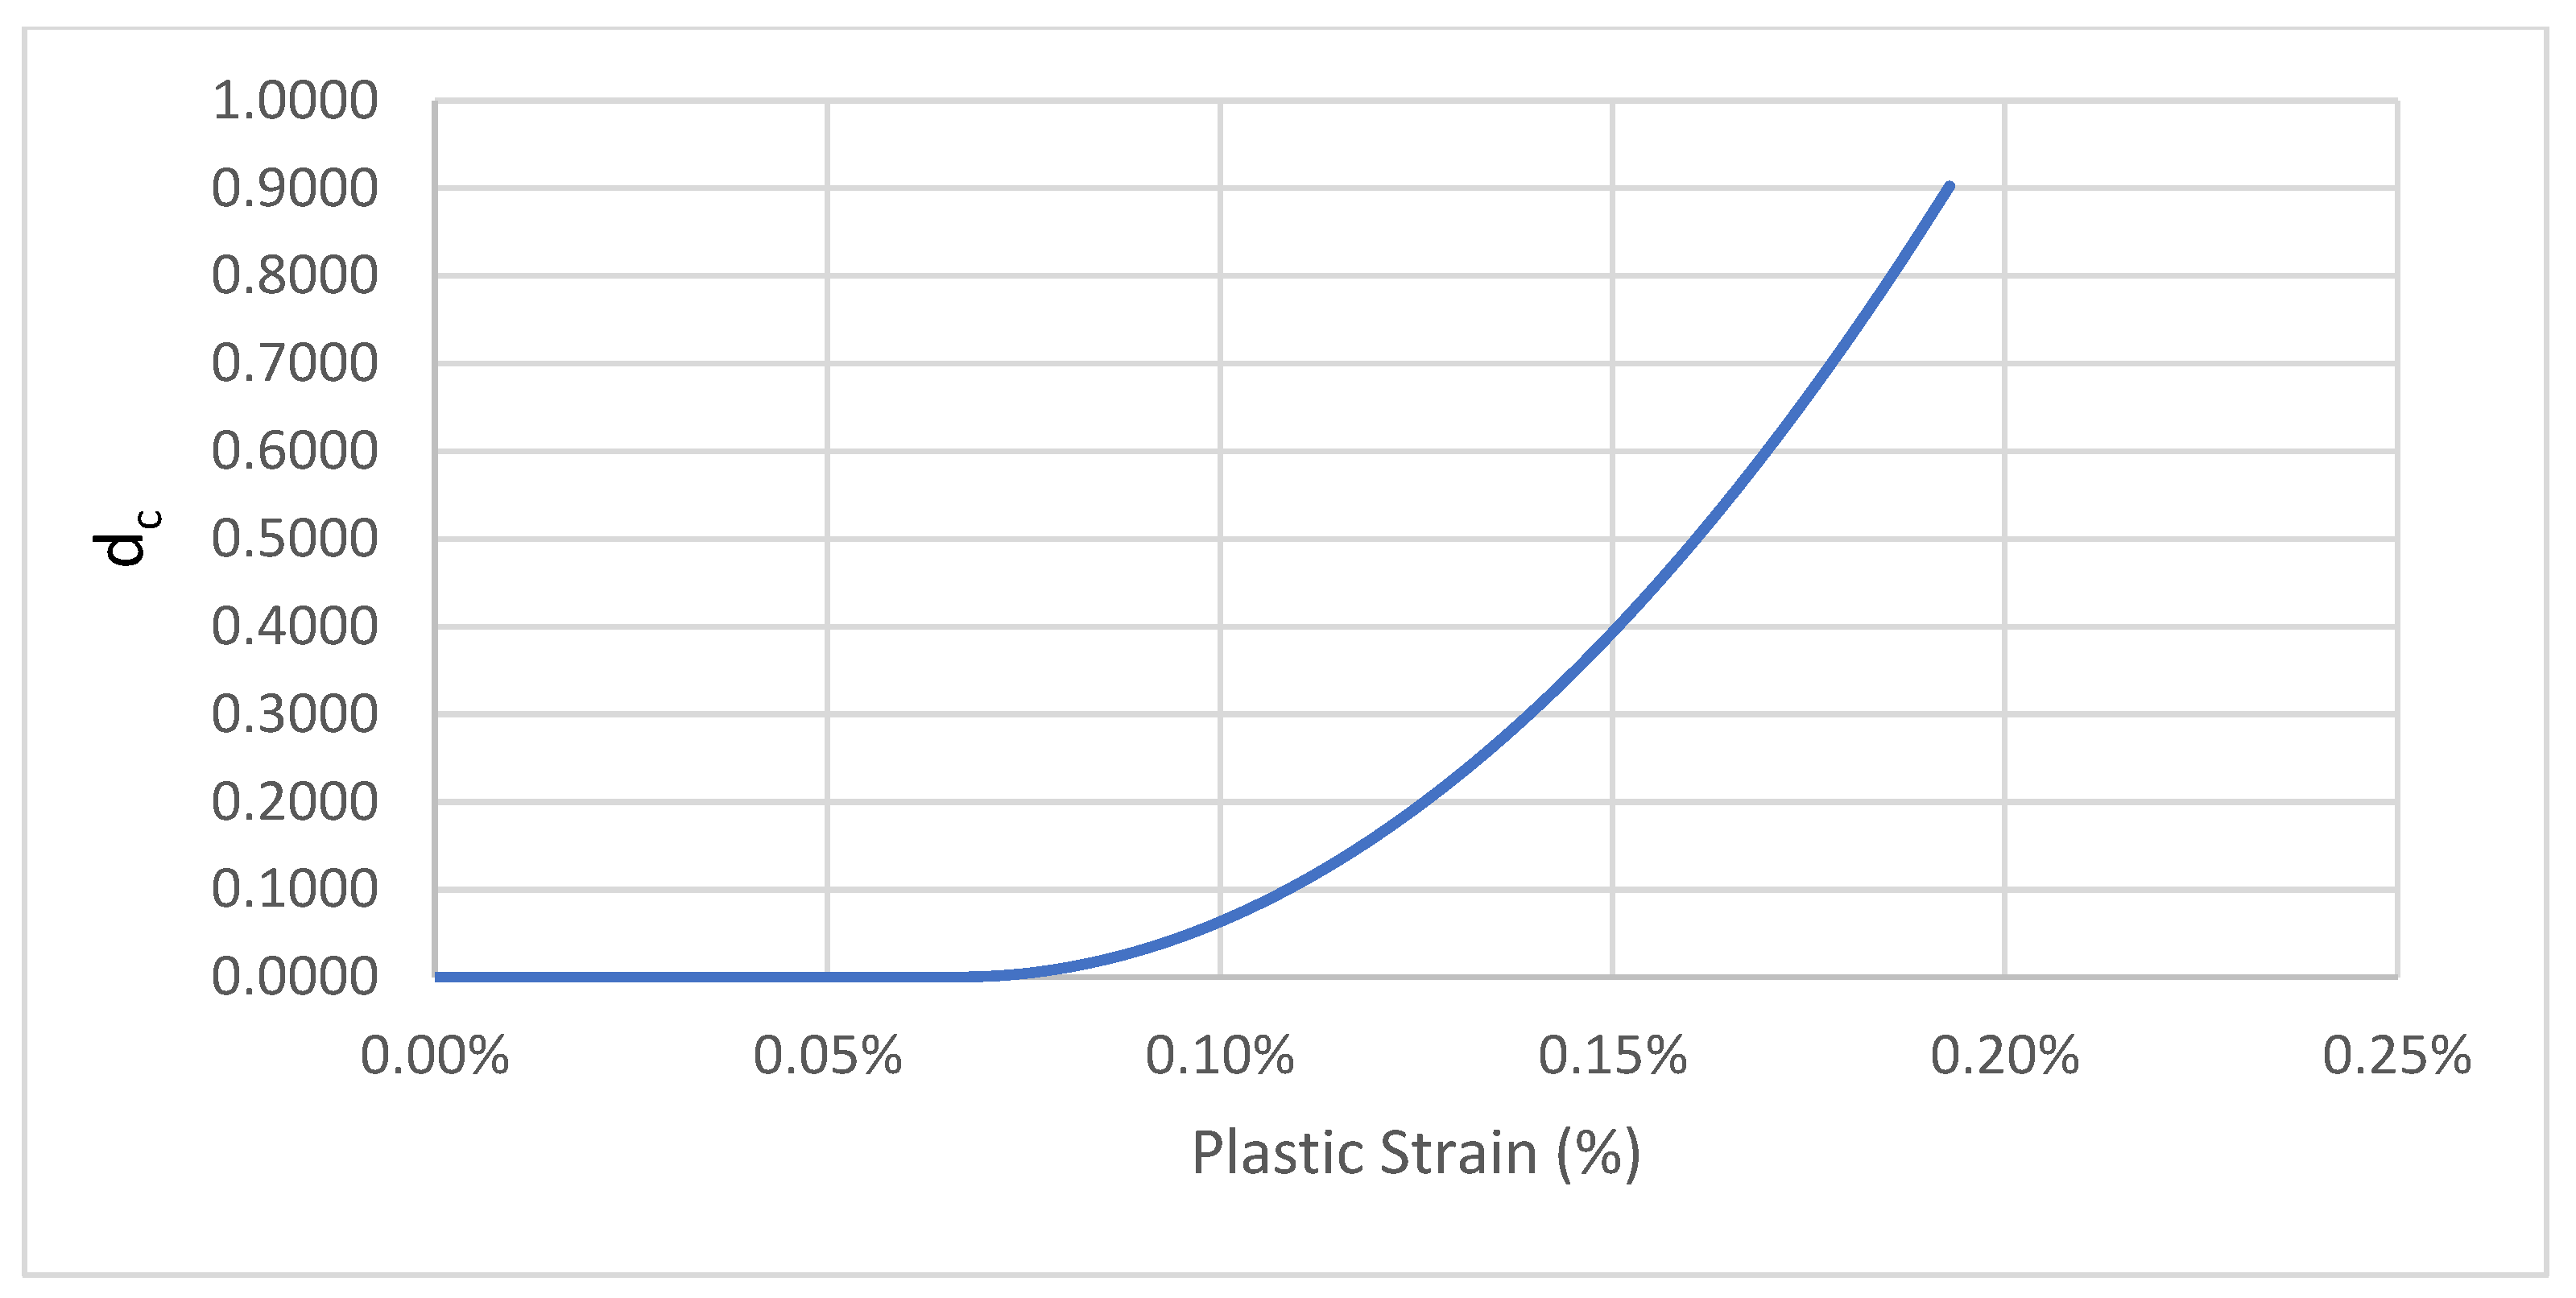
3.2. Continuum Damage Law for the Masonry Units

A concrete damaged plasticity law is used to represent damage on masonry units. Rate independence is claimed for this law, which is based on incremental plasticity theory. According to Lubliner et al. [32], Lee and Fenves [33], Tapkın et al. [34], and Daniel and Dubey [35], this constitutive description is appropriate for the analysis of quasi-brittle materials such as concrete and masonry. It relies on the concept of isotropic damaged elasticity for the representation of the irretrievable damage or failure that occurs during the cracking process for materials under fairly low pressure. The concrete damage plasticity law uses a non-associated potential plastic flow, which is in turn the implementation of the Drucker–Prager hyperbolic function for flow potential [36].
The common failure mechanisms that can be illustrated with this law are, namely, tensile cracking and compressive crushing. When unloading takes place, the elastic stiffness of the material is deemed damaged. This damage is implemented by introducing two damage variables as functions of the plastic strain, one for tension and the other for compression. A zero value of the damage variable indicates undamaged material, while a value equal to one indicates a total loss of strength. The corresponding uniaxial stress–strain relations, representing tension and compression, are provided below:
σ t = ( 1 d t   ) E 0   ( ε t   ε p l t )
σ c = ( 1 d c   ) E 0   ( ε c ε p l c )
In the above equations, E0 is the preliminary elastic stiffness of the material and dt and dc are the tensile and compressive damage variables, respectively.
The compressive and tensile stress–strain curves used in this work to define the compressive and tensile failure response of the masonry units on the numerical models, as well as the corresponding damage variables diagrams, are provided in the figures below. The uniaxial stress–strain behavior of concrete is modeled utilizing a Hognestad-type parabola [37], as per Figure 5 below. Figure 6, Figure 7 and Figure 8 provide the compressive damage parameter as well as the tensile stress–strain law and the tensile damage parameter used for this model [37].
The uniaxial tensile damage and uniaxial compressive damage parameters were developed using the post-failure stress as a function of cracking strain. The cracking strain is equal to the total strain minus the elastic strain of the undamaged material [32].
Some additional material properties used within the concrete damage plasticity law are provided in Table 1. The material properties for each masonry unit are provided in Table 2.

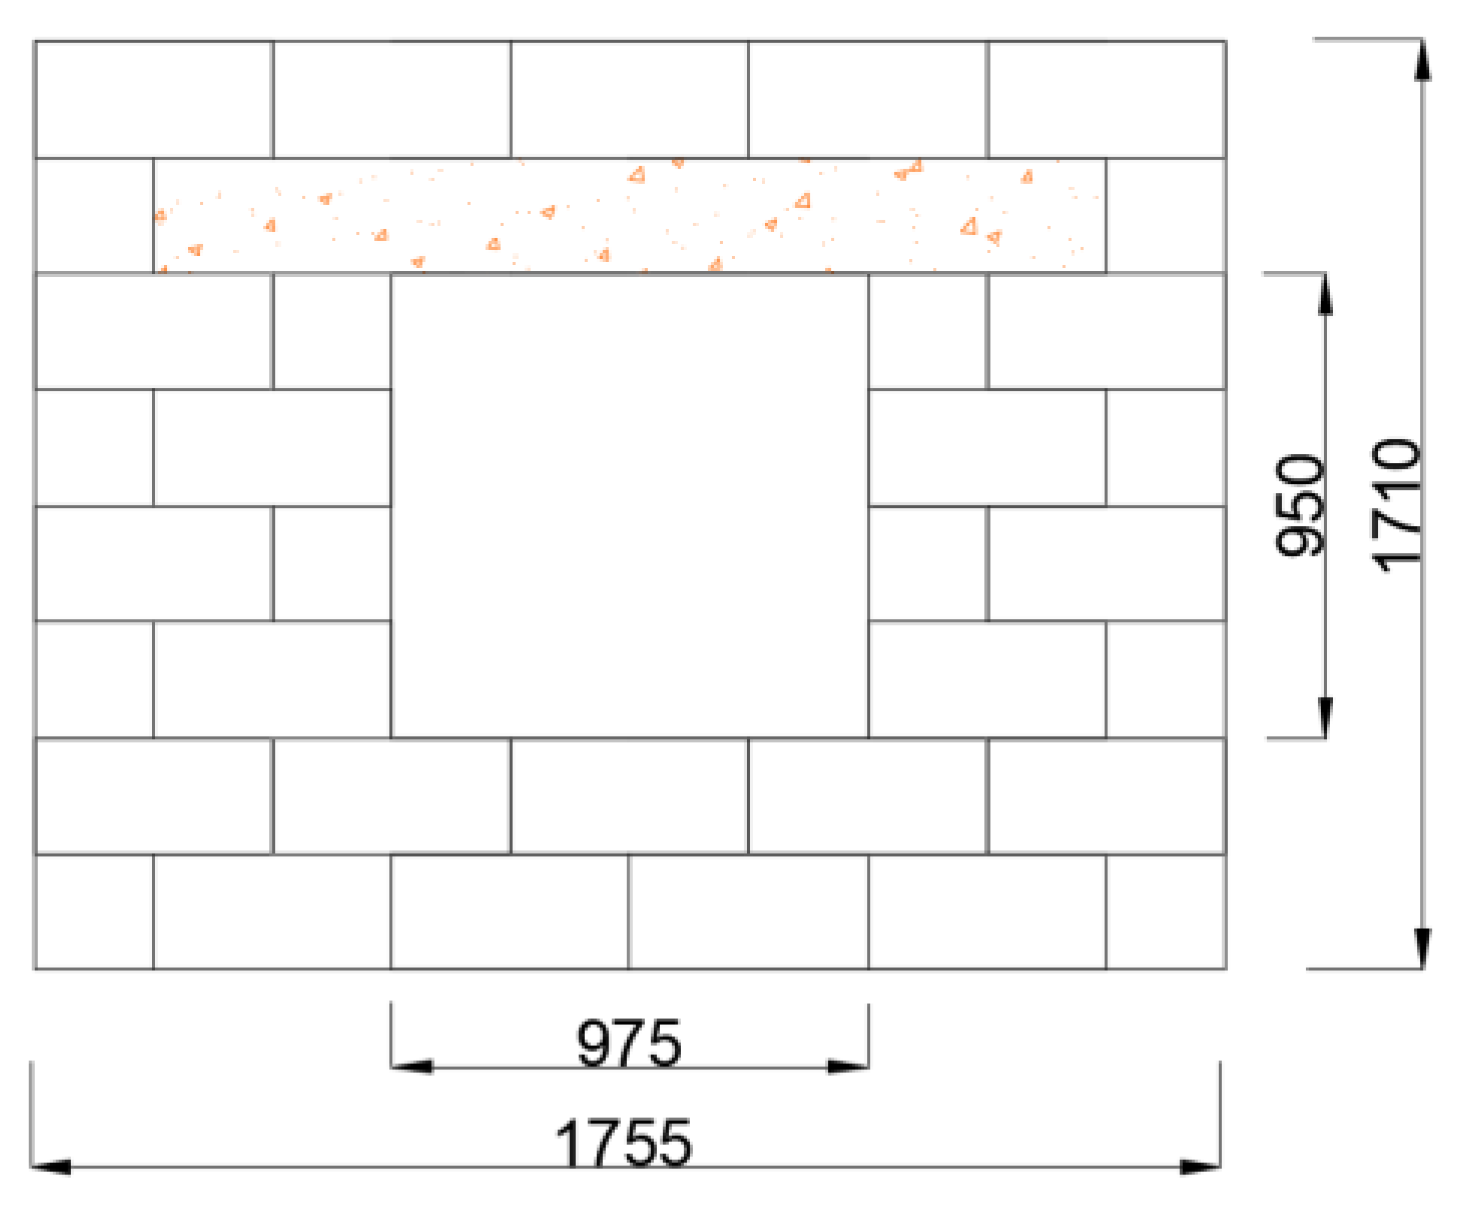
3.3. The Geometry of the Masonry Walls

The dimensions of each masonry unit considered in this study are equal to 430 mm × 140 mm × 190 mm. The size of each unit is as per the Concrete Manufactures Association [39]. Low-cost housing in South Africa often uses concrete masonry blocks and clay bricks. This paper focuses on the use of concrete blocks, and the following limitations are noted:
-
A single-leaf wall is considered, and the wall is unreinforced.
-
Category 1 buildings [40].
Two geometries are used in this study for the walls, as shown in Figure 9 and Figure 10. The first is a solid wall and the second represents a wall with an opening.

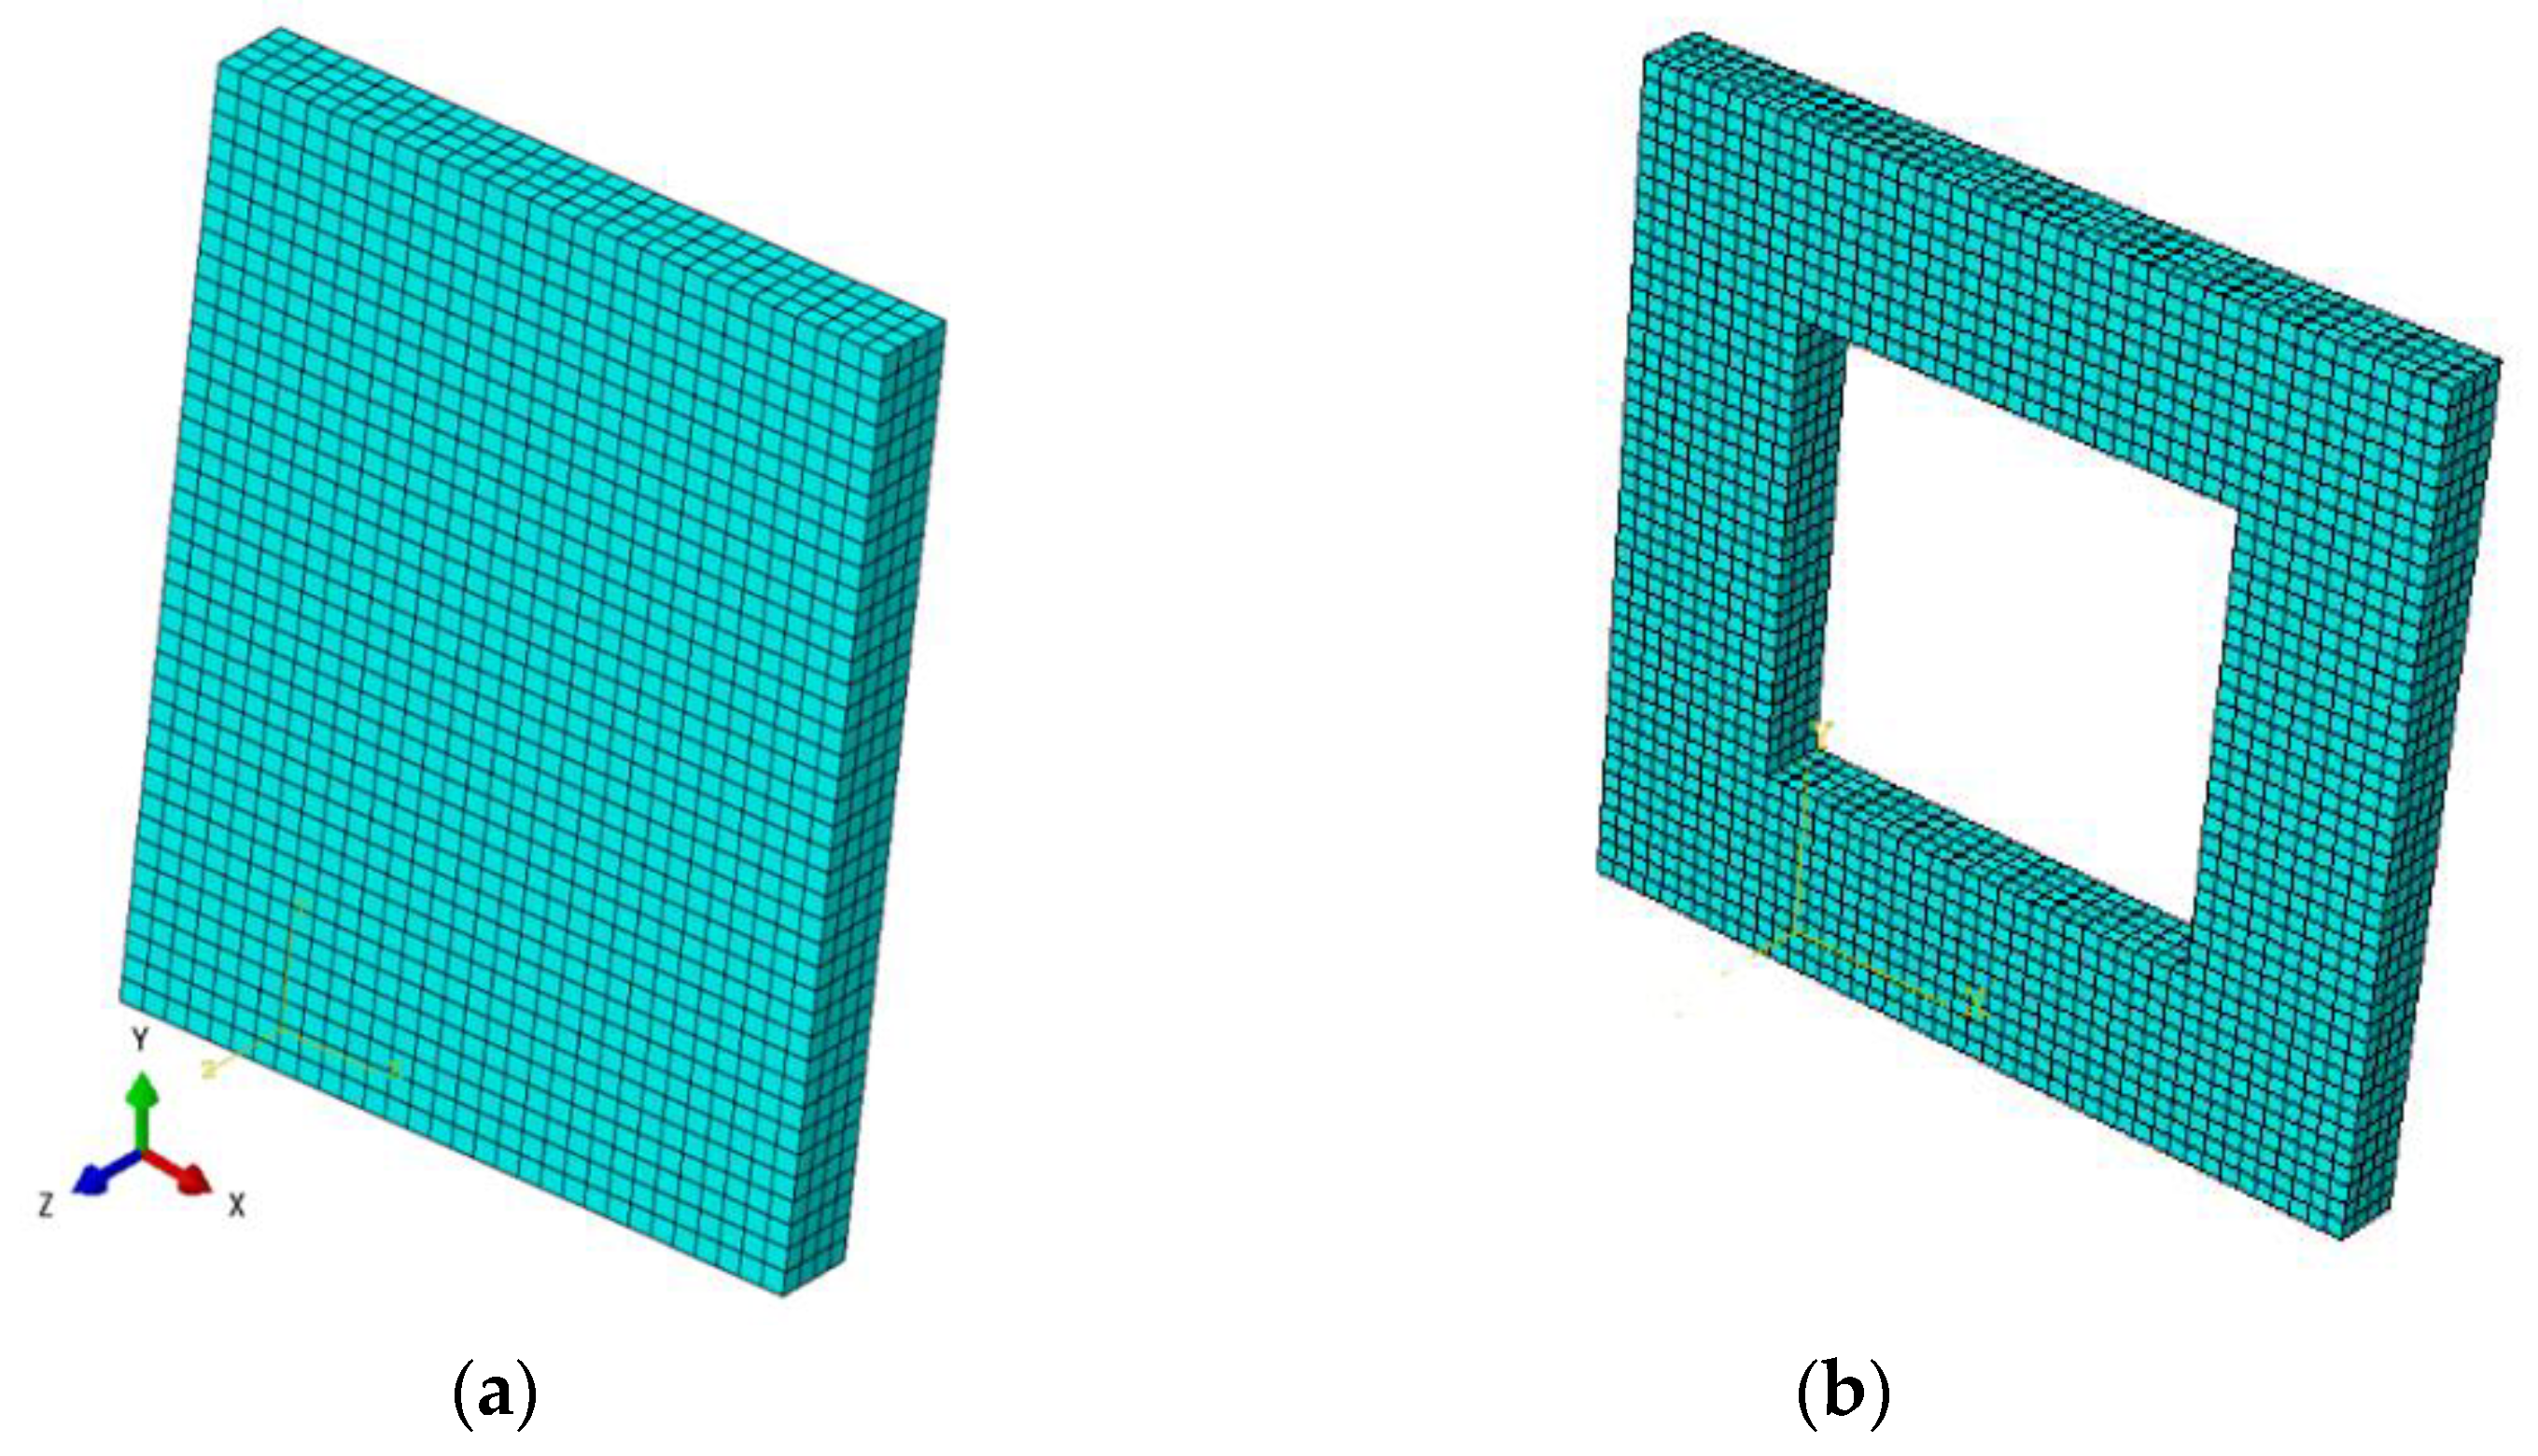
3.4. Details of the Finite Element Model

Figure 11 shows the mesh that is adopted in this study for the models without and with an opening. Three-dimensional, eight-node linear brick elements are used, with the element side equal to 40 mm for both walls. A total number of 4800 elements for the model without the opening and 5600 elements for the model with the opening are used, as shown in Figure 11.
All four sides on the perimeter of each of the two walls are considered as fixed in three translational degrees of freedom, according to the coordinate system shown in Figure 11. It is noted that the restraining of the top side of the walls in the Z-direction is attributed to the assumption that an upper slab or roof will provide restraint in that direction.
Concerning the loading of the models, two load steps are used. In an initial, pre-existing step, a vertical pressure of 0.25 MPa is applied to the top side of the structure. In the first load step, a horizontal shear (in-plane) displacement of 10 mm is applied to the top side of the walls. Alternatively, the wall with no horizontal in-plane displacement is also considered. In the second load step, the blast loading is applied.
The simulation is conducted using explicit dynamic analysis. This type of analysis is appropriate since it is able to capture the very short duration of the blast action. It is noted that the explicit dynamic analysis was originally developed to simulate high-speed dynamic events that would otherwise require significant computational resources within implicit codes. For the implementation of this analysis, an automatic time incrementation is used.
For the application of the contact–friction conditions between the masonry blocks, the method of Lagrange multipliers is used. A friction coefficient equal to 0.45 is assigned to the interfaces.
It is noted that for the implementation of the blast load, a charge weight expressed in TNT at the standoff distances of 100 m, 50 m, and 20 m is used. In addition, the effect of the blast weight, as well as the effect of changing the blast charge while keeping the distance constant and changing the standoff distance while keeping the blast charge weight constant, are also investigated. Only the front surface of the walls is loaded (incident surface). In the following sections, results obtained from various parametric investigations, emphasizing the corresponding failure mechanisms, are provided.

4. Validation of the Proposed Model

Before presenting the results from the simulations, a validation of the proposed model is conducted by comparing the output with published numerical studies. Then, the results of the investigation are elaborated, emphasizing collapse mechanisms for the used load cases.
A comparison between results derived from the proposed model and existing numerical solutions is provided. As depicted in the figures below, similar collapse mechanisms were obtained when a blast load or in-plane, vertical pressure, and shear displacement loads are applied to the wall.
  • Masi et al. [13] depicted complete failure, indicating that after a wall is damaged close to the boundary, it comes out in one piece in the middle portion. The explosive weight was 810 kg at 37 m standoff distances (Figure (a)). Out-of-plane experiments conducted by Du et al. [41] depicted complete failure in the middle of a real wall (Figure (b)).
Computation 11 00165 i001
The proposed model depicted complete failure of the middle section of the wall, under a blast load with an explosive weight of 810 kg at a standoff distance of 37 m. This is shown in Figure (c).
  • Salmanpour [21] predicted sliding failure along staircase-shaped cracks as mode of failure for a wall subjected to vertical pressure and shear displacement loading. The damage to buildings during the 2002 Molise earthquake in Italy, as reported in [42], resembles the crack pattern shown below in Figure (d).
Computation 11 00165 i002
The proposed model depicted staircase-shaped cracks when subjected to vertical pressure and shear displacement loading. This is shown in Figure (e).

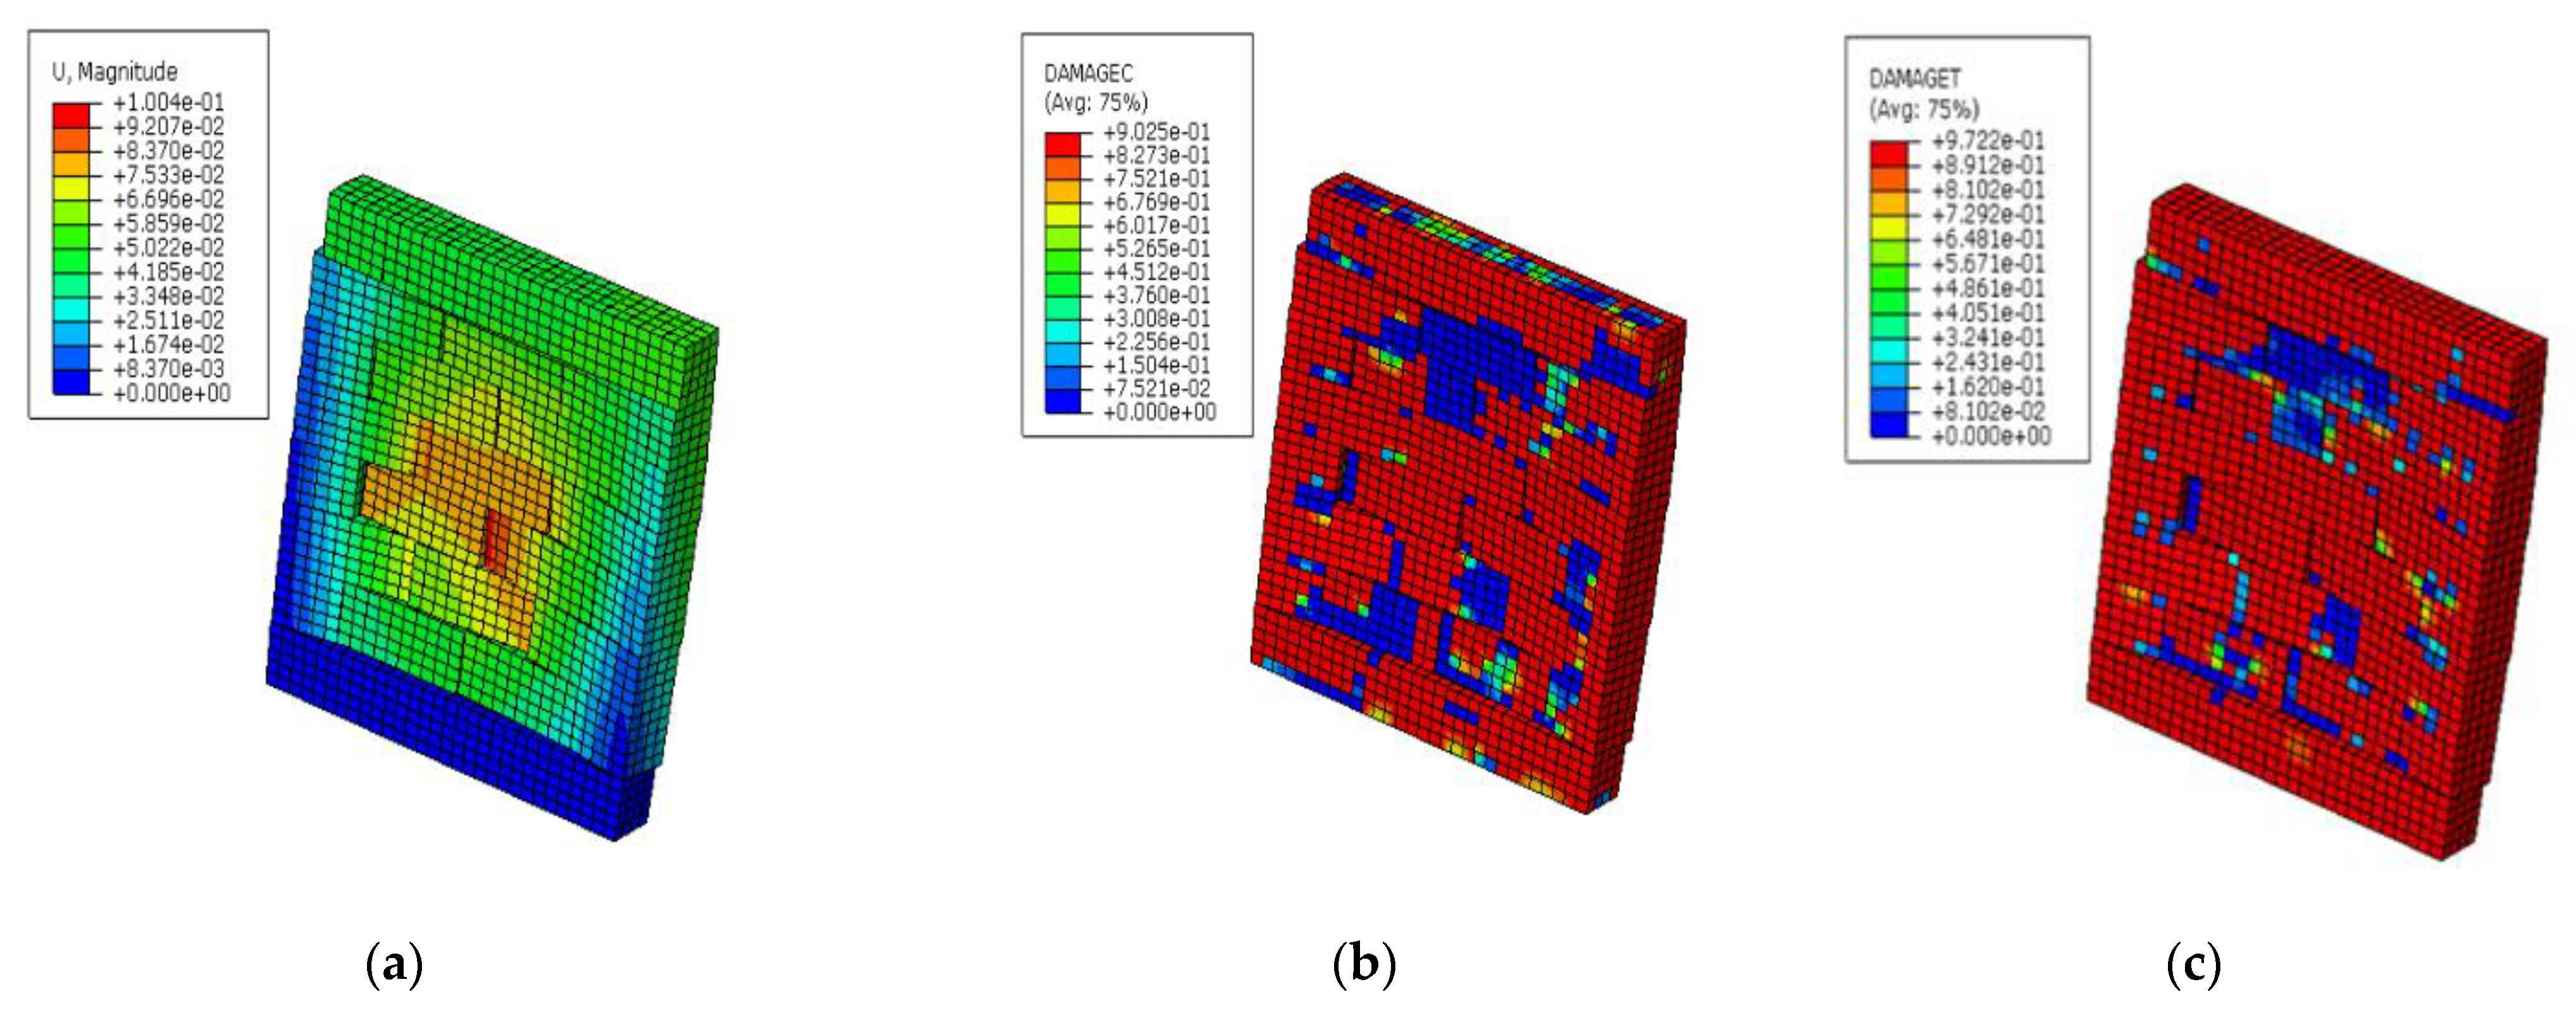
5. Results Obtained from the Proposed Numerical Scheme

In the next sections, results depicting the structural response of two masonry walls, one without an opening and one with an opening, are provided. Within this investigation, parametric studies depicting the influence of the variation in the weight of charge and the blast source–structure distance on the response of the walls, were conducted. Relevant discussions emphasize the collapse modes, which arise in the provided framework. In total, the cases listed in Table 3 are considered for the walls without and with an opening.

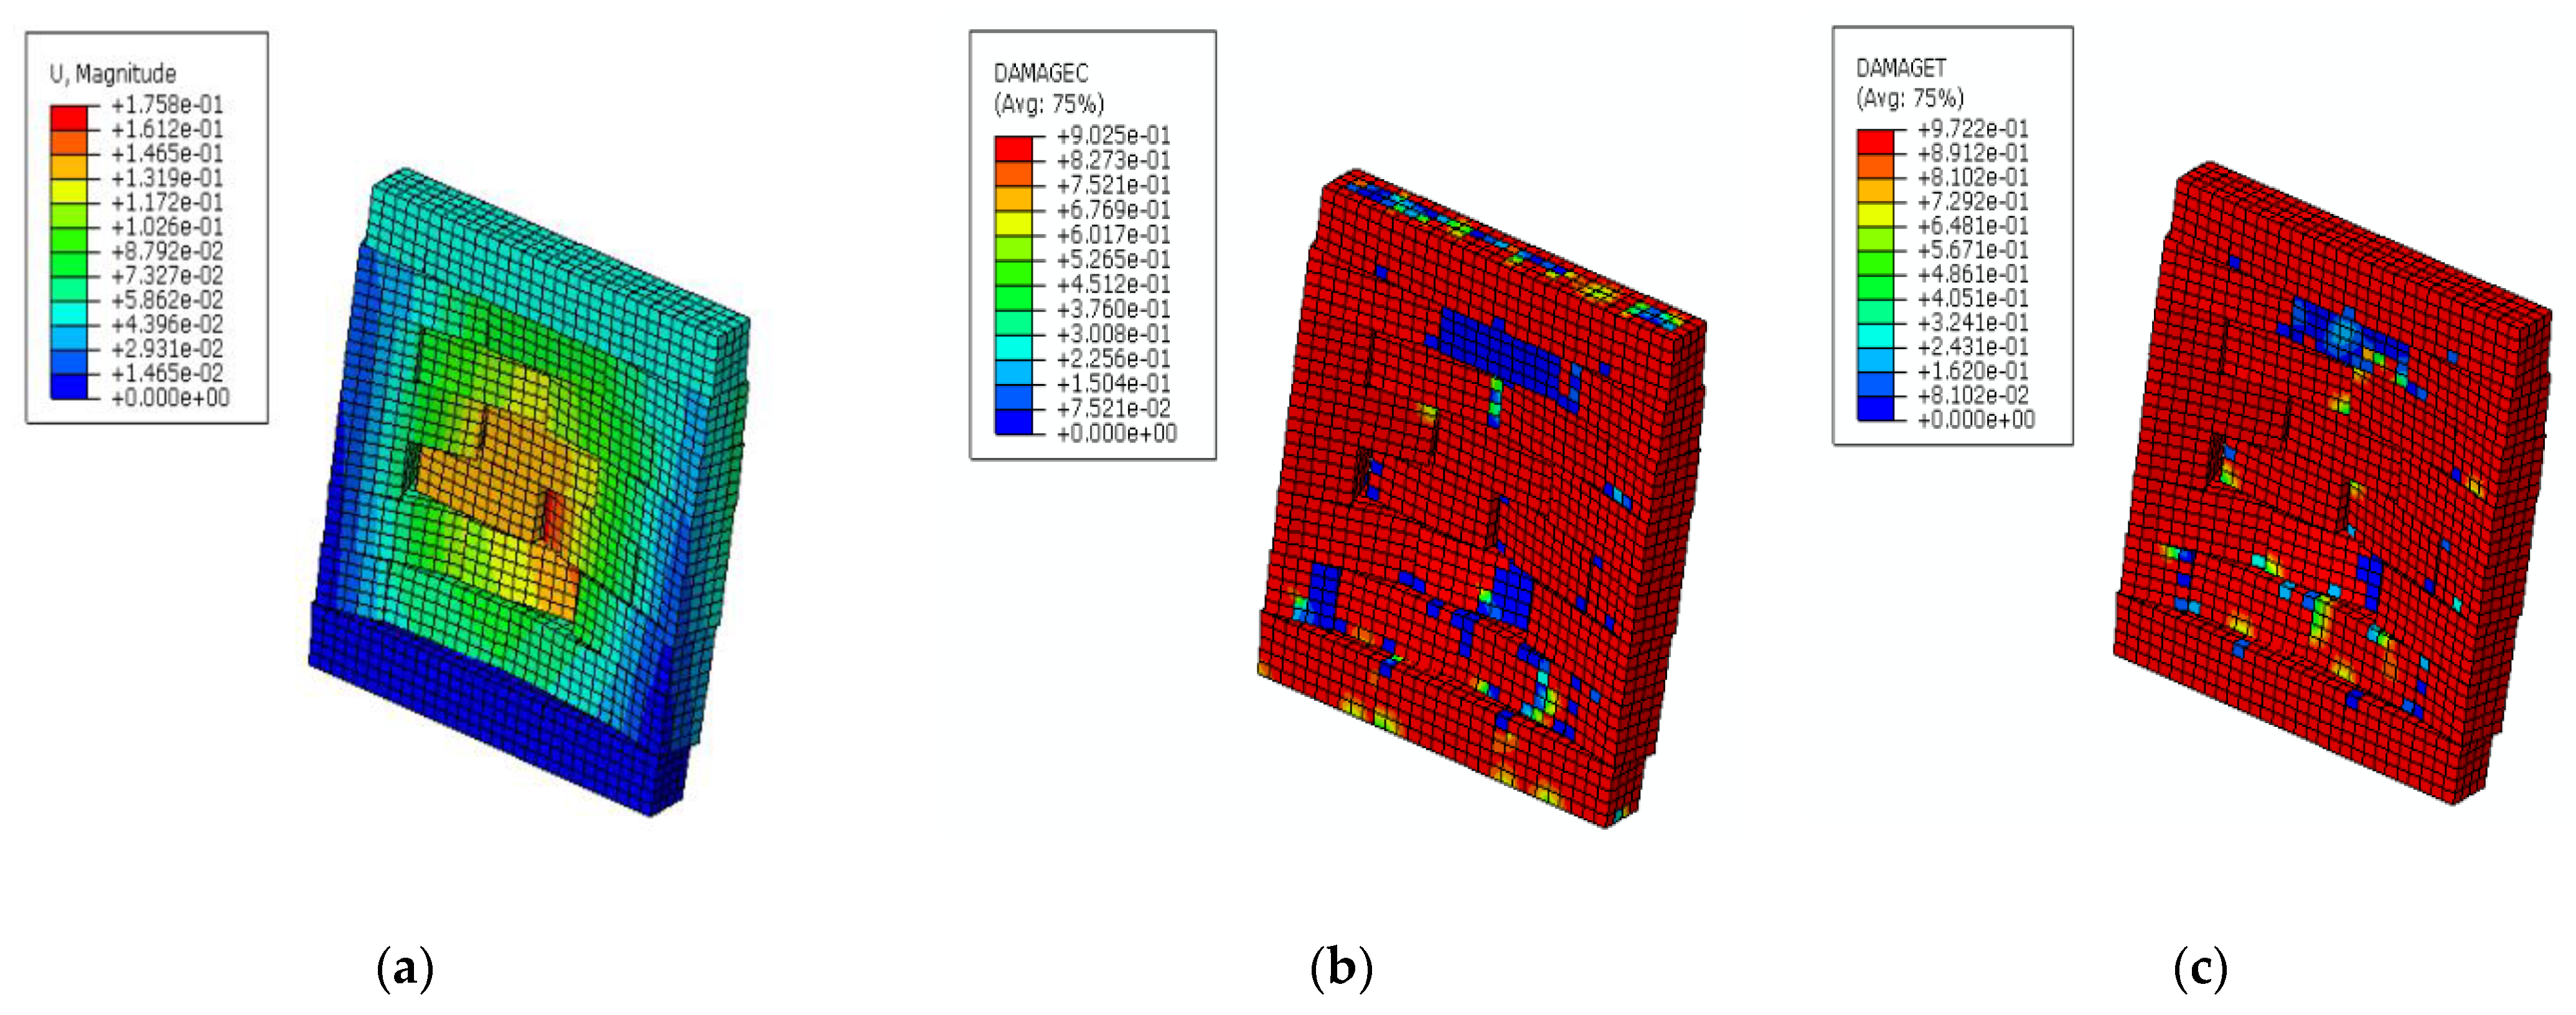
5.1. Case 1: Solid Masonry Wall Loaded with Vertical Pressure, Shear Displacement, and Blast Load

This section provides results obtained from simulations on a solid wall loaded at its top boundary surface with a vertical downward pressure and a horizontal shear displacement load. A blasting action is also applied to the wall.
Figure 12 depicts the displacement and the failure mechanism, which are obtained from an explosive weight of 100 kg at a standoff distance of 20 m. According to this figure, in-plane diagonal cracking in the form of opening/sliding between the blocks is accompanied by some out-of-plane flexural displacement, attributed to the blast load. It can be observed that though the wall does not collapse totally, significant displacements are developed. In addition, according to Figure 12b,c, significant compressive and tensile failure is developed on the masonry blocks. This is attributed to the out-of-plane flexural displacement of the fixed (in its perimeter) wall. As expected, tensile failure is more expanded in the wall than compressive failure.
Next, the weight of the explosive is gradually increased to 200 kg (Figure 13) and 1150 kg (Figure 14) while the standoff distance is kept constant and equal to 20 m. As observed in Figure 13a, the out-of-plane deflection becomes higher compared with Figure 12a, due to the increase in the blast weight. In addition, Figure 13b,c shows that extensive compressive and tensile failure is developed in the masonry blocks. Figure 14 shows that for the maximum quantity of explosive weight, out-of-plane deflection dominates the in-plane cracking. In addition, the wall fails completely for this maximum explosive weight when it is considered at the same distance of 20 m, as above.
Next, an investigation using an increased standoff distance of 50 m is conducted, using explosive weights of 100 kg, 200 kg, and 1150 kg, respectively. From the first case of 100 kg explosive weight, it is determined that the in-plane failure mode is dominant, as shown in Figure 15. A diagonal cracking appears, in this case, at the top part of the wall. On the contrary, for the lower distance of 20 m shown in Figure 12, both in-plane and out-of-plane flexural deflection are observed.
For the case of 200 kg explosive weight, the failure mechanism which arises is a stair-case diagonal cracking along the wall, as shown in Figure 16. This indicates that the failure mode changes compared with Figure 13, where mainly an out-of-plane response is observed for the same explosive weight and lower standoff distance (20 m). It is noted that the damage pattern depicted in Figure 16 is observed in masonry walls that are loaded with in-plane actions. Some limited out-of-plane flexural displacement also arises in this case.
For the case of the highest explosive weight of 1150 kg (standoff distance 50 m), it is determined that out-of-plane flexural deflection is the dominant response, leading to a corresponding failure mode. Moreover, as can be observed in Figure 17b,c, both tensile and compressive failure are developed in the whole mass of the wall. By comparing this with the case of the same explosive weight and lower standoff distance (20 m) shown in Figure 14, it is noticed that although both walls fail due to the out-of-plane response attributed to the blast action, the model with the lower standoff distance leads to a total out-of-plane collapse.
When an increase in the standoff distance from 50 m to 100 m is considered for the case of the maximum explosive weight of 1150 kg, the failure mode changes and diagonal in-plane cracking becomes dominant, as shown in Figure 18, contrary to the out-of-plane flexural deflection observed at a distance of 50 m (Figure 17). Some out-of-plane flexural deflection, accompanied by tensile failure at the perimeter and at the central part of the wall, is also obtained, as shown in Figure 18. Compressive failure is more limited and is mainly developed at the wall’s bottom corner.
To summarize the effect of varying standoff distances for each explosive weight, the diagrams shown in Figure 19 are used. It is observed that for bigger explosive weights and lower standoff distances, higher deflections of the wall are obtained. When the standoff distance is increased, the impact of the blast loading on the structural system is reduced since the maximum displacements are also reduced. It is noted that for the case of out-of-plane response for the maximum explosive weight and minimum distance, a large deflection is obtained, as depicted with point X in the graph shown in Figure 19a. This value is only indicative, highlighting a total collapse of the central part of the wall.
In Figure 19a,b, linear regression formulas are determined, providing approximate mathematical expressions that can be used to calculate the deflection of the walls for different explosive weight values and standoff distances. In particular, for standoff distances of 20 m, 50 m, and 100 m, the correlation coefficients are found to be equal to R2 = 0.9962, R2 = 0.9993, and R2 = 0.85, respectively, for the out-of-plane response. In terms of the in-plane response, standoff distances 20 m, 50 m, and 100 m provide correlation coefficients of 0.9906, 0.9618, and 0.9926, respectively. It is noted that an R2 close to 1 indicates that the regression prediction is of satisfactory accuracy. Equations on the graphs were tested by inserting a random independent variable “x” (explosive weight) to estimate the displacement “y” (deflection of the wall).

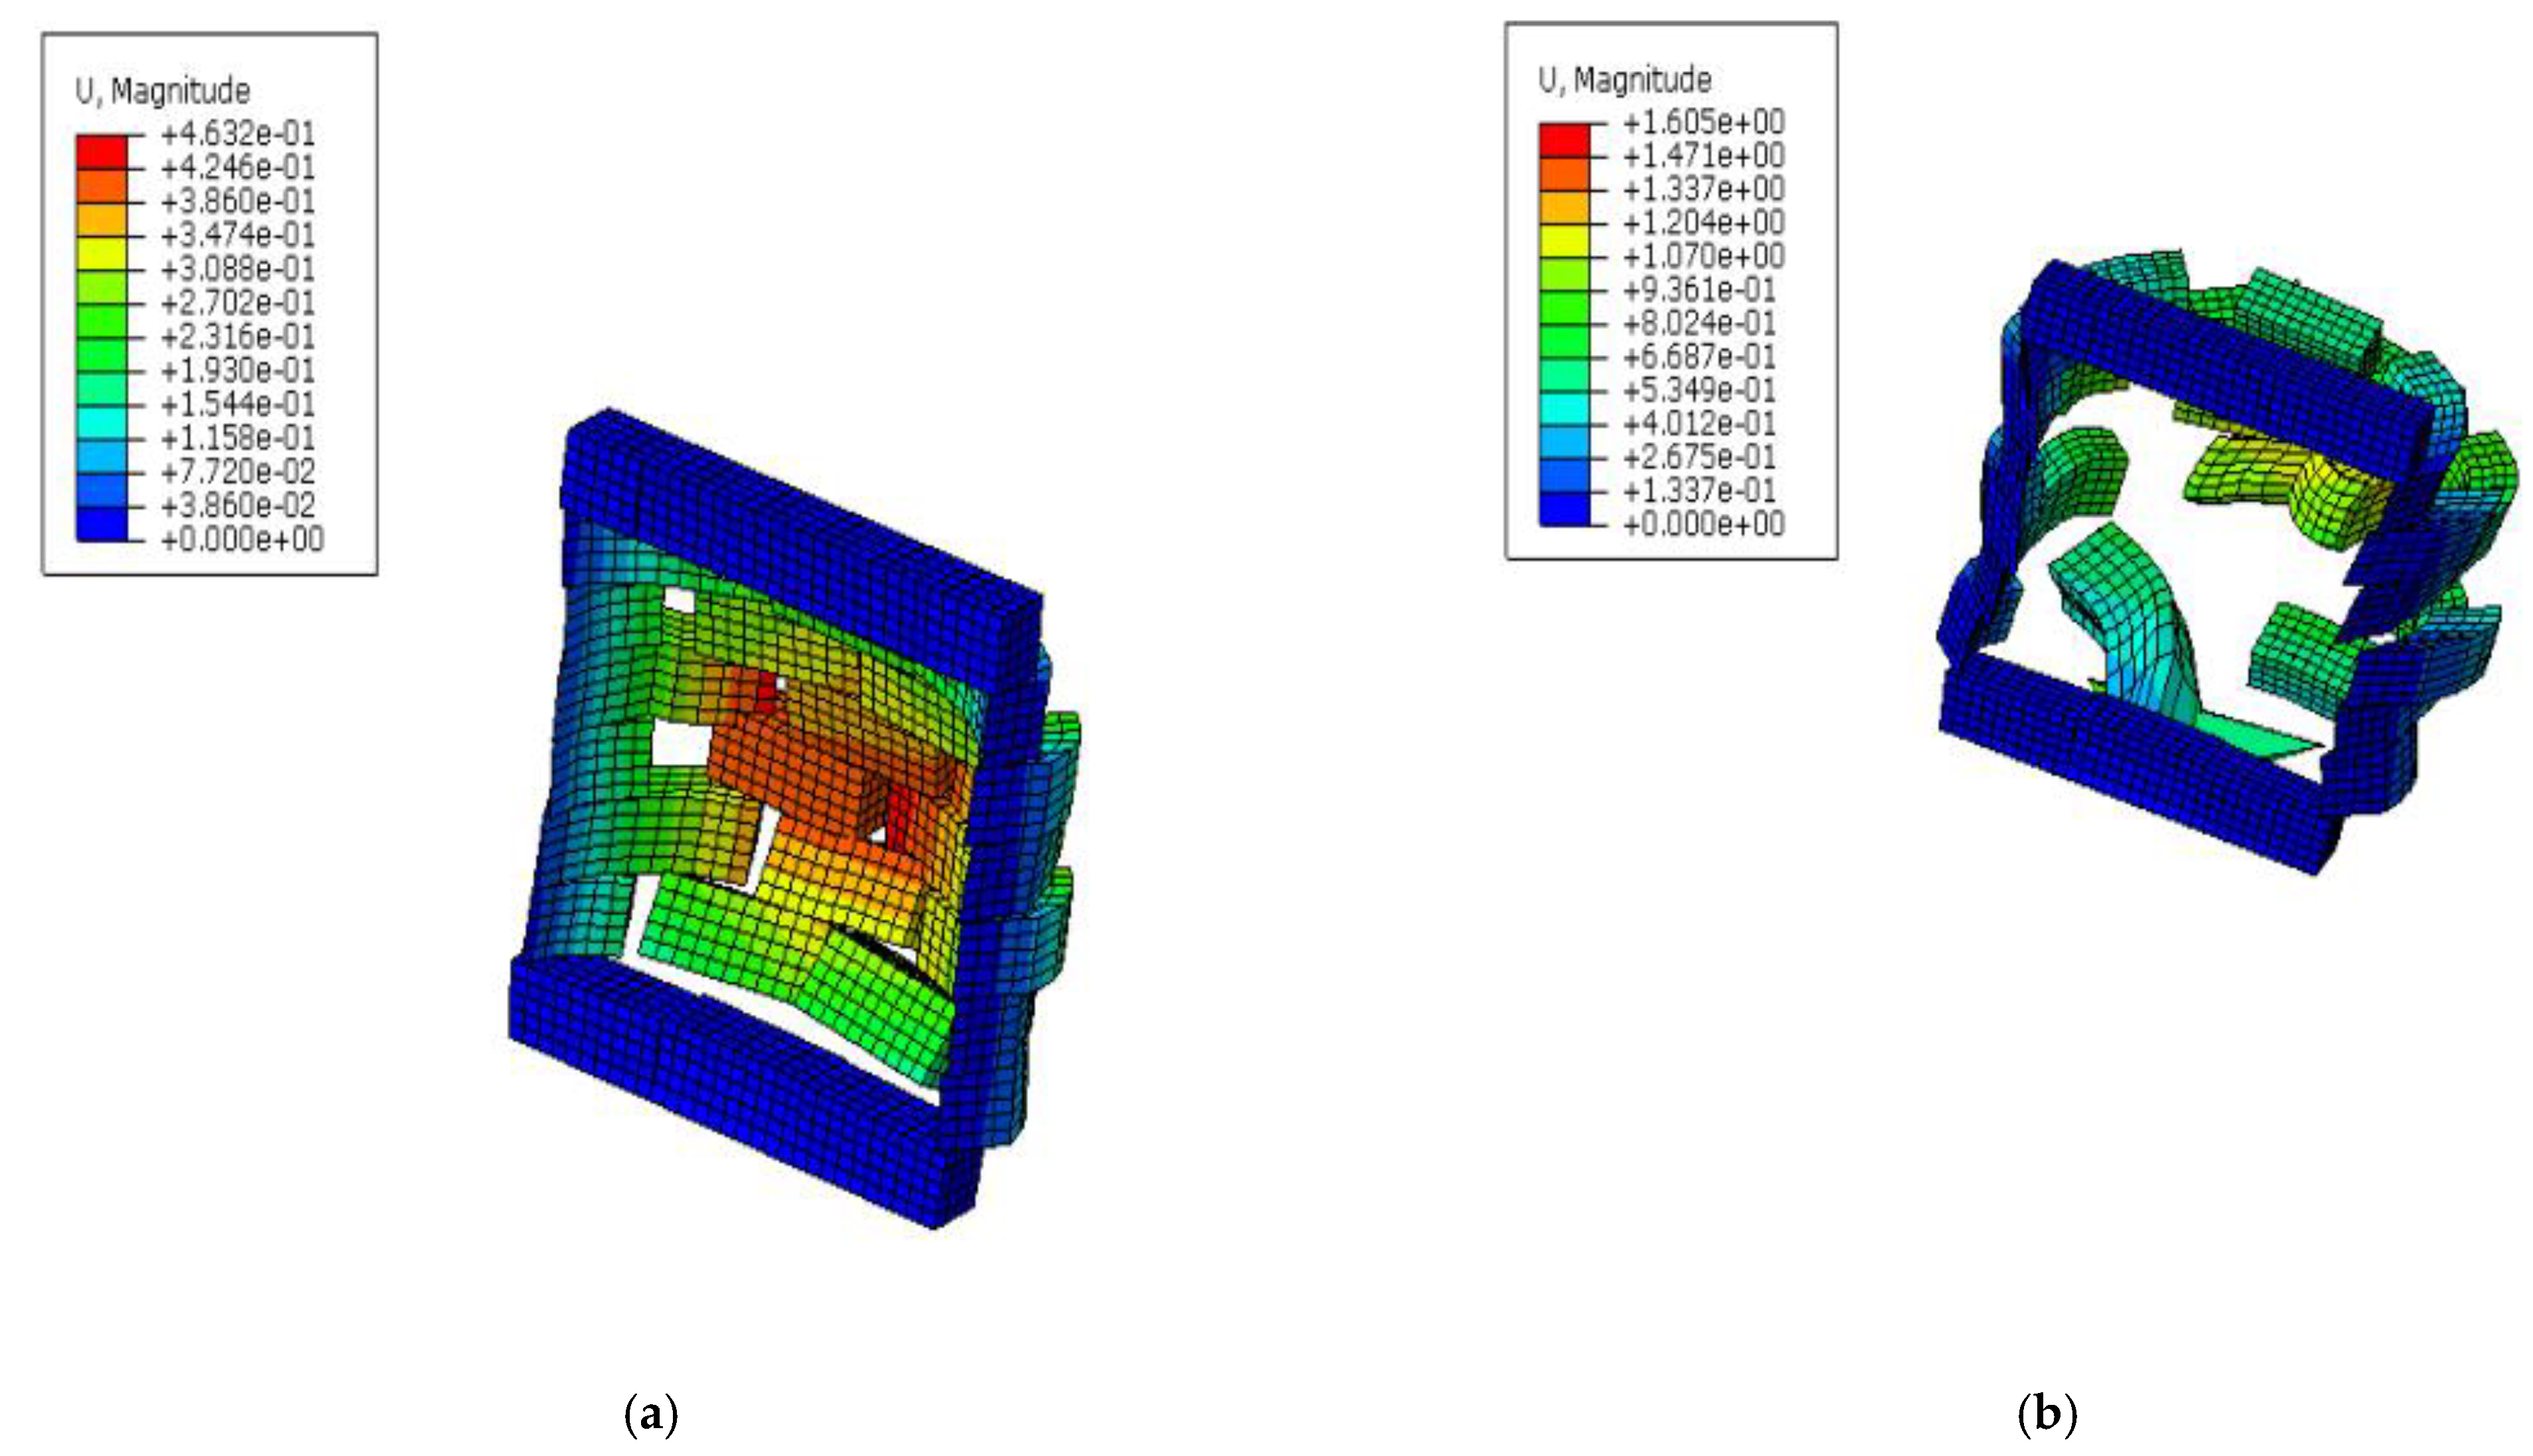
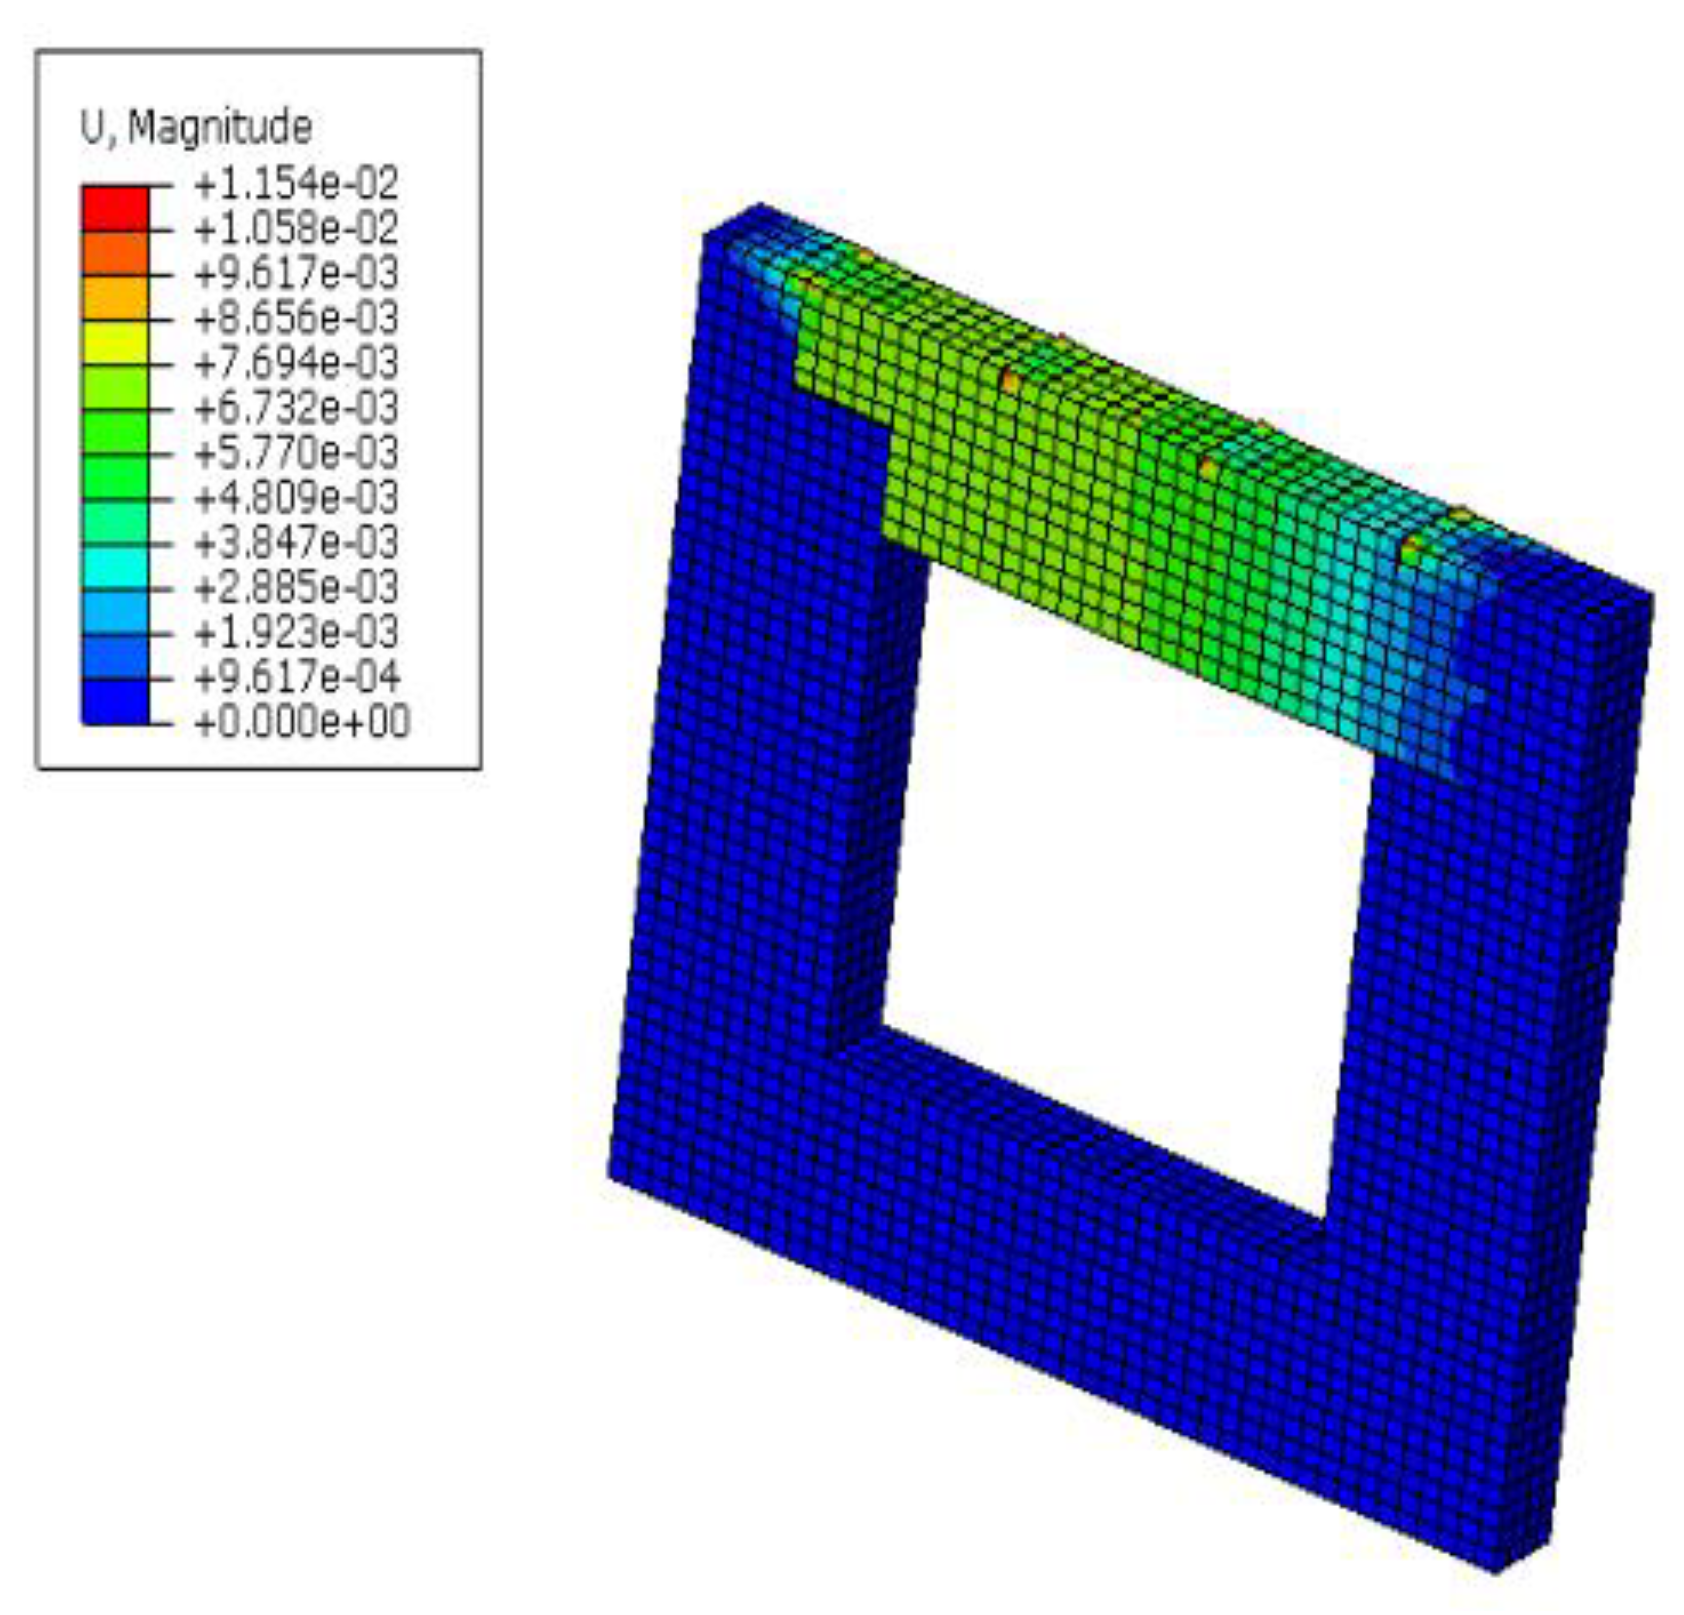
5.2. Case 2: Masonry Wall with an Opening Loaded with Vertical Pressure, Shear Displacement, and Blast Load

To capture the influence of openings (windows) on the structural response of masonry walls under blast actions, a new model is developed, introducing a window in the middle of the wall, as shown in Figure 10. Similar to Section 5.1, a vertical downward pressure and a shear in-plane loading applied at the top surface of the wall are considered together with the blast action. To simulate the influence of the lintel, which is a concrete beam usually built just above the opening and in contact with the masonry above, the vertical displacements for the elements above the window are restricted.
In Figure 20, the displacement contour plot, which was obtained when an explosive weight of 1150 kg at a standoff distance of 50 m is applied to the wall, is shown. It is observed that relatively low max displacements arise at the final load step, with an in-plane diagonal cracking above the window on the left-hand side of the wall just emerging. By comparing this with Figure 17, which depicts the response of the solid wall under the same blast loading and standoff distance, it appears that the wall with the opening develops significantly lower deflection with no obvious out-of-plane deformation, contrary to the solid wall. This is attributed to the fact that the blast load is modeled as a surface force under the incident wave (CONWEP), and the damage or effect of the blast is directly proportional to the exposed surface. In addition, the window is inserted at the middle part of the wall, where the out-of-plane response due to the blast load would become maximum in the case of a solid wall.
Next, to depict the failure of the wall with the opening, the weight of the explosive is increased and the standoff distance is reduced. In particular, the displacement plots for the wall obtained from explosive weights of 2000 kg and 3500 kg at standoff distances of 5 m and 10 m are provided in Figure 21. For both cases, out-of-plane failure is obtained as depicted in Figure 21a,b with the case of 2000 kg explosive weight at a distance of 5 m being the most severe.
In an effort to provide a qualitative comparison of the response of the walls with and without a window, it is observed that the most severe collapse of the wall with the window occurs for 2000 kg explosive weight positioned at 5 m (Figure 21a). The corresponding most severe collapse of the solid wall occurs for 1150 kg explosive weight positioned at 20 m (Figure 14). Thus, it seems that the opening in the middle of the wall significantly reduces the effects of the blast action. This observation is in agreement with the findings provided in [43], where the area of an opening in a masonry building is shown to have a significant impact on both the normal and shear stresses produced by blast.

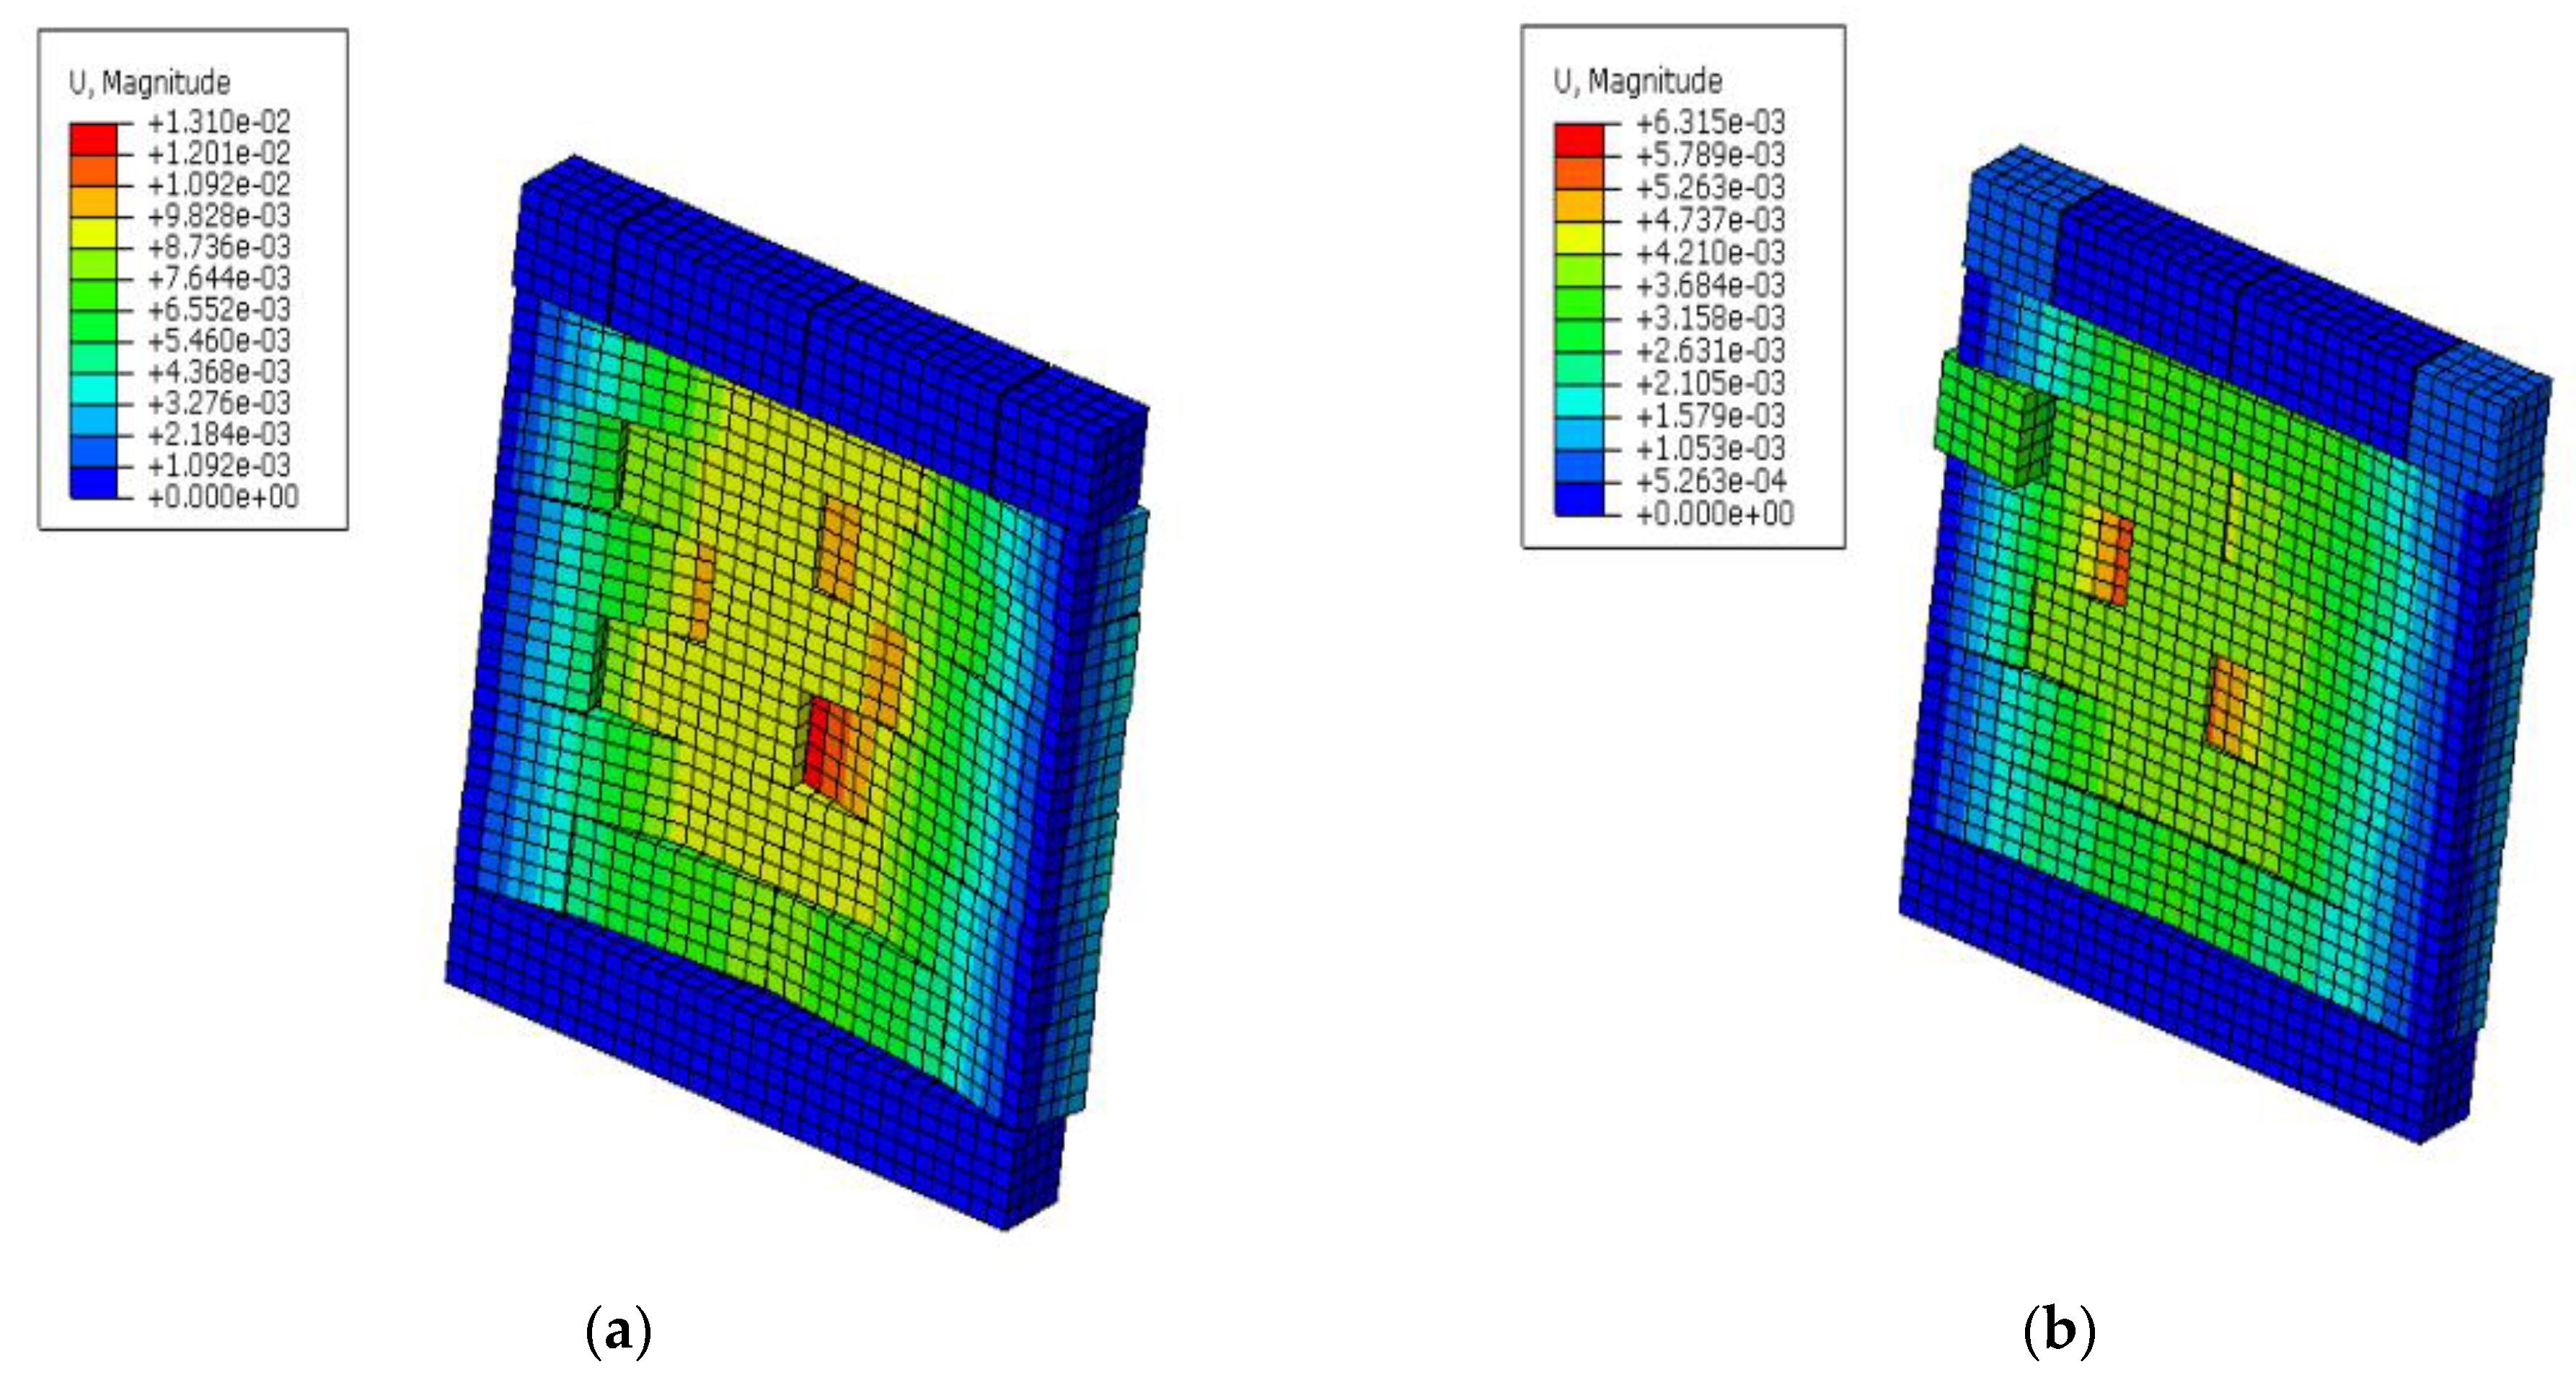
5.3. Case 3: Solid Masonry Wall Loaded with Vertical Pressure and Blast Load

In this section, the response of the wall without an opening loaded with a vertical downward pressure at the top surface and the blast action is investigated. Thus, contrary to Section 5.1 (and Section 5.2), no shear horizontal displacement is applied at the top of the wall. In Figure 22, the response of the wall subjected to 100 kg and 200 kg TNT at standoff distances of 50 m and 100 m, respectively, is provided. In Figure 23, the response of the wall subjected to 1150 kg TNT and 100 m standoff distance is shown.
In both Figure 22 and Figure 23, the out-of-plane deflection characterizes the response of the wall. Contrary to this behavior, the model of the wall loaded with shear horizontal displacement, 100 kg explosive weight, and 50 m standoff distance, resulted in diagonal in-plane cracking (Figure 15) with significantly higher maximum deflection, compared with the wall shown in Figure 22a.
A similar comparison can be made between Figure 18 and Figure 23, representing the displacement contour plot of the wall under the same blast load and standoff distance (1150 kg, 100 m) with and without the shear displacement load, respectively. As shown in Figure 18, a significantly higher maximum deflection is obtained when the shear displacement load is applied to the wall, compared with Figure 23. In addition, the in-plane diagonal cracking is dominant in Figure 18.

6. Conclusions

In this article, the response of masonry walls under static in-plane and blast loads is investigated using non-linear finite element analysis software [44]. For the simulation of damage in the interfaces between the stone blocks, unilateral contact–friction interfaces are applied to depict opening and sliding failure. In addition, a concrete damage plasticity model is used to describe tensile and compressive damage in the blocks. The proposed scheme is applied to a solid masonry wall and to a wall with an opening (window).
This investigation aims in highlighting potential collapse mechanisms by testing different blast load parameters, namely, the weight of the explosive and the standoff distance between the source of the explosion and the structure. The influence of a horizontal shear displacement in-plane loading at the top of the wall is also investigated.
According to the findings of this study, the failure mode of the wall loaded with both shear in-plane displacement and the blast action can be either in-plane diagonal cracking or out-of-plane flexural failure. The first mode arises when the shear in-plane displacement is the dominant loading, compared with the blasting action, while the second arises when the blast is the dominant loading. For the same material properties and wall dimensions, the weight of the explosive and the standoff distance are the critical parameters, which determine which of the two loading types dominates. In the results section, case studies highlighting both failure modes are discussed for various values of the explosive weight and the standoff distance. A combination of both failure modes can also arise, depending on the values of these parameters.
Another outcome of this work is the fact that the presence of an opening (window) in the wall may reduce the effect of the blast action by decreasing the out-of-plane response of the structure. The reason for this is that due to the opening being located in the middle of the wall, the blast load is not applied to this critical (for out-of-plane flexure) middle part of the surface of the wall. Thus, this study shows that the blast action must occur at a closer standoff distance compared with the solid wall, in order to cause significant damage to the structure.
When no shear displacement in-plane loading is applied, the response is dominated by the out-of-plane flexural deflection, attributed to the blasting action. In this case, lower maximum displacements are obtained compared with the wall loaded with shear displacement and blast actions.
Several future investigations could be used to extend the present work. A potential concept is to study the influence of the area, position, and number of windows on the response of the walls under blast actions. The usage of different initial static loading could modify the results, as was shown in the conducted numerical investigation. Design or re-design based on these findings could also form an interesting research topic. Another concept is related to the implementation of data-driven structural dynamics, introducing machine learning tools, to evaluate the influence of several parameters such as the dimensions of the walls and the blast load parameters on their structural response.

Author Contributions

Conceptualization, G.A.D.; methodology, G.A.D.; formal analysis, S.G.T.; investigation, S.G.T. and G.A.D.; resources, G.A.D.; data curation, S.G.T.; writing—original draft preparation, S.G.T.; writing—review and editing, S.G.T., G.A.D. and G.E.S.; visualization, S.G.T.; supervision, G.A.D. and G.E.S.; project administration, G.A.D. All authors have read and agreed to the published version of the manuscript.

Funding

This research received no external funding.

Data Availability Statement

Not applicable.

Conflicts of Interest

The authors declare no conflict of interest.

References

  1. Ahmad, S.; Elahi, A.; Pervaiz, H.; Rahman, A.G.A.; Barbhuiya, S. Experimental study of masonry wall exposed to blast loading. Mater. Constr. 2014, 64, 2–6. [Google Scholar] [CrossRef]
  2. Gertsch, L.; Baird, J. A Phased Array Approach to Rock Blasting; University of North Texas, UNT Digital Library: Denton, TX, USA, 2006; pp. 13–40. Available online: https://digital.library.unt.edu (accessed on 22 March 2022).
  3. Aloui, M.; Bleuzen, Y.; Essefi, E.; Abbes, C. Ground Vibrations and Air Blast Effects Induced by Blasting in Open Pit Mines: Case of Metlaoui Mining Basin, Southwestern Tunisia. J. Geol. Geophys. 2016, 5, 5–7. [Google Scholar] [CrossRef]
  4. Ipmawati, M.R.; Nainggolan, D.R.; Wiyono, B.; Sunary, R. Effect double-primer placement for improving the fragmentation on harder material in stemming column: A case study. IOP Conf. Ser. Earth Environ. Sci. 2018, 212, 012064. [Google Scholar] [CrossRef]
  5. Hao, D. Numerical Modelling of Masonry Wall Response to Blast Loads. Aust. J. Struct. Eng. 2009, 10, 37–52. [Google Scholar] [CrossRef]
  6. Wang, W.; Zhang, D.; Fangyun, L.; Wang, S.C.; Tang, T. Experimental study and numerical simulation of the damage mode of a square reinforced concrete slab under close-in explosion. Eng. Fail. Anal. 2013, 27, 41–51. [Google Scholar] [CrossRef]
  7. Zhao, C.F.; Chen, J.Y. Damage mechanism and mode of square reinforced concrete slab subjected to blast loading. Theor. Appl. Fract. Mech. 2013, 63–64, 54–62. [Google Scholar] [CrossRef]
  8. Macorini, L.; Izzuddin, B.A. Nonlinear Analysis of Unreinforced Masonry Walls under Blast Loading Using Mesoscale Partitioned Modeling. J. Struct. Eng. 2014, 140, A4014002. [Google Scholar] [CrossRef]
  9. Kernicky, T.P.; Whelan, M.J.; Weggel, D.C.; Rice, C.D. Structural Identification and Damage Characterization of a Masonry Infill Wall in a Full-Scale Building Subjected to Internal Blast Load. J. Struct. Eng. 2015, 141, D4014013. [Google Scholar] [CrossRef]
  10. Jia, H.; Yu, L.; Wu, G. Damage Assessment of Two-Way Bending RC Slabs Subjected to Blast Loadings. Publ. Corp. Sci. World J. 2014, 2014, 718702. [Google Scholar] [CrossRef]
  11. D’Altri, A.M.; Miranda, S.; Castellazzi, G.; Sarhosis, V. A 3D Detailed Micro-Modelling Approach for the In-Plane and Out-Of-Plane Analysis of Masonry Structures. Comput. Struct. 2018, 206, 18–30. [Google Scholar] [CrossRef]
  12. Lourenço, P.B.; Rots, J.G.; Blaauwendraad, J. Two Approaches for the Analysis of Masonry Structures: Micro and Macro-Modeling. Heron 1995, 40, 313–338. [Google Scholar]
  13. Masi, F.; Stafanou, I.; Maffi-Berthier, V.; Vannucci, P. A Discrete Element Method based-approach for arched masonry structures under blast loads. Eng. Struct. 2020, 216, 110721. [Google Scholar] [CrossRef]
  14. Shamim, S.; Shamd, S.; Khan, A. Finite element analysis of masonry wall subjected to blast loading. Int. J. Adv. Mech. Civ. Eng. 2019, 6, 50–53. [Google Scholar]
  15. Shamim, S.; Shamd, S.; Khan, A. Numerical Modelling of Masonry Panel Subjected to Surface Blast Loading. J. Xi’an Univ. Archit. Technol. 2020, 12, 846–856. [Google Scholar]
  16. Abdulla, K.; Cunningham, L.; Gillie, M. Non-linear simulation of masonry behaviour under cyclic loads. In Proceedings of the 2017 MACE PGR Conference, Manchester, UK, 3 April 2017; pp. 20–22. [Google Scholar]
  17. Anas, S.M.; Alam, M.; Umair, M. Strengthening of braced unreinforced brick masonry wall with (i) C-FRP wrapping, and (ii) steel angle-strip system under blast loading. Mater. Today Proc. 2022, 58, 1181–1198. [Google Scholar] [CrossRef]
  18. Shariq, M.; Alam, M.; Husain, A.; Islam, N. Response of strengthened unreinforced brick masonry wall with (1) mild steel wire mesh and (2) CFRP wrapping, under close-in blast. Mater. Today Proc. 2022, 64, 643–654. [Google Scholar] [CrossRef]
  19. Shamim, S.; Khan, R.A.; Ahmad, S. Fragility analysis of masonry wall subjected to blast loading. Structures 2022, 39, 1016–1030. [Google Scholar] [CrossRef]
  20. Yu, Q.; Zeng, D.; Xu, X.; Li, S.; Dong, W.; Dai, L. Experimental and numerical investigation of polymer-reinforced and normal autoclaved aerated concrete masonry walls under large TNT explosive loads. Int. J. Impact Eng. 2022, 164, 104188. [Google Scholar] [CrossRef]
  21. Salmanpour, A.H. Displacement Capacity of Structural Masonry. Ph.D. Thesis, ETH Zurich, Zurich, Switzerland, 2017. [Google Scholar]
  22. De Villiers, W.I. Computational and Experimental Modelling of Masonry Walling towards Performance-Based Standardisation of Alternative Masonry Units for Low-Income Housing. Ph.D. Thesis, Stellenbosch University, Stellenbosch, South Africa, 2019. [Google Scholar]
  23. Kömürcü, S.; Gedikli, A. Macro and Micro Modeling of the Unreinforced Masonry Shear Walls. Eur. J. Eng. Nat. Sci. 2019, 3, 116–123. [Google Scholar]
  24. Ranji, A.R.; Esmaeli, A. Blast load response of one-way reinforced concrete slabs retrofitted with Fiber reinforced plastic. Proc. Odessa Polytech. Univ. 2018, 2, 49–58. [Google Scholar] [CrossRef]
  25. Tan, W.A.; Tingatinga, E.A.; Alvarez, V. Blast load analysis and simulation of unreinforced concrete masonry. J. Phys. Conf. Ser. 2019, 1264, 012008. [Google Scholar] [CrossRef]
  26. Weggel, D.C. Blast threats and blast loading. In Blast Protection of Civil Infrastructures and Vehicles Using Composites; Series in Civil and Structural Engineering; Woodhead Publishing: Swaston, UK, 2010; pp. 3–43. [Google Scholar] [CrossRef]
  27. Botez, M.D.; Bredean, L.A. Numerical Study of a RC Slab Subjected to Blast: A Coupled Eulerian-Lagrangian Approach. IOP Conf. Ser. Mater. Sci. Eng. 2019, 471, 2–5. [Google Scholar] [CrossRef]
  28. Rigby, S.E.; Tyas, A.; Bennett, T.; Clarke, S.D.; Fay, S.D. The Negative Phase of the Blast Load. Int. J. Prot. Struct. 2014, 5, 1–19. [Google Scholar] [CrossRef]
  29. Alsayed, S.H.; Elsanadedy, H.M.; Al-Zaheri, Z.M.; Salloum, Y.A.; Abbas, H. Blast response of GFRP strengthened, infill masonry walls. Constr. Build. Mater. 2016, 115, 438–451. [Google Scholar] [CrossRef]
  30. Bolhassani, M.; Hamid, A.A.; Lau, A.C.W.; Moon, F. Simplified micro modelling of partially grouted masonry assemblages. Constr. Build. Mater. 2015, 83, 159–173. [Google Scholar] [CrossRef]
  31. Draganić, H.; Sigmund, V. Blast Loading On Structures. Tech. Gaz. 2012, 19, 643–652. [Google Scholar]
  32. Lubliner, J.; Oliver, J.; Oller, S.; Oñate, E. A plastic-damage model for concrete. Int. J. Solids Struct. 1989, 25, 299–329. [Google Scholar] [CrossRef]
  33. Lee, J.; Fenves, G.L. Plastic-Damage Model for Cyclic Loading of Concrete Structures. J. Eng. Mech. 1998, 124, 892–900. [Google Scholar] [CrossRef]
  34. Tapkin, S.; Tercan, E.; Motsa, S.; Drosopoulos, G.; Stavroulaki, M.; Maravelakis, E.; Stavroulakis, G. Structural Investigation of Masonry Arch Bridges Using Various Nonlinear Finite-Element Models. J. Bridge Eng. 2022, 27, 04022053. [Google Scholar] [CrossRef]
  35. Daniel, J.; Dubey, R. Finite Element Simulation of Earthquake Resistant Brick Masonry Building Under Shock Loading. Adv. Struct. Eng. 2014, 81, 1027–1038. [Google Scholar] [CrossRef]
  36. Dogu, M.; Menkulasi, F. A flexural design methodology for UHPC beams posttensioned with unbonded tendons. Eng. Struct. 2020, 207, 110193. [Google Scholar] [CrossRef]
  37. Hognestad, E. A Study of Combined Bending and Axial Load in Reinforced Concrete Members; Bulletin Series No.399; University of Illinois, Engineering Experiment Station: Chicago, IL, USA, 1951; pp. 32–54. [Google Scholar]
  38. Iuorio, O.; Dauda, J.A. Retrofitting Masonry Walls against Out-Of-Plane Loading with Timber Based Panels. Appl. Sci. 2021, 11, 5443. [Google Scholar] [CrossRef]
  39. Concrete Manufactures Association. Concrete Masonry Manual, 9th ed.; Concrete Manufactures Association: Menlo Park, CA, USA, 2011; Available online: https://www.cma.org.za/Portals/0/Docs/brickasandblocks (accessed on 22 April 2022).
  40. SANS 10400-A 2010; The Application of the National Building Regulations Part A: General Principles and Requirements, 3rd ed. SABS Standards Division: Pretoria, South Africa, 2010; ISBN 978-0-626-25157-4.
  41. Wei, J.; Du, Z.; Zheng, Y.; Ounhueane, O. Research on Damage Characteristics of Brick Masonry under Explosion Load. Shock Vib. 2021, 2021, 5519231. [Google Scholar] [CrossRef]
  42. Decanini, L.; De Sortis, A.; Goretti, A.; Langenbach, R.; Mollaioli, F.; Rasulo, A. Performance of masonry buildings during the 2002 Molise, Italy, earthquake. Earthq. Spectra 2004, 20 (Suppl. S1), 191–220. [Google Scholar] [CrossRef]
  43. Raza, I.; Shamim, S.; Ahmad, S.; Khan, R.A. Analysis of two-storey masonry structure under blast loading. Mater. Today Proc. 2023, 80, 1605–1610. [Google Scholar] [CrossRef]
  44. ABAQUS v. 6.14.2 Users Manual. Available online: http://130.149.89.49:2080/v2016/index.html (accessed on 13 March 2022).
Figure 1. Typical Failure modes of masonry walls subjected to a vertical load and a horizontal (shear) load. These two loads will result in (a) sliding shear failure, (b) shear failure (staircase-shaped cracks), (c) diagonal shear, and (d) crushing, which is mainly compressive cracks [21].
Computation 11 00165 g001
Figure 2. Out-of-plane failure pattern of a wall subjected to blast loading.
Computation 11 00165 g002
Figure 3. Modeling techniques for masonry walls.
Computation 11 00165 g003
Figure 4. Shock wave distribution [27].
Computation 11 00165 g004
Figure 5. Compressive stress vs. strain diagram [37].
Computation 11 00165 g005
Figure 6. Compressive damage variable vs. plastic strain diagram [37].
Computation 11 00165 g006
Figure 7. Tensile stress vs. strain diagram [37].
Computation 11 00165 g007
Figure 8. Tensile damage variable vs. plastic strain diagram [37].
Computation 11 00165 g008
Figure 9. Geometry 1 (wall with no opening (mm)).
Computation 11 00165 g009
Figure 10. Geometry 2 (wall with an opening (mm)).
Computation 11 00165 g010
Figure 11. Mesh of the considered masonry walls: (a) with no opening and (b) with a window opening.
Computation 11 00165 g011
Figure 12. Solid wall loaded with a charge weight of 100 kg at a distance of 20 m: (a) displacement of the wall at the end of the simulation (m), (b) compressive damage variable, and (c) tensile damage variable distribution.
Computation 11 00165 g012
Figure 13. Solid wall loaded with a charge weight of 200 kg at a distance of 20 m: (a) displacement of the wall at the end of the simulation (m), (b) compressive damage variable, and (c) tensile damage variable distribution.
Computation 11 00165 g013
Figure 14. Displacement of the solid wall loaded with a charge weight of 1150 kg at a distance of 20 m: (a) depicted in a previous time step prior to complete damage of the wall and (b) depicted at the final time step.
Computation 11 00165 g014
Figure 15. Displacement of the solid wall loaded with a charge weight of 100 kg at a distance of 50 m.
Computation 11 00165 g015
Figure 16. Displacement of the solid wall loaded with a charge weight of 200 kg at a distance of 50 m.
Computation 11 00165 g016
Figure 17. Solid wall loaded with a charge weight of 1150 kg at a distance of 50 m: (a) displacement of the wall at the end of the simulation (m), (b) compressive damage variable, and (c) tensile damage variable distribution.
Computation 11 00165 g017
Figure 18. Solid wall loaded with a charge weight of 1150 kg at a distance of 100 m: (a) displacement of the wall at the end of the simulation (m), (b) compressive damage variable, and (c) tensile damage variable distribution.
Computation 11 00165 g018
Figure 19. Displacement–explosive weight diagrams depicting the (a) out-of-plane and (b) in -plane response.
Computation 11 00165 g019
Figure 20. Displacement contour plot at the end of the simulation for a wall with an opening subjected to 1150 kg TNT at a standoff distance of 50 m.
Computation 11 00165 g020
Figure 21. Displacement contour plot at the end of the simulation for a wall with an opening subjected to (a) 2000 kg TNT at a standoff distance of 5 m and (b) 3500 kg TNT at a standoff distance of 10 m.
Computation 11 00165 g021
Figure 22. Solid wall subjected to (a) 100 kg TNT at a standoff distance of 50 m and (b) 200 kg TNT at a standoff distance of 100 m when no horizontal displacement loading is applied to the top surface of the wall (a scale factor equal to 10 is used to magnify the displacement contour plots).
Computation 11 00165 g022
Figure 23. Solid wall subjected to 1150 kg TNT at a standoff distance of 100 m when no horizontal displacement loading is applied to the top surface of the wall (a scale factor equal to 10 is used to magnify the displacement contour plots).
Computation 11 00165 g023
Table 1. Mechanical properties of the masonry unit and mortar [38].
Plasticity ParameterValue
Dilation angle30
Eccentricity parameter0.1
Bi- and uni-directional compressive strength ratio1.16
Stress ratio in tensile meridian0.67
Viscosity parameter0.001
Table 2. Material properties [38].
MaterialModulus of Elasticity (MPa)Poisson’s RatioTensile Strength (MPa)Compressive Strength (MPa)
Masonry Unit15,5000.151.0510.5
Table 3. Cases considered in the framework of this investigation.
Case DescriptionBlast LoadStandoff Distance
Case 1 (solid wall loaded with vertical pressure, horizontal shear displacement, and blast load).100 kg TNT20 m, 50 m
200 kg TNT20 m, 50 m
1150 kg TNT20 m, 50 m, 100 m
Case 2 (wall with an opening loaded with vertical pressure, horizontal shear displacement, and blast load).1150 kg TNT50 m
2000 kg TNT5 m
3500 kg TNT10 m
Case 3 (solid wall loaded with vertical pressure and blast load). No horizontal shear displacement is considered.100 kg TNT50 m
200 kg TNT100 m
1150 kg TNT100 m
Disclaimer/Publisher’s Note: The statements, opinions and data contained in all publications are solely those of the individual author(s) and contributor(s) and not of MDPI and/or the editor(s). MDPI and/or the editor(s) disclaim responsibility for any injury to people or property resulting from any ideas, methods, instructions or products referred to in the content.

