Abstract
In response to socioeconomic development, the number of machine learning applications has increased, along with the calls for algorithmic transparency and further sustainability in terms of energy efficient technologies. Modern computer algorithms that process large amounts of information, particularly artificial intelligence methods and their workhorse machine learning, can be used to promote and support sustainability; however, they consume a lot of energy themselves. This work focuses and interconnects two key aspects of artificial intelligence regarding the transparency and sustainability of model development. We identify frameworks for measuring carbon emissions from Python algorithms and evaluate energy consumption during model development. Additionally, we test the impact of explainability on algorithmic energy consumption during model optimization, particularly for applications in health and, to expand the scope and achieve a widespread use, civil engineering and computer vision. Specifically, we present three different models of classification, regression and object-based detection for the scenarios of cancer classification, building energy, and image detection, each integrated with explainable artificial intelligence (XAI) or feature reduction. This work can serve as a guide for selecting a tool to measure and scrutinize algorithmic energy consumption and raise awareness of emission-based model optimization by highlighting the sustainability of XAI.
Keywords:
sustainability; explainability; AI; ML; algorithmic energy consumption; modeling; emission tracking 1. Introduction
Reducing carbon emissions via energy efficiency is key to combating climate change and is part of the sustainability development goals adopted by all United Nations Member States set in the 2030 Agenda for Sustainable Development [1,2].
The sector of computing is growing rapidly and so is its corresponding energy consumption [3,4]. In recent years, carbon emissions originating from energy consumption and manufacturing from the computing sector have been estimated to account for up to 4% of global emissions, which is higher than the relative number for fossil fuel emissions of the aviation sector, for example [5,6]. One third of these emissions can be accounted for by data centers alone, while additionally data processing, experimentation and training, depending on the model, are also high contributors [7,8]. There is an enormous global trend towards digital transformation, which includes all areas of life (e.g., agriculture, forestry, health, etc.) [9,10,11]. The main driver of this current digital transformation is the enormous progress in the domain of artificial intelligence (AI), driven by the tremendous successes of statistical data-driven and thus highly memory- and computational-intensive machine learning (ML) [12]. The potential of AI to bring benefits to humanity and our environment is undeniably enormous, and AI can definitely contribute to finding new solutions to the most pressing challenges facing our human society in virtually every sphere of life, from classification of agriculture and forest ecosystems [9], which affect our entire planet, and prediction of network traffic [13,14] to the health of every individual [15].
Digitalization can have negative and positive impacts on energy consumption, including direct and indirect effects on sustainability [16]. Computational algorithms consume energy on the one hand and can be used to optimize processes on the other hand [17,18]. Sustainability in the field of machine learning has been introduced in two ways: On the one hand, it can be represented by using AI directly to improve sustainability such as by using algorithms to predict and optimize the energy demand of systems [19,20,21]. On the other hand, it can be also represented as sustainability for AI, which refers to optimizing and reducing the required environmental resources required for AI development, i.e., training and tuning [22]. There is a possible backlash from the energy requirements generated by the application of computational algorithms. Due to climate change and the ecological footprint of digitalization strategies, software sustainability is becoming an increasingly important topic, involving the software life cycle, i.e., its design, quality, and requirements [23].
This is in line with expanding the focus of green information technology (IT) beyond the hardware (HW) to the software (SW) by evaluating the environmental impact and ultimately providing recommendations to software engineers [24]. Adaptive software components have been suggested to improve the energy efficiency of computing systems [25]. Reversible computing for the analysis of time/space/energy trade-offs has been introduced for determining energy-efficient algorithms [26]. The research community is encouraged to reduce the computational costs of their algorithms [27]. Still, the majority of research on machine learning models is concerned with accuracy, without much thought to energy optimization due to the lack of guidelines and unawareness of approaches to evaluate energy consumption [28]. In general, reviews of open-source emission trackers exist, but lack guiding aspects to make informed decisions on which tool to use in regard to different kinds of algorithms as well as systems [3,27]. Moreover, practical examples are needed to foster the concept of sustainable algorithm usage [29].
We present an overview to track emissions of algorithms based on a comparison of currently available python frameworks. We therefore highlight three use cases of different models: one for classification of glioma from the biomedical domain, one regression for predicting the energy performance of residential buildings, and one object detection algorithm used in multiple disciplines. Thereby, we concentrate on the question of whether XAI can help to foster sustainable algorithm usage.
The paper is structured as follows: The next section briefly describes the related work, in particular, on tracking the computational costs of python-based ML models. In Section 3, the comparison method is detailed by describing the tested models and the testing infrastructure. Section 4 presents two main contributions: a summary table of inspected libraries and software packages suitable for the evaluation of power consumption as well as the evaluation results of the selected models. The findings are then discussed in Section 5. Finally, Section 6 concludes with limitations and the future outlook.
2. Related Work
Raising awareness for the environmental footprint of computing, in particular data centers, is an ongoing effort [3]. Recent works also discuss the idea of tracking the carbon emissions of ML models in particular [27,30].
Several libraries have been developed for tracking carbon emissions, such as that for tracking and predicting the energy consumption of python-based specific ML models [30] or a more specialized newer one focusing only on specific system processes that are directly concerned with ML model training [27]. Various tools to track emissions of models have been developed so far. Intel provides a tool called Intel Power Gadget [31] for a more precise estimation of the power consumption on the software level by reading the Machine State Registers (MSRs). This tool is available for Intel processors on MacOS and Windows and provides a graphical user interface (GUI) and a command (CMD) tool.
The experiment-impact-tracker framework [32] is a Python library that runs on Linux or MacOS with an Intel processor. It is intended for user-friendly power determination based on location and power drawn from the CPU and GPU and calculation of the power usage effectiveness (PUE).
Comparably, CodeCarbon [33] tracks emissions based on power consumption and location using the Intel Power Gadget. The tool is intended to provide developers with the carbon footprint of their computationally intensive programs.
PyJoules [34] is a python library that measures the energy footprint of a Linux host system with a Python code.
Another evaluation approach for Linux is presented in PyPapi [35], a Python library that uses the performance application programming interface (PAPI) to count floating point operations (FLOPs). Alternatively, measuring the runtime of a system with a built-in python function such as can give a rough estimation as well. This form of operation is primitive but easy to implement and compare.
Powerstat [36], Perf [37] and Likwid [38] are tools based on the running average power limit (RAPL). The RAPL is not an analog power measurement, but rather uses a software power model. The motivation for these tools is mainly improving the performance of the systems [39].
In terms of interpretability, there are approaches that are concerned with the carbon footprint of model training and related strategies to make them more efficient [30,40]. This work takes another perspective on interpretability into account; we ask the question, can XAI support ML energy consumption efficiency? XAI can be used to evaluate the individual impact of features by referring to input variables, and thereby can be used to better understand or design and develop a model [41]. With the evolving research field of artificial intelligence, explainability has been argued as a requirement for decisions [42]. The research field of XAI has provided various methods and there are continuously new developments in the field [43,44,45,46]. Still, the most prominent approach of SHapley Additive exPlanations (SHAP) published in 2017 [47] led to several studies on the shortcomings of using one XAI method for feature impact assessments [48,49], testing the reliability of current approaches [50], as well as further extensions [51]. From an energy perspective, XAI integration into a model extends the script and adds to its power consumption. Still, explainability has been suggested to be applicable to model pruning [52].
On the other hand, feature reduction, referring to the reduction in input variables (dimensionality), is a common approach to optimize models to avoid overfitting and therefore improve model prediction [53]. However, this method of model development consumes additional computing power, which can grow significantly depending on the number of features.
High dimensional data bring both opportunities and challenges, such as low quality and the redundancy of data. The goal is to reduce the redundancy or poor quality information within a dataset to increase model performance [54,55]. There are various approaches to dimensionality reduction, of which the most widely used are empirical mode decomposition, principal component analysis, and feature selection techniques such as correlation, linear discriminant analysis, and forward selection [56]. These techniques are utilized to improve the model accuracy of deep neural networks, in particular for medical imaging models, and also as multi or grouped feature extraction strategies [57].
This article outlines an energy-based comparison of ML model development while emphasizing two different model extensions, one using explainability and one using feature reduction. Thereby, this work explores the impact of AI explanations of algorithmic power consumption. Since minimizing the energy consumption represents a major challenge in many industries across different disciplines [58,59], this work aims at expanding the scope and reach to a wide-ranging audience. Therefore, the model extensions are integrated into three different kinds of algorithms, demonstrating the impact of such approaches on the energy uptake during model development. Examples of common supervised ML algorithms such as random forest (Ensembl method) for classification, a classification and regression tree (decision tree) for prediction, and a convolutional neural network (deep learning) are compared, taking various continuous and discrete data sources as well as images into account. The models are presented in given application scenarios in health care, civil engineering, and computer vision.
3. Methods
In this section, we describe the experimental setup summarized in Figure 1. We highlight the emissions tracked from three different models run on three different systems. Each model integrates an XAI approach based on SHAP or model optimization by exemplary simple systematic feature reduction by an iterative reduction of dimensions. Prerequisites, implementation details, source code, and data are available via https://github.com/radiance/XAIemissionCompForSustainableML/ (accessed on 2 April 2023).
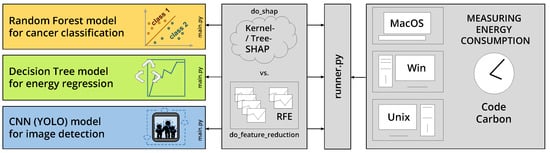
Figure 1.
Methodology overview highlighting three models, run on three different systems, each using XAI (SHAP) or recursive feautre reduction (RFE) approach, assessed for energy consumption.
3.1. Models
To evaluate, better compare, and showcase the usage of XAI, three diverse models based on distinct application scenarios are compared and evaluated in the fields of biomedical science, civil engineering, and computer vision. These are (1) a classification model for categorizing glioma cancer types, (2) a model of classification and regression tree for predicting the energy demand by the heating and cooling loads, and (3) a compound-scaled object detection model returning the position of specified objects in images.
All models were compared in two scenarios using (I) an XAI approach on the one hand and (II) a simplistic dimensionality reduction on the other hand, which were integrated into the three types of models. There were two scripted experimental runs for each model, one with and another one with in each model’s of https://github.com/radiance/XAIemissionCompForSustainableML/ (accessed on 2 April 2023). For the first scenario, , the state-of-the-art approach of XAI in python libraries, SHAP [47] (0.41.0), has been implemented in the models, using either Kernel SHAP or Tree SHAP from SHAP (version 0.41.0). The second scenario, simulates systematic feature reduction by simplistic repetitive runs with reduced input variables. For feature reduction, we used the Python Scikit-learn [60,61] (1.1.1) library with the recursive feature elimination (RFE) method for feature selection [55]. Features are ranked iteratively, least important ones are removed, and the respective model is refitted. For dependencies and additional information on versions of the libraries used for all the following models, see in the corresponding https://github.com/radiance/XAIemissionCompForSustainableML/ (accessed on 2 April 2023) repository.
The cancer classification model features a glioma classifier based on gene information and clinical data of glioma patients from cbioportal [62,63] described in [64]. The python-based classifier makes use of a Random Forest algorithm from Scikit-learn [60,61] and Tree SHAP to create a multi-output decision plot.
The energy regression model was built on the Energy_Efficiency_Dataset for the analysis of simulated buildings [65]. It uses a decision tree approach with the classification and regression tree methods implemented in python, and also uses the Scikit-learn library. A Tree SHAP algorithm is further used to output an exemplary additive force plot.
The image detection model is based on YOLOv5 (You Only Look Once) (29 September 2021), which is trained for object detection on provided small network weights [66]. For the run, a retraining is performed with an image. The image is than partitioned into superpixels of size 16 × 16 to evaluate the shap values for the image utilizing the Kernel SHAP method. For feature reduction, the superpixels were successively disabled by setting the color to the mean of the image. The model was implemented in PyTorch [67] (1.9.1).
All model performances were evaluated using the metrics from the given libraries. The cancer classifier (Random Forest) performance evaluation uses Scikit-learn metrics of and . Energy regressor scores were based on Scikit-learn [60,61] metrics and functions. Image detection evaluation uses its own class based on PyTorch for object detection performance.
3.2. Test Systems
Three different systems were used to test the models: Test system 1 uses MacOS 10.16 with an Intel Core i7-4770HQ CPU (2.20 GHz). System 2 is running Ubuntu version 20.04 LTS on i5-11300H (3.10 GHz). System 3 runs Windows 10 on an Intel Core i7-8700K CPU (3.70 GHz).
To automate and unify the testing process, a script ( in git sources) was executed.
3.3. Emission Assessment
For tracking carbon emissions produced by the various models, the CodeCarbon module was integrated into the python-based models. In a comparison of emission trackers presented in Section 4.1, CodeCarbon was the library that could be directly integrated in the given python-based models while having the highest usage score of the compared frameworks. This python package takes the computing infrastructure, usage, and running time into account while offering an online mode to allow the integration of additional information on energy sources based on geographical location. It provides an estimate of produced carbon dioxide. Since the different models were compared relative to each other, the absolute value of produced carbon dioxide based on the energy source in gCO2.eq/KWh were not considered in more detail and the models were assessed in terms of consumed energy in Wh. The function OfflineEmissionsTracker was used from CodeCarbon (2.1.3). Again, additional information and dependencies can be found in in the corresponding https://github.com/radiance/XAIemissionCompForSustainableML/ (accessed on 2 April 2023) repository.
For statistics, each test system was examined separately. Model extensions of the XAI and feature reduction approaches were tested for significant differences using t-tests (student and Welch) after testing for equal variances using scipy.stats (1.6.0).
4. Results
4.1. Software Packages Evaluating Algorithmic Power Consumption
There are multiple methods integrated in selected tools to evaluate the emissions of a system. These methods vary in their approach and platform compatibility. A selection is summarized in Table A1. Each method is compared by underlying technological basis, application scenario, hardware setting requirements and supported operating systems, contribution activity, topicality and maintenance, and usage, as well as documentation. The experiment tracker, PyPapi, pyJoules, timeit, and CodeCarbon can be integrated into the python-based models to directly evaluate the algorithm. CodeCarbon thereby could be run on all test systems using Linux, MacOS, or Windows as the operating system. It also has the highest usage from those tools that run on all systems in comparison to the other python libraries. This is rated from the number of stars a repository has received, the number of times a repository has been forked, and the number of users watching the repository. These can be used on Github as an influence analysis.
Therefore, we integrated CodeCarbon as the method of choice into the various models to evaluate the models specific energy consumption.
4.2. Consumed Energy of Models Using Explainability or Feature Dimensionality Reduction for Optimization
Model modifications for the two scenarios of XAI and RFE, respectively, did not result in significant differences in model performance and served the task of comparing energy consumption. Table A2 summarizes the model evaluation metrics. The XAI extension of models is equal to the original models in terms of performance measured as accuracy (with the highest and best value 1) and mean squared error. Feature reduction for the cancer classifier revealed nondeterministic accuracy gains depending on which feature was reduced. The corresponding scores in the table present model runs with 87 and 74 features, respectively. Feature reduction had no impact on performance metrics in the case of the regression model. Since the model had already been optimized regarding the number of features, reducing the number further down from seven features will result in lower performance metrics for both heating and cooling predictions. Performance of the image detection model was determined using the propagated method for evaluating the yolov5 while avoiding any overall changes to the original code. Feature reduction again had no positive effect on the model performance. All presented models have been published before and had already been optimized, which can be observed via the non-existent or negligible differences in performance metrics after RFE.
Examples of individual computational costs of model optimization using explainability approaches on the one hand or systematical feature reduction on the other hand are presented for cancer classification in Figure 2 in terms of the models’ consumed energy and in Figure 3 in terms of the overall computation time from all test runs. The density curves show the distribution of the different runs on different test systems, while blue denotes the computation of SHAP and orange denotes feature reduction. The distribution frequency is shown on the y-axis. The figures demonstrate that SHAP computations are faster and consume less energy more frequently compared to computations from the feature reduction approach. Figure 2 shows that multiple SHAP runs consume less than 25 Wh, while feature reduction shows more runs with about 30 Wh. Figure 3 shows that SHAP runs are highly distributed between 100 and 400 s, while feature reduction computation ranges from 100 to 600 s. Based on the different hardware specifications of the three test systems, there are deviating results for all runs of the same model. Still, distinct shapes of the density plots can be observed when comparing the two scenarios, highlighting the lower energy consumption and computation time of SHAP additive explanations compared to systematic feature reduction.
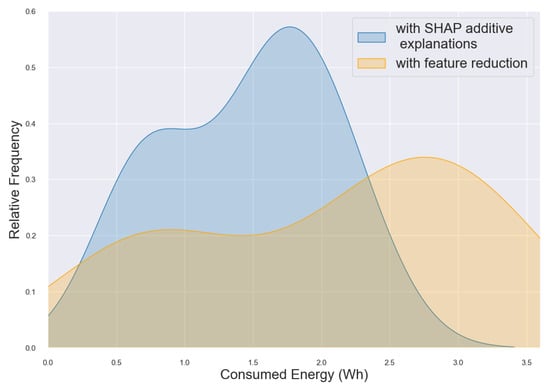
Figure 2.
Consumed Energy Distribution as a Kernel Density Estimate (KDE) Plot showing cancer classification of various runs using three different hardware settings. Comparison of computations using SHAP explanations (blue) and feature reduction (orange).
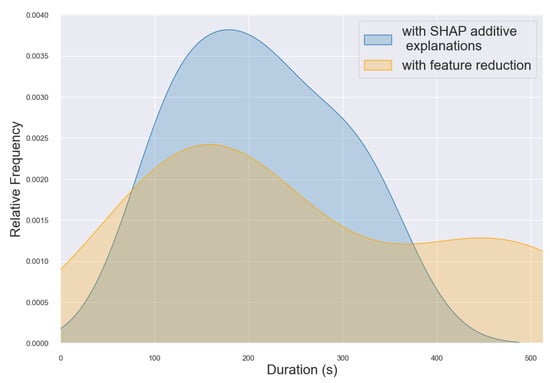
Figure 3.
Duration Distribution as Kernel Density Estimate (KDE) Plot showing cancer classification of various runs using three different hardware settings.Comparison of computations using SHAP explanations (blue) and feature reduction (orange).
Box plots showing the average consumed energy of the two scenarios of SHAP explanations compared to feature reduction for all three models are presented in Figure 4. In the case of the model for image detection, the overall mean of all test runs on the various systems is significantly higher for the XAI scenario. In the cases of the other two models for classification of genetic and clinical cancer data and the regression model of energy efficiency data, the explainability approach resulted in a lower energy consumption. These differences can be evaluated for each test system separately with the statistical results presented in Table 1. The statistical differences between the two scenarios are listed as p-values for the various models and test systems. All models show significant differences () in the consumed energy between the two scenarios on at least two of the three test systems.
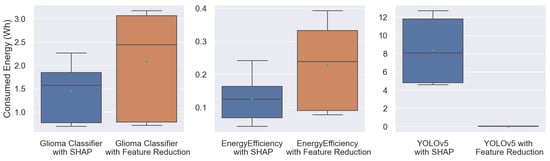
Figure 4.
Comparison of consumed energy measurements of SHAP (blue) vs. feature reduction (orange) in the models for cancer classification (left), energy regression (middle), and image detection (right).

Table 1.
Results of consumed energy differences between XAI versus feature reduction extensions of the various models run on the different test systems expressed as p-values from t-statistics, highlighting significant differences (bold) between shap and feature reduction.
5. Discussion
This work is one of the first to explore aspects of energy consumption during model development, in particular investigating the impact of XAI on sustainability. XAI can help in understanding ML models and highlights important factors influencing the model outcome. Conventional feature dimensionality reduction methods will primarily optimize a model in terms of accuracy from a technical or mathematical perspective, neglecting potentially important features from a discipline-specific point of view if not affecting accuracy in a positive way.
The results of consumed energy by the various models and scenarios demonstrate that explainability can support model development from a sustainable perspective of reduced energy consumption. Still, other methods such as current feature dimensionality reduction techniques could be more suitable depending on the type of model, since explainability approaches for models based on imaging data require substantially more computational power than models based on numerical data.
We focused on the use of the python package CodeCarbon together with python-based ML models, since this language has become the moat common in scientific computing and machine learning [68].
Upon analyzing the individual results of the various test systems, significant differences were observed during the test runs. The only two statistically insignificant differences between the two scenarios for the cancer classification model on the Ubuntu with an i5 system and the energy regression model on MacOS with an i7 system do not point to any pattern based on hardware or operating system, since all other runs on the two other test systems resulted in significant differences following a equally observed trend. Some test runs could have resulted in non-conformant energy uptake due to sudden incidents and unrecognized background tasks. The most probable reason for this observation is the low number of test runs and the short duration of model calculations.
More interestingly, we observed a reversed consumed energy by the image-based classifier model. SHAP integration led to a significantly higher consumption of energy in comparison to the simplistic model of repetitive runs for feature reduction. In this case, it is possible that other methods to explain in terms of energy consumption image-based models could be more efficient and would be more suitable to support sustainable model development. The SHAP approach to explain image-based models requires a high computational load itself, causing the reverse result for the comparison of the two scenarios in the case of the image detection model.
During the setup and implementation of the various scripts, a few difficulties occurred regarding the diverse systems and operating systems, as some tools could not run on all three of our different operating systems. Experiment-impact-tracker and PyPapi could not be installed or alternatively would run on some of our systems but not produce any output. Additionally, we experienced errors using the CodeCarbon library because of its use of the Intel Power Gadget. We did not find an answer to the issue published on Github; thus, we had to change the system. Possible immaturities of tracking methods, as well as models, regarding system requirements have to be considered in reflection on the individual findings.
In a nutshell, the main limitations are the low number of samples and the exemplary explainability libraries investigated. Since notable variances in duration, consumed energy, and thus the related emissions tracked among test systems have been observed, the impact of the hardware and the software, including the operating system and version, have not been investigated in detail. Moreover, despite highlighting an overview of the methods and tools used to track algorithmic emissions, the focus of this study was using one exemplary method for assessing energy consumption, as it was the only method that could be run on all test systems. In addition, a comparison of three exemplary models is presented, which is unable to grasp the plethora of available AI nor comprehensively investigate all model types or rather every particularity of ML algorithms.
6. Conclusions
This work is intended to raise awareness for scrutinizing and potentially reducing carbon emissions, particularly in the field of AI and algorithmic modeling. Several methods for tracking the emissions of computational models based on python code are introduced and applied to evaluate the energy costs of model development based on explainability and systematic feature dimensionality reduction. We demonstrate the possible application of XAI for sustainable model optimization, which is suitable for selected types of classification and regression models calculated from numerical data. Future investigations could extend the comparison of emission tracking tools to different and future explainability methods and a comprehensive set of distinct ML algorithms. The current demand for energy efficiency will be supported by model optimization using various techniques, including XAI approaches, from the perspective of sustainable computational energy consumption. In addition to model development, there are other stages or components of AI development and application that consume energy, including data acquisition, storage, model validation, and finally operation, which could be investigated in future studies.
Author Contributions
Conceptualization and methodology: C.J.-Q., K.B., L.H. and E.H.; software: K.B., L.H., E.H. and F.J.; validation: C.J.-Q., K.B., L.H., E.H. and F.J.; formal analysis: all authors; investigation and resources: K.B., L.H. and E.H.; data curation: C.J.-Q., K.B., L.H., E.H. and F.J.; supervision and visualization: C.J.-Q. and F.J.; writing—review and editing: all authors. All authors have read and agreed to the published version of the manuscript.
Funding
Parts of this work have been funded by the Austrian Science Fund (FWF), project: P-32554 “Explainable Artificial Intelligence”.
Data Availability Statement
Source code and data are available via https://github.com/radiance/XAIemissionCompForSustainableML/ (accessed on 2 April 2023).
Acknowledgments
We thank all the data providers and cBioPortal for Cancer Genomics as well as the Kaggle community that support open science.
Conflicts of Interest
The authors declare no conflict of interest.
Abbreviations
The following abbreviations are used in this manuscript:
| CMD | Command prompt |
| CPU | Central processing unit |
| CNN | Convolutional neural network |
| FLOPS | Floating Point Operations Per Second |
| GPU | Graphical processing unit |
| GUI | Graphical User Interface |
| HW | Hardware |
| KDE | Kernel Density Estimate |
| MSR | Machine State Register |
| ML | Machine learning |
| NA | Not available |
| OS | Operating System |
| PUE | Power Usage Effectiveness |
| SHAP | SHapley Additive exPlanations |
| XAI | Explainable artificial intelligence |
Appendix A
The following Table A1 presents additional information about the emission tracking tools.
Table A1.
Comparison of various emission tracking methods/tools, information collected in August 2022 and updated in April 2023. Abbreviations: command prompt (CMD), central processing unit (CPU), floating point operations per second (FLOPs), graphical processing unit (GPU), processing graphical user interface (GUI), hardware (HW), machine state register (MSR), not available (NA), operating system (OS), power usage effectiveness (PUE).
| Evaluation Tool | Method | Motivation | Application | Required HW and OS | Active Community | Maintenance | Usage | Documentation |
|---|---|---|---|---|---|---|---|---|
| Experiment tracker | Calculating PUE | User-friendly power metering including location-based emissions estimations | Python library | Linux/ MacOS with Intel/ Nvidia | Inactive | Published: 1 November 2019 Last Updated: 4 June 2021 | 213 stars, 9 watching, 22 forks | Available in [32] |
| PyPapi | Counts FLOPs | Providing Python binding for PAPI | Python library | Linux | NA | Published: 4 July 2017 Last Updated: 20 March 2021 | 29 stars, 3 watching, 8 forks | Available in [35] |
| Timeit | Measures execution time | Simple way to time bits of code | Python built in (timeit) | NA | NA | 1st commit: 2003 Last: 22 September 2020 | Unknown | Available in [69] |
| Intel Po-wer Gadget | Reading from MSRs | Estimating power consumption from a software level without any HW instrumentation | GUI or CMD | Windows and MacOS with Intel | Yes | Published: 1 July 2014 Last Updated: 5 February 2019 | Multiple blog posts on how to install | Available in [31] |
| Powerstat | Measuring battery power and RAPL interface | NA | CMD | Linux with Intel | No | 1st Commit: 15 November 2011 Last Update: 24 March 2023 | 59 stars, 7 watching, 13 forks | Available in [36] |
| PowerTOP | Diagnoses issues with power consumption or power management | NA | CMD | Linux | Yes | 1st Commit: 31 July 2010 Last Update: 10 March 2023 | 793 stars, 47 watching, 116 forks | Available in [70] |
| Perf | Offers a wrapper to Intels RAPL | Began as a tool for using the performance counters subsystem in Linux | CMD | Intel Chip | Linux only | 1st Update: 5 January 2012 Last Update: 10 March 2023 | Integrated in systems like red hat | Available in [37] |
| Likwid | Uses the RAPL interface | Building performance oriented tools that need no additional libraries, kernel patching | CMD | Intel, AMD, ARMv8, POWER9 on Linux, and/or Nvidia GPU | Possibility for a chat with developers via Matrix. Mailing List | 1st commit: 20 May 2014 Last: 30 March 2023 | 1.4k stars, 67 watching, 199 forks, | Available in [38] |
| Nvidia-smi | Measuring the power consumption of GPU-intensive applications | Aiding management and monitoring of NVIDIA GPUs | CMD | Nvidia GPU | Official Nvidia Forums | NA (NVML which this is based on was last updated 24 January 2023) | na | Available in [71] |
| Code-Carbon | Tracking power consumption and location-dependent carbon intensity | Tracking emissions to estimate the carbon footprint of AI models. | Python library | Any system | Issue tracking via Github | 1st commit: 12 May 2020 Last: 28 March 2023 | 644 stars, 15 watching, 100 forks | Available in [33] |
| pyJoules | Measuring energy footprints of systems computing Python code | NA | Python library | Intel CPU, integrated GPU and/or Nvidia GPU | Issue tracking via Github | 1st commit: 19 November 2019 Last: 07 October 2022 | 35 stars, 5 watching, 6 forks | Available in [34] |
Table A2.
Performance metrics with mean squared errors (MSE) from selected models, rounded.
Table A2.
Performance metrics with mean squared errors (MSE) from selected models, rounded.
| Model | Normal/XAI | RFE |
|---|---|---|
| Cancer classification [64] | Score 78.41% | Score 79.27% * |
| MSE 0.257 | MSE 0.249 * | |
| Heating 99.77% | 99.77% ** | |
| Energy regression [65] | MSE: 0.244 | MSE: 0.244 ** |
| Cooling 97.75% | 97.75% ** | |
| MSE 2.074 | MSE 2.074 ** | |
| Image detection [72] | Score | Score |
| 59.3% | 59.3% ** |
* For RFE showing best reduced version. ** Run with highest number of features, reduction in features scored lower.
References
- Weiland, S.; Hickmann, T.; Lederer, M.; Marquardt, J.; Schwindenhammer, S. The 2030 agenda for sustainable development: Transformative change through the sustainable development goals? Politics Gov. 2021, 9, 90–95. [Google Scholar] [CrossRef]
- Sachs, J.D.; Schmidt-Traub, G.; Mazzucato, M.; Messner, D.; Nakicenovic, N.; Rockström, J. Six transformations to achieve the sustainable development goals. Nat. Sustain. 2019, 2, 805–814. [Google Scholar] [CrossRef]
- Gupta, U.; Kim, Y.G.; Lee, S.; Tse, J.; Lee, H.H.S.; Wei, G.Y.; Brooks, D.; Wu, C.J. Chasing carbon: The elusive environmental footprint of computing. IEEE Micro 2022, 42, 37–47. [Google Scholar] [CrossRef]
- Denning, P.J.; Lewis, T.G. Exponential laws of computing growth. Commun. ACM 2016, 60, 54–65. [Google Scholar] [CrossRef]
- Cordella, M.; Alfieri, F.; Sanfelix, J. Reducing the carbon footprint of ICT products through material efficiency strategies: A life cycle analysis of smartphones. J. Ind. Ecol. 2021, 25, 448–464. [Google Scholar] [CrossRef]
- Lavi, H. Measuring Greenhouse Gas Emissions in Data Centres: The Environmental Impact of Cloud Computing. 2022. Available online: https://www.climatiq.io/blog/measure-greenhouse-gas-emissions-carbon-data-centres-cloud-computing (accessed on 2 April 2023).
- Batmunkh, A. Carbon footprint of the most popular social media platforms. Sustainability 2022, 14, 2195. [Google Scholar] [CrossRef]
- Wu, C.J.; Raghavendra, R.; Gupta, U.; Acun, B.; Ardalani, N.; Maeng, K.; Chang, G.; Aga, F.; Huang, J.; Bai, C.; et al. Sustainable ai: Environmental implications, challenges and opportunities. Proc. Mach. Learn. Syst. 2022, 4, 795–813. [Google Scholar]
- Holzinger, A.; Saranti, A.; Angerschmid, A.; Retzlaff, C.O.; Gronauer, A.; Pejakovic, V.; Medel-Jimenez, F.; Krexner, T.; Gollob, C.; Stampfer, K. Digital transformation in smart farm and forest operations needs human-centered AI: Challenges and future directions. Sensors 2022, 22, 3043. [Google Scholar] [CrossRef]
- Hrustek, L. Sustainability driven by agriculture through digital transformation. Sustainability 2020, 12, 8596. [Google Scholar] [CrossRef]
- Kraus, S.; Schiavone, F.; Pluzhnikova, A.; Invernizzi, A.C. Digital transformation in healthcare: Analyzing the current state-of-research. J. Bus. Res. 2021, 123, 557–567. [Google Scholar] [CrossRef]
- Shankar, S.; Reuther, A. Trends in Energy Estimates for Computing in AI/Machine Learning Accelerators, Supercomputers, and Compute-Intensive Applications. In Proceedings of the 2022 IEEE High Performance Extreme Computing Conference (HPEC), Waltham, MA, USA, 19–23 September 2022; IEEE: Piscataway, NJ, USA, 2022; pp. 1–8. [Google Scholar]
- Aceto, G.; Bovenzi, G.; Ciuonzo, D.; Montieri, A.; Persico, V.; Pescapé, A. Characterization and prediction of mobile-app traffic using Markov modeling. IEEE Trans. Netw. Serv. Manag. 2021, 18, 907–925. [Google Scholar] [CrossRef]
- Nascita, A.; Montieri, A.; Aceto, G.; Ciuonzo, D.; Persico, V.; Pescapé, A. XAI meets mobile traffic classification: Understanding and improving multimodal deep learning architectures. IEEE Trans. Netw. Serv. Manag. 2021, 18, 4225–4246. [Google Scholar] [CrossRef]
- Holzinger, A.; Weippl, E.; Tjoa, A.M.; Kieseberg, P. Digital Transformation for Sustainable Development Goals (SDGs)—A Security, Safety and Privacy Perspective on AI. In Springer Lecture Notes in Computer Science, LNCS 12844; Springer: Berlin/Heidelberg, Germany, 2021; pp. 1–20. [Google Scholar] [CrossRef]
- Wang, J.; Dong, X.; Dong, K. How digital industries affect China’s carbon emissions? Analysis of the direct and indirect structural effects. Technol. Soc. 2022, 68, 101911. [Google Scholar] [CrossRef]
- Tamburri, D.A. Sustainable mlops: Trends and challenges. In Proceedings of the 2020 22nd International Symposium on Symbolic and Numeric Algorithms for Scientific Computing (SYNASC), Timisoara, Romania, 1–4 September 2020; IEEE: Piscataway, NJ, USA, 2020; pp. 17–23. [Google Scholar]
- Kataoka, H.; Duolikun, D.; Enokido, T.; Takizawa, M. Multi-level computation and power consumption models. In Proceedings of the 2015 18th International Conference on Network-Based Information Systems, Taipei, Taiwan, 2–4 September 2015; IEEE: Piscataway, NJ, USA, 2015; pp. 40–47. [Google Scholar]
- Donti, P.L.; Kolter, J.Z. Machine learning for sustainable energy systems. Annu. Rev. Environ. Resour. 2021, 46, 719–747. [Google Scholar] [CrossRef]
- Pham, A.D.; Ngo, N.T.; Truong, T.T.H.; Huynh, N.T.; Truong, N.S. Predicting energy consumption in multiple buildings using machine learning for improving energy efficiency and sustainability. J. Clean. Prod. 2020, 260, 121082. [Google Scholar] [CrossRef]
- Mosavi, A.; Salimi, M.; Faizollahzadeh Ardabili, S.; Rabczuk, T.; Shamshirband, S.; Varkonyi-Koczy, A.R. State of the art of machine learning models in energy systems, a systematic review. Energies 2019, 12, 1301. [Google Scholar] [CrossRef]
- Van Wynsberghe, A. Sustainable AI: AI for sustainability and the sustainability of AI. AI Ethics 2021, 1, 213–218. [Google Scholar] [CrossRef]
- Calero, C.; Piattini, M. Puzzling out software sustainability. Sustain. Comput. Inform. Syst. 2017, 16, 117–124. [Google Scholar] [CrossRef]
- Kern, E.; Hilty, L.M.; Guldner, A.; Maksimov, Y.V.; Filler, A.; Gröger, J.; Naumann, S. Sustainable software products—Towards assessment criteria for resource and energy efficiency. Future Gener. Comput. Syst. 2018, 86, 199–210. [Google Scholar] [CrossRef]
- Herzog, B.; Hönig, T.; Schröder-Preikschat, W.; Plauth, M.; Köhler, S.; Polze, A. Bridging the gap: Energy-efficient execution of software workloads on heterogeneous hardware components. In Proceedings of the Tenth ACM International Conference on Future Energy Systems, Phoenix, AZ, USA, 25–28 June 2019; pp. 428–430. [Google Scholar]
- Demaine, E.D.; Lynch, J.; Mirano, G.J.; Tyagi, N. Energy-efficient algorithms. In Proceedings of the 2016 ACM Conference on Innovations in Theoretical Computer Science, Cambridge, MA, USA, 14–16 January 2016; pp. 321–332. [Google Scholar]
- Budennyy, S.; Lazarev, V.; Zakharenko, N.; Korovin, A.; Plosskaya, O.; Dimitrov, D.; Akhripkin, V.; Pavlov, I.; Oseledets, I.; Barsola, I.; et al. Eco2ai: Carbon emissions tracking of machine learning models as the first step towards sustainable ai. In Doklady Mathematics; Springer: Berlin/Heidelberg, Germany, 2022; Volume 106, pp. S118–S128. [Google Scholar]
- García-Martín, E.; Rodrigues, C.F.; Riley, G.; Grahn, H. Estimation of energy consumption in machine learning. J. Parallel Distrib. Comput. 2019, 134, 75–88. [Google Scholar] [CrossRef]
- Moises, A.C.; Malucelli, A.; Reinehr, S. Practices of energy consumption for sustainable software engineering. In Proceedings of the 2018 Ninth International Green and Sustainable Computing Conference (IGSC), Pittsburgh, PA, USA, 22–24 October 2018; IEEE: Piscataway, NJ, USA, 2018; pp. 1–6. [Google Scholar]
- Anthony, L.F.W.; Kanding, B.; Selvan, R. Carbontracker: Tracking and Predicting the Carbon Footprint of Training Deep Learning Models. arXiv 2020, arXiv:2007.03051. [Google Scholar]
- Intel® Power Gadget. Available online: https://www.intel.com/content/www/us/en/developer/articles/tool/power-gadget.html (accessed on 2 April 2023).
- Experiment-Impact-Tracker 1.1.0 Documentation. Available online: https://breakend.github.io/experiment-impact-tracker/ (accessed on 2 April 2023).
- CodeCarbon. Available online: https://mlco2.github.io/codecarbon/ (accessed on 2 April 2023).
- Welcome to PyJoules’s Documentation! Available online: https://pyjoules.readthedocs.io/en/latest/ (accessed on 2 April 2023).
- Welcome to PyPAPI’s Documentation! Available online: https://flozz.github.io/pypapi/ (accessed on 2 April 2023).
- Powerstat—A Tool to Measure Power Consumption. Available online: https://manpages.ubuntu.com/manpages/xenial/man8/powerstat.8.html (accessed on 2 April 2023).
- perf: Linux Profiling with Performance Counters. Available online: https://perf.wiki.kernel.org/index.php/Main_Page (accessed on 2 April 2023).
- RRZE-HPC/Likwid. Available online: https://github.com/RRZE-HPC/likwid (accessed on 2 April 2023).
- Khan, K.N.; Hirki, M.; Niemi, T.; Nurminen, J.K.; Ou, Z. RAPL in Action: Experiences in Using RAPL for Power measurements. ACM Trans. Model. Perform. Eval. Comput. Syst. (TOMPECS) 2018, 3, 1–26. [Google Scholar] [CrossRef]
- Ligozat, A.L.; Lefevre, J.; Bugeau, A.; Combaz, J. Unraveling the hidden environmental impacts of AI solutions for environment life cycle assessment of AI solutions. Sustainability 2022, 14, 5172. [Google Scholar] [CrossRef]
- Burkart, N.; Huber, M.F. A survey on the explainability of supervised machine learning. J. Artif. Intell. Res. 2021, 70, 245–317. [Google Scholar] [CrossRef]
- Xu, F.; Uszkoreit, H.; Du, Y.; Fan, W.; Zhao, D.; Zhu, J. Explainable AI: A brief survey on history, research areas, approaches and challenges. In Proceedings of the CCF International Conference on Natural Language Processing and Chinese Computing, Dunhuang, China, 9–14 October 2019; Springer: Berlin/Heidelberg, Germany, 2019; pp. 563–574. [Google Scholar]
- Holzinger, A.; Goebel, R.; Fong, R.; Moon, T.; Müller, K.R.; Samek, W. xxAI-Beyond Explainable Artificial Intelligence. In Proceedings of the International Workshop on Extending Explainable AI Beyond Deep Models and Classifiers, Vienna, Austria, 18 July 2020; Springer: Cham, Switzerland, 2022; pp. 3–10. [Google Scholar]
- Minh, D.; Wang, H.X.; Li, Y.F.; Nguyen, T.N. Explainable artificial intelligence: A comprehensive review. Artif. Intell. Rev. 2022, 55, 3503–3568. [Google Scholar] [CrossRef]
- Gashi, M.; Vuković, M.; Jekic, N.; Thalmann, S.; Holzinger, A.; Jean-Quartier, C.; Jeanquartier, F. State-of-the-Art Explainability Methods with Focus on Visual Analytics Showcased by Glioma Classification. BioMedInformatics 2022, 2, 139–158. [Google Scholar] [CrossRef]
- Holzinger, A.; Saranti, A.; Molnar, C.; Biececk, P.; Samek, W. Explainable AI Methods—A Brief Overview. In XXAI—Lecture Notes in Artificial Intelligence LNAI 13200; Springer: Berlin/Heidelberg, Germany, 2022; pp. 13–38. [Google Scholar] [CrossRef]
- Lundberg, S.M.; Lee, S.I. A unified approach to interpreting model predictions. In Proceedings of the 31st International Conference on Neural Information Processing Systems, Long Beach, CA, USA, 4–9 December 2017; pp. 4768–4777. [Google Scholar]
- Janzing, D.; Minorics, L.; Blöbaum, P. Feature relevance quantification in explainable AI: A causal problem. In Proceedings of the International Conference on Artificial Intelligence and Statistics, Palermo, Italy, 26–28 August 2020; Volume 108. [Google Scholar]
- Kumar, I.; Scheidegger, C.; Venkatasubramanian, S.; Friedler, S. Shapley Residuals: Quantifying the limits of the Shapley value for explanations. Adv. Neural Inf. Process. Syst. 2021, 34, 26598–26608. [Google Scholar]
- Nielsen, I.E.; Ramachandran, R.P.; Bouaynaya, N.; Fathallah-Shaykh, H.M.; Rasool, G. EvalAttAI: A Holistic Approach to Evaluating Attribution Maps in Robust and Non-Robust Models. arXiv 2023, arXiv:2303.08866. [Google Scholar]
- Wang, J.; Wiens, J.; Lundberg, S. Shapley flow: A graph-based approach to interpreting model predictions. In Proceedings of the International Conference on Artificial Intelligence and Statistics, San Diego, CA, USA, 13–15 April 2021; PMLR: 2021. pp. 721–729. [Google Scholar]
- Yeom, S.K.; Seegerer, P.; Lapuschkin, S.; Binder, A.; Wiedemann, S.; Müller, K.R.; Samek, W. Pruning by explaining: A novel criterion for deep neural network pruning. Pattern Recognit. 2021, 115, 107899. [Google Scholar] [CrossRef]
- Jia, W.; Sun, M.; Lian, J.; Hou, S. Feature dimensionality reduction: A review. Complex Intell. Syst. 2022, 8, 2663–2693. [Google Scholar] [CrossRef]
- Giradi, D.; Holzinger, A. Dimensionality reduction for exploratory data analysis in daily medical research. In Advanced Data Analytics in Health; Springer: Berlin/Heidelberg, Germany, 2018; pp. 3–20. [Google Scholar]
- Pilnenskiy, N.; Smetannikov, I. Feature selection algorithms as one of the python data analytical tools. Future Internet 2020, 12, 54. [Google Scholar] [CrossRef]
- Velliangiri, S.; Alagumuthukrishnan, S.; Joseph, S.I.T. A review of dimensionality reduction techniques for efficient computation. Procedia Comput. Sci. 2019, 165, 104–111. [Google Scholar] [CrossRef]
- Kuwil, F.H. A new feature extraction approach of medical image based on data distribution skew. Neurosci. Inform. 2022, 2, 100097. [Google Scholar] [CrossRef]
- Nikas, A.; Gambhir, A.; Trutnevyte, E.; Koasidis, K.; Lund, H.; Thellufsen, J.Z.; Mayer, D.; Zachmann, G.; Miguel, L.J.; Ferreras-Alonso, N.; et al. Perspective of comprehensive and comprehensible multi-model energy and climate science in Europe. Energy 2021, 215, 119153. [Google Scholar] [CrossRef]
- Ahmad, T.; Zhang, D.; Huang, C.; Zhang, H.; Dai, N.; Song, Y.; Chen, H. Artificial intelligence in sustainable energy industry: Status Quo, challenges and opportunities. J. Clean. Prod. 2021, 289, 125834. [Google Scholar] [CrossRef]
- Pedregosa, F.; Varoquaux, G.; Gramfort, A.; Michel, V.; Thirion, B.; Grisel, O.; Blondel, M.; Prettenhofer, P.; Weiss, R.; Dubourg, V.; et al. Scikit-learn: Machine learning in Python. J. Mach. Learn. Res. 2011, 12, 2825–2830. [Google Scholar]
- Kramer, O. Scikit-learn. In Machine Learning for Evolution Strategies; Springer: Cham, Switzerland, 2016; pp. 45–53. [Google Scholar]
- Gao, J.; Aksoy, B.A.; Dogrusoz, U.; Dresdner, G.; Gross, B.; Sumer, S.O.; Sun, Y.; Jacobsen, A.; Sinha, R.; Larsson, E.; et al. Integrative analysis of complex cancer genomics and clinical profiles using the cBioPortal. Sci. Signal. 2013, 6, pl1. [Google Scholar] [CrossRef]
- Cerami, E.; Gao, J.; Dogrusoz, U.; Gross, B.E.; Sumer, S.O.; Aksoy, B.A.; Jacobsen, A.; Byrne, C.J.; Heuer, M.L.; Larsson, E.; et al. The cBio cancer genomics portal: An open platform for exploring multidimensional cancer genomics data. Cancer Discov. 2012, 2, 401–404. [Google Scholar] [CrossRef]
- Jean-Quartier, C.; Jeanquartier, F.; Ridvan, A.; Kargl, M.; Mirza, T.; Stangl, T.; Markaĉ, R.; Jurada, M.; Holzinger, A. Mutation-based clustering and classification analysis reveals distinctive age groups and age-related biomarkers for glioma. BMC Med. Inform. Decis. Mak. 2021, 21, 77. [Google Scholar] [CrossRef]
- Tsanas, A.; Xifara, A. Accurate quantitative estimation of energy performance of residential buildings using statistical machine learning tools. Energy Build. 2012, 49, 560–567. [Google Scholar] [CrossRef]
- Jocher, G.; Chaurasia, A.; Stoken, A.; Borovec, J.; Kwon, Y.; Michael, K.; Fang, J. ultralytics/yolov5: V6.2—YOLOv5 Classification Models, Apple M1, Reproducibility, ClearML and Deci.ai Integrations; Zenodo: Honolulu, HI, USA, 2022. [Google Scholar]
- Programming with TensorFlow: Solution for Edge Computing Applications. 2021. Available online: https://lib.ugent.be/en/catalog/ebk01:4100000011728509 (accessed on 2 April 2023).
- Raschka, S.; Patterson, J.; Nolet, C. Machine learning in python: Main developments and technology trends in data science, machine learning, and artificial intelligence. Information 2020, 11, 193. [Google Scholar] [CrossRef]
- Timeit—Measure Execution Time of Small Code Snippets. Available online: https://docs.python.org/3/library/timeit.html (accessed on 2 April 2023).
- Github: Fenrus75/Powertop. Available online: https://github.com/fenrus75/powertop (accessed on 2 April 2023).
- nvidia-smi.txt. Available online: https://developer.download.nvidia.com/compute/DCGM/docs/nvidia-smi-367.38.pdf (accessed on 2 April 2023).
- Liu, K.; Tang, H.; He, S.; Yu, Q.; Xiong, Y.; Wang, N. Performance validation of YOLO variants for object detection. In Proceedings of the 2021 International Conference on Bioinformatics and Intelligent Computing, Harbin, China, 22–24 January 2021; pp. 239–243. [Google Scholar]
Disclaimer/Publisher’s Note: The statements, opinions and data contained in all publications are solely those of the individual author(s) and contributor(s) and not of MDPI and/or the editor(s). MDPI and/or the editor(s) disclaim responsibility for any injury to people or property resulting from any ideas, methods, instructions or products referred to in the content. |
© 2023 by the authors. Licensee MDPI, Basel, Switzerland. This article is an open access article distributed under the terms and conditions of the Creative Commons Attribution (CC BY) license (https://creativecommons.org/licenses/by/4.0/).