

Effects of Running in Minimal, Maximal and Conventional Footwear on Tibial Stress Fracture Probability: An Examination Using Finite Element and Probabilistic Analyses


Abstract
1. Introduction
2. Materials and Methods
2.1. Participants
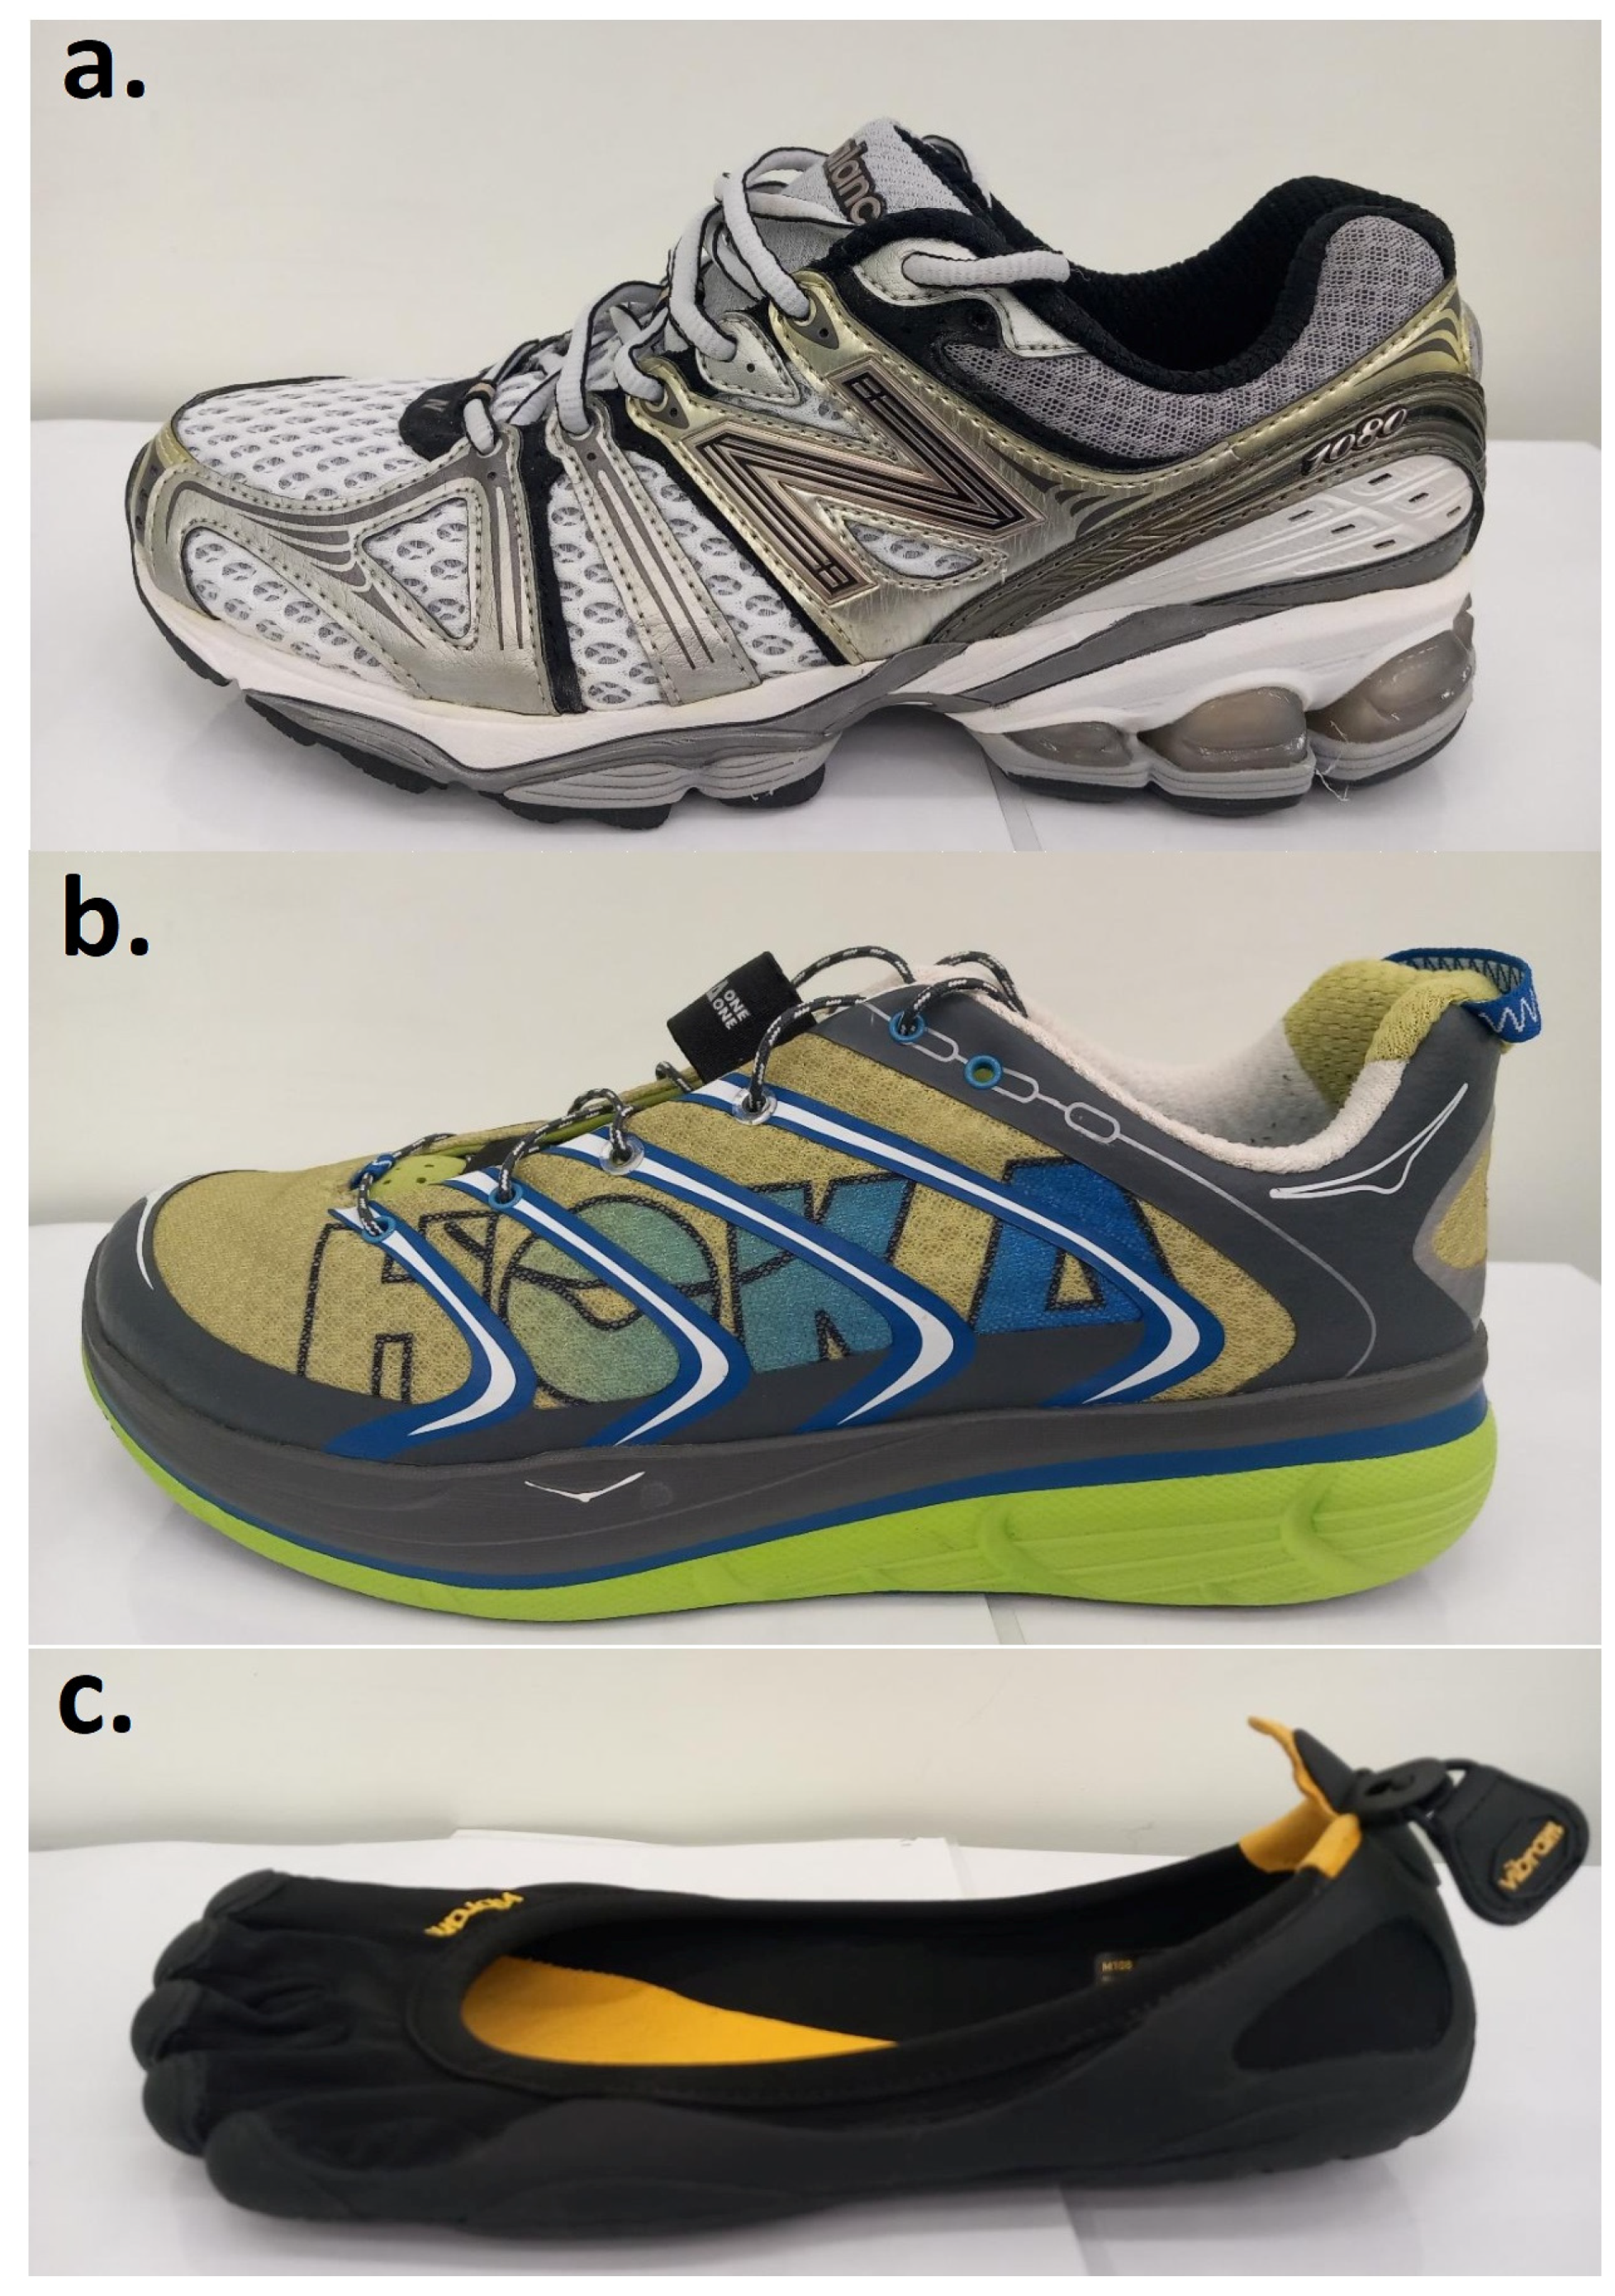
2.2. Footwear
2.3. Procedure
2.4. Processing
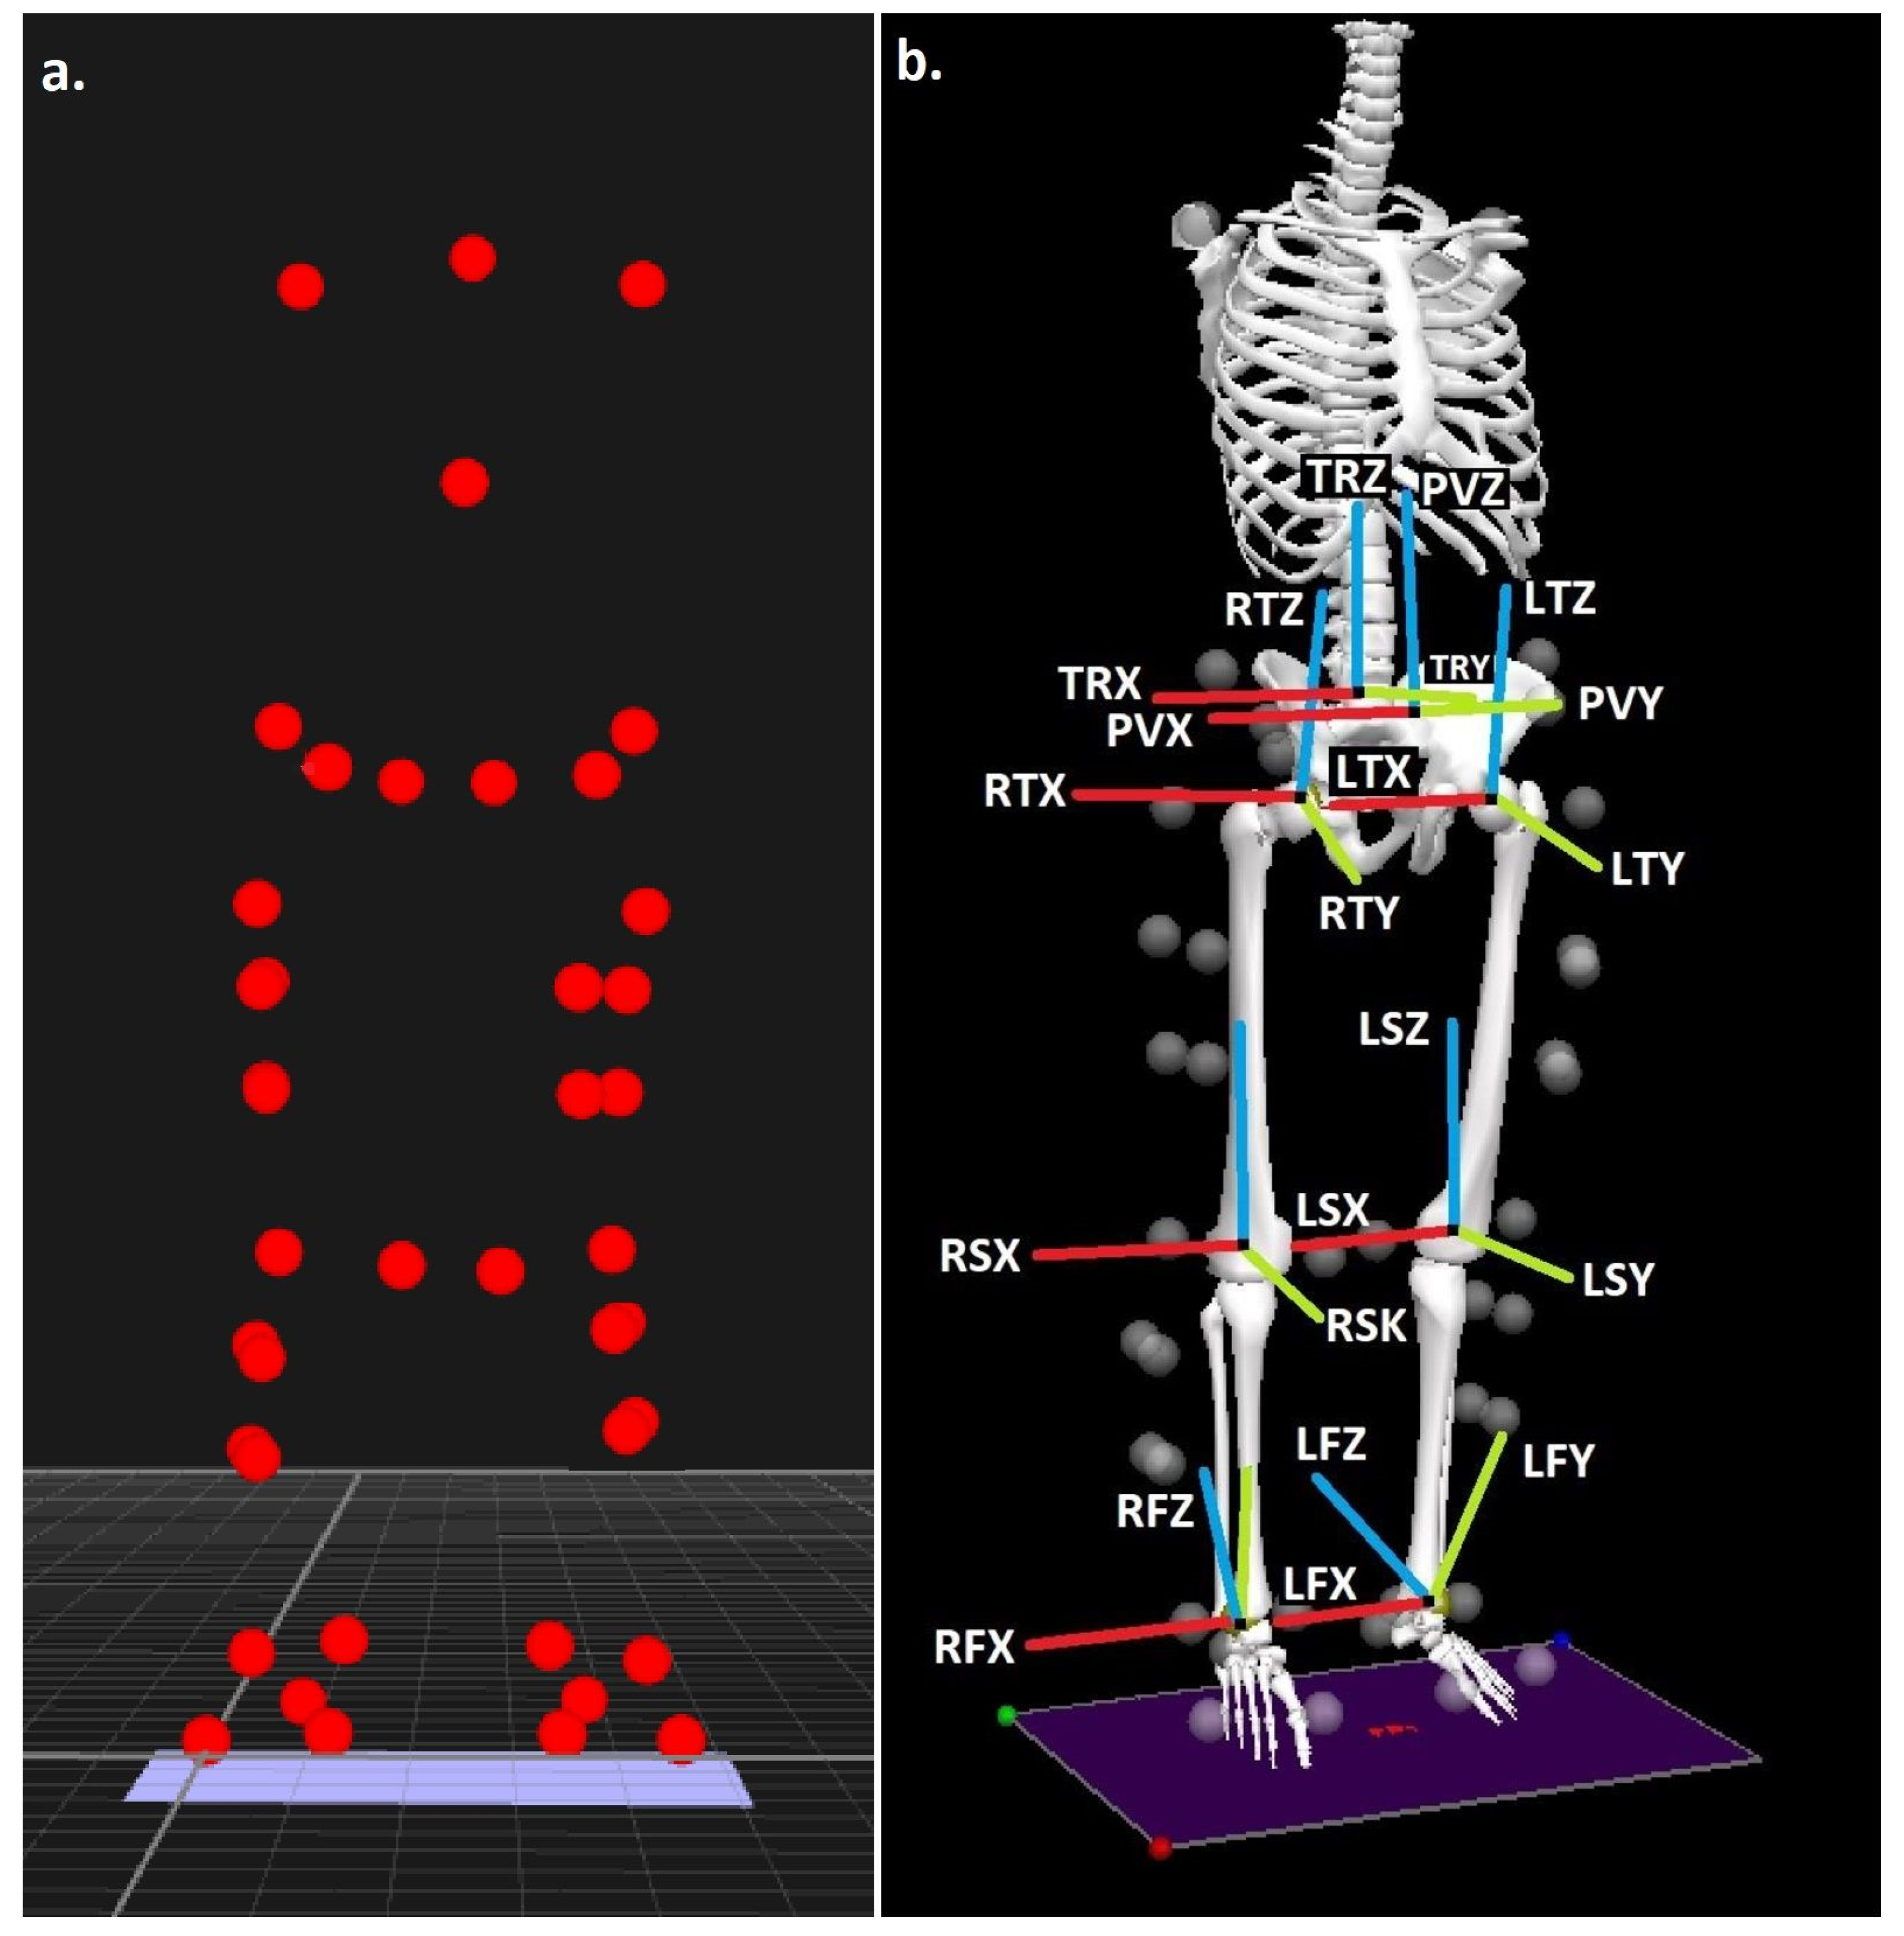
2.4.1. Running Biomechanics
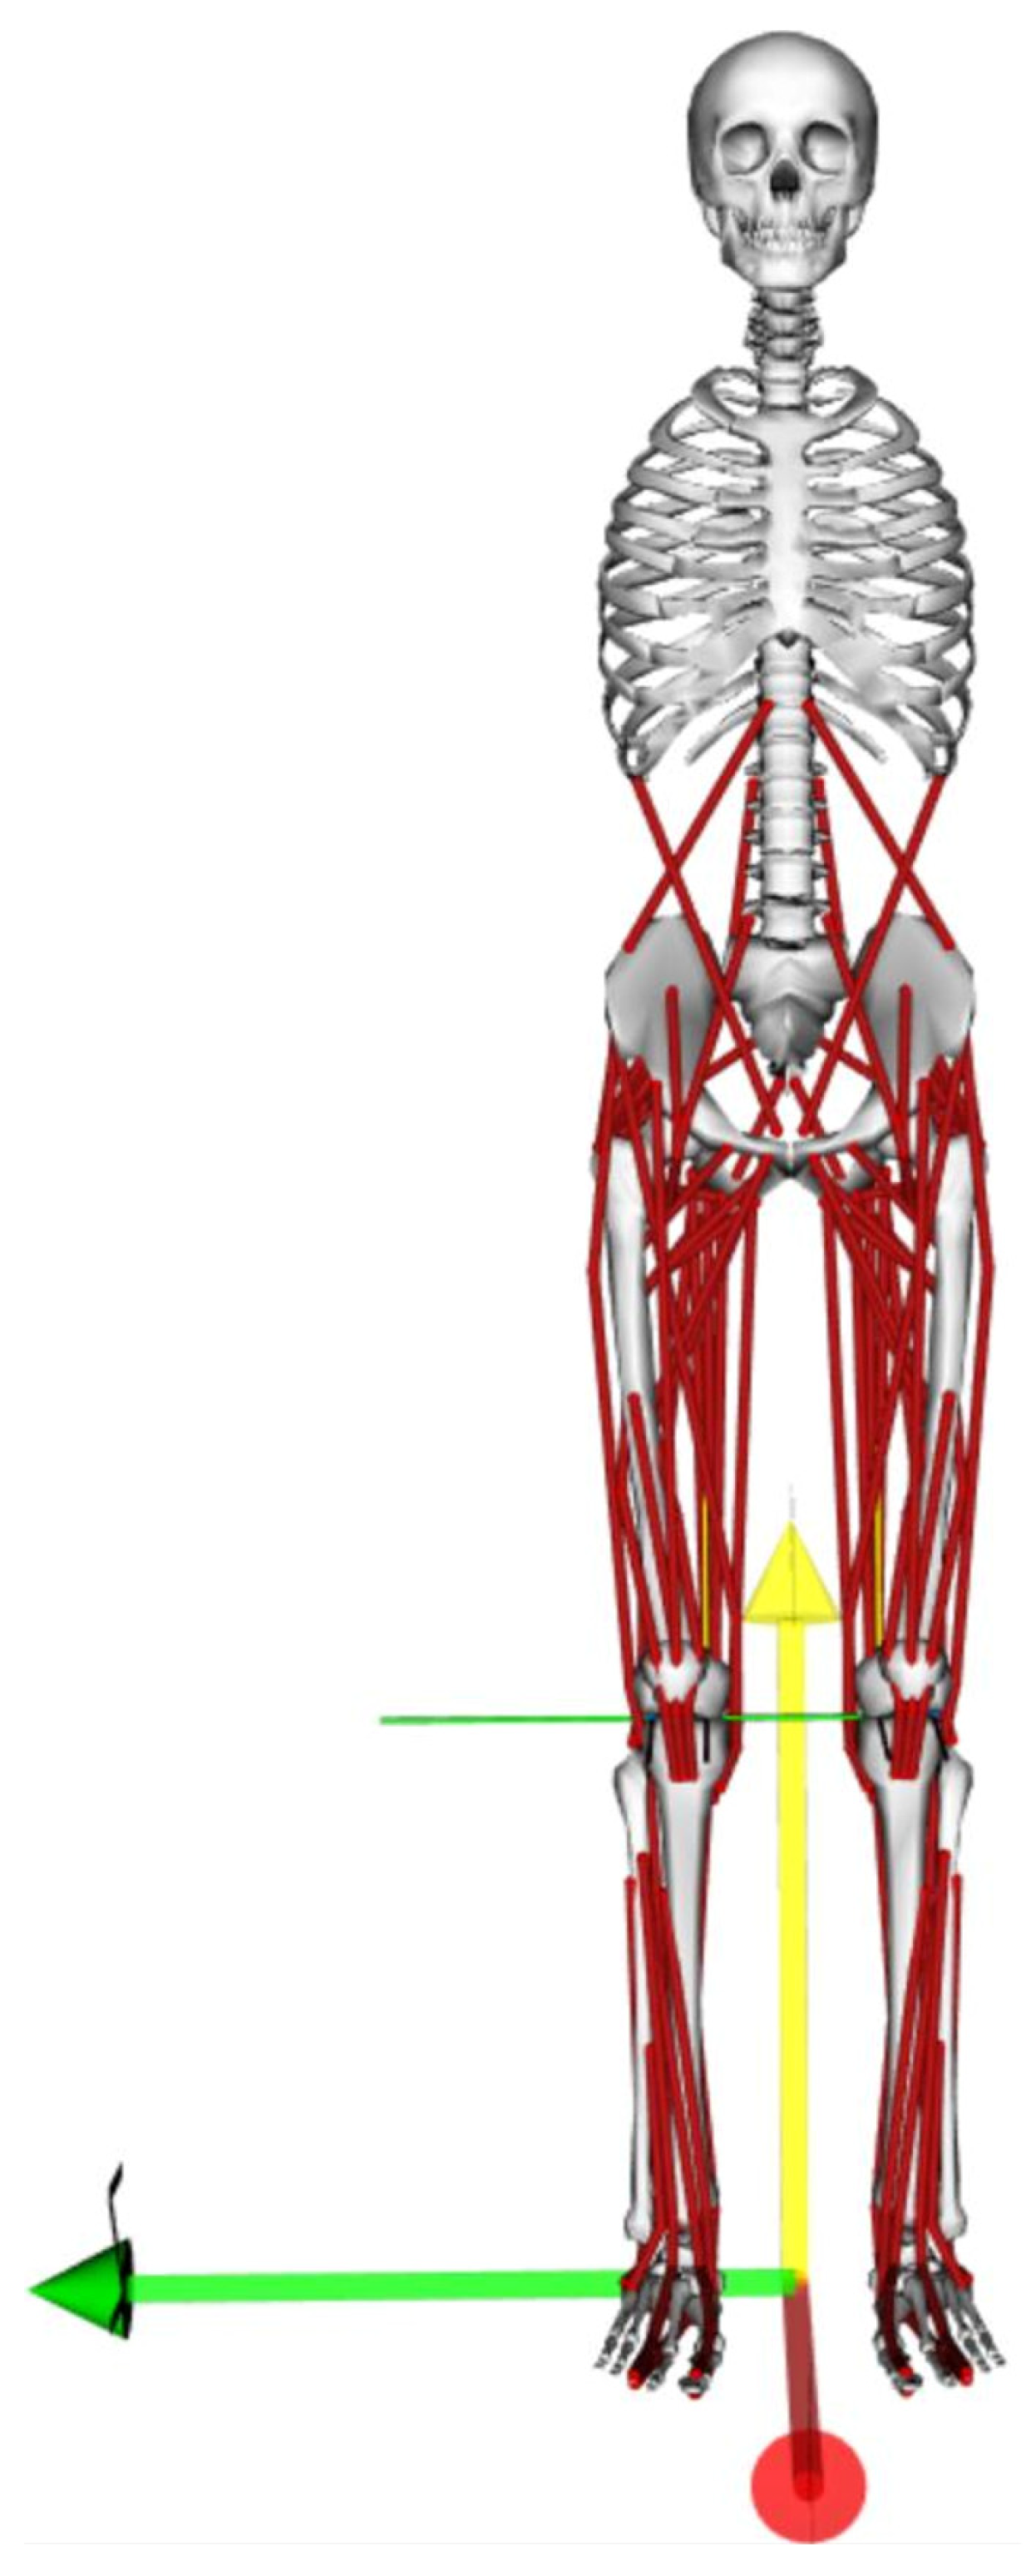
2.4.2. Musculoskeletal Simulation
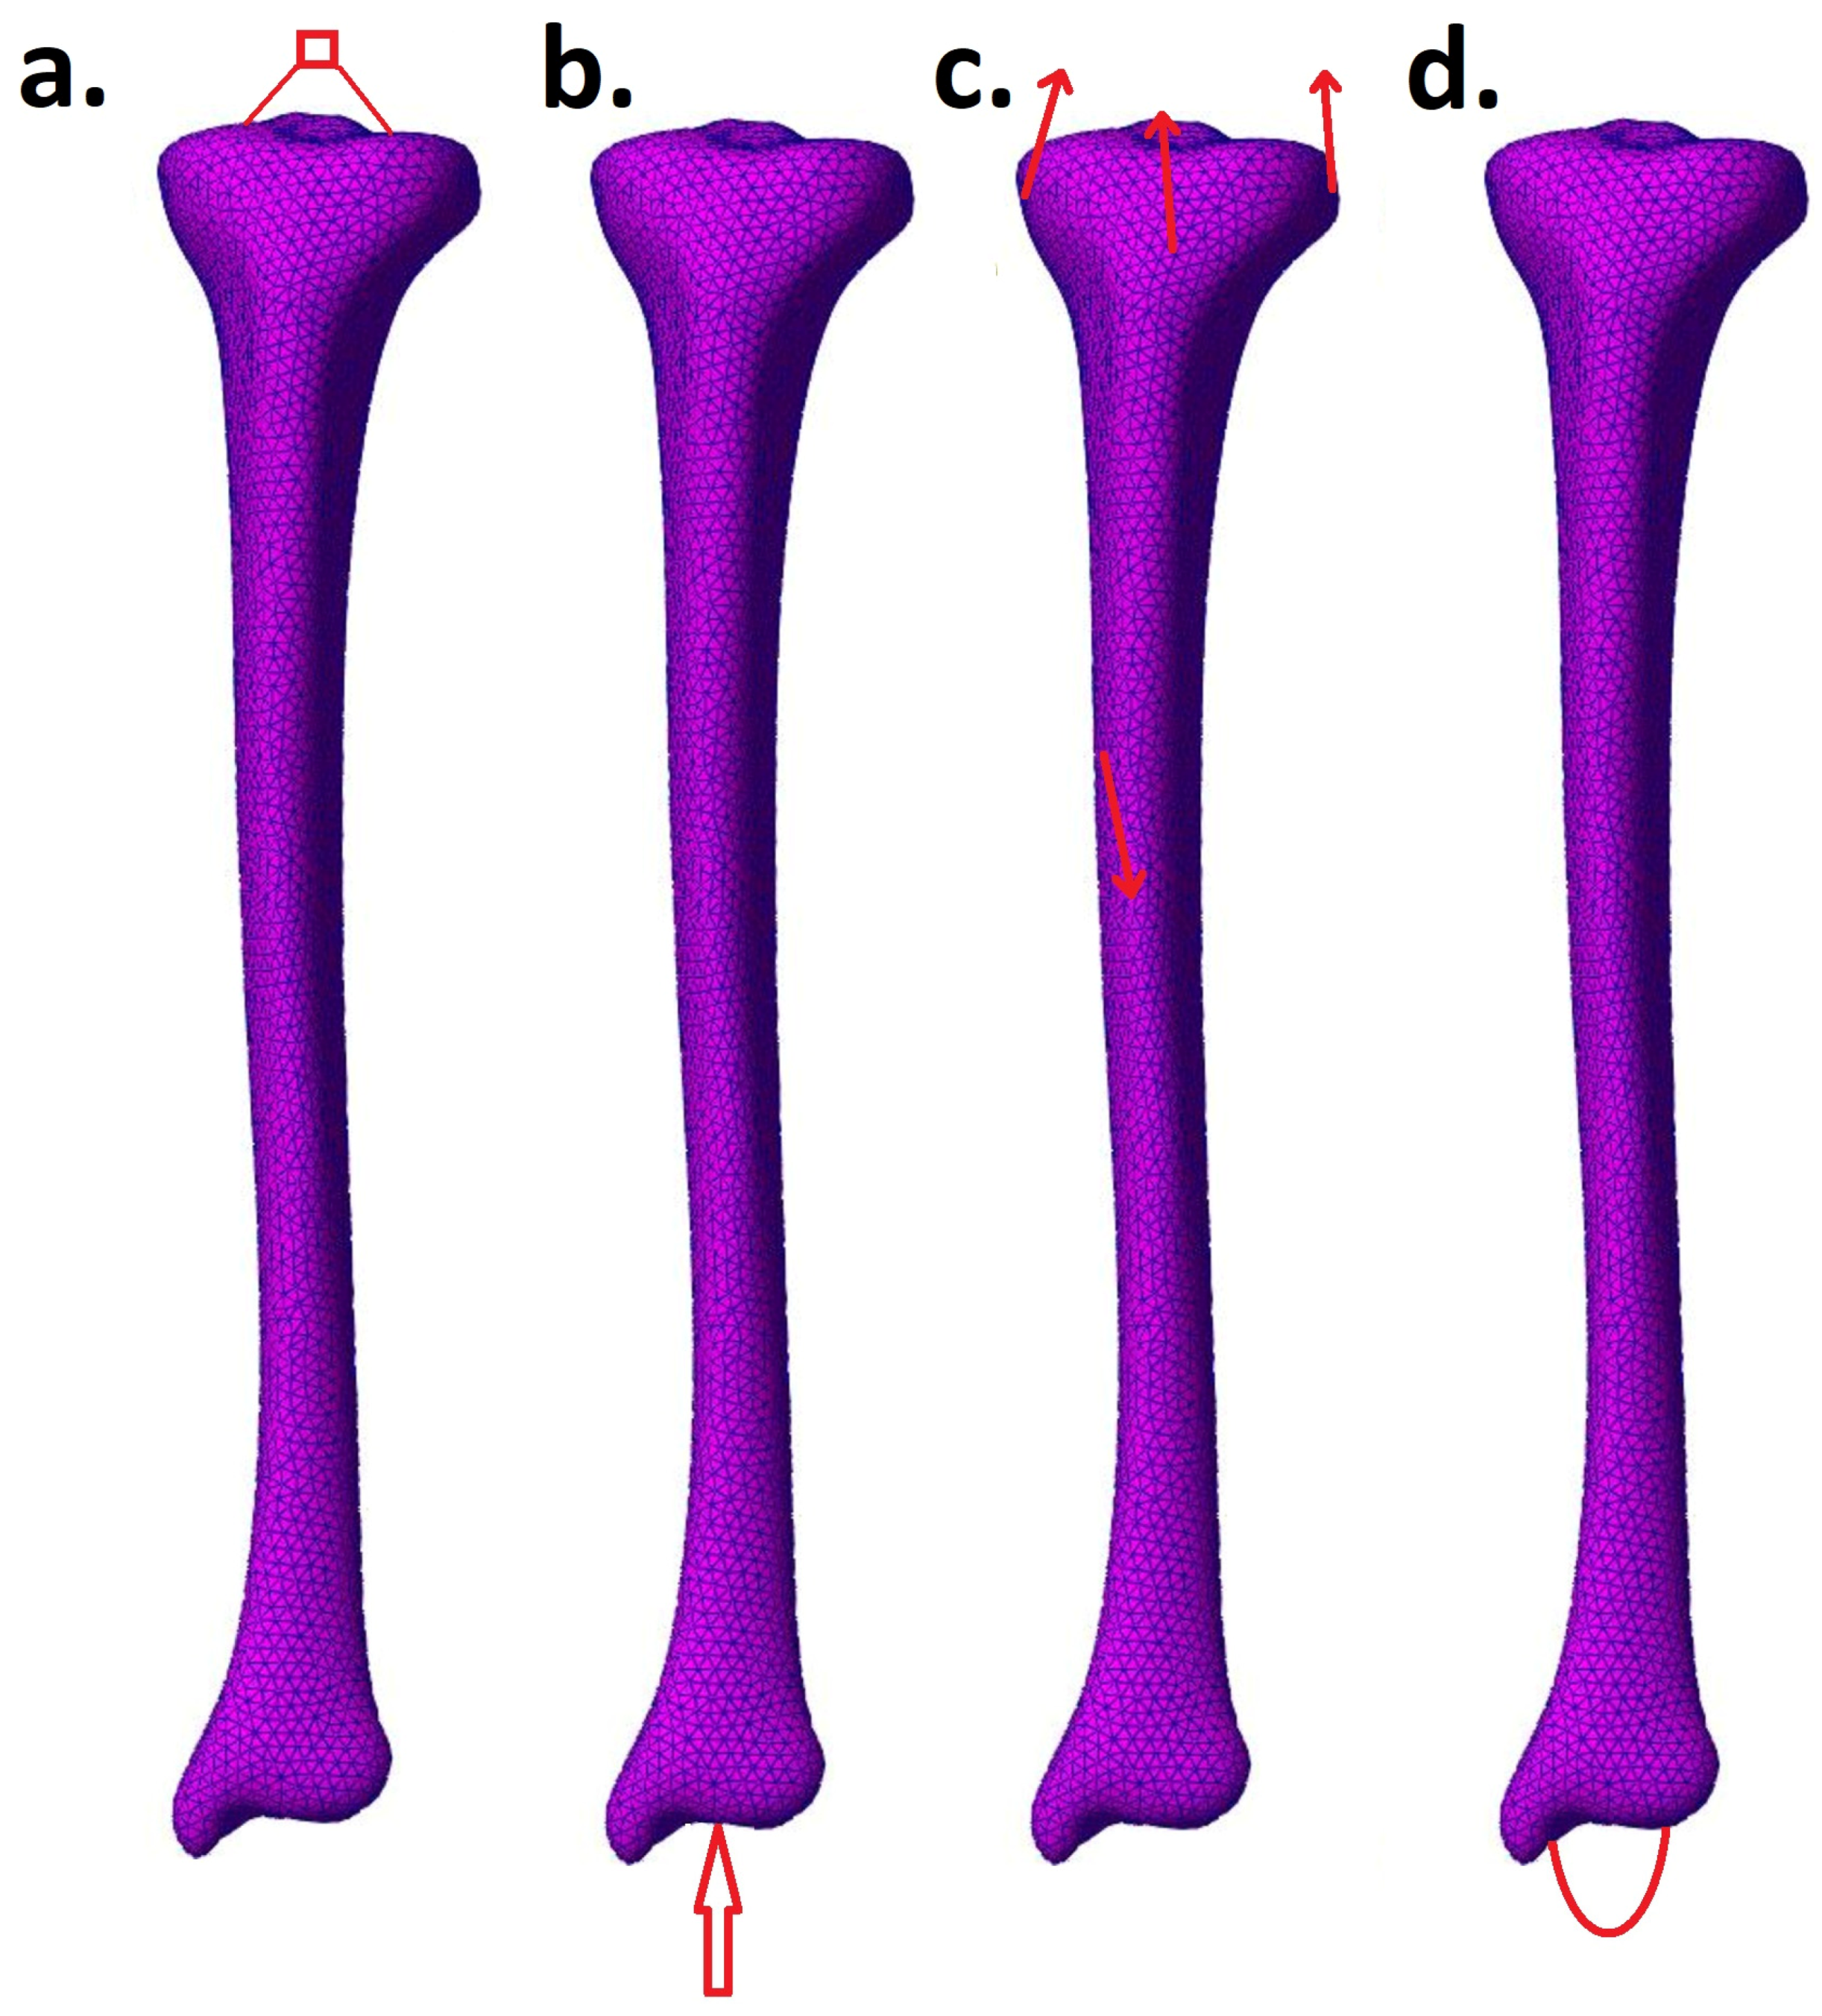
2.4.3. Finite Element Analyses
2.4.4. Probabilistic Stress Fracture Model
2.5. Statistical Analyses
3. Results
3.1. Running Biomechanics (Described in Section 2.4.1)
3.2. Musculoskeletal Simulation (Described in Section 2.4.2)
3.2.1. Ankle Joint Contact Forces and Muscle Forces
3.2.2. Muscle Forces
3.2.3. Anatomically Directed Muscle Forces Onto the Tibia
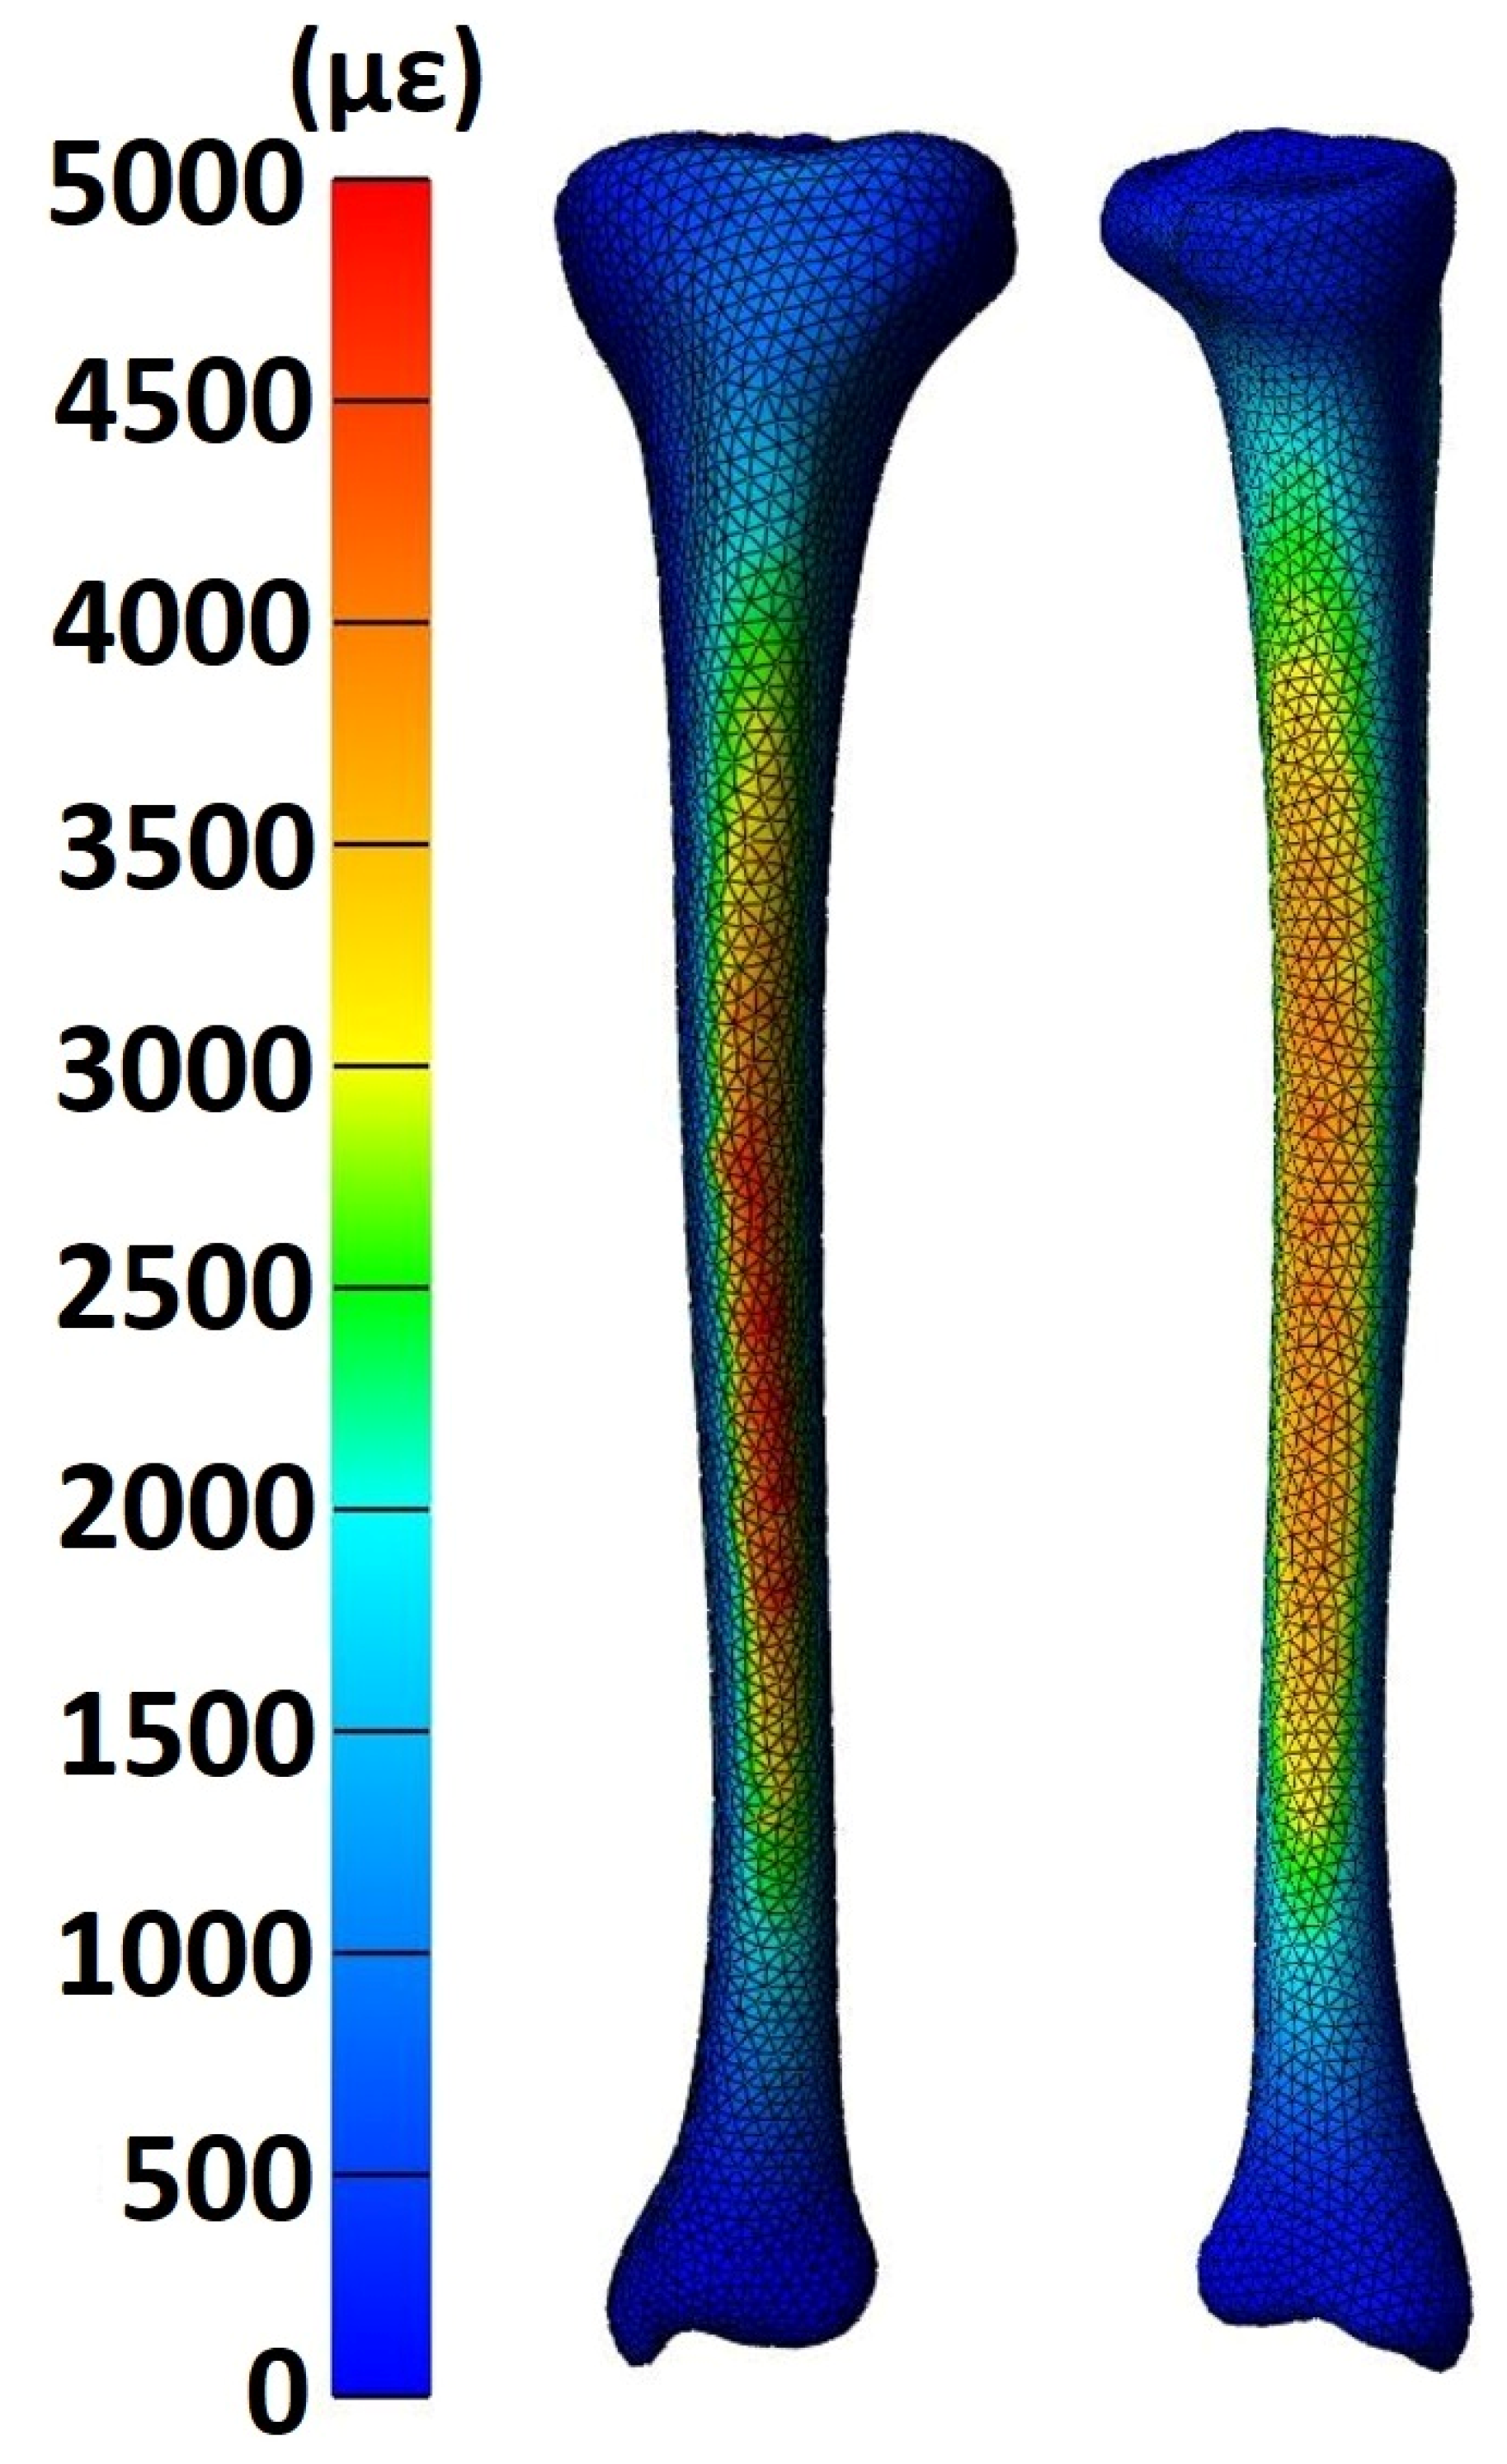
3.3. Finite Element Analysis (Described in Section 2.4.3)
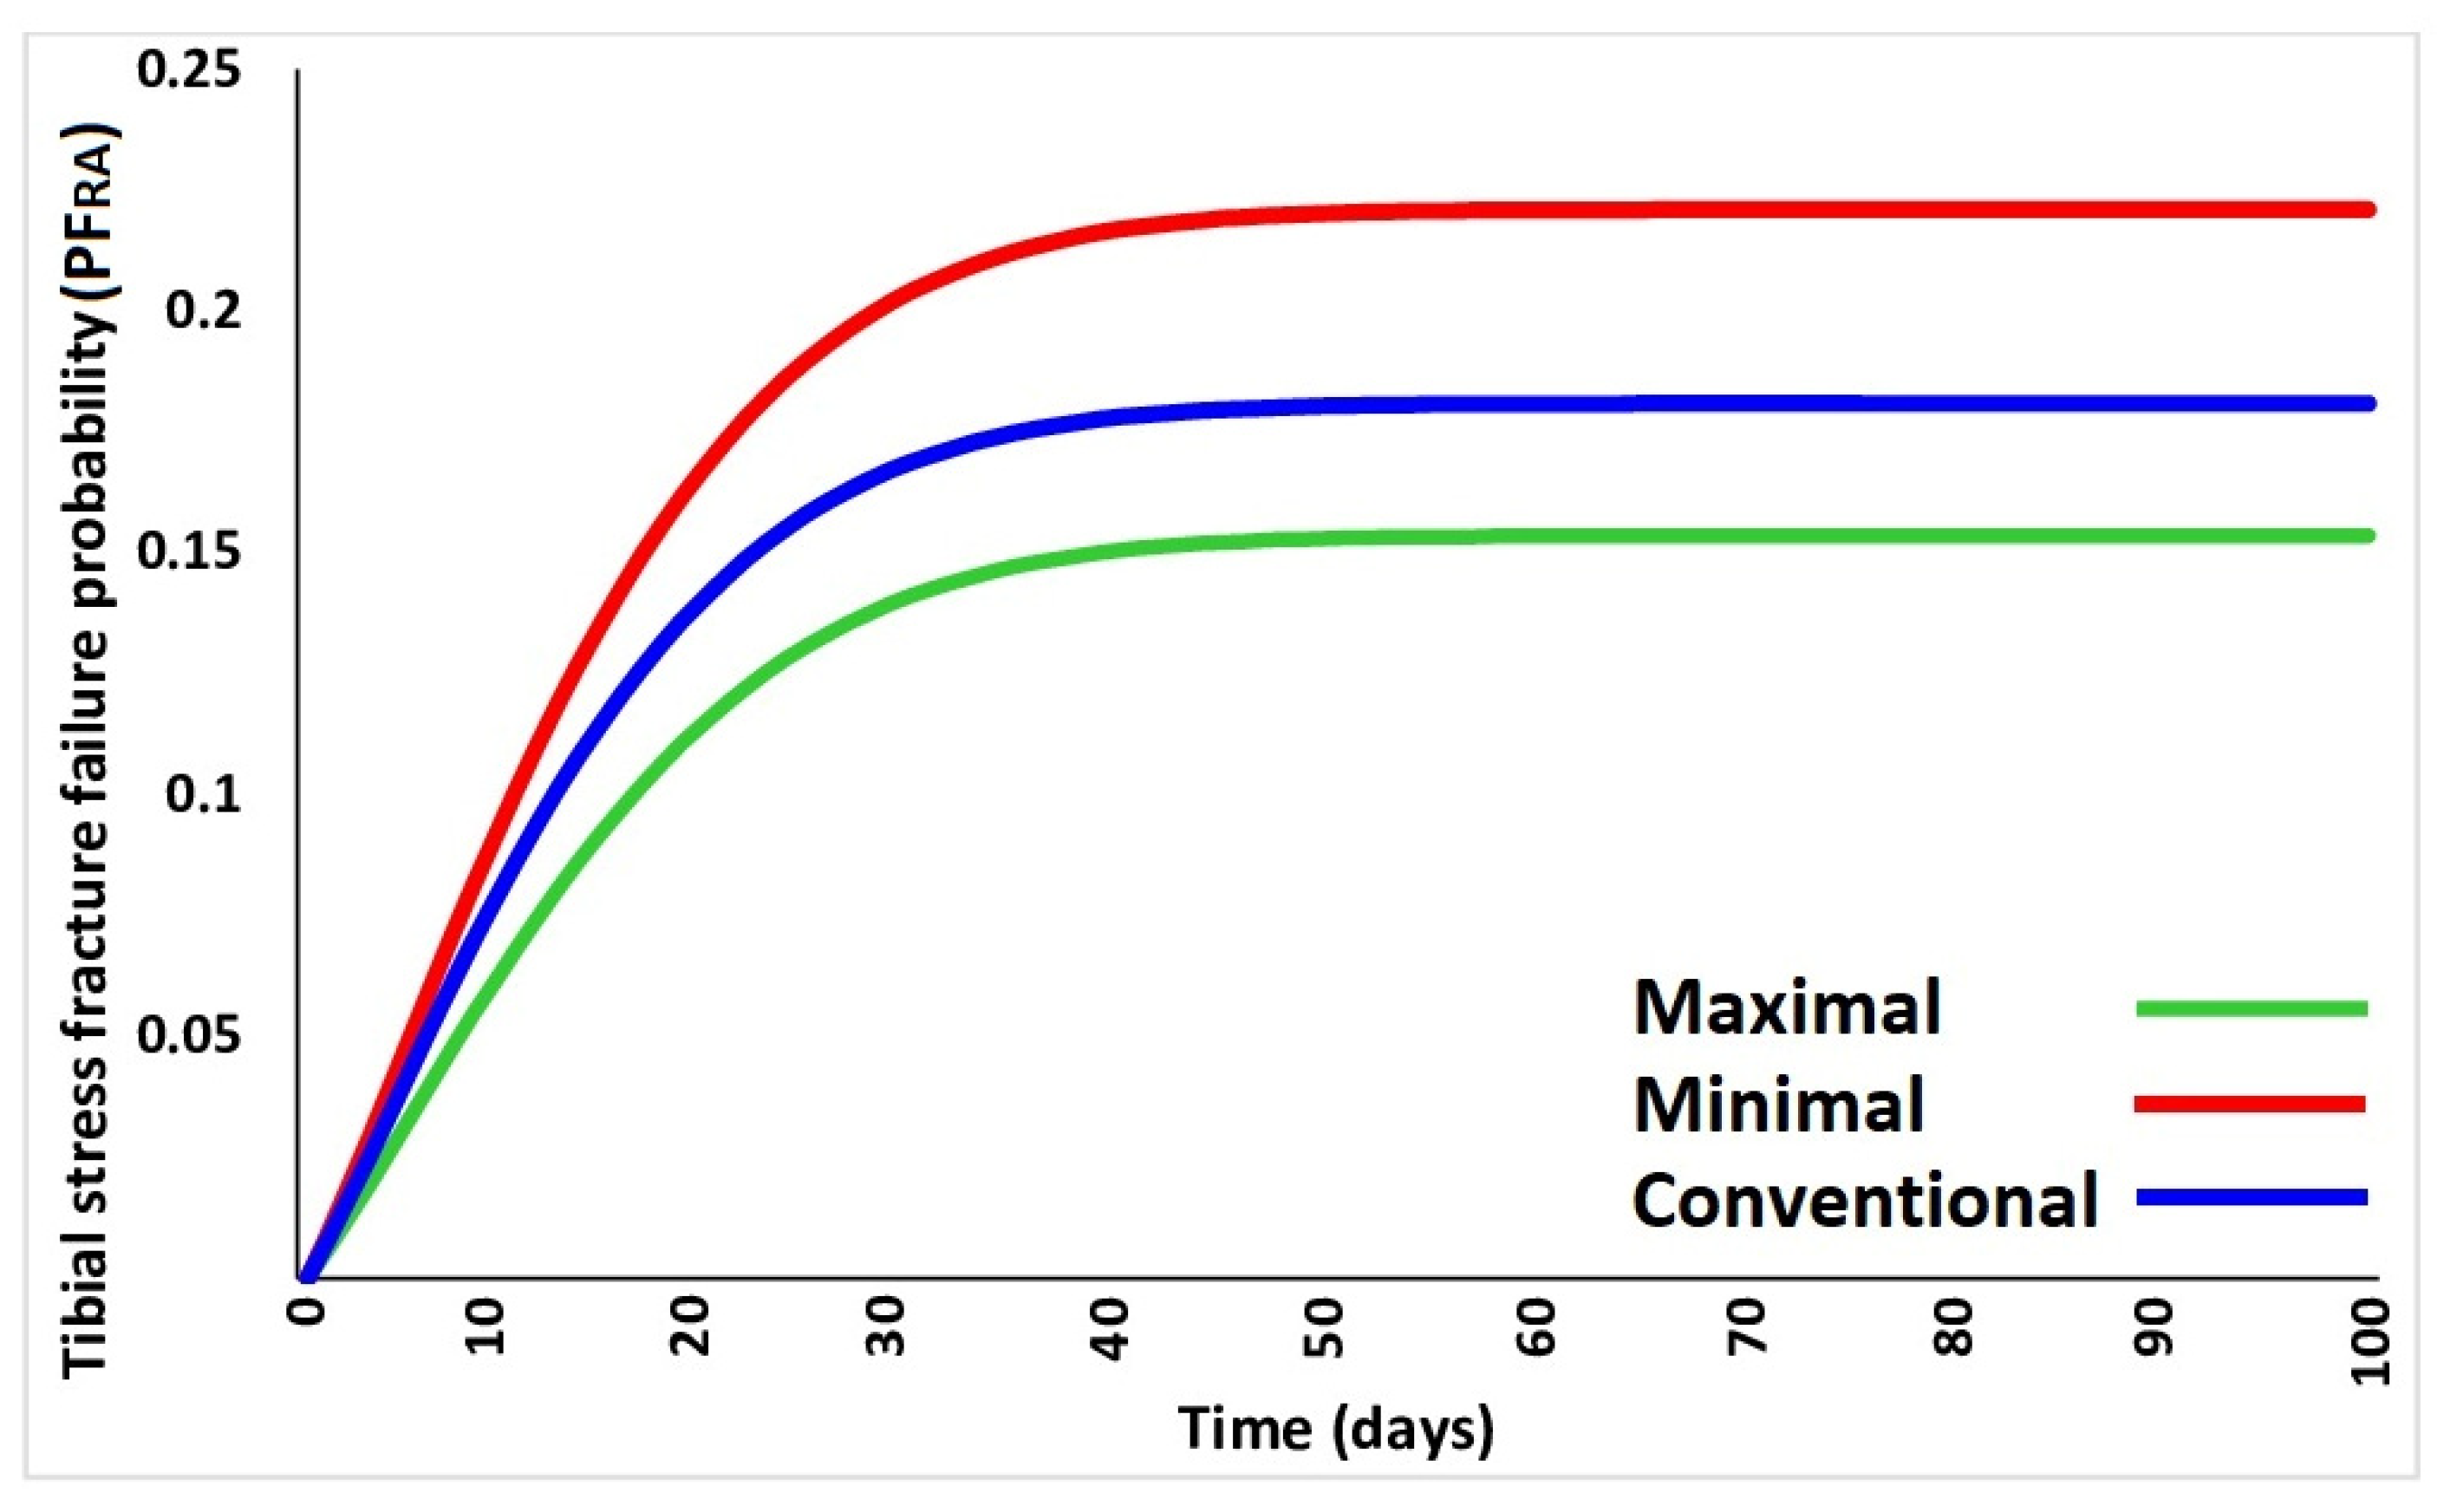
3.4. Stress Fracture Probability (Described in Section 2.4.4)
4. Discussion
5. Conclusions
Author Contributions
Funding
Institutional Review Board Statement
Informed Consent Statement
Data Availability Statement
Acknowledgments
Conflicts of Interest
References
- Lee, D.-C.; Pate, R.R.; Lavie, C.J.; Sui, X.; Church, T.S.; Blair, S.N. Leisure-Time Running Reduces all-Cause and Cardiovascular Mortality Risk. J. Am. Coll. Cardiol. 2014, 64, 472–481. [Google Scholar] [CrossRef] [PubMed]
- Pereira, H.V.; Palmeira, A.L.; Encantado, J.; Marques, M.M.; Santos, I.; Carraça, E.V.; Teixeira, P.J. Systematic Review of Psychological and Behavioral Correlates of Recreational Running. Front. Psychol. 2021, 12, 1162. [Google Scholar] [CrossRef]
- van Gent, R.N.; Siem, D.; van Middelkoop, M.; van Os, A.G.; A Bierma-Zeinstra, S.M.; Koes, B.W.; E Taunton, J. Incidence and determinants of lower extremity running injuries in long distance runners: A systematic review. Br. J. Sports Med. 2007, 41, 469–480. [Google Scholar] [CrossRef]
- Aicale, R.; Tarantino, D.; Maffulli, N. Overuse injuries in sport: A comprehensive overview. J. Orthop. Surg. Res. 2018, 13, 309. [Google Scholar] [CrossRef] [PubMed]
- Fredericson, M.; Jennings, F.; Beaulieu, C.; Matheson, G.O. Stress fractures in athletes. Top Magn Reson Imaging. 2006, 17, 309–325. [Google Scholar] [CrossRef]
- Milner, C.E.; Ferber, R.; Pollard, C.D.; Hamill, J.; Davis, I.S. Biomechanical Factors Associated with Tibial Stress Fracture in Female Runners. Med. Sci. Sports Exerc. 2006, 38, 323–328. [Google Scholar] [CrossRef]
- E Taunton, J.; Ryan, M.B.; Clement, D.B.; McKenzie, D.C.; Lloyd-Smith, D.R.; Zumbo, B.D. A retrospective case-control analysis of 2002 running injuries. Br. J. Sports Med. 2002, 36, 95–101. [Google Scholar] [CrossRef]
- Armstrong, D.W.; Rue, J.-P.H.; Wilckens, J.H.; Frassica, F.J. Stress fracture injury in young military men and women. Bone 2004, 35, 806–816. [Google Scholar] [CrossRef]
- Robertson, G.A.J.; Wood, A.M. Lower limb stress fractures in sport: Optimising their management and outcome. World J. Orthop. 2017, 8, 242–255. [Google Scholar] [CrossRef] [PubMed]
- Robertson, G.A.J.; Wood, A.M. Return to sports after stress fractures of the tibial diaphysis: A systematic review. Br. Med. Bull. 2015, 114, 95–111. [Google Scholar] [CrossRef][Green Version]
- Gallagher, S.; Schall, M.C., Jr. Musculoskeletal disorders as a fatigue failure process: Evidence, implications and research needs. Ergonomics 2017, 60, 255–269. [Google Scholar] [CrossRef] [PubMed]
- Pattin, C.A.; Caler, W.E.; Carter, D.R. Cyclic mechanical property degradation during fatigue loading of cortical bone. J. Biomech. 1996, 29, 69–79. [Google Scholar] [CrossRef] [PubMed]
- Schaffler, M.; Radin, E.; Burr, D. Long-term fatigue behavior of compact bone at low strain magnitude and rate. Bone 1990, 11, 321–326. [Google Scholar] [CrossRef] [PubMed]
- Carter, D.R.; Caler, W.E.; Spengler, D.M.; Frankel, V.H. Fatigue Behavior of Adult Cortical Bone: The Influence of Mean Strain and Strain Range. Acta Orthop. 1981, 52, 481–490. [Google Scholar] [CrossRef]
- Burr, D.B.; Turner, C.H.; Naick, P.; Forwood, M.R.; Ambrosius, W.; Hasan, M.S.; Pidaparti, R. Does microdamage accumulation affect the mechanical properties of bone? J. Biomech. 1998, 31, 337–345. [Google Scholar] [CrossRef] [PubMed]
- Chamay, A.; Tschantz, P. Mechanical influences in bone remodeling. Experimental research on Wolff’s law. J. Biomech. 1972, 5, 173–180. [Google Scholar] [CrossRef] [PubMed]
- Burr, D.B.; Martin, R.; Schaffler, M.B.; Radin, E.L. Bone remodeling in response to in vivo fatigue microdamage. J. Biomech. 1985, 18, 189–200. [Google Scholar] [CrossRef] [PubMed]
- Gross, T.S.; Edwards, J.L.; Mcleod, K.J.; Rubin, C.T. Strain gradients correlate with sites of periosteal bone formation. J. Bone Miner. Res. 1997, 12, 982–988. [Google Scholar] [CrossRef]
- Sinclair, J.; Fau-Goodwin, J.; Richards, J.; Shore, H. The influence of minimalist and maximalist footwear on the kinetics and kinematics of running. Footwear Sci. 2016, 8, 33–39. [Google Scholar] [CrossRef]
- Esculier, J.-F.; Dubois, B.; Dionne, C.E.; Leblond, J.; Roy, J.-S. A consensus definition and rating scale for minimalist shoes. J. Foot Ankle Res. 2015, 8, 42. [Google Scholar] [CrossRef] [PubMed]
- Zandbergen, M.A.; Ter Wengel, X.J.; van Middelaar, R.P.; Buurke, J.H.; Veltink, P.H.; Reenalda, J. Peak tibial acceleration should not be used as indicator of tibial bone loading during running. Sports Biomech. 2023, 1–18. [Google Scholar] [CrossRef] [PubMed]
- Sinclair, J.; Hobbs, S.; Currigan, G.; Taylor, P. A comparison of several barefoot inspired footwear models in relation to barefoot and conventional running footwear. Comp. Exerc. Physiol. 2013, 9, 13–21. [Google Scholar] [CrossRef]
- Hannigan, J.; Pollard, C.D. Differences in running biomechanics between a maximal, traditional, and minimal running shoe. J. Sci. Med. Sport 2020, 23, 15–19. [Google Scholar] [CrossRef] [PubMed]
- Chan, Z.Y.S.; Au, I.P.H.; Lau, F.O.Y.; Ching, E.C.K.; Zhang, J.H.; Cheung, R.T.H. Does maximalist footwear lower impact loading during level ground and downhill running? Eur. J. Sport Sci. 2018, 18, 1083–1089. [Google Scholar] [CrossRef]
- Edwards, W.B.; Taylor, D.; Rudolphi, T.J.; Gillette, J.C.; Derrick, T.R. Effects of Stride Length and Running Mileage on a Probabilistic Stress Fracture Model. Med. Sci. Sports Exerc. 2009, 41, 2177–2184. [Google Scholar] [CrossRef]
- Edwards, W.B.; Taylor, D.; Rudolphi, T.J.; Gillette, J.C.; Derrick, T.R. Effects of running speed on a probabilistic stress fracture model. Clin. Biomech. 2010, 25, 372–377. [Google Scholar] [CrossRef]
- Sinclair, J.; Brooks, D.; Taylor, P.J.; Liles, N.B. Effects of running in minimal, maximal and traditional running shoes: A musculoskeletal simulation exploration using statistical parametric mapping and Bayesian analyses. Footwear Sci. 2021, 13, 143–156. [Google Scholar] [CrossRef]
- Cappozzo, A.; Catani, F.; Della Croce, U.; Leardini, A. Position and orientation in space of bones during movement: Anatomical frame definition and determination. Clin. Biomech. 1995, 10, 171–178. [Google Scholar] [CrossRef]
- Sinclair, J.; Taylor, P.J.; Hobbs, S.J. Digital Filtering of Three-Dimensional Lower Extremity Kinematics: An Assessment. J. Hum. Kinet. 2013, 39, 25–36. [Google Scholar] [CrossRef]
- Addison, B.J.; Lieberman, D.E. Tradeoffs between impact loading rate, vertical impulse and effective mass for walkers and heel strike runners wearing footwear of varying stiffness. J. Biomech. 2015, 48, 1318–1324. [Google Scholar] [CrossRef]
- Lieberman, D.E.; Venkadesan, M.; Werbel, W.A.; Daoud, A.I.; D’andrea, S.; Davis, I.S.; Mang’eni, R.O.; Pitsiladis, Y. Foot strike patterns and collision forces in habitually barefoot versus shod runners. Nature 2010, 463, 531–535. [Google Scholar] [CrossRef] [PubMed]
- Chi, K.-J.; Schmitt, D. Mechanical energy and effective foot mass during impact loading of walking and running. J. Biomech. 2005, 38, 1387–1395. [Google Scholar] [CrossRef] [PubMed]
- Squadrone, R.; Rodano, R.; Hamill, J.; Preatoni, E. Acute effect of different minimalist shoes on foot strike pattern and kinematics in rearfoot strikers during running. J. Sports Sci. 2014, 33, 1196–1204. [Google Scholar] [CrossRef] [PubMed]
- Sinclair, J.; Huang, G.; Taylor, P.J.; Chockalingam, N.; Fan, Y. Effects of Running in Minimal and Conventional Footwear on Medial Tibiofemoral Cartilage Failure Probability in Habitual and Non-Habitual Users. J. Clin. Med. 2022, 11, 7335. [Google Scholar] [CrossRef] [PubMed]
- Lerner, Z.F.; DeMers, M.S.; Delp, S.L.; Browning, R.C. How tibiofemoral alignment and contact locations affect predictions of medial and lateral tibiofemoral contact forces. J. Biomech. 2015, 48, 644–650. [Google Scholar] [CrossRef]
- Delp, S.L.; Anderson, F.C.; Arnold, A.S.; Loan, P.; Habib, A.; John, C.T.; Guendelman, E.; Thelen, D.G. OpenSim: Open-Source Software to Create and Analyze Dynamic Simulations of Movement. IEEE Trans. Biomed. Eng. 2007, 54, 1940–1950. [Google Scholar] [CrossRef]
- Steele, K.M.; DeMers, M.S.; Schwartz, M.H.; Delp, S.L. Compressive tibiofemoral force during crouch gait. Gait Posture 2012, 35, 556–560. [Google Scholar] [CrossRef]
- Herzog, W.; Clark, A.; Wu, J. Resultant and local loading in models of joint disease. Arthritis Care Res. Off. J. Am. Coll. Rheumatol. 2003, 49, 239–247. [Google Scholar] [CrossRef]
- van Arkel, R.J.; Modenese, L.; Phillips, A.T.; Jeffers, J.R. Hip abduction can prevent posterior edge loading of hip replacements. J. Orthop. Res. 2013, 31, 1172–1179. [Google Scholar] [CrossRef]
- Keast, M.; Bonacci, J.; Fox, A. Geometric variation of the human tibia-fibula: A public dataset of tibia-fibula surface meshes and statistical shape model. PeerJ 2023, 11, e14708. [Google Scholar] [CrossRef]
- Chen, T.; An, W.; Chan, Z.; Au, I.; Zhang, Z.; Cheung, R. Immediate effects of modified landing pattern on a probabilistic tibial stress fracture model in runners. Clin. Biomech. 2016, 33, 49–54. [Google Scholar] [CrossRef] [PubMed]
- Bruce, O.L.; Baggaley, M.; Khassetarash, A.; Haider, I.T.; Edwards, W.B. Tibial-fibular geometry and density variations associated with elevated bone strain and sex disparities in young active adults. Bone 2022, 161, 116443. [Google Scholar] [CrossRef]
- Haider, I.T.; Baggaley, M.; Edwards, W.B. Subject-Specific Finite Element Models of the Tibia with Realistic Boundary Conditions Predict Bending Deformations Consistent with In Vivo Measurement. J. Biomech. Eng. 2020, 142, 021010. [Google Scholar] [CrossRef] [PubMed]
- Baggaley, M.; Haider, I.; Bruce, O.; Khassetarash, A.; Edwards, W.B. Tibial Strains During Graded Running. arXiv 2023, arXiv:2305.04139. [Google Scholar]
- Sinclair, J.; Chockalingam, N.; Taylor, P.J. Lower Extremity Kinetics and Kinematics in Runners with Patellofemoral Pain: A Retrospective Case–Control Study Using Musculoskeletal Simulation. Appl. Sci. 2022, 12, 585. [Google Scholar] [CrossRef]
- Carter, D.R.; Caler, W.E. A cumulative damage model for bone fracture. J. Orthop. Res. 1985, 3, 84–90. [Google Scholar] [CrossRef]
- Turner, C.H.; Forwood, M.; Rho, J.; Yoshikawa, T. Mechanical loading thresholds for lamellar and woven bone formation. J. Bone Miner. Res. 1994, 9, 87–97. [Google Scholar] [CrossRef]
- Taylor, D.; Casolari, E.; Bignardi, C. Predicting stress fractures using a probabilistic model of damage, repair and adaptation. J. Orthop. Res. 2004, 22, 487–494. [Google Scholar] [CrossRef]
- Weibull, W. A Statistical Distribution Function of Wide Applicability. J. Appl. Mech. 1951, 18, 293–297. [Google Scholar] [CrossRef]
- Taylor, D.; Kuiper, J.H. The prediction of stress fractures using a ‘stressed volume’ concept. J. Orthop. Res. 2001, 19, 919–926. [Google Scholar] [CrossRef]
- Cohen, J. Statistical Power Analysis for the Behavioral Sciences, 2nd ed.; Lawrence Erlbaum Associates: Hillsdale, NJ, USA, 1988. [Google Scholar]
- Kardouni, J.R.; McKinnon, C.J.; Taylor, K.M.; Hughes, J.M. Timing of Stress Fractures in Soldiers During the First 6 Career Months: A Retrospective Cohort Study. J. Athl. Train. 2021, 56, 1278–1284. [Google Scholar] [CrossRef] [PubMed]
- Bruce, O.L.; Edwards, W.B. Sex disparities in tibia-fibula geometry and density are associated with elevated bone strain in females: A cross-validation study. Bone 2023, 173, 116803. [Google Scholar] [CrossRef] [PubMed]


| Maximal | Minimal | Conventional | |
|---|---|---|---|
| Mass (g) | 318 | 167 | 285 |
| Heel thickness (mm) | 45 | 7 | 25 |
| Heel-toe drop (mm) | 6 | 0 | 14 |
| Esculier et al. (2015) [20] minimalist index | 18 | 92 | 20 |
| Maximal | Minimal | Conventional | |||||
|---|---|---|---|---|---|---|---|
| Mean | SD | Mean | SD | Mean | SD | ||
| Effective mass (%) | 10.89 | 1.76 | 10.09 | 2.01 | 11.47 | 2.61 | |
| Strike index (%) | 17.85 | 3.80 | 34.15 | 19.69 | 14.42 | 9.30 | A, B |
| Step length (m) | 0.90 | 0.08 | 0.89 | 0.07 | 0.90 | 0.08 | B |
| Maximal | Minimal | Conventional | |||||
|---|---|---|---|---|---|---|---|
| Mean | SD | Mean | SD | Mean | SD | ||
| Posterior tibial load (BW) | 2.61 | 0.60 | 2.97 | 0.60 | 2.78 | 0.69 | A |
| Axial tibial load (BW) | 11.29 | 1.03 | 12.06 | 0.93 | 11.50 | 0.98 | A, B |
| Medial tibial load (BW) | 1.02 | 0.48 | 1.27 | 0.39 | 1.12 | 0.51 | A, B, C |
| Biceps femoris long head (BW) | 0.17 | 0.10 | 0.21 | 0.14 | 0.24 | 0.18 | C |
| Biceps femoris short head (BW) | 0.03 | 0.04 | 0.03 | 0.04 | 0.01 | 0.01 | |
| Extensor digitorum longus (BW) | 0.16 | 0.15 | 0.18 | 0.20 | 0.19 | 0.20 | |
| Extensor hallucis longus (BW) | 0.06 | 0.06 | 0.05 | 0.06 | 0.05 | 0.04 | |
| Flexor digitorum longus (BW) | 0.05 | 0.09 | 0.03 | 0.05 | 0.02 | 0.02 | |
| Flexor hallucis longus (BW) | 0.07 | 0.14 | 0.07 | 0.13 | 0.07 | 0.13 | |
| Gracilis (BW) | 0.00 | 0.00 | 0.00 | 0.00 | 0.00 | 0.00 | |
| Rectus femoris (BW) | 1.81 | 0.39 | 1.86 | 0.54 | 1.92 | 0.35 | |
| Sartorius (BW) | 0.05 | 0.05 | 0.08 | 0.08 | 0.07 | 0.06 | |
| Semimembranosus (BW) | 0.35 | 0.20 | 0.32 | 0.25 | 0.28 | 0.20 | C |
| Semitendinosus (BW) | 0.04 | 0.03 | 0.02 | 0.03 | 0.02 | 0.03 | C |
| Soleus (BW) | 5.31 | 0.66 | 5.25 | 0.45 | 5.33 | 0.63 | |
| Tensor fasciae latae (BW) | 0.44 | 0.13 | 0.40 | 0.16 | 0.40 | 0.16 | |
| Tibialis anterior (BW) | 0.08 | 0.12 | 0.02 | 0.02 | 0.03 | 0.02 | |
| Tibialis posterior (BW) | 1.37 | 0.50 | 1.20 | 0.34 | 1.36 | 0.59 | |
| Vastus intermedius (BW) | 1.84 | 0.40 | 1.67 | 0.39 | 1.70 | 0.38 | A, C |
| Vastus lateralis (BW) | 2.51 | 0.55 | 2.27 | 0.53 | 2.31 | 0.55 | A, C |
| Vastus medialis (BW) | 1.73 | 0.37 | 1.56 | 0.36 | 1.60 | 0.35 | A, C |
| Lateral gastrocnemius (BW) | 0.58 | 0.38 | 0.65 | 0.41 | 0.54 | 0.41 | B |
| Medial gastrocnemius (BW) | 1.05 | 0.56 | 1.86 | 0.49 | 1.32 | 0.60 | A, B, C |
| Peroneus brevis (BW) | 0.21 | 0.20 | 0.22 | 0.26 | 0.23 | 0.27 | |
| Peroneus longus (BW) | 0.97 | 0.46 | 1.15 | 0.36 | 1.12 | 0.40 | A |
| Peroneus tertius (BW) | 0.04 | 0.05 | 0.04 | 0.08 | 0.04 | 0.07 | |
| Maximal | Minimal | Conventional | ||||||
|---|---|---|---|---|---|---|---|---|
| Mean | SD | Mean | SD | Mean | SD | |||
| Biceps femoris long head (BW) | A/P | −0.13 | 0.07 | −0.15 | 0.10 | −0.18 | 0.12 | |
| AX | 0.11 | 0.06 | 0.15 | 0.10 | 0.16 | 0.13 | C | |
| M/L | −0.02 | 0.01 | −0.02 | 0.02 | −0.03 | 0.02 | ||
| Biceps femoris short head (BW) | A/P | −0.01 | 0.02 | −0.01 | 0.01 | −0.01 | 0.01 | |
| AX | 0.02 | 0.03 | 0.02 | 0.03 | 0.01 | 0.01 | ||
| M/L | 0.00 | 0.00 | 0.00 | 0.00 | 0.00 | 0.00 | ||
| Extensor digitorum longus (BW) | A/P | 0.05 | 0.04 | 0.04 | 0.07 | 0.08 | 0.09 | |
| AX | −0.10 | 0.07 | −0.09 | 0.07 | −0.12 | 0.12 | ||
| M/L | 0.09 | 0.14 | 0.12 | 0.19 | 0.10 | 0.14 | ||
| Extensor hallucis longus (BW) | A/P | 0.04 | 0.04 | 0.03 | 0.04 | 0.03 | 0.03 | |
| AX | −0.04 | 0.04 | −0.03 | 0.03 | −0.04 | 0.03 | ||
| M/L | 0.02 | 0.03 | 0.02 | 0.04 | 0.01 | 0.01 | ||
| Flexor digitorum longus (BW) | A/P | 0.02 | 0.05 | 0.01 | 0.03 | 0.01 | 0.01 | |
| AX | −0.04 | 0.08 | −0.02 | 0.04 | −0.02 | 0.02 | ||
| M/L | 0.00 | 0.01 | 0.00 | 0.01 | 0.00 | 0.00 | ||
| Flexor hallucis longus (BW) | A/P | 0.03 | 0.07 | 0.03 | 0.07 | 0.03 | 0.06 | |
| AX | −0.07 | 0.12 | −0.06 | 0.11 | −0.06 | 0.11 | ||
| M/L | 0.01 | 0.02 | 0.01 | 0.02 | 0.00 | 0.01 | ||
| Gracilis (BW) | A/P | 0.00 | 0.00 | 0.00 | 0.00 | 0.00 | 0.00 | |
| AX | 0.00 | 0.00 | 0.00 | 0.00 | 0.00 | 0.00 | ||
| M/L | 0.00 | 0.00 | 0.00 | 0.00 | 0.00 | 0.00 | ||
| Rectus femoris (BW) | A/P | 0.24 | 0.06 | 0.27 | 0.07 | 0.27 | 0.06 | |
| AX | 1.78 | 0.39 | 1.83 | 0.53 | 1.89 | 0.35 | ||
| M/L | 0.18 | 0.04 | 0.18 | 0.05 | 0.19 | 0.03 | ||
| Sartorius (BW) | A/P | −0.02 | 0.02 | −0.03 | 0.03 | −0.03 | 0.03 | |
| AX | 0.04 | 0.05 | 0.08 | 0.07 | 0.06 | 0.06 | ||
| M/L | 0.00 | 0.00 | 0.00 | 0.00 | 0.00 | 0.00 | ||
| Semimembranosus (BW) | A/P | −0.25 | 0.13 | −0.22 | 0.16 | −0.20 | 0.14 | C |
| AX | 0.24 | 0.15 | 0.24 | 0.19 | 0.20 | 0.15 | C | |
| M/L | 0.01 | 0.00 | 0.01 | 0.01 | 0.01 | 0.01 | ||
| Semitendinosus (BW) | A/P | −0.03 | 0.02 | −0.02 | 0.02 | −0.01 | 0.02 | C |
| AX | 0.02 | 0.02 | 0.02 | 0.02 | 0.01 | 0.02 | C | |
| M/L | 0.00 | 0.00 | 0.00 | 0.00 | 0.00 | 0.00 | ||
| Soleus (BW) | A/P | −0.65 | 0.10 | −0.62 | 0.09 | −0.64 | 0.10 | |
| AX | −5.26 | 0.65 | −5.21 | 0.45 | −5.29 | 0.62 | ||
| M/L | −0.19 | 0.08 | −0.20 | 0.06 | −0.19 | 0.07 | ||
| Tensor fasciae latae (BW) | A/P | −0.02 | 0.01 | −0.01 | 0.01 | −0.02 | 0.01 | A |
| AX | 0.44 | 0.13 | 0.39 | 0.15 | 0.40 | 0.16 | ||
| M/L | 0.07 | 0.02 | 0.07 | 0.03 | 0.07 | 0.03 | ||
| Tibialis anterior (BW) | A/P | 0.05 | 0.08 | 0.01 | 0.02 | 0.02 | 0.02 | |
| AX | −0.04 | 0.05 | −0.01 | 0.01 | −0.02 | 0.01 | A, B | |
| M/L | 0.03 | 0.08 | 0.01 | 0.01 | 0.00 | 0.01 | ||
| Tibialis posterior (BW) | A/P | 0.52 | 0.19 | 0.48 | 0.16 | 0.52 | 0.22 | |
| AX | −1.26 | 0.47 | −1.09 | 0.32 | −1.25 | 0.56 | ||
| M/L | 0.11 | 0.05 | 0.10 | 0.04 | 0.10 | 0.04 | ||
| Vastus intermedius (BW) | A/P | 0.25 | 0.05 | 0.25 | 0.04 | 0.24 | 0.05 | |
| AX | 1.82 | 0.39 | 1.64 | 0.38 | 1.67 | 0.38 | A, C | |
| M/L | 0.17 | 0.04 | 0.15 | 0.04 | 0.15 | 0.03 | A, C | |
| Vastus lateralis (BW) | A/P | 0.34 | 0.07 | 0.33 | 0.06 | 0.32 | 0.07 | |
| AX | 2.47 | 0.54 | 2.23 | 0.52 | 2.27 | 0.54 | A, C | |
| M/L | 0.32 | 0.07 | 0.29 | 0.07 | 0.30 | 0.07 | A, C | |
| Vastus medialis (BW) | A/P | 0.26 | 0.05 | 0.25 | 0.04 | 0.24 | 0.05 | |
| AX | 1.71 | 0.37 | 1.54 | 0.36 | 1.58 | 0.34 | A, C | |
| M/L | 0.10 | 0.02 | 0.09 | 0.02 | 0.10 | 0.02 | A, C | |
| Maximal | Minimal | Conventional | |||||
|---|---|---|---|---|---|---|---|
| Mean | SD | Mean | SD | Mean | SD | ||
| 90th percentile Von Mises strain (με) | 4069.65 | 852.14 | 4681.13 | 675.55 | 4498.84 | 975.36 | A, C |
| 50th percentile Von Mises strain (με) | 2264.47 | 473.66 | 2604.42 | 375.56 | 2502.89 | 541.93 | A, C |
| Strained Volume (mm3) | 1305.45 | 1653.50 | 2670.33 | 3143.12 | 2444.31 | 3038.11 | A, C |
| Maximal | Minimal | Conventional | |||||
|---|---|---|---|---|---|---|---|
| Mean | SD | Mean | SD | Mean | SD | ||
| Daily loading cycles | 2799.61 | 257.08 | 2835.22 | 255.902 | 2792.33 | 247.41 | B |
| Probability of failure (PFRA) | 0.15 | 0.17 | 0.22 | 0.18 | 0.18 | 0.21 | A |
Disclaimer/Publisher’s Note: The statements, opinions and data contained in all publications are solely those of the individual author(s) and contributor(s) and not of MDPI and/or the editor(s). MDPI and/or the editor(s) disclaim responsibility for any injury to people or property resulting from any ideas, methods, instructions or products referred to in the content. |
© 2023 by the authors. Licensee MDPI, Basel, Switzerland. This article is an open access article distributed under the terms and conditions of the Creative Commons Attribution (CC BY) license (https://creativecommons.org/licenses/by/4.0/).
Share and Cite
Sinclair, J.; Taylor, P.J. Effects of Running in Minimal, Maximal and Conventional Footwear on Tibial Stress Fracture Probability: An Examination Using Finite Element and Probabilistic Analyses. Computation 2023, 11, 248. https://doi.org/10.3390/computation11120248
Sinclair J, Taylor PJ. Effects of Running in Minimal, Maximal and Conventional Footwear on Tibial Stress Fracture Probability: An Examination Using Finite Element and Probabilistic Analyses. Computation. 2023; 11(12):248. https://doi.org/10.3390/computation11120248
Chicago/Turabian StyleSinclair, Jonathan, and Paul John Taylor. 2023. "Effects of Running in Minimal, Maximal and Conventional Footwear on Tibial Stress Fracture Probability: An Examination Using Finite Element and Probabilistic Analyses" Computation 11, no. 12: 248. https://doi.org/10.3390/computation11120248
APA StyleSinclair, J., & Taylor, P. J. (2023). Effects of Running in Minimal, Maximal and Conventional Footwear on Tibial Stress Fracture Probability: An Examination Using Finite Element and Probabilistic Analyses. Computation, 11(12), 248. https://doi.org/10.3390/computation11120248