Article

Effects of the Number of Classes and Pressure Map Resolution on Fine-Grained In-Bed Posture Classification

1
Polytechnic Institute of Castelo Branco, 6000-081 Castelo Branco, Portugal
2
DiSAC—Research Unit on Digital Services, Applications and Content, 6000-767 Castelo Branco, Portugal
*
Author to whom correspondence should be addressed.
Computation 2023, 11(12), 239; https://doi.org/10.3390/computation11120239
Submission received: 10 October 2023 / Revised: 21 November 2023 / Accepted: 29 November 2023 / Published: 2 December 2023
(This article belongs to the Special Issue 10th Anniversary of Computation—Computational Engineering)

Abstract

:
In-bed posture classification has attracted considerable research interest and has significant potential to enhance healthcare applications. Recent works generally use approaches based on pressure maps, machine learning algorithms and focused mainly on finding solutions to obtain high accuracy in posture classification. Typically, these solutions use different datasets with varying numbers of sensors and classify the four main postures (supine, prone, left-facing, and right-facing) or, in some cases, include some variants of those main postures. Following this, this article has three main objectives: fine-grained detection of postures of bedridden people, identifying a large number of postures, including small variations—consideration of 28 different postures will help to better identify the actual position of the bedridden person with a higher accuracy. The number of different postures in this approach is considerably higher than the of those used in any other related work; analyze the impact of pressure map resolution on the posture classification accuracy, which has also not been addressed in other studies; and use the PoPu dataset, a dataset that includes pressure maps from 60 participants and 28 different postures. The dataset was analyzed using five distinct ML algorithms (k-nearest neighbors, linear support vector machines, decision tree, random forest, and multi-layer perceptron). This study’s findings show that the used algorithms achieve high accuracy in 4-posture classification (up to 99% in the case of MLP) using the PoPu dataset, with lower accuracies when attempting the finer-grained 28-posture classification approach (up to 68% in the case of random forest). The results indicate that using ML algorithms for finer-grained applications is possible to specify the patient’s exact position to some degree since the parent posture is still accurately classified. Furthermore, reducing the resolution of the pressure maps seems to affect the classifiers only slightly, which suggests that for applications that do not need finer-granularity, a lower resolution might suffice.

1. Introduction

Over the last few years, several approaches to classifying postures in bedridden people have been proposed. Some of them are based on the use of pressure maps obtained through some type of sensor, normally positioned over the mattress, and the use of machine learning (ML) algorithms. These approaches are not very intrusive and allow classifying the in-bed person’s postures with high levels of accuracy—usually above 90% going up to more than 99% in some studies—when only the four main postures (supine, prone, left facing, and right facing) or fewer postures are considered (e.g., [1,2,3,4]). A systematic review on methods for pressure-based posture classification [5], carried out in 2023, identified and analyzed 22 studies that followed this approach. The studies included in the review, despite being generally similar in the sense that they use pressure maps and ML algorithms, also present significant differences: they are based on datasets with different characteristics, they use different ML algorithms, and they often have different objectives in terms of type and number of postures they intend to classify. Additionally, existing studies mainly focus on searching for solutions to obtain better accuracy values in posture classification. However, there are some issues that need to be investigated in more detail. It is important to evaluate the accuracy of the algorithms in classifying a higher number of postures (in addition to the four main postures normally used) and to evaluate whether it is possible to classify them with high levels of accuracy. This will allow us to evaluate the use of these approaches in broader and more reliable healthcare applications. For example, in the case of applications for monitoring pressure ulcers, this will allow more precise monitoring of the body parts in contact with the mattress and identify the need for any action to be taken before further damage is done to the afflicted areas (e.g., shifting the patient’s position). Furthermore, it is also important to evaluate to what extent the number of sensors in the pressure map (i.e., the sensor array resolution) affects classification accuracy, which may help to decide the best resolution of the sensor array to use, considering the purpose for which it will be used.
Thus, the main objectives of this work are as follows:
  • Analyze and validate the use of ML algorithms in the classification of a large number of bedridden people postures, which will help to identify the real position of the bedridden person with high accuracy. Although these algorithms have already been used for posture classification with good results, their application to as many as 28 postures had not yet been evaluated.
  • Analyze the impact of pressure map resolution on the accuracy of ML algorithms in classifying bedridden people postures. There are different studies conducted using varying amounts of sensors, but comparing the results of the different algorithms on the same dataset will allow for a better understanding of how the accuracy is affected by the number of sensors and demonstrate that a solution considering fewer sensors, which is not only cheaper but also computationally lighter, is a viable solution.
  • Use the PoPu dataset [6], one of the datasets that presents a greater number of different postures and a greater number of samples obtained from real people. To the best of our knowledge, this is the first time the dataset has been used in a posture classification study.

2. Related Work

Recently, several studies have been carried out using pressure maps to detect and classify postures in bedridden people (e.g., [1,2,4,7,8,9]). In a systematic review with 22 studies on pressure-based posture classification methods and algorithms [5], published in 2023, several issues related to the characteristics of the datasets used were analyzed, the number of postures and the methods used in posture classification. It was concluded that most of the studies address the use of one or multiple methods for posture classification, namely using pressure data obtained mostly using piezoelectric sensors under a lying-down person. It was also found that most studies usually include the four main postures (supine, prone, facing left, and facing right) but there are some studies that considered a smaller number of postures (e.g., [1,2,4] three postures considered), obtaining an accuracy greater than 99%, and some studies with a higher number of postures, with a significantly lower accuracy of 92.4% when 17 postures are considered (e.g., [1]).
It is important to consider that the different values of accuracy presented in the studies were obtained under different conditions. The methods/algorithms used in addition to the datasets used are quite different, which makes it difficult to compare the results. Regarding methods/algorithms, there has been a growing use of neural networks. As far as datasets are concerned, the differences are very significant. Generally, datasets include some type of pressure image, with most using a matrix of pressure values, but the dimension of the pressure image differs considerably. Additionally, some datasets include additional information such as weight, height, or the body mass index of participants in their data samples. In fact, existing studies have mainly focused on evaluating the accuracy of proposed solutions for posture detection but the conditions under which studies are carried out differ greatly. The number of postures considered is often reduced and it is important to evaluate approaches that allow classifying a higher number of postures, which will increase the accuracy of identifying the actual position of the bedridden person and thus increase their potential interest in other applications. Furthermore, it has not been studied how the dimension of the pressure image would affect the resulting accuracy of the implemented methods.

3. Dataset Description

Bedded or lying-down people’s pressure map datasets are increasingly being used to identify patients’ in-bed postures and can be very useful for enhancing the development of numerous healthcare applications. To be an enabler of new healthcare solutions, the information they provide must be acquired through non-intrusive methods and must allow the rigorous identification of the bedded or lying-down people’s postures. Although there are some publicly available datasets, they usually differ in the characteristics of the sensor array used to obtain the pressure map, the information they collect, and the size of the dataset. A systematic review of lying-down people’s pressure-map datasets [10], published in 2023, identified and characterized nine datasets with pressure map data on lying-down people’s or bedded people’s positions. The datasets included in the review varied in size, with five having fewer than 2600 ([2,11,12,13,14]) and the other four ([15,16,17,18]) datasets having 15,000 or more samples. Six datasets ([2,11,12,13,14,15]) considered a smaller number of poses, up to eight, mostly represented by the four main lying postures. One work ([16]) included 15 postures; another ([18]) included 20. One study ([17]) that used computer-generated data considered 99 different poses. The resolutions of the sensor matrix ranged from 64 sensors displayed in an 8 × 8 resolution to 2048 sensors in a 64 × 32 resolution. Some significant differences between the datasets are related to the resolution of the pressure maps, differences in the postures chosen for the datasets, and the small number of participants in some datasets.
Considering these issues, in this study, a dataset of our authorship was used, the PoPu [6] dataset. The PoPu dataset contains simultaneously collected data from two different sensor sheets, one placed over and one placed under a mattress. In this case, only data from the sheet placed over the mattress sensor were used. The sensor sheet used was a commercially available 180 cm × 78 cm Tactilus [19] with 1728 piezoelectric sensors distributed in a 27 × 64 matrix. The dataset includes data from 60 individuals, namely sex, weight, height, and pressure maps corresponding to 28 different positions (as presented in Table 1), with 7 variations for each of the 4 main positions that are found in most of the literature (supine, prone, facing left, and facing right). For each of the main positions, two variations also include pillow placement. For each variation, 30 data samples representing small variations were acquired. This resulted in a dataset with 50,400 pressure data samples distributed evenly, with 1800 samples for each of the 28 positions. The high number of positions considered and the number of samples are some of the reasons that supported the choice of this dataset, as it will allow a more precise identification of the position of the bedridden person. The dataset also accounts for good distribution regarding the weight, height, and sex parameters, which should be valuable assets not only for the present study but also for any future applications, especially using real-time data. Additionally, to the best of our knowledge, this will be the first study that will use this dataset, which should serve as an important contribution to its validation.

4. Methodology

This section is divided into 2 subsections. The first subsection explores the different algorithms used in the literature and the ones selected for this study. The second subsection contains the information regarding the various experiments done for this study along with their results. The experiments and results (second) subsection is further split into different subsections representing the different experiments.

4.1. Algorithms

As recently published in [5], there have been several works that use artificial intelligence algorithms to detect patients’ in-bed postures based on data collected from pressure sensors. This source of information varies in terms of the number of sensors that can range from 8 x 8 matrices to arrays of 1600 pressure sensors and considering variants of different postures of people in bed (4 to 17 different poses). The number of different identifiable postures also varies from approach to approach, ranging from the detection of just 3 poses to 17. To process this data and carry out the detection based on the collected datasets, several algorithms have also been used. Out of these, some stand out for their popularity and the accuracy they tend to achieve, such as k-nearest neighbors (k-NN), linear support vector machine (SVM), decision tree, random forest, or neural network. In the study published in [5], the relationship between collected pressure data (datasets), the algorithm or processing methods used, and the corresponding accuracy achieved was presented for several approaches published in the last decade. Of the different approaches, the use of neural networks has clearly increased in recent years and has achieved results with greater accuracy (99%). Although they can also achieve good results, other approaches, such as k-NN, are used for comparison purposes.
This work follows an approach in which five of the most commonly used algorithms in the field of posture classification (“Nearest Neighbors”, “Linear SVM”, “Decision Tree”, “Random Forest”, “Neural Network Multilayer Perceptron” (MLP)) are used on various combinations (number of poses (4 and 28) and resolutions (x to y)) of a dataset to analyze the accuracy achieved for different resolution scenarios of the input data and higher number of detectable postures.

4.2. Experiments and Results

This section contains the tests performed on the data in obtaining the most accurate models using the selected algorithms while keeping in mind that the number of data available could result in overfit models. The section is split into four subsections; the first contains the initial experiments using the selected algorithms and all the available data in two different scenarios—one with 4 classes and the other with 28 classes. The second subsection intends to further validate the results from the primary experiments as to demonstrate their validity, not only increasing the number of folds in the cross-fold validation experiments but also using the leave one subject out (LOSO) approach. The third subsection contains the experiment performed to the high granularity classifier, where the main position is given to test whether it will influence the resulting accuracy. The fourth subsection is relative to experimenting with the outcome of using the dataset to train new models using only the pressure data, this means that for this experiment, the additional characteristics (sex, weight, and height) were not used as input parameters. The fifth subsection contains the experimentation and results of lowering the resolution of the pressure data to assess the effectiveness of the resulting models.
For every experiment the library scikit-learn was used, not only for model training but also obtaining the metrics included in the experiments. Furthermore, to facilitate reproducibility of these experiments, the hyperparameters set for each of the selected algorithms were:
  • k-NN: k = 3;
  • SVC: kernel = linear, C = 0.025;
  • Decision tree: max_depth = 30;
  • Random forest: max_depth = 30;
  • Multilayer perceptron: alpha = 0.001, max_iterations = 1000
The calculated classification metrics include the model’s accuracy, precision, recall score and F1 score. These are the most commonly used classification metrics, along with confusion matrices, that will also be included in some examples. Accuracy portrays how accurate the model is by comparing the accurate classification to the total number of predictions, and it was the metric used most when discussing the experimental results. The rest of the metrics used are averaged on account of the multiple postures considered for classification. Precision is the ratio of true positives compared to the number of total positives predicted. Recall is the ratio of true positives compared to the total positives in ground truth. The F1 score metric is the harmonic mean of the precision and recall scores.

4.2.1. Initial Experiments

Using the dataset and selected algorithms, the following steps include testing the effectiveness of the algorithms on said data. This will show how useful the dataset would be for posture classification. For this purpose, and following the methods used by other researchers, the dataset was first tested considering only the 4 main postures (supine, prone, left and right facing) and then using the 28 postures available in the dataset.
The data included in the dataset was modified to function with the proposed algorithms, namely by converting the parameter identifying the sex of the participants into binary values. Furthermore, the values in the pressure map were normalized previous to model training. This means the input data used for the experiments (unless mentioned otherwise) were:
  • Normalized (0–1) pressure values;
  • Participant sex;
  • Participant weight;
  • Participant height.
Since the dataset includes plenty of sample frames, the data were split 60/20/20 for all the following steps (60% of the data were used for training each of the models, 20% for testing, and 20% for validating the resulting models). The split was made so that none of the samples in the training split contained data from samples from volunteers that are found in the other splits. For validation purposes, the models go through k-fold cross-validation (k = 5), and the results presented in this section include the averages of the accuracy results from the cross validation. This means that for each algorithm, there will be 5 different models trained, each with different data splits.
The tables regarding the results of testing the different models will all follow the same format, with the average accuracy percentage, standard deviation for the accuracy, the average precision, average recall, and average F1 score. These values are gathered from applying k-fold cross validation to the model and correspond to the validation of the models.
First, the results for the models trained with only the 4 main postures considered are represented in Table 2.
It is worth noting that the highest accuracy registered for any of the models trained in this experiment was one of the MLP models, with a 98.40% validation accuracy. This is also the highest accuracy out of all of the experiments.
Apart from these results and to better illustrate the outcome of the models, as most have a high accuracy, the confusion matrix (code generated) for one of the algorithms—namely MLP—is displayed in Figure 1, in which each row represents the expected result and each column represents the predicted result for each position. For generating this and following confusion matrices, a model was trained simultaneously, using the same split of 60/20/20, and the values are from the validation of said model.
As portrayed by Figure 1, there are not many incorrect classifications and there does not seem to be a pattern to the ones that are wrongfully classified.
After this, the next step was training different models, using the same algorithms, but considering all 28 postures available in the dataset. The results for this approach are represented in Table 3.
Unlike the 4-posture alternative, the results with 28 postures are quite lower as to their accuracy, with the highest average accuracy being around 64% and the highest model having a validation accuracy of 67.81% (random forest). Figure 2 shows the confusion matrix for the model resulting from the MLP algorithm. As the previous confusion matrix, the rows represent the expected result and the columns represent the result predicted by the model. Furthermore, the classes are represented in the same order (left, prone, right, supine), with 7 rows and columns representing the 7 variations for the main poisitions.
The 28 posture experiment shows that even with a lower accuracy, most classifications are correct, and by observing the wrongfully predicted classes, there seems to be a pattern that indicates that even if the granularity of the postures is higher, the model mostly predicts classes that are of the same main class, as they are mostly encompassed inside the 7 variations.

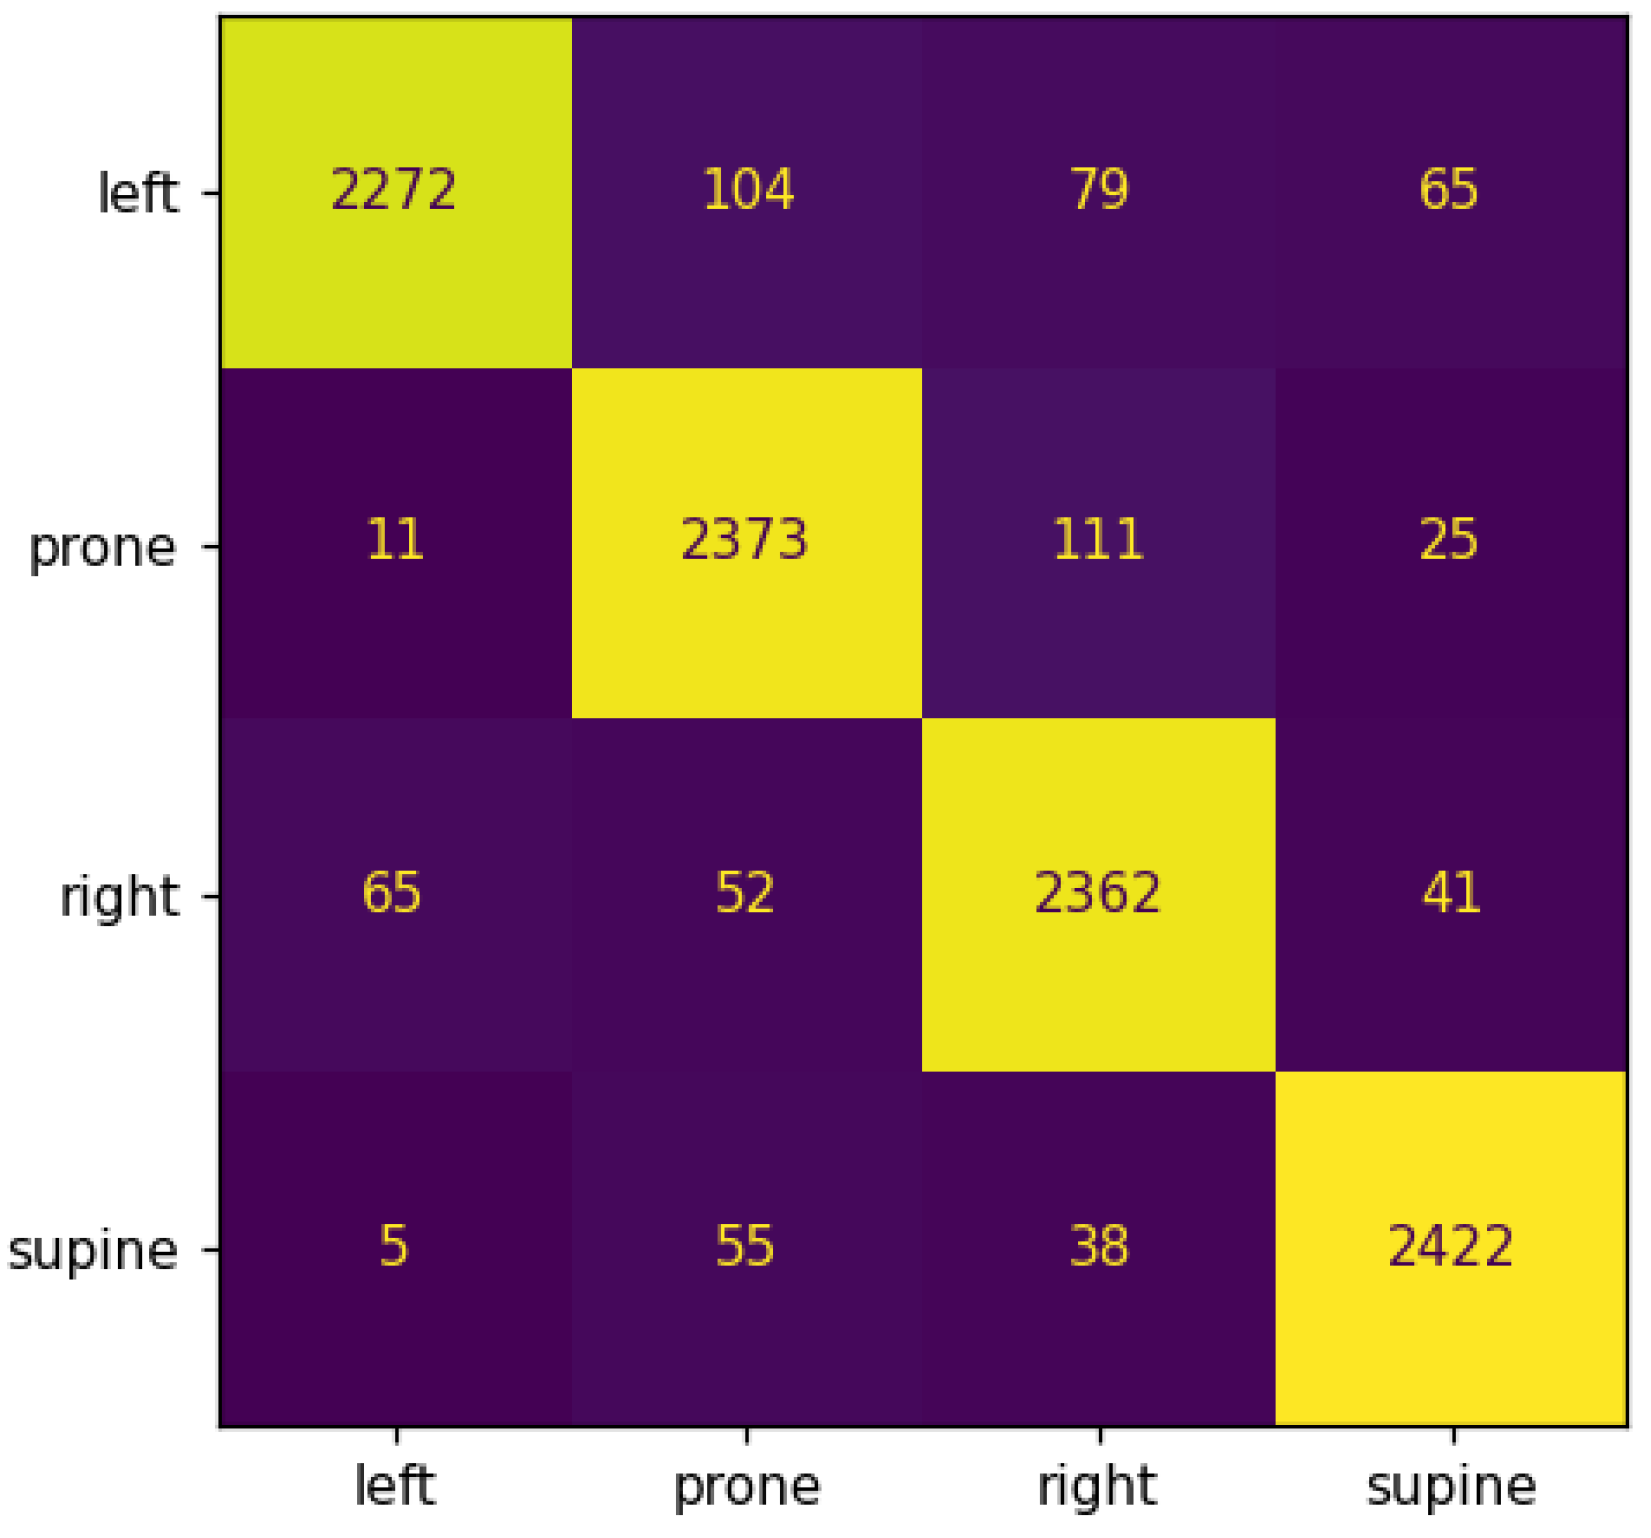
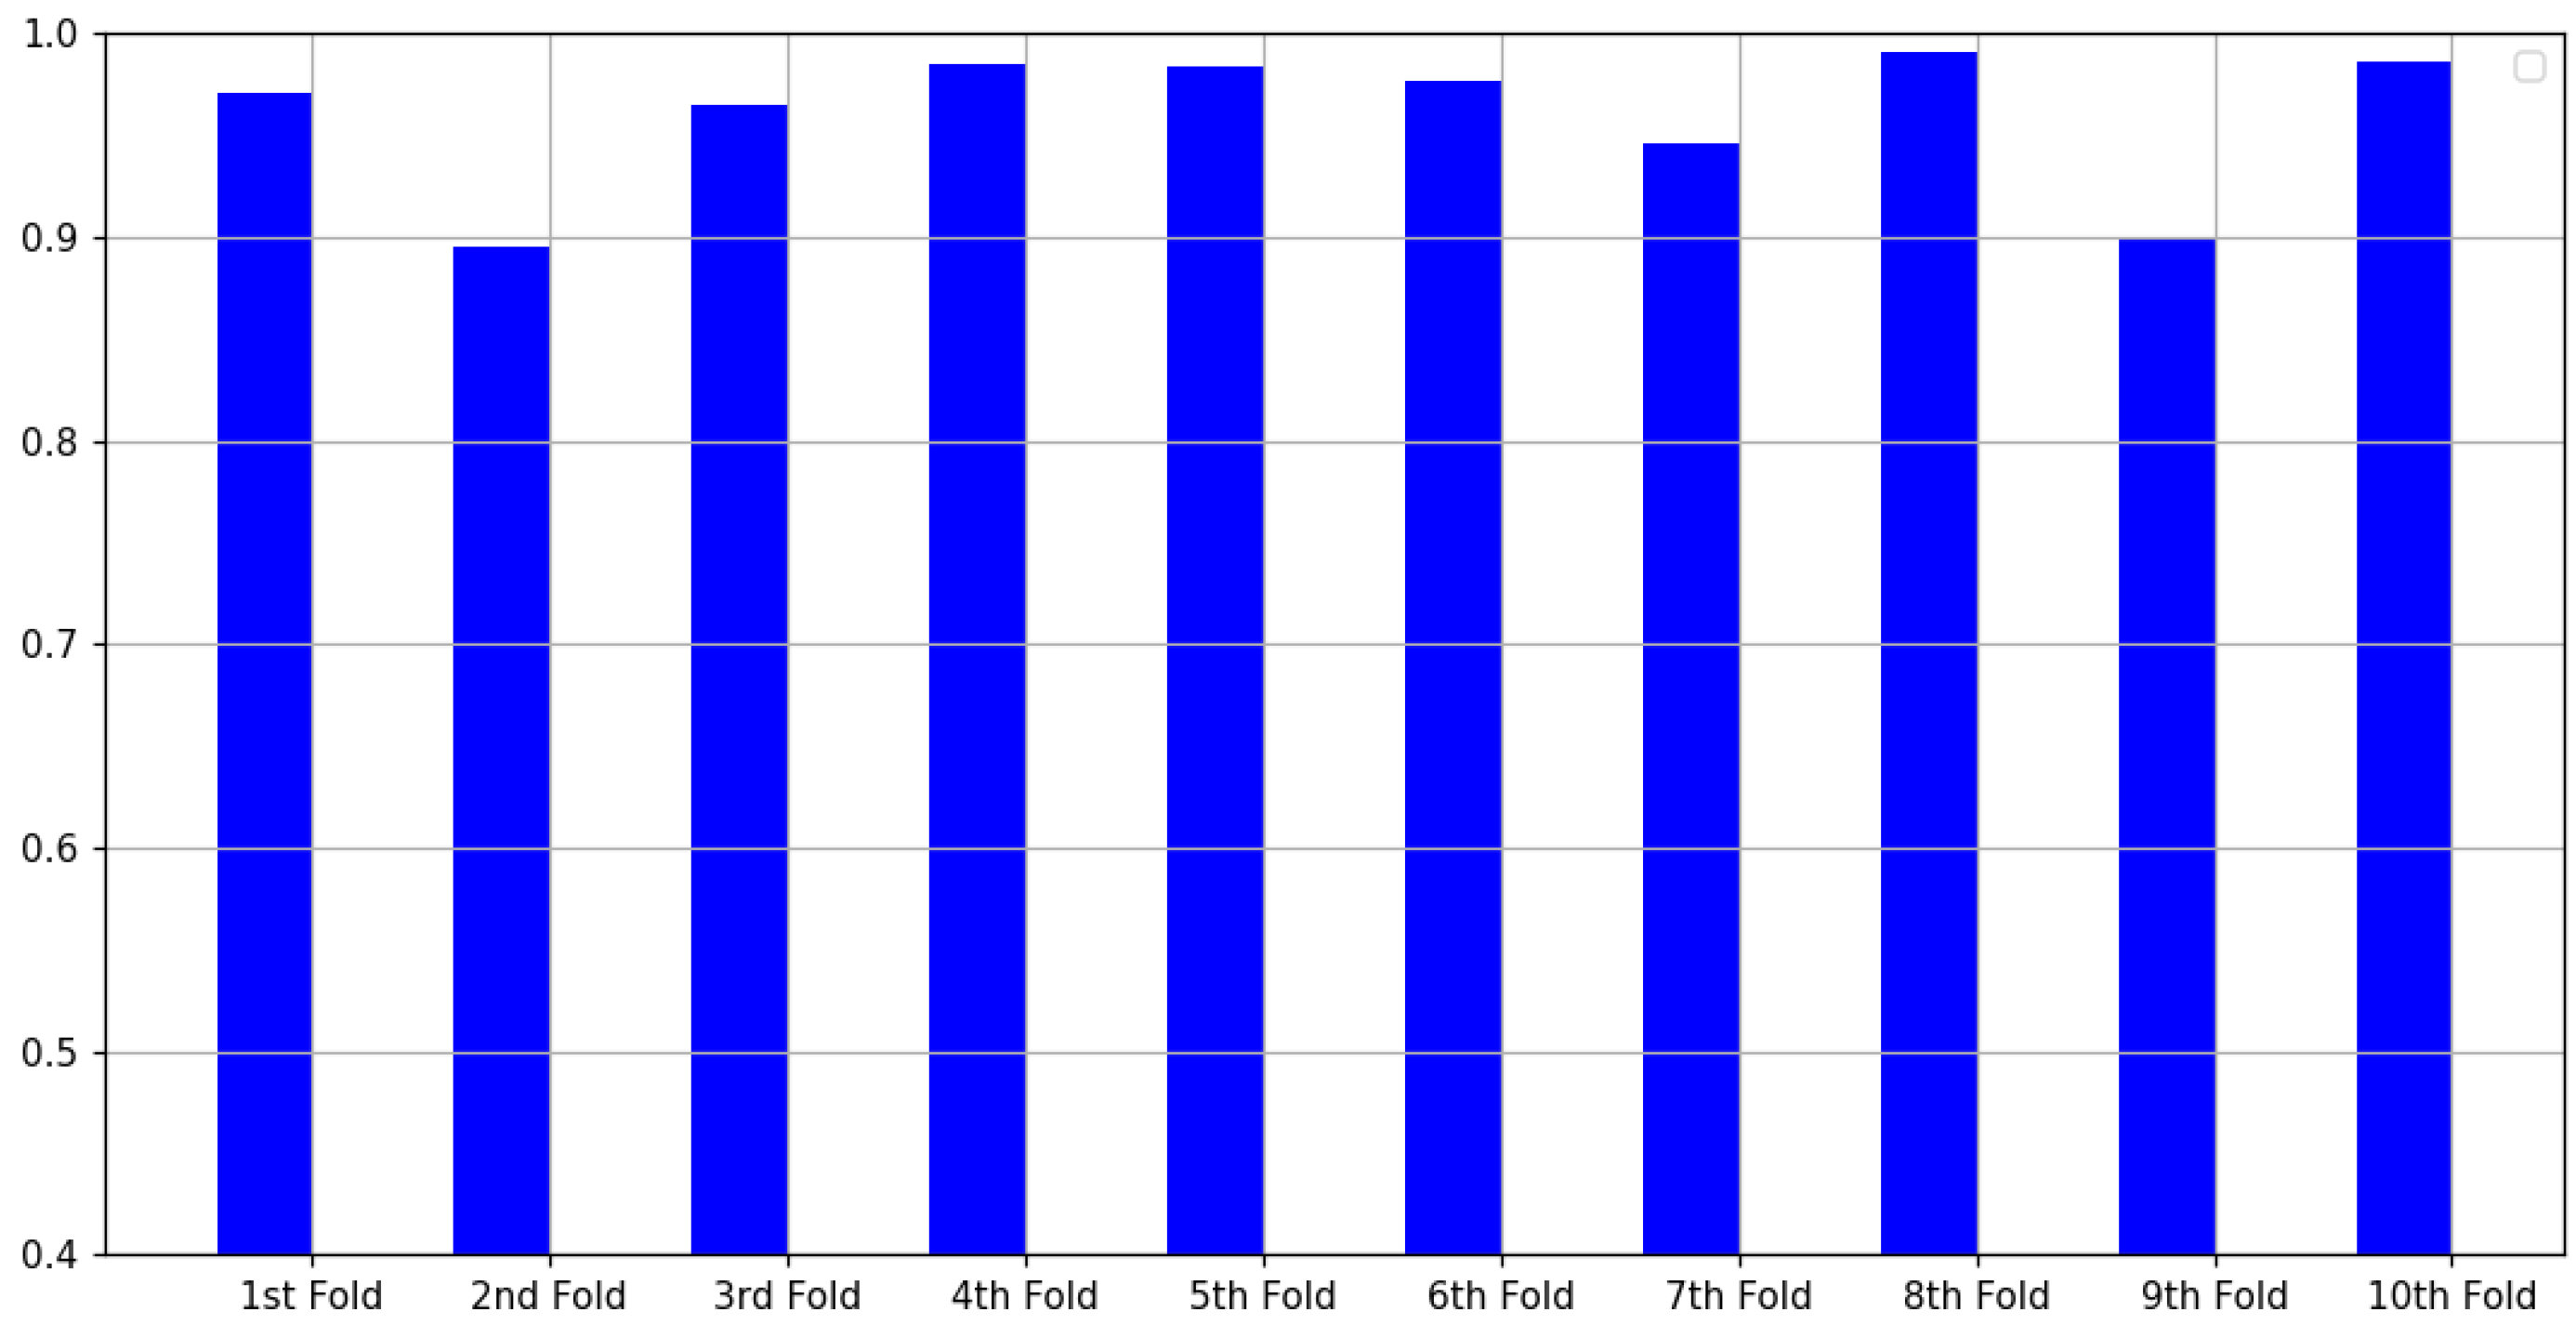
4.2.2. Further Validation

To validate the results from the initial experiments further, additional experiments were conducted regarding the 4-posture classification experiments, namely increasing the number of folds in the cross validation to 10 and an additional experiment using the LOSO approach.
Since the highest average accuracy for 5-fold cross validation was attained using the MLP algorithm, the following experiments will also be using this algorithm.
Using 10-fold cross-validation, the results did not significantly change, as the average accuracy remained at around 96%.
The graph displayed in Figure 3 contains the validation accuracy for the 10-fold cross validation, with a lowest accuracy of 89.5% and a highest of 99.02%, which is a better result than any of those registered in the 5-fold cross validation. Furthermore, the metrics used in the other experiments are the following:
  • Average accuracy (%): 95.96%
  • Standard deviation: 0.0356
  • Average precision: 0.9596
  • Average recall: 0.9596
  • Average F1-score: 0.9596
For the LOSO experiments, the models were trained using every sample except for the samples of one of the subjects, which was used for validation. This means that there were 60 different runs where a model was trained and validated as the dataset contains samples for 60 different volunteers.
For this experiment, the results are as follows:
  • Average accuracy (%): 96.25%
  • Standard deviation: 0.0741
  • Average precision: 0.9633
  • Average recall: 0.9625
  • Average F1-score: 0.9603
The results from this experiment further demonstrate that the resulting models will have a relatively high accuracy for most subjects. Although there were models with near-100% accuracy, there are some results from the LOSO experiment for which the accuracy is significantly lower, which explains the high standard deviation of the resulting accuracies. The individual results from this experiment will not be considered as the highest results, as they are heavily biased.

4.2.3. Pre-Calculated Main Posture Experiment

After observing the results from the previous section, an experiment was conceived which consists of using the outcome of the low granularity classifiers (which have high accuracy) as an input for the finer grained classificators. As such, for this experiment, the main posture is given as an input to the algorithms to assess how this influences the accuracy of the classifiers.
The results of these experiments are displayed in Table 4 like the rest of the experiments.
This experiment did not change the accuracy of the algorithms considerably, making only a significant difference in the decision tree algorithm, which improved its accuracy by 11%, but it still does not reach the 50% mark. The extra step of pre-classifying the main posture for finer granularity is found to not be relevant to the classifiers with finer granularity.

4.2.4. Pressure Only Experiment

The PoPu dataset includes not only pressure data but also participant characteristics, including sex, weight, and height. To test how this additional data influences the accuracy of the different algorithms, another batch of testing was conducted without including the additional parameters as input for the algorithms, and the same data are displayed in two tables—Table 5 with the results of the algorithms considering only 4 postures and Table 6 considering 28 postures—formatted like the tables in the previous experiments.
From this experiment, the immediate conclusion is that the additional participant information is not very impactful in the performance of the algorithms with the differences in accuracy percentages not reaching 1%.

4.2.5. Pressure Matrix Resolution Reduction Experiments

The following tests to the results from the usage of the PoPu dataset consisted of reducing the resolution of the pressure data to assess how it would affect the accuracy of the classification algorithms. For this purpose, the original pressure data, which is represented in a 64 × 27 matrix is transformed into a smaller matrix maintaining the shape of the original pressure data, this was accomplished by removing half of the rows and half of the columns and evaluating the accuracy of the algorithms for each split.
Figure 4 displays the different resolutions used for the model training in this section compared to the original (left) as images obtained directly from one of the pressure images available in the dataset.
The first split was performed, and the models were trained using a 32 × 14 matrix, which lowered the number of pressure points from the original 1728 to 448. The results on Table 7 and Table 8 were obtained using the exact same techniques as previous experiments regarding the cross-validation technique.
As the results observed were still above 90% for the 4 posture classifiers and there was no significant change in any of the classifier’s accuracies, the matrix was split even further into a 16 × 7 matrix, which reduced the number of pressure points to 112. The results obtained using this data are displayed in Table 9 and Table 10.
The overall accuracy decreases considerably at this point for most algorithms, but some still show high accuracies for the 4 posture classifier. Considering this, the matrix was further reduced to a low of 8 × 4 to assess how a minimum amount of pressure points would affect the accuracy of the algorithms in the 4-posture classification experiment. Results are presented in Table 11. As the accuracies for the 28 posture classifiers are already dropping under 40% in most of the algorithms, this was the stopping point for the 28-posture classification experiments.
Although the resulting accuracies for the 4-posture models were still relatively high in some cases (up to 83%), the accuracy at this point was much lower, and for this reason, the 16 × 7 matrix was thought to be the best stopping point for the matrix resolution reduction experiment, considering 112 (16 × 7) as the minimal amount of pressure points for a sufficiently accurate classification method. Furthermore, reducing the resolution any more would significantly alter the matrix shape and the manner of reducing the resolution. Nontheless, a final confusion matrix was generated to assess how the classifications were distributed on the lowest resolution experiment. Figure 5 shows the confusion matrix of MLP classification with 4 classes trained using reduced 8 × 4 matrix.
Some of the related works presented an alternative to the classification in which they considered only 3 postures, combining the supine and prone positions because of their similarity regarding the pressure information. However, even in the lowest resolution considered in this experiment, there does not seem to be a high number of misclassified samples in that regard.

5. Discussion and Final Remarks

The field of posture classification has been studied in various manners, and mostly considers 4 postures as classes for classification. The experiments in this study show that ML algorithms—namely k-NN, SVM, decision tree, random forest, and neural networks (MLP)—can achieve high accuracy with the best-performing classifier, achieving 99% accuracy for 4-posture classification and a lower accuracy considering the finer-grained 28-posture classification alternative presented (up to 68%). These accuracy values are in line with the values identified in the systematic review [5], which analyzed pressure-based posture classification algorithms. When considering only the four main postures, the eight works analyzed in this review presented accuracies between 87.9% and 99.7%. Only two of them have an accuracy value higher than the value obtained in this work. However, comparisons between these studies could be misleading because results were obtained under different conditions, namely the resolution of the pressure sensor matrix and number of samples in the dataset. The 28-posture classification models were also noted for how their incorrect classifications were distributed, as they are still mostly found within the parent posture, which means that even for a wrongful classification when considering the 28 postures, there is a high chance that the parent posture is accurate.
The PoPu dataset plays a crucial role in achieving high accuracies in this study, and it includes a 64 × 27 pressure map along with participant characteristics. This study also includes experimentation regarding the data used in model training.
First, the additional participant characteristics were removed from the dataset training and results show that the additional parameters are not very important for the classification as the results remained relatively alike the first experiment. Secondly, after analyzing the initial results and noticing that the misclassified postures were mostly contained within one of the seven variations within the main positions, an experiment was conducted in which the models were input the main position to assess how it would influence the outcome of the algorithm, which did not alter the results for the most part, excluding the models using random forest, which had an average 10% increase. Thirdly, the dataset’s pressure map’s resolution was reduced to verify its impact on the accuracy, and although there is a decline, even the lowest tested resolution of 8 × 4 (from the original 64 × 27) achieved respectable accuracy for the 4-posture models, with a highest accuracy of ~85% in both random forest and MLP despite these results. Since the 28-posture models did not achieve such a positive outcome, the 16 × 7 resolution shows the most promise since it achieved an accuracy quite similar to that obtained from using the original resolution with a small decrease. The 28-posture classification experiments show that finer granularity classification needs the additional resolution, as the accuracies for the 16 × 7 resolution showed a significant decrease, with most models nearing 50% accuracy.
The purpose of lowering the resolution of the pressure maps is to understand if a lower number of sensors would still allow for an accurate posture classification even in finer-grained classification approaches, and the results of the experiments seem to confirm that lower resolutions are able to maintain high accuracies for a reduced number of classes only. The higher resolution allows for a more accurate fine-grained classification, but for applications that do not require such granularity, a lower resolution would suffice. With the need for a high resolution out of the picture, a smaller number of sensors can be used for pressure sensor sheets, which would not only result in more inexpensive sensor sheets but—with the reduction of the data being passed as input—the algorithms would provide classifications with ease, allowing for solutions in the field to have machine learning solutions without high computation requirements.
To better understand how the usage of this paper’s findings would affect healthcare applications, a similar study with classification done in real-time would be the logical next step, as it would help further validate the models trained for the purpose of this study.

Author Contributions

Conceptualization, L.F., F.R. and J.M.; methodology, L.F., F.R. and J.M.; validation, L.F., F.R. and J.M.; investigation, L.F.; writing—original draft preparation, L.F., F.R. and J.M.; writing—review and editing, L.F., F.R. and J.M. All authors have read and agreed to the published version of the manuscript.

Funding

This research received no external funding.

Data Availability Statement

Data are contained within the article.

Conflicts of Interest

The authors declare no conflict of interest.

References

  1. Nguyen, H.H.; Dang, B.L.; Dam, H.P.; Dang, Q.H.; Nguyen, D.M.; Vo, V.A. A novel implementation of sleeping posture classification using RANC ecosystem. In Proceedings of the 2022 International Conference on Advanced Technologies for Communications (ATC), Ha Noi, Vietnam, 20–22 October 2022; pp. 369–374. [Google Scholar] [CrossRef]
  2. Hudec, R.; Matúška, S.; Kamencay, P.; Benco, M. A Smart IoT System for Detecting the Position of a Lying Person Using a Novel Textile Pressure Sensor. Sensors 2021, 21, 206. [Google Scholar] [CrossRef] [PubMed]
  3. Vázquez-Santacruz, E.; Cruz-Santos, W.; Gamboa-Zúñiga, M. Design and Implementation of an Intelligent System for Controlling a Robotic Hospital Bed for Patient Care Assistance. Comput. Sist. 2015, 19, 467–474. [Google Scholar] [CrossRef]
  4. Stern, L.; Roshan Fekr, A. In-Bed Posture Classification Using Deep Neural Network. Sensors 2023, 23, 2430. [Google Scholar] [CrossRef] [PubMed]
  5. Fonseca, L.; Ribeiro, F.; Metrôlho, J. Pressure-Based Posture Classification Methods and Algorithms: A Systematic Review. Computers 2023, 12, 104. [Google Scholar] [CrossRef]
  6. Fonseca, L.; Ribeiro, F.; Metrôlho, J.; Santos, A.; Dionisio, R.; Amini, M.M.; Silva, A.F.; Heravi, A.R.; Sheikholeslami, D.F.; Fidalgo, F.; et al. PoPu-Data: A Multilayered, Simultaneously Collected Lying Position Dataset. Data 2023, 8, 120. [Google Scholar] [CrossRef]
  7. Hu, Q.; Tang, X.; Tang, W. A Real-Time Patient-Specific Sleeping Posture Recognition System Using Pressure Sensitive Conductive Sheet and Transfer Learning. IEEE Sens. J. 2021, 21, 6869–6879. [Google Scholar] [CrossRef]
  8. Matar, G.; Lina, J.-M.; Kaddoum, G. Artificial Neural Network for in-Bed Posture Classification Using Bed-Sheet Pressure Sensors. IEEE J. Biomed. Health Inform. 2020, 24, 101–110. [Google Scholar] [CrossRef] [PubMed]
  9. Elsharif, E.; Drawil, N.; Kanoun, S. Automatic Posture and Limb Detection for Pressure Ulcer Risk Assessment. In Proceedings of the 2021 IEEE 1st International Maghreb Meeting of the Conference on Sciences and Techniques of Automatic Control and Computer Engineering MI-STA, Tripoli, Libya, 25–27 May 2021; pp. 142–149. [Google Scholar] [CrossRef]
  10. Fonseca, L.; Ribeiro, F.; Metrôlho, J. Lying-People Pressure-Map Datasets: A Systematic Review. Data 2023, 8, 12. [Google Scholar] [CrossRef]
  11. Mihálik, O.; Sýkora, T.; Husák, M.; Fiedler, P. In-Bed Posture Classification Based on Sparse Representation in Redundant Dictionaries. IFAC-PapersOnLine 2022, 55, 374–379. [Google Scholar] [CrossRef]
  12. Kim, T.-H.; Hong, Y.-S. Prediction of Body Weight of a Person Lying on a Smart Mat in Nonrestraint and Unconsciousness Conditions. Sensors 2020, 20, 3485. [Google Scholar] [CrossRef] [PubMed]
  13. Zhu, H.; Liang, H.; Xiao, F.; Wang, G.; Hussain, R. Pressure Image Recognition of Lying Positions Based on Multi-feature value Regularized Extreme Learning Algorithm. Appl. Math. Nonlinear Sci. 2023, 8, 559–572. [Google Scholar] [CrossRef]
  14. Tam, A.Y.-C.; So, B.P.-H.; Chan, T.T.-C.; Cheung, A.K.-Y.; Wong, D.W.-C.; Cheung, J.C.-W. A Blanket Accommodative Sleep Posture Classification System Using an Infrared Depth Camera: A Deep Learning Approach with Synthetic Augmentation of Blanket Conditions. Sensors 2021, 21, 5553. [Google Scholar] [CrossRef]
  15. Pouyan, M.B.; Birjandtalab, J.; Heydarzadeh, M.; Nourani, M.; Ostadabbas, S. A pressure map dataset for posture and subject analytics. In Proceedings of the 2017 IEEE EMBS International Conference on Biomedical & Health Informatics (BHI), Orlando, FL, USA, 16–19 February 2017; pp. 65–68. [Google Scholar] [CrossRef]
  16. Liu, S.; Huang, X.; Fu, N.; Li, C.; Su, Z.; Ostadabbas, S. Simultaneously-Collected Multimodal Lying Pose Dataset: Enabling In-Bed Human Pose Monitoring. IEEE Trans. Pattern Anal. Mach. Intell. 2023, 45, 1106–1118. [Google Scholar] [CrossRef]
  17. Clever, H.M.; Erickson, Z.; Kapusta, A.; Turk, G.; Liu, C.K.; Kemp, C.C. Bodies at Rest: 3D Human Pose and Shape Estimation from a Pressure Image using Synthetic Data. In Proceedings of the IEEE/CVF Conference on Computer Vision and Pattern Recognition, Seattle, WA, USA, 14–19 June 2020. [Google Scholar]
  18. Ren, W.; Ma, O.; Ji, H.; Liu, X. Human Posture Recognition Using a Hybrid of Fuzzy Logic and Machine Learning Approaches. IEEE Access 2020, 8, 135628–135639. [Google Scholar] [CrossRef]
  19. Tactile Surface Sensor|Real-Time Surface Pressure Mapping Technology|Pressure Pad|Force Sensitive Resistor|Matrix Tactile Sensor|Pressure Mapping System FSR. Available online: https://tactilus.net/ (accessed on 1 June 2023).
Figure 1. Confusion matrix of MLP classification with 4 classes.
Computation 11 00239 g001
Figure 2. Confusion matrix of MLP classification with 28 classes.
Computation 11 00239 g002
Figure 3. Tenfold cross validation accuracy results.
Computation 11 00239 g003
Figure 4. Resulting images from pressure values with different resolutions. From left to right: First 64 × 27 matrix; Second 32 × 14 matrix; Third 16 × 7 matrix; Fourth 8 × 4 matrix.
Computation 11 00239 g004
Figure 5. Confusion matrix of MLP classification with 4 classes trained using reduced 8 × 4 matrix.
Computation 11 00239 g005
Table 1. Different positions and variations considered (previously published in [6]).
Posture Variations1234567
SupineComputation 11 00239 i001Computation 11 00239 i002Computation 11 00239 i003Computation 11 00239 i004Computation 11 00239 i005Computation 11 00239 i006Computation 11 00239 i007
ProneComputation 11 00239 i008Computation 11 00239 i009Computation 11 00239 i010Computation 11 00239 i011Computation 11 00239 i012Computation 11 00239 i013Computation 11 00239 i014
Facing leftComputation 11 00239 i015Computation 11 00239 i016Computation 11 00239 i017Computation 11 00239 i018Computation 11 00239 i019Computation 11 00239 i020Computation 11 00239 i021
Facing rightComputation 11 00239 i022Computation 11 00239 i023Computation 11 00239 i024Computation 11 00239 i025Computation 11 00239 i026Computation 11 00239 i027Computation 11 00239 i028
Table 2. Results of 5-fold cross-validation with 4 classes.
Algorithmk-NNLinear SVMDecision TreeRandom ForestMLP
Average Accuracy % 92.11%91.31%80.07%95.32%95.60%
Standard Deviation0.00710.02590.03310.01790.0196
Average Precision0.92110.91310.80070.95320.9560
Average Recall0.92110.91310.80070.95320.9560
Average
F1 score
0.92110.91310.80070.95320.9560
Table 3. Results of 5-fold cross-validation with 28 classes.
Algorithmk-NNLinear SVMDecision TreeRandom ForestMLP
Average Accuracy % 43.87%58.40%35.66%63.58%59.50%
Standard Deviation0.01730.02450.02430.02400.0278
Average Precision0.43870.58400.35660.63580.5950
Average Recall0.43870.58400.35660.63580.5950
Average
F1-score
0.43870.58400.35660.63580.5950
Table 4. Results of 5-fold cross-validation with 28 classes having the main posture as an additional input.
Algorithmk-NNLinear SVMDecision TreeRandom ForestMLP
Average Accuracy % 43.95%58.84%46.64%64.10%59.60%
Standard Deviation0.01740.02600.02650.01780.0266
Average Precision0.43950.58840.46640.64100.5960
Average Recall0.43950.58840.46640.64100.5960
Average
F1-score
0.43950.58840.46640.64100.5960
Table 5. Results of 5-fold cross-validation with 4 classes using pressure data only.
Algorithmk-NNLinear SVMDecision TreeRandom ForestMLP
Average Accuracy % 92.07%91.25%80.05%95.37%95.24%
Standard Deviation0.00730.02580.02980.01560.0218
Average Precision0.92070.91250.80050.95370.9524
Average Recall0.92070.91250.80050.95370.9524
Average
F1-score
0.92070.91250.80050.95370.9524
Table 6. Results of 5-fold cross-validation with 28 classes using pressure data only.
Algorithmk-NNLinear SVMDecision TreeRandom ForestMLP
Average Accuracy % 43.80%58.25%35.75%63.06%59.10%
Standard Deviation0.01750.02400.03140.03040.0244
Average Precision0.43800.58250.35750.63060.5910
Average Recall0.43800.58250.35750.63060.5910
Average
F1-score
0.43800.58250.35750.63060.5910
Table 7. Results of 5-fold cross-validation with 4 classes using a reduced (32 × 14) pressure matrix.
Algorithmk-NNLinear SVMDecision TreeRandom ForestMLP
Average Accuracy % 91.34%91.16%79.07%95.29%95.31%
Standard Deviation0.01150.02520.03790.01300.0185
Average Precision0.91340.91160.79070.95290.9531
Average Recall0.91340.91160.79070.95290.9531
Average
F1-score
0.91340.91160.79070.95290.9531
Table 8. Results of 5-fold cross-validation with 28 classes using a reduced (32 × 14) pressure matrix.
Algorithmk-NNLinear SVMDecision TreeRandom ForestMLP
Average Accuracy % 43.67%57.80%34.52%61.25%58.59%
Standard Deviation0.01690.02140.02500.01520.0281
Average Precision0.43670.57800.34520.61250.5859
Average Recall0.43670.57800.34520.61250.5859
Average
F1-score
0.43670.57800.34520.61250.5859
Table 9. Results of 5-fold cross-validation with 4 classes using a reduced (16 × 7) pressure matrix.
Algorithmk-NNLinear SVMDecision TreeRandom ForestMLP
Average Accuracy % 87.90%88.91%75.94%94.23%94.59%
Standard Deviation0.01880.01680.03220.01240.0178
Average Precision0.87900.88910.75940.94230.9459
Average Recall0.87900.88910.75940.94230.9459
Average
F1-score
0.87900.88910.75940.94230.9459
Table 10. Results of 5-fold cross-validation with 28 classes using a reduced (16 × 7) pressure matrix.
Algorithmk-NNLinear SVMDecision TreeRandom ForestMLP
Average Accuracy % 38.87%53.85%32.37%55.76%53.86%
Standard Deviation0.03360.02300.01350.03480.0238
Average Precision0.38870.53850.32370.55760.5386
Average Recall0.38870.53850.32370.55760.5386
Average
F1-score
0.38870.53850.32370.55760.5386
Table 11. Results of 5-fold cross-validation with 4 classes using a reduced (8 × 4) pressure matrix.
Algorithmk-NNLinear SVMDecision TreeRandom ForestMLP
Average Accuracy % 68.93%77.97%66.44%83.03%81.62%
Standard Deviation0.02730.01320.04410.01480.218
Average Precision0.68930.77970.66440.83030.8162
Average Recall0.68930.77970.66440.83030.8162
Average
F1-score
0.68930.77970.66440.83030.8162
Disclaimer/Publisher’s Note: The statements, opinions and data contained in all publications are solely those of the individual author(s) and contributor(s) and not of MDPI and/or the editor(s). MDPI and/or the editor(s) disclaim responsibility for any injury to people or property resulting from any ideas, methods, instructions or products referred to in the content.

