

Marburg Virus Outbreak and a New Conspiracy Theory: Findings from a Comprehensive Analysis and Forecasting of Web Behavior

 , ,
, ,
Abstract
1. Introduction
1.1. Marburg Virus: A Brief Overview
1.2. Concept of Conspiracy Theories
2. Literature Review
2.1. Review of Works Related to Time-Series Forecasting in the Context of Recent Virus Outbreaks Such as COVID-19 and MPox
2.2. Review of Various Conspiracy Theories That Were Associated with Virus Outbreaks in the Recent Past
2.3. Review of Applications of Google Trends in Healthcare
- The works that applied time-series forecasting models on relevant web behavior did not investigate the web behavior data related to the 2023 MVD outbreak.
- Some of the works related to the applications of time-series forecasting models to model web behavior during virus outbreaks did not focus on:
- ○
- studying the web behavior from different geographic regions
- ○
- comparing the performance of different time-series forecasting models to determine the optimal model for studying web behavior in different regions
- Even though several works in this field have studied the development and dissemination of conspiracy theories related to virus outbreaks in the recent past such as COVID-19 and MPox, none of those works studied the relevant web behavior data in the context of the new conspiracy theory involving the MVD outbreak and the FEMA emergency alert signal.
- Relevant web behavior data from Google Trends has been mined and analyzed in several prior works in this field to understand and interpret multimodal components of web behavior during virus outbreaks. However, such works did not focus on mining, analyzing, or interpreting the web behavior related to new conspiracy theories involving the MVD outbreak and the FEMA emergency alert signal.
3. Methodology
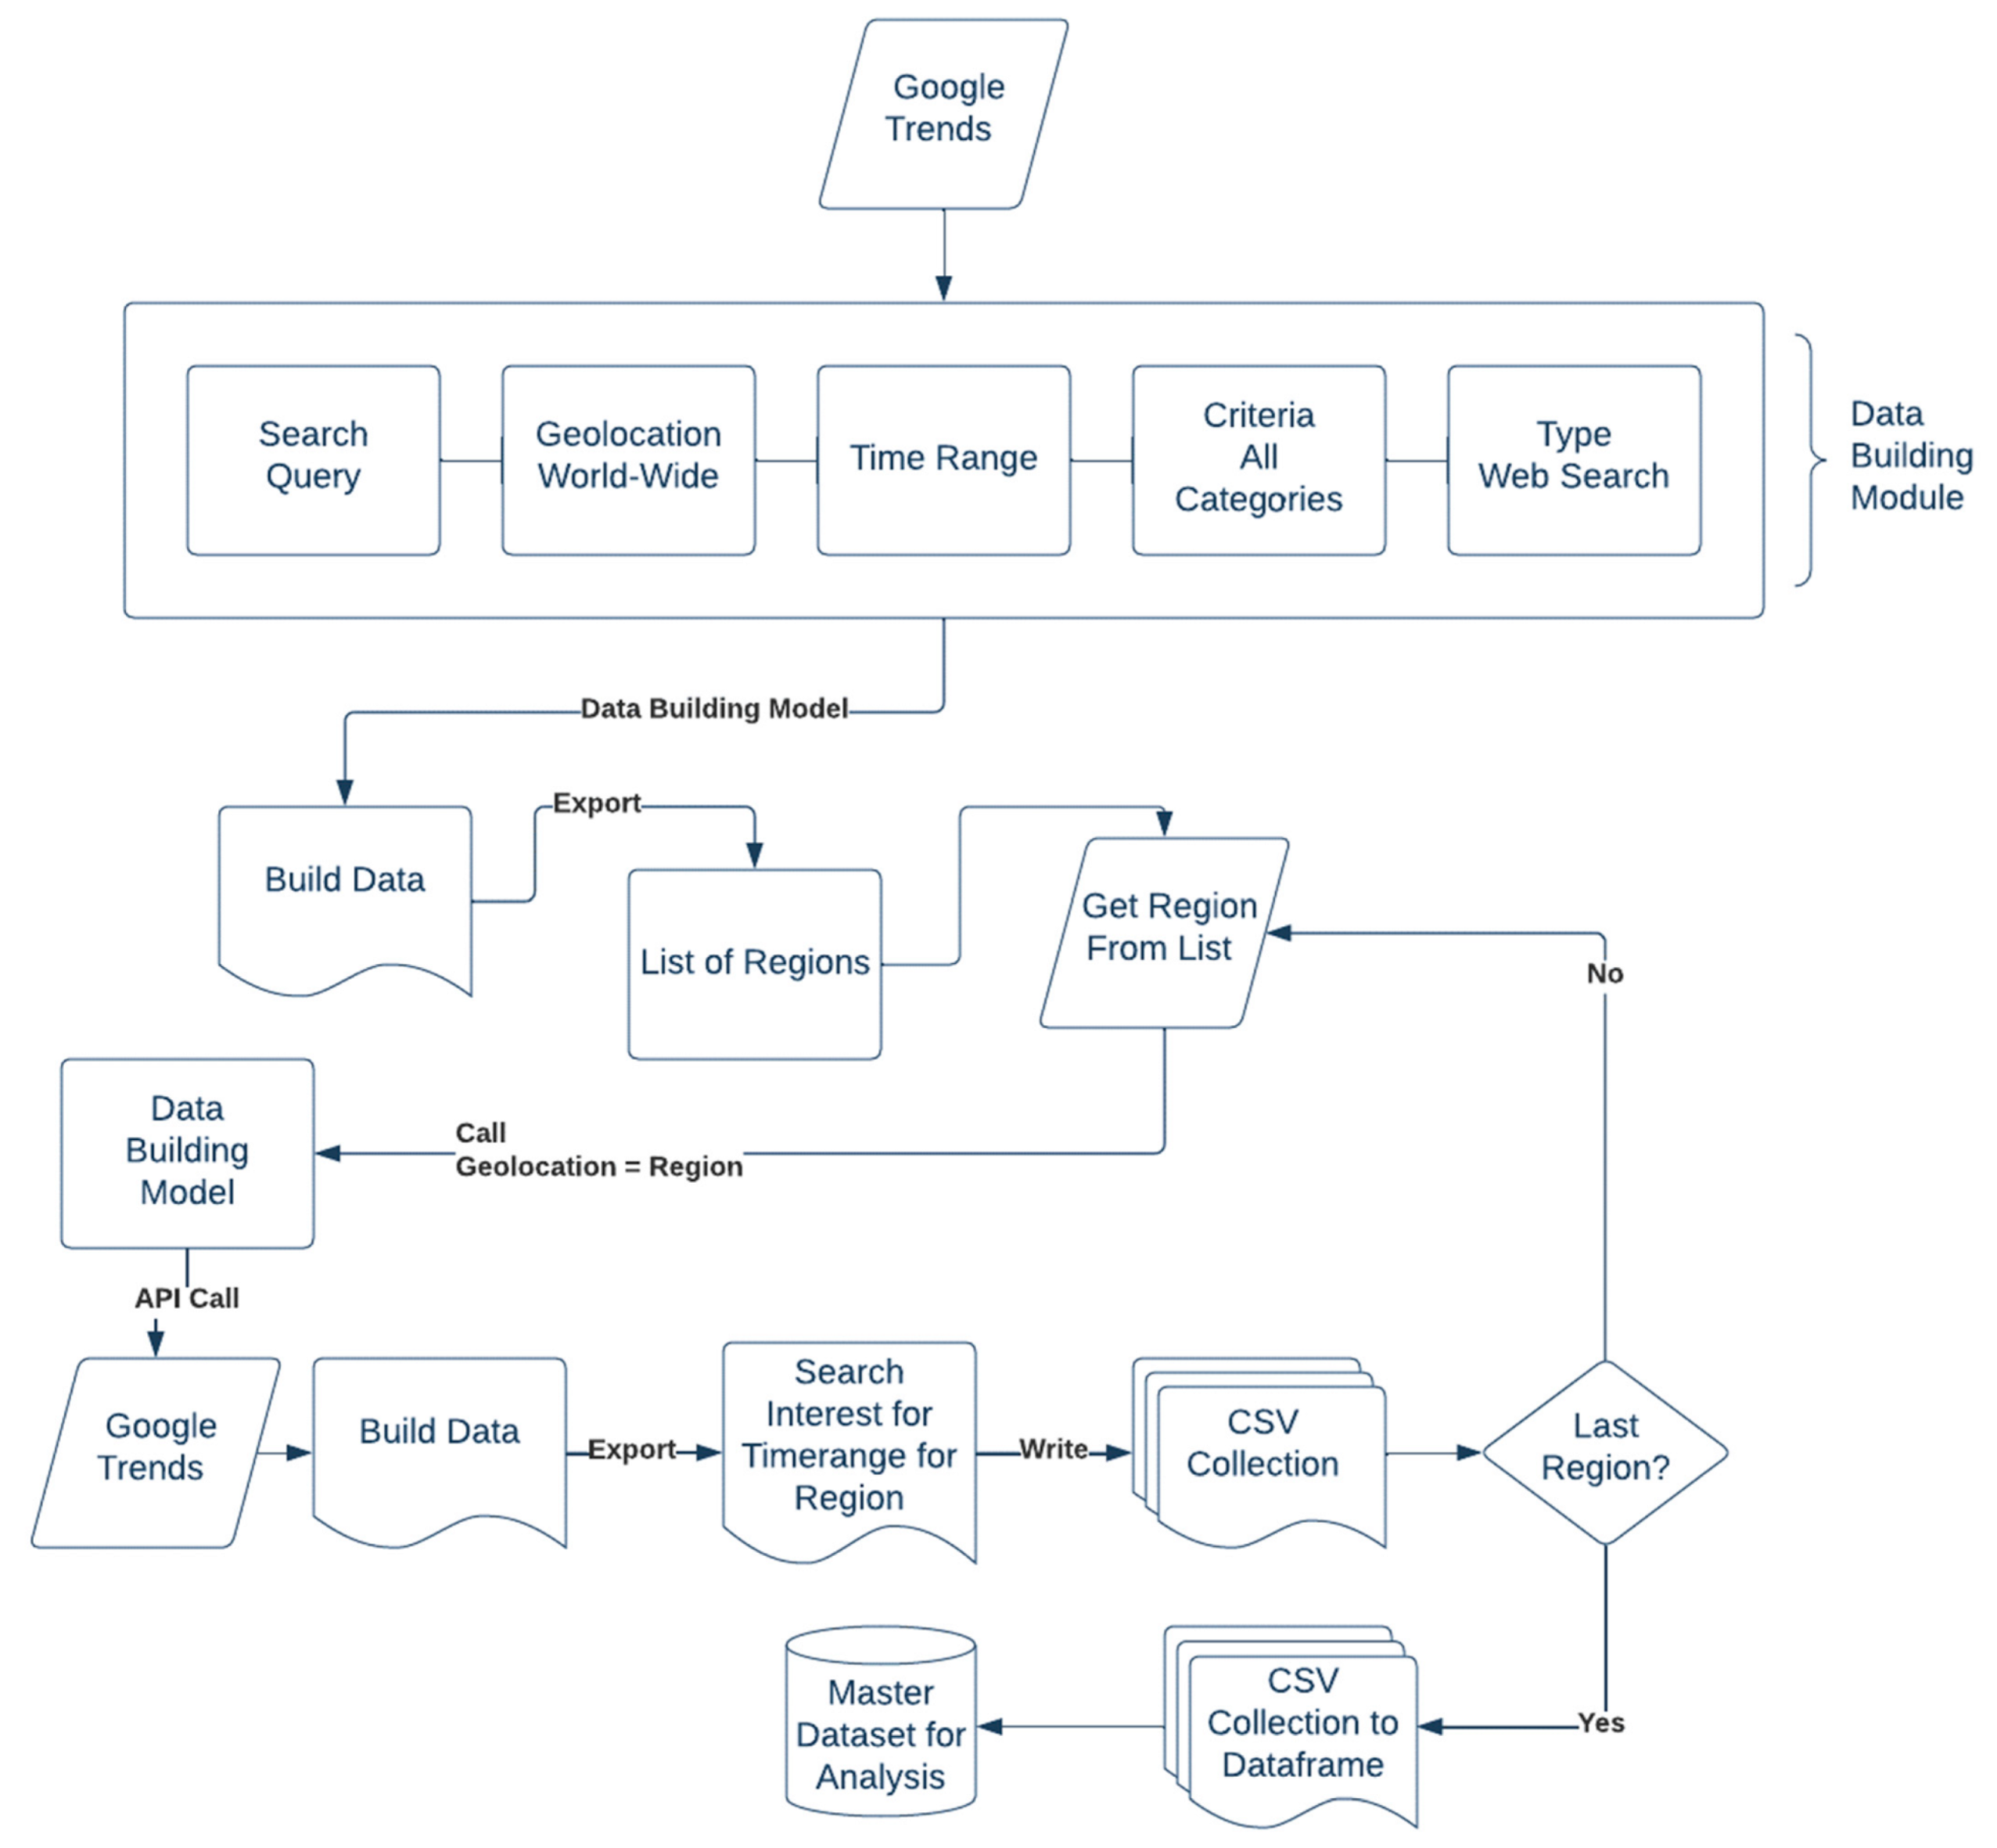
3.1. Overview of the Data Collection Architecture and Description of Data Collection
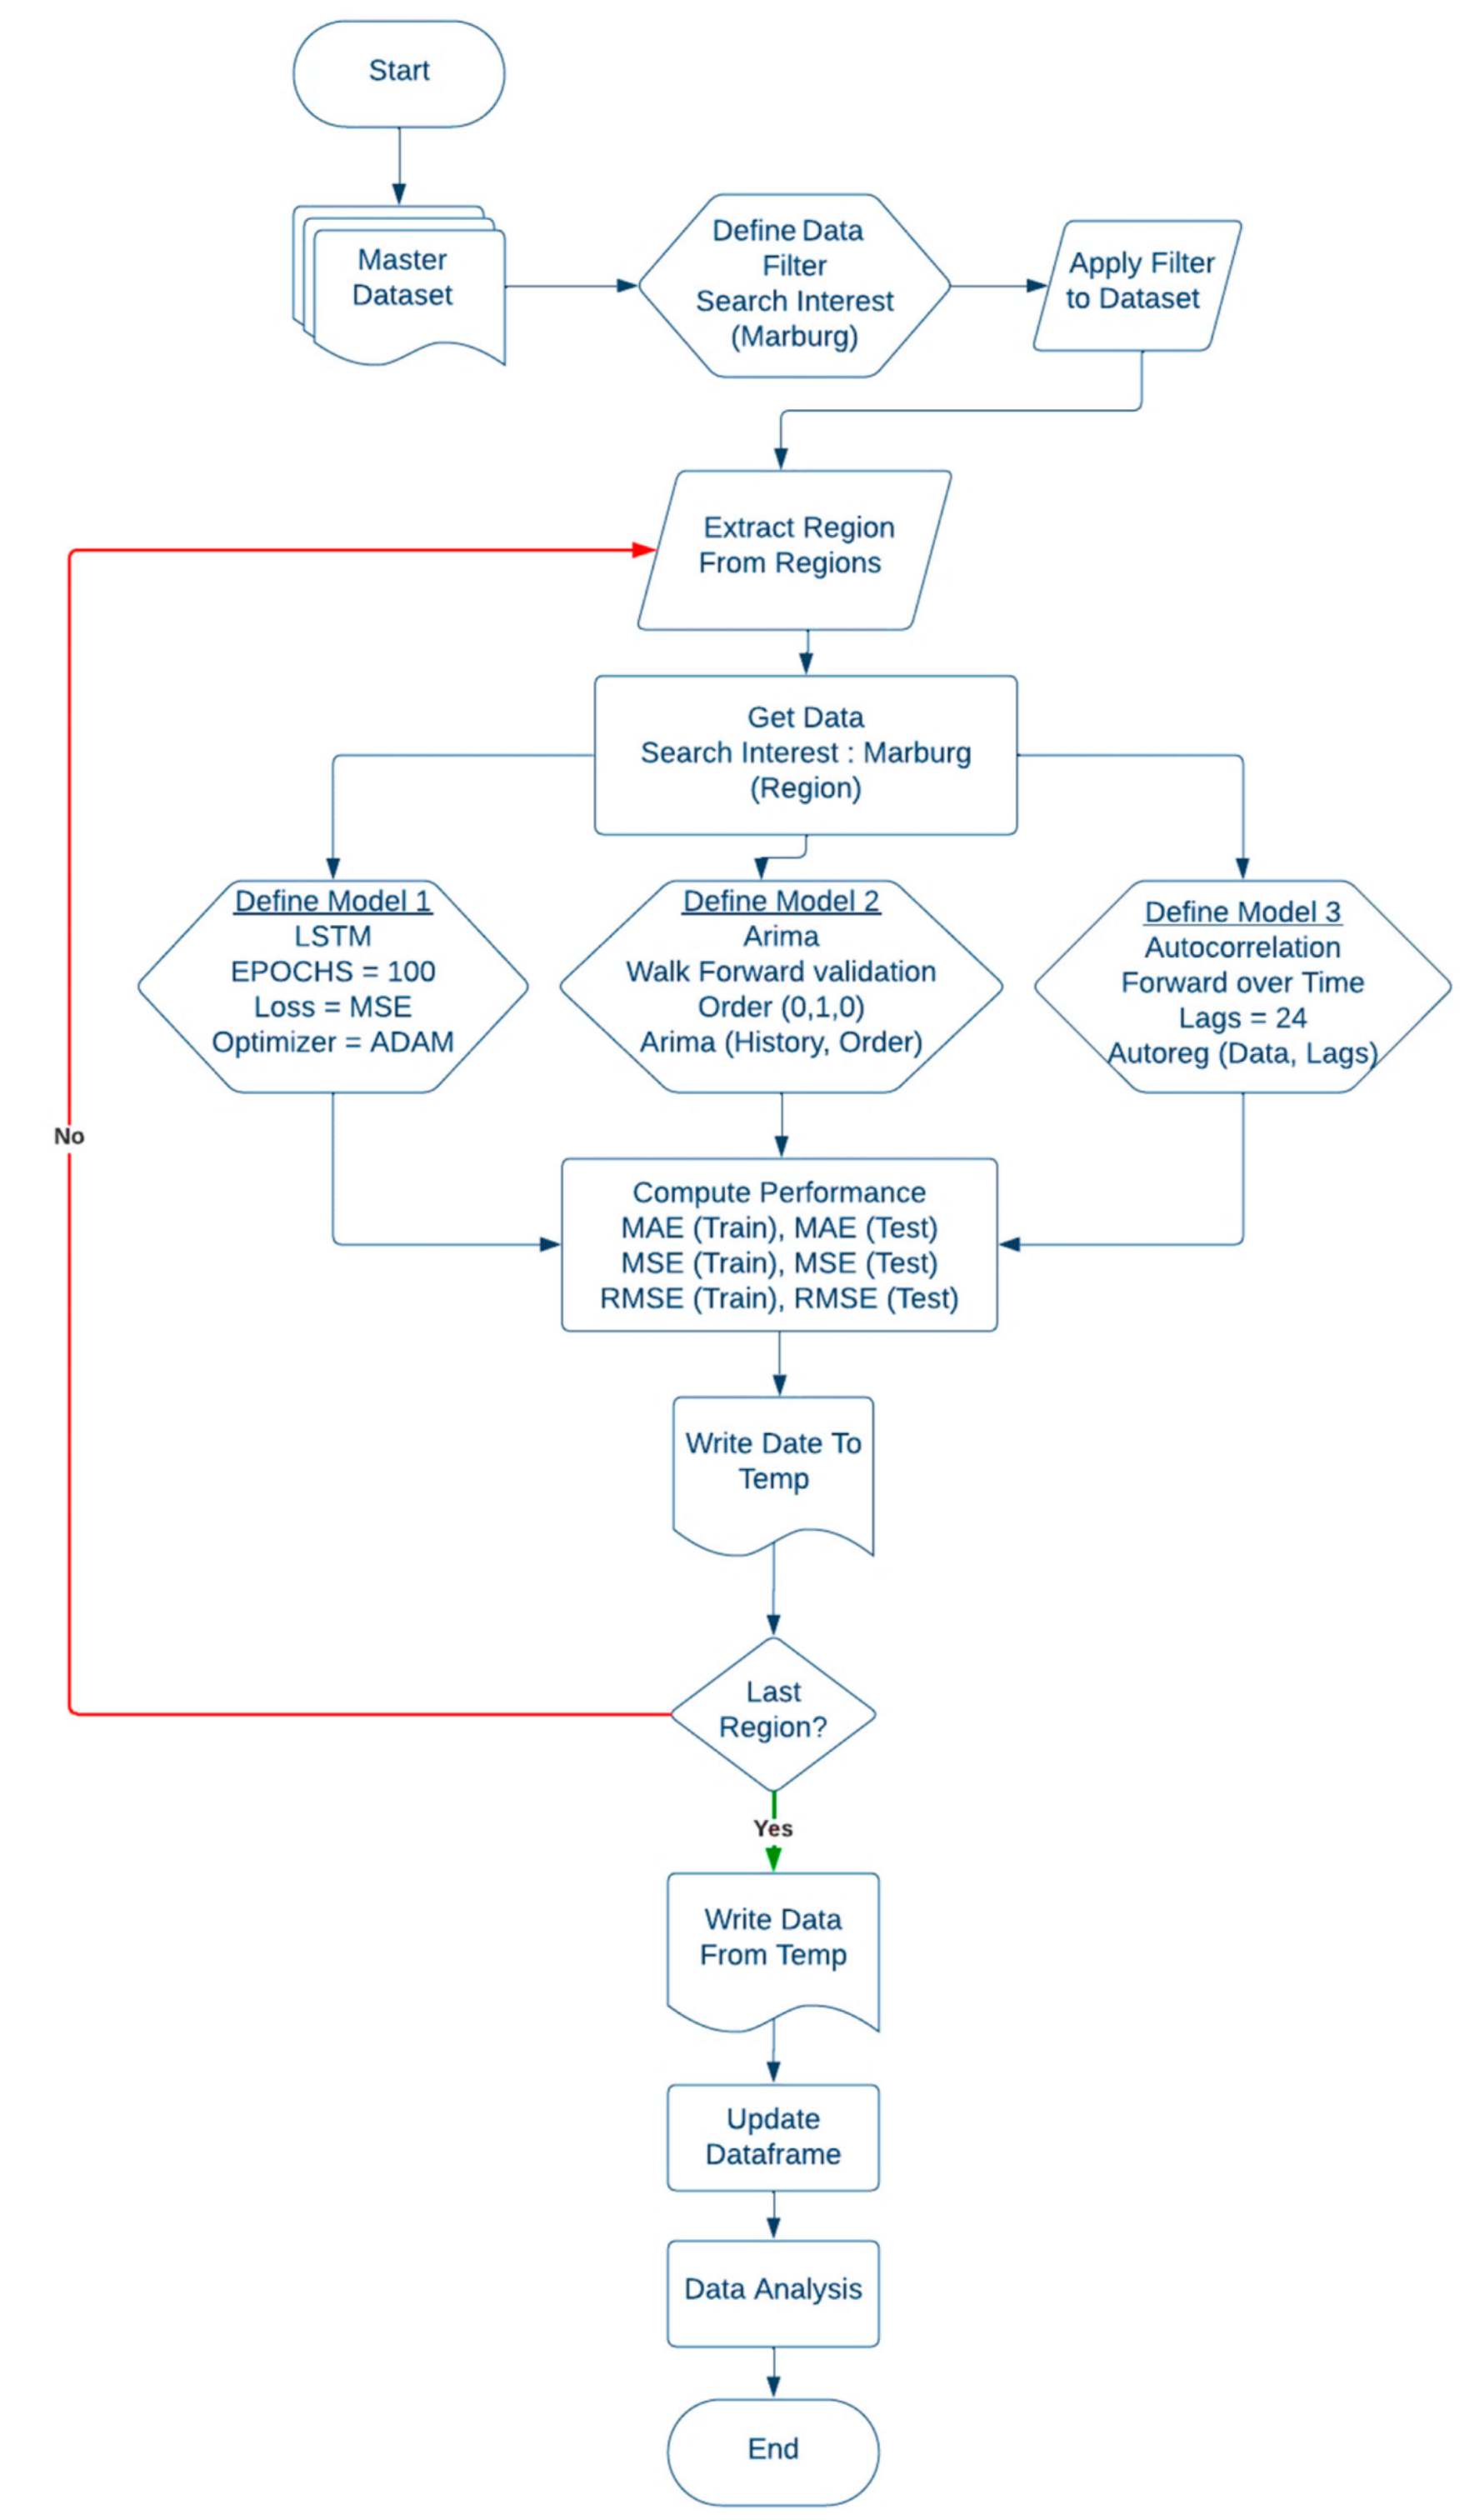
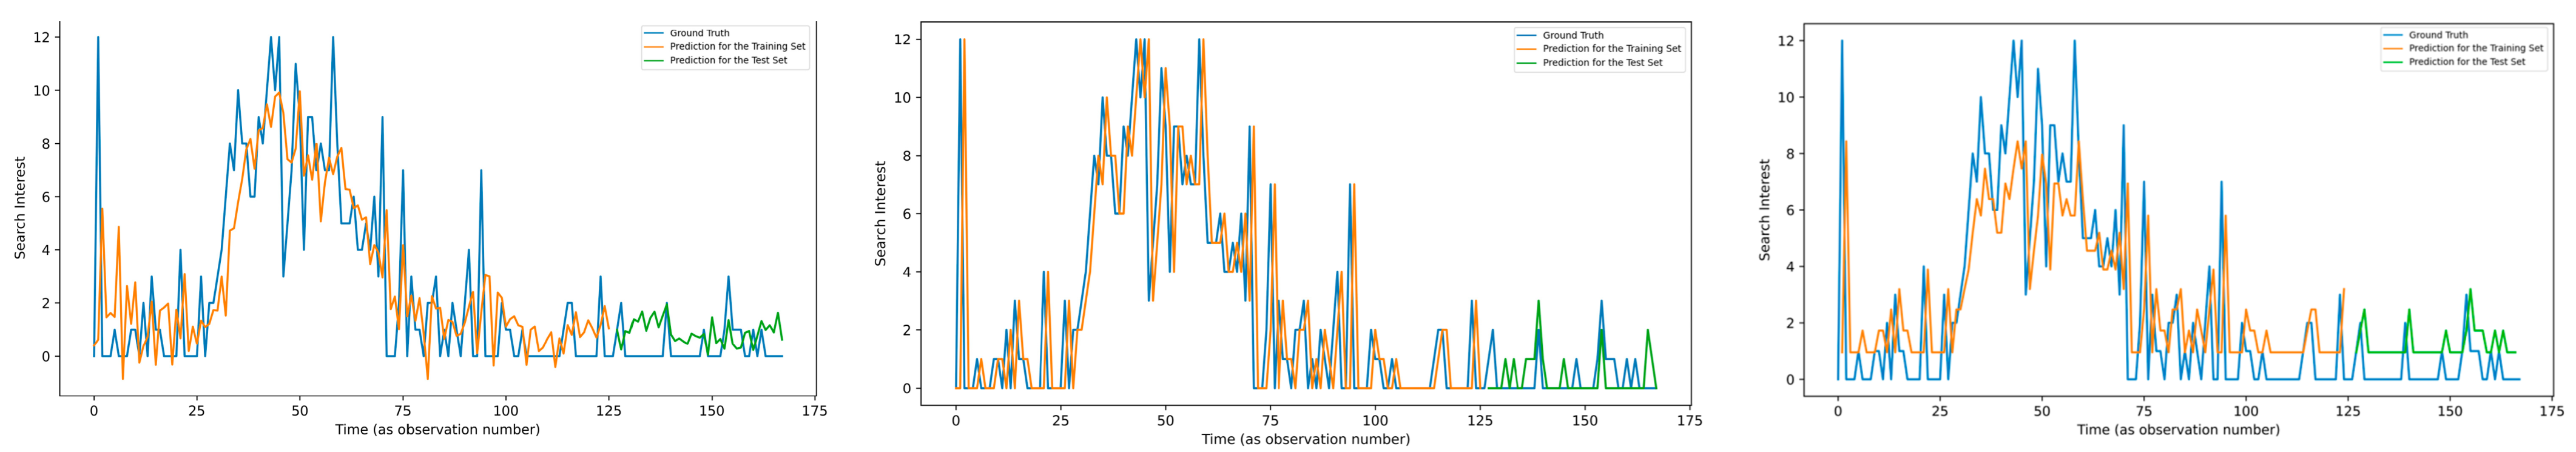
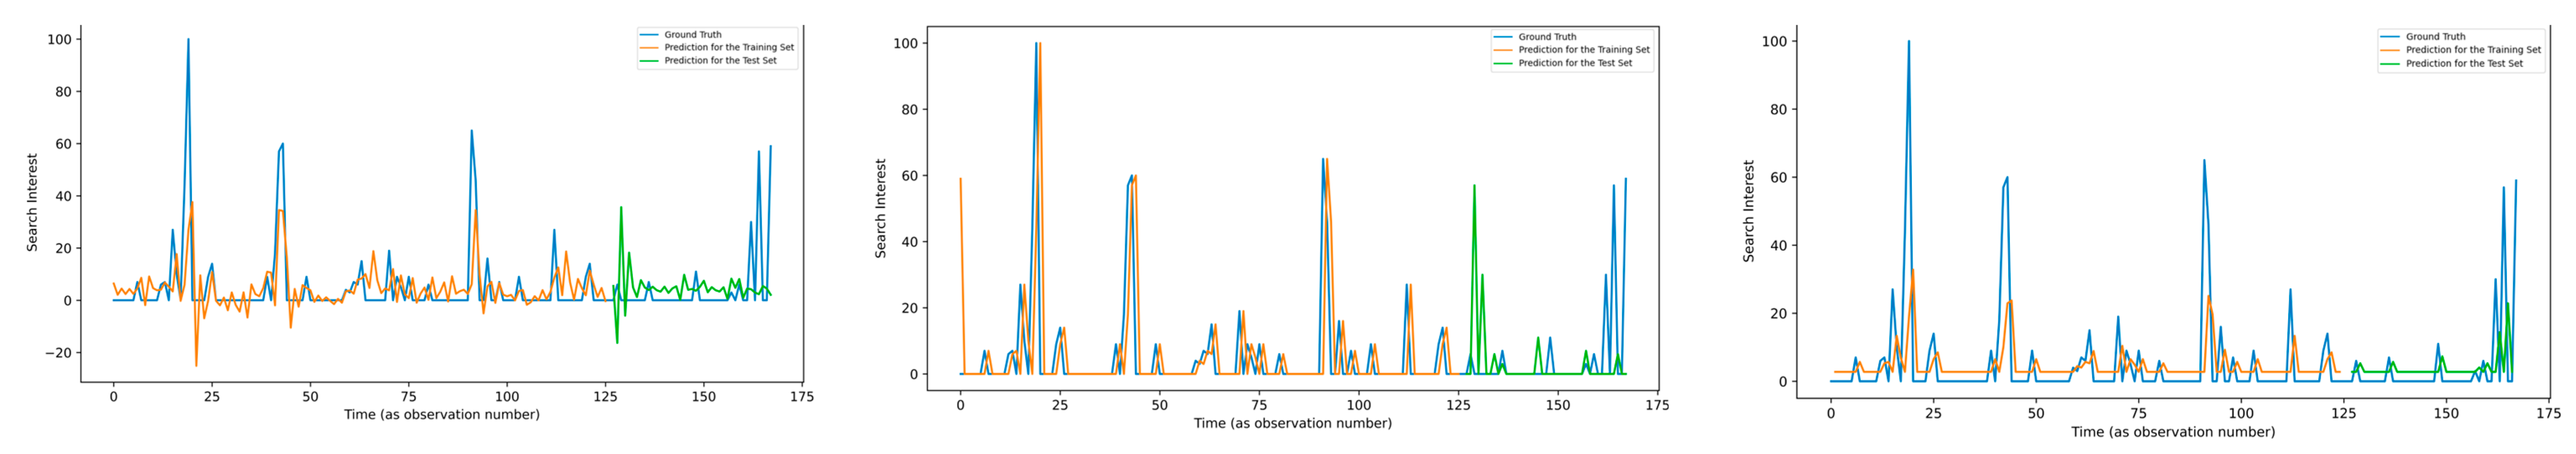
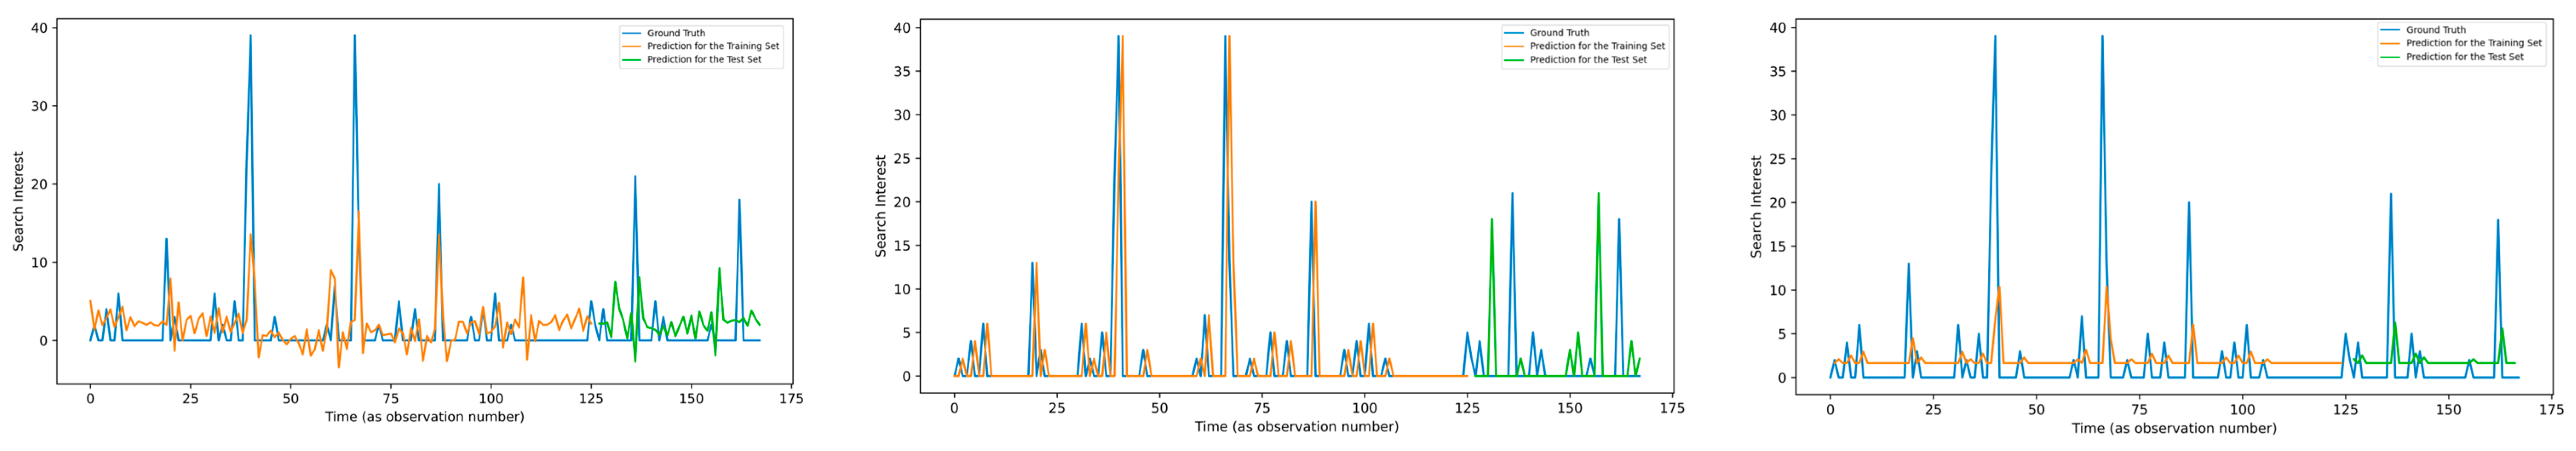
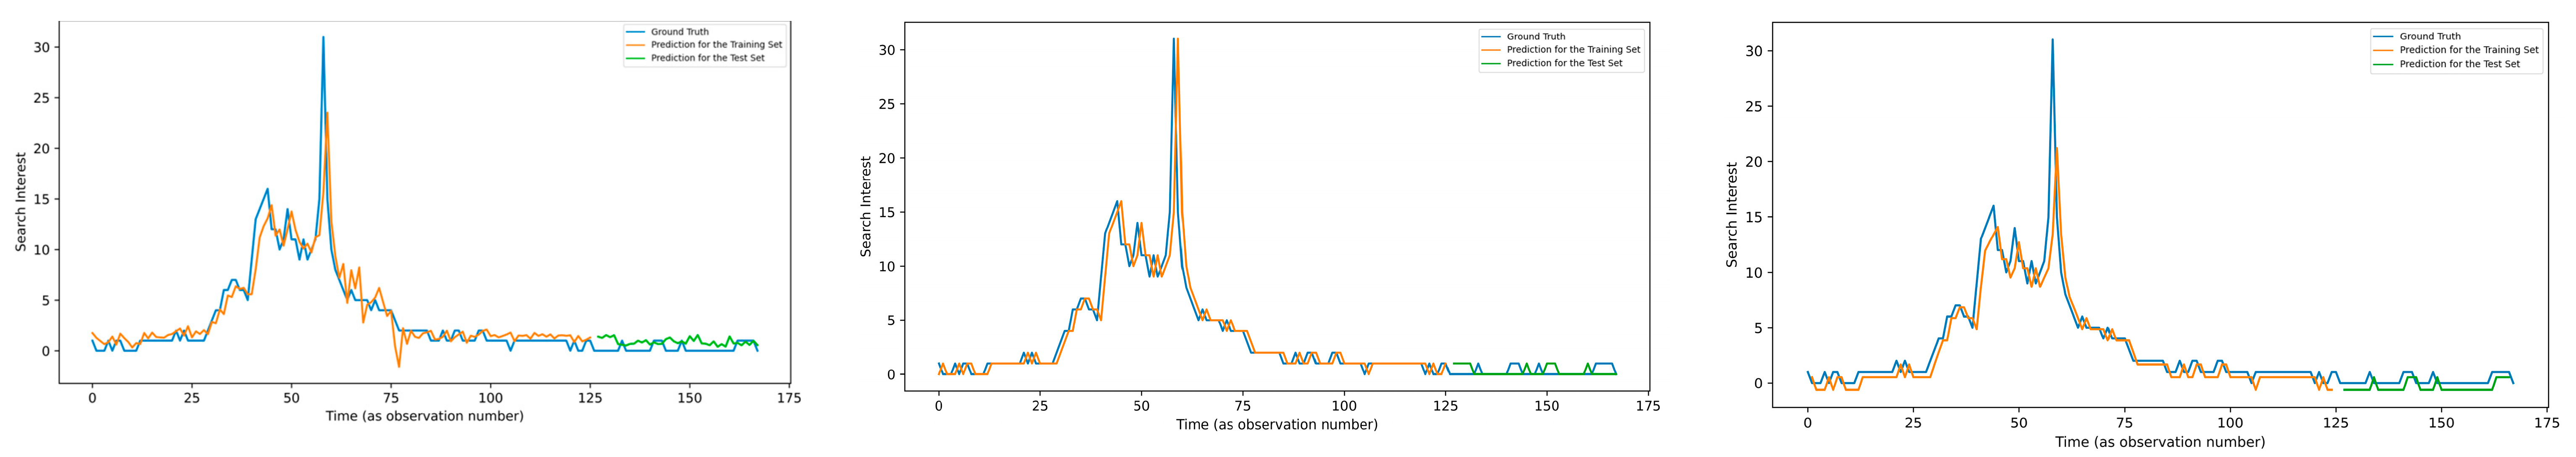
3.2. Methodology for Performing Time-Series Forecasting
| Algorithm 1: ARIMA for Time-Series Forecasting of Web Behavior related to MVD |
| Input: Master Dataset for Analysis Output: ARIMA Forecast for the Data, Performance Metrics (RMSE, MSE, AE) File Path dataframe = load the data files regions[] = region names for each region in regions do: dataset = get values from dataframe: marburg virus: <region> dataset = convert dataset to float32 x = dataset size = calculate size as 75% of all x split x into: train: from start to size test: from size to end x history = train value predictions_test = empty list for data in test do: model = history, order = (0,1,0) model_fit_test = fit model output_test = forecast by fitted model yhat_test = output[0] predictions_test ⟵ append(yhat) obs_test = test[data] history ⟵ append(obs) end for predictions_train = empty list for data in train do: model_train = ARIMA history, order(0,1,0) model_fit_train ⟵ fit model output_train ⟵ get forecast yhat_train ⟵ output_train[0] predictions_train ⟵ append(yhat_train) obs_train ⟵ train[data] history ⟵ append(obs_train) RMSE = calculate RMSE (test, prediction_test), calculate RMSE (train, prediction_train) MSE = calculate MSE (test, prediction_test), calculate MSE (train, prediction_train) AE = calculate AE (test, prediction_test), calculate AE (train, prediction_train) predictionsplot = empty list end for for data from 0 to dataset length do: if data ≤ predicitons length do: predictionsplot ⟵ append(np.nan) else: index = length of dataset − data predictionsplot ⟵ append_prediction(index) plot (dataset label = ground truth, predictions_train, predictions_test) show and save the plot end for end for |
| Algorithm 2: Autocorrelation for Time-Series Forecasting of Web Behavior related to MVD |
| Input: Master Dataset for Analysis Output: Autocorrelation Forecast for the Data, Performance Metrics (RMSE, MSE, AE) dataframe = load the data files for each region in regions do: dataset = get values from dataframe: marburg virus: <region> dataset = convert dataset to float32 x = dataset size = calculate size as 75% of all x split x into: train: from start to size test: from size to end x windows = 24 model = Autoreg(train, lags = 24) model_fit = fit the model(training data) coef = coefficients from the model fit lag = last 24 values of the dataset prediction_test = empty list for each data in test do: length = history length lag = last window value in history yhat = coef[0] for each d in 0 to windows − 1 do: yhat_test+ = coef[d + 1] * lag[windows − d − 1] obs_test = test [data] prediction_test ⟵ append(yhat_test) history ⟵ append(obs_test) end for prediction_train = empty list for data in train do: length = length of history lag = last window values from history yhat_train = coef[0] end for for each data in history do: yhat_train += coef[d + 1] * lag[window − d − 1] obs_train ⟵ train[data] prediction_train ⟵ append(yhat_train) history ⟵ append(obs_train) end for RMSE = calculate RMSE (test, prediction_test), calculate RMSE (train, prediction_train) MSE = calculate MSE (test, prediction_test), calculate MSE (train, prediction_train) AE = calculate AE (test, prediction_test), calculate AE (train, prediction_train) for each t3 from 0 to the length of the series do: if t3 ≤ length of predictions2 then: predicionsplot ⟵ append(np.nan) else: index2 ⟵ length of dataset − data predictionsplot ⟵ append_prediction(index) plot (dataset label = ground truth, predictions_train, predictions_test) show and save the plot end for end for |
| Algorithm 3: LSTM for Time-Series Forecasting of Web Behavior related to MVD |
| Input: Master Dataset for Analysis Output: Autocorrelation Forecast for the Data, Performance Metrics (RMSE, MSE, AE) dataframe = load the data files for each region in regions do: tf.keras.utils.set_random_seed(1) tf.config.experimental.enable_op_determinism() Function create_dataset(dataset, look_back = 1): dataX = empty list dataY = empty list for i from 0 to (len(dataset)-look_back-1 do: a = dataset segment from i and size look_back dataX ⟵ append(a) dataY ⟵ append(dataset[i + look_back, 0] np.array (dataX) np.array (dataY) return (data) end for end of Function dataset = get values from dataframe: marburg virus: <region> dataset = dataframe.values dataset = convert dataset (float32) scaler = MiniMaxScaler(feature_range = (0, 1)) dataset = fit, transform dataset train_size = 75% of all dataset test_size = len(dataset) − train_size look_back = 1 trainX, trainY = create_dataset(train, look_back) testX, testY = create_dataset(test, look_back) trainX = reshape trainX with dimension testX = reshape testX with dimension model = Sequential() model.add(LSTM(100, input_shape = (1, look_back))) model.add(Dense(1)) model.compile(loss = ‘mean_squared_error’, optimizer = ‘adam’) model.fit(trainX, trainY, epochs = 100, batch_size = 1, verbose = 2) trainPredict = inverse transform by scaler trainY = inverse transform by scaler testPredict = inverse transform by scaler testY = inverse transform by scaler trainPredict = model.predict(trainX) testPredict = model.predict(testX) RMSE = calculate RMSE (test, testPredict), calculate RMSE (train, trainPredict) MSE = calculate MSE (test, testPredict), calculate MSE (train, trainPredict) AE = calculate AE (test, testPredict), calculate AE (train, trainPredict) testPredictPlot = np.empty_like(dataset) testPredictPlot[len(trainPredict) + (look_back * 2) + 1:len(dataset)-1, :] = testPredict trainPredictPlot = np.empty_like(dataset) trainPredictPlot[look_back:len(trainPredict) + look_back, :] = trainPredict plot (dataset label = ground truth, trainPredictPlot, testPredictPlot) show and save the plot end for |
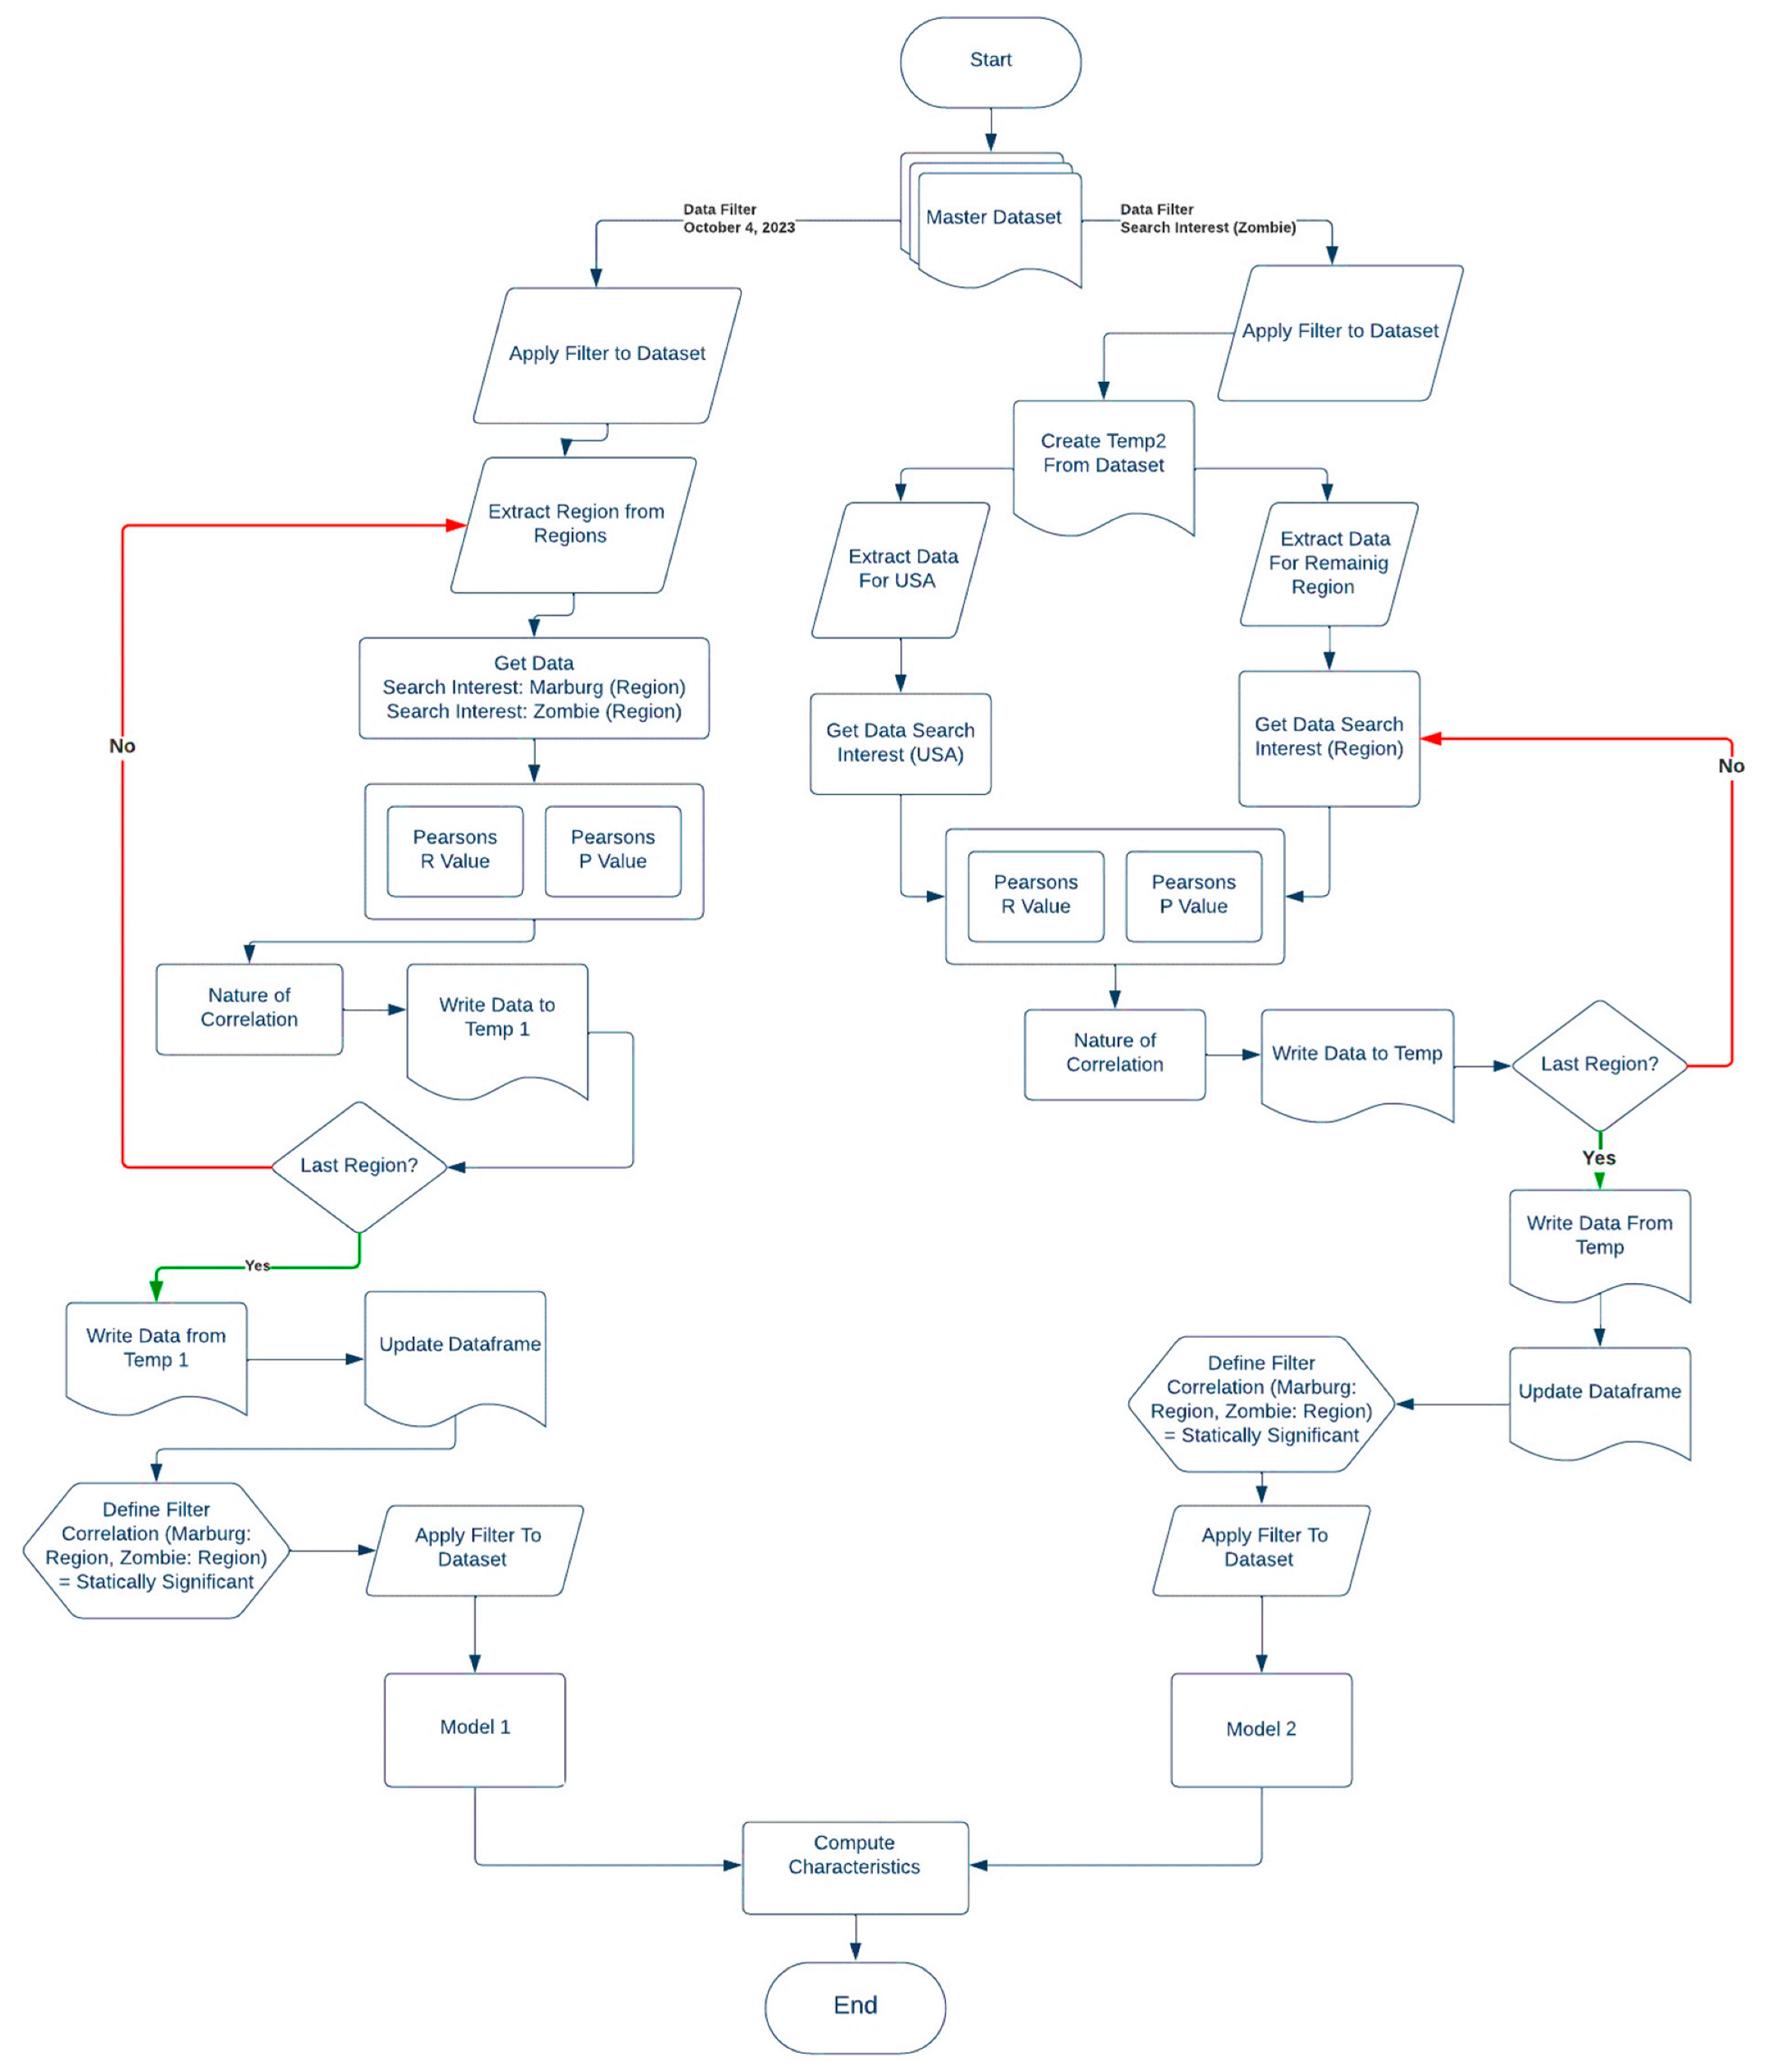
3.3. Methodology for Correlation Analysis
| Algorithm 4: Correlation between MVD and Conspiracy Theory-related Web Behavior |
| Input: Master Dataset for Analysis Output: Pearson’s r-value and p-value for each region dataframe = load the data files files = get the list of all CSV files in the master dataset using a recursive search country = empty list Name = empty list for each file_name in files do: i ⟵ 0, col1 ⟵ empty list, col2 ⟵ empty list for each date in the first column of f do: if specific date exists then: if second column of f at the ith row is an integer or is digit then: col1 ⟵ append the integer value else col1 ⟵ append 0 if third column of f at the ith row is an integer or is digit then: col2 ⟵ append the integer value else col2 ⟵ append 0 end if increment i end for country ⟵ append col, col2 r_value = empty list, p_value = empty list, significance = empty list for each entry c in country do: stat_1 = calculate pearson correlation between c[0] and c[1] p_1 ⟵ extract second value from stat_1 p_0 ⟵ extract first value from stat_1 r_value ⟵ p_0, p_value ⟵ p_1 if p_1 is less than 0.05 then: significance ⟵ statically significant else: significance ⟵ not significant end for open file in writing mode as CSV output: writer = CSV writer for CSV output write the header row with columns for i from 0 to length of country do: row ⟵ empty list row [i] ⟵ append(name[i], r_value[i], p_value[i], significance[i]) write row to the CSV end for |
4. Results and Discussion
5. Conclusions
Author Contributions
Funding
Institutional Review Board Statement
Informed Consent Statement
Data Availability Statement
Conflicts of Interest
References
- Nakkazi, E. Increasing Marburg VHF Outbreaks in Africa. Lancet Infect. Dis. 2023, 23, e284–e285. [Google Scholar] [CrossRef] [PubMed]
- Marburg Virus Disease—Equatorial Guinea. Available online: https://www.who.int/emergencies/disease-outbreak-news/item/2023-DON472 (accessed on 22 October 2023).
- Zhao, F.; He, Y.; Lu, H. Marburg Virus Disease: A Deadly Rare Virus Is Coming. Biosci. Trends 2022, 16, 312–316. [Google Scholar] [CrossRef] [PubMed]
- Kassahun Bekele, B.; Uwishema, O.; Wellington, J.; Nazir, A. Equatorial Guinea on a Very High Alert as Marburg Virus Spreads: An Urgent Rising Concern. Int. J. Surg. Glob. Health 2023, 6, e0158. [Google Scholar] [CrossRef]
- Aborode, A.T.; Wireko, A.A.; Bel-Nono, K.N.; Quarshie, L.S.; Allison, M.; Bello, M.A. Marburg Virus amidst COVID-19 Pandemic in Guinea: Fighting within the Looming Cases. Int. J. Health Plann. Manag. 2022, 37, 553–555. [Google Scholar] [CrossRef] [PubMed]
- Ortiz-Martínez, Y.; Garcia-Robledo, J.E.; Vásquez-Castañeda, D.L.; Bonilla-Aldana, D.K.; Rodriguez-Morales, A.J. Can Google® Trends Predict COVID-19 Incidence and Help Preparedness? The Situation in Colombia. Travel Med. Infect. Dis. 2020, 37, 101703. [Google Scholar] [CrossRef] [PubMed]
- Samadbeik, M.; Garavand, A.; Aslani, N.; Ebrahimzadeh, F.; Fatehi, F. Assessing the Online Search Behavior for COVID-19 Outbreak: Evidence from Iran. PLoS ONE 2022, 17, e0267818. [Google Scholar] [CrossRef] [PubMed]
- Thakur, N. Sentiment Analysis and Text Analysis of the Public Discourse on Twitter about COVID-19 and MPox. Big Data Cogn. Comput. 2023, 7, 116. [Google Scholar] [CrossRef]
- Martins-Filho, P.R.; de Souza Araújo, A.A.; Quintans-Júnior, L.J. Global Online Public Interest in Monkeypox Compared with COVID-19: Google Trends in 2022. J. Travel Med. 2022, 29, taac104. [Google Scholar] [CrossRef]
- Shepherd, T.; Robinson, M.; Mallen, C. Online Health Information Seeking for Mpox in Endemic and Nonendemic Countries: Google Trends Study. JMIR Form. Res. 2023, 7, e42710. [Google Scholar] [CrossRef]
- Thakur, N. MonkeyPox2022Tweets: A Large-Scale Twitter Dataset on the 2022 Monkeypox Outbreak, Findings from Analysis of Tweets, and Open Research Questions. Infect. Dis. Rep. 2022, 14, 855–883. [Google Scholar] [CrossRef]
- Alicino, C.; Bragazzi, N.L.; Faccio, V.; Trucchi, C.; Paganino, C.; Amicizia, D.; Panatto, D.; Gasparini, R.; Icardi, G.C. Searching for 2014 Ebola Epidemics: A Global Analytical Study of Google Trends-Based Query Volumes. Eur. J. Public Health 2015, 25, ckv176.010. [Google Scholar] [CrossRef][Green Version]
- D’Agostino, M.; Mejía, F.; Brooks, I.; Marti, M.; Novillo, D.; de Cosio, G. Fear on the Networks: Analyzing the 2014 Ebola Outbreak. Rev. Panam. Salud Publica 2017, 41, e134. [Google Scholar] [CrossRef] [PubMed][Green Version]
- Petrie, K.J.; Faasse, K.; Thomas, M.G. Public Perceptions and Knowledge of the Ebola Virus, Willingness to Vaccinate, and Likely Behavioral Responses to an Outbreak. Disaster Med. Public Health Prep. 2016, 10, 674–680. [Google Scholar] [CrossRef] [PubMed]
- Cook, S.; Conrad, C.; Fowlkes, A.L.; Mohebbi, M.H. Assessing Google Flu Trends Performance in the United States during the 2009 Influenza Virus A (H1N1) Pandemic. PLoS ONE 2011, 6, e23610. [Google Scholar] [CrossRef]
- Malik, M.T.; Gumel, A.; Thompson, L.H.; Strome, T.; Mahmud, S.M. “Google Flu Trends” and Emergency Department Triage Data Predicted the 2009 Pandemic H1N1 Waves in Manitoba. Can. J. Public Health 2011, 102, 294–297. [Google Scholar] [CrossRef]
- Tausczik, Y.; Faasse, K.; Pennebaker, J.W.; Petrie, K.J. Public Anxiety and Information Seeking Following the H1N1 Outbreak: Blogs, Newspaper Articles, and Wikipedia Visits. Health Commun. 2012, 27, 179–185. [Google Scholar] [CrossRef] [PubMed]
- Shin, S.-Y.; Seo, D.-W.; An, J.; Kwak, H.; Kim, S.-H.; Gwack, J.; Jo, M.-W. High Correlation of Middle East Respiratory Syndrome Spread with Google Search and Twitter Trends in Korea. Sci. Rep. 2016, 6, 32920. [Google Scholar] [CrossRef]
- Poletto, C.; Boëlle, P.-Y.; Colizza, V. Risk of MERS Importation and Onward Transmission: A Systematic Review and Analysis of Cases Reported to WHO. BMC Infect. Dis. 2016, 16, 448. [Google Scholar] [CrossRef]
- Yoo, W.; Choi, D.-H. Predictors of Expressing and Receiving Information on Social Networking Sites during MERS-CoV Outbreak in South Korea. In COVID-19; Routledge: London, UK, 2022; pp. 80–95. [Google Scholar]
- Satpathy, P.; Kumar, S.; Prasad, P. Suitability of Google TrendsTM for Digital Surveillance during Ongoing COVID-19 Epidemic: A Case Study from India. Disaster Med. Public Health Prep. 2023, 17, e28. [Google Scholar] [CrossRef]
- Pervaiz, F.; Pervaiz, M.; Abdur Rehman, N.; Saif, U. FluBreaks: Early Epidemic Detection from Google Flu Trends. J. Med. Internet Res. 2012, 14, e125. [Google Scholar] [CrossRef][Green Version]
- Prasanth, S.; Singh, U.; Kumar, A.; Tikkiwal, V.A.; Chong, P.H.J. Forecasting Spread of COVID-19 Using Google Trends: A Hybrid GWO-Deep Learning Approach. Chaos Solitons Fractals 2021, 142, 110336. [Google Scholar] [CrossRef] [PubMed]
- Mavragani, A. Tracking COVID-19 in Europe: Infodemiology Approach. JMIR Public Health Surveill. 2020, 6, e18941. [Google Scholar] [CrossRef] [PubMed]
- Knipe, D.; Gunnell, D.; Evans, H.; John, A.; Fancourt, D. Is Google Trends a Useful Tool for Tracking Mental and Social Distress during a Public Health Emergency? A Time–Series Analysis. J. Affect. Disord. 2021, 294, 737–744. [Google Scholar] [CrossRef] [PubMed]
- Thakur, N.; Duggal, Y.N.; Liu, Z. Analyzing Public Reactions, Perceptions, and Attitudes during the MPox Outbreak: Findings from Topic Modeling of Tweets. Computers 2023, 12, 191. [Google Scholar] [CrossRef]
- Rotter, D.; Doebler, P.; Schmitz, F. Interests, Motives, and Psychological Burdens in Times of Crisis and Lockdown: Google Trends Analysis to Inform Policy Makers. J. Med. Internet Res. 2021, 23, e26385. [Google Scholar] [CrossRef]
- Mouratidis, K.; Papagiannakis, A. COVID-19, Internet, and Mobility: The Rise of Telework, Telehealth, e-Learning, and e-Shopping. Sustain. Cities Soc. 2021, 74, 103182. [Google Scholar] [CrossRef]
- He, D.; Gu, Y.; Shi, Y.; Wang, M.; Lou, Z.; Jin, C. COVID-19 in China: The Role and Activities of Internet-Based Healthcare Platforms. Glob. Health Med. 2020, 2, 89–95. [Google Scholar] [CrossRef]
- Dahiya, S.; Rokanas, L.N.; Singh, S.; Yang, M.; Peha, J.M. Lessons from Internet Use and Performance during COVID-19. J. Inf. Pol. 2021, 11, 202–221. [Google Scholar] [CrossRef]
- Thakur, N.; Han, C. An Exploratory Study of Tweets about the SARS-CoV-2 Omicron Variant: Insights from Sentiment Analysis, Language Interpretation, Source Tracking, Type Classification, and Embedded URL Detection. COVID 2022, 2, 1026–1049. [Google Scholar] [CrossRef]
- Cinelli, M.; Quattrociocchi, W.; Galeazzi, A.; Valensise, C.M.; Brugnoli, E.; Schmidt, A.L.; Zola, P.; Zollo, F.; Scala, A. The COVID-19 Social Media Infodemic. Sci. Rep. 2020, 10, 16598. [Google Scholar] [CrossRef]
- Batzdorfer, V.; Steinmetz, H.; Biella, M.; Alizadeh, M. Conspiracy Theories on Twitter: Emerging Motifs and Temporal Dynamics during the COVID-19 Pandemic. Int. J. Data Sci. Anal. 2022, 13, 315–333. [Google Scholar] [CrossRef]
- Shahsavari, S.; Holur, P.; Wang, T.; Tangherlini, T.R.; Roychowdhury, V. Conspiracy in the Time of Corona: Automatic Detection of Emerging COVID-19 Conspiracy Theories in Social Media and the News. J. Comput. Soc. Sci. 2020, 3, 279–317. [Google Scholar] [CrossRef] [PubMed]
- Dow, B.J.; Johnson, A.L.; Wang, C.S.; Whitson, J.; Menon, T. The COVID-19 Pandemic and the Search for Structure: Social Media and Conspiracy Theories. Soc. Personal. Psychol. Compass 2021, 15, e12636. [Google Scholar] [CrossRef] [PubMed]
- Jolley, D.; Paterson, J.L. Pylons Ablaze: Examining the Role of 5G COVID-19 Conspiracy Beliefs and Support for Violence. Br. J. Soc. Psychol. 2020, 59, 628–640. [Google Scholar] [CrossRef] [PubMed]
- Satariano, A.; Alba, D. Burning Cell Towers, out of Baseless Fear They Spread the Virus. NY Times, 10 April 2020. [Google Scholar]
- Himelboim, I.; Lee, J.J.; Cacciatore, M.A.; Kim, S.; Krause, D.; Miller-Bains, K.; Mattson, K.; Reynolds, J. Vaccine Support and Hesitancy on Twitter: Opposing Views, Similar Strategies, and the Mixed Impact of Conspiracy Theories. In Vaccine Communication Online; Springer International Publishing: Cham, Switzerland, 2023; pp. 81–101. ISBN 9783031244896. [Google Scholar]
- Elroy, O.; Erokhin, D.; Komendantova, N.; Yosipof, A. Mining the Discussion of Monkeypox Misinformation on Twitter Using RoBERTa. In IFIP Advances in Information and Communication Technology; Springer Nature Switzerland: Cham, Switzerland, 2023; pp. 429–438. ISBN 9783031341106. [Google Scholar]
- Langguth, J.; Schroeder, D.T.; Filkuková, P.; Brenner, S.; Phillips, J.; Pogorelov, K. COCO: An Annotated Twitter Dataset of COVID-19 Conspiracy Theories. J. Comput. Soc. Sci. 2023. [Google Scholar] [CrossRef] [PubMed]
- Frith, J. The Evolution of a 5G Zombie Apocalypse Conspiracy Theory. Available online: https://slate.com/technology/2023/10/5g-zombies-apocalypse-emergency-alert-system-conspiracy-theory.html (accessed on 8 November 2023).
- Klee, M. Anti-Vaxxers Think an Emergency Phone Alert Will Cause a Zombie Apocalypse. Available online: https://www.rollingstone.com/culture/culture-news/oct-4-fema-alert-test-5g-anti-vaxx-conspiracy-theory-1234838377/ (accessed on 8 November 2023).
- 5 Facts about the QAnon Conspiracy Theories. Available online: https://www.pewresearch.org/short-reads/2020/11/16/5-facts-about-the-qanon-conspiracy-theories/ (accessed on 8 November 2023).
- Shirah, G. Turn off Your Cell Phones on October 4th. The EBS Is Going to “Test” the System Using 5G. This Will Activate the Marburg Virus in People Who Have Been Vaccinated. And Sadly Turn Some of Them into Zombies. Available online: https://twitter.com/GinaShirah81815/status/1708314727422513629 (accessed on 22 October 2023).
- Gruzd, A.; Mai, P. Going Viral: How a Single Tweet Spawned a COVID-19 Conspiracy Theory on Twitter. Big Data Soc. 2020, 7, 205395172093840. [Google Scholar] [CrossRef]
- Trend Calendar Trending Words on 3rd October. 2023. Available online: https://us.trend-calendar.com/trend/2023-10-03.html (accessed on 26 October 2023).
- Trend Calendar Trending Words on 4th October. 2023. Available online: https://us.trend-calendar.com/trend/2023-10-04.html (accessed on 26 October 2023).
- Wendling, M. Marburg Virus and Other False Rumours about Today’s Emergency Alert Test. Available online: https://www.bbc.com/news/world-us-canada-66990739 (accessed on 8 November 2023).
- Morris, S. Anti-Vax Conspiracists Believe a Phone Alert Will Trigger Zombie Apocalypse. Available online: https://www.standard.co.uk/news/tech/antivax-conspiracy-theory-5g-marburg-zombies-qanon-b1111317.html (accessed on 8 November 2023).
- Morris, S. Anti-Vax Conspiracists Believe a Phone Alert Will Trigger Zombie Apocalypse. Available online: https://uk.finance.yahoo.com/news/anti-vax-conspiracists-believe-phone-133138611.html (accessed on 8 November 2023).
- Marcelo, P. Conspiracy Theories about FEMA’s Oct. 4 Emergency Alert Test Spread Online. Available online: https://apnews.com/article/fact-check-FEMA-test-graphene-oxide-COVID-vaccine-517946413392 (accessed on 8 November 2023).
- Fiona-Leishman Anti-Vaxxers Spread Conspiracy Theory Emergency Alert Will Cause Zombie Apocalypse. Available online: https://www.mirror.co.uk/news/us-news/anti-vaxxers-spread-conspiracy-theory-31105693 (accessed on 8 November 2023).
- Stieb, M. Why Your Phone Made a Horrible Sound This Afternoon. Available online: https://nymag.com/intelligencer/2023/10/why-your-phone-will-get-an-emergency-alert-text-on-oct-4.html (accessed on 8 November 2023).
- Gallagher, N. Conspiracy Theorists Think Today’s Emergency Alert Will Turn You into an Actual Zombie. Available online: https://themessenger.com/news/conspiracy-theorists-think-emergency-alert-zombies-today (accessed on 8 November 2023).
- Liberatore, S. Did YOU Get the Alert? Millions of US Smartphones Hit with Blaring Warning during Nationwide Emergency Drill—As Conspiracy Theorist Claimed the Test Would Spark a Zombie Apocalypse. Available online: https://www.dailymail.co.uk/sciencetech/article-12593241/nationwide-emergency-test-scheduled-TODAY-need-know-drill.html (accessed on 11 November 2023).
- Das, A. “5G Activated Zombie Apocalypse”: October 4th Frequency Conspiracy Theory Erupts amid FEMA Blackout Fears. Available online: https://www.sportskeeda.com/pop-culture/news-5g-activated-zombie-apocalypse-october-4th-frequency-conspiracy-theory-erupts-amid-fema-blackout-fears (accessed on 11 November 2023).
- Ettinger, M. The Upcoming FCC Emergency Alert Test Is Sparking a Panic on TikTok. Available online: https://www.dailydot.com/debug/october-4-cell-phone-alert/ (accessed on 11 November 2023).
- Huppke, R. Why Didn’t That Emergency Alert Turn Everyone into Zombies? REALLY Disappointing. Available online: https://www.usatoday.com/story/opinion/columnist/2023/10/04/emergency-alert-system-phones-conspiracies-5g-vaccines/71058731007/ (accessed on 11 November 2023).
- Chernikoff, S.; Weise, E. “I Am Not a Zombie”: FEMA Debunking Conspiracy Theories after Emergency Alert Test. Available online: https://news.yahoo.com/conspiracy-theories-spread-online-femas-180418453.html (accessed on 29 October 2023).
- Brauburger, K.; Hume, A.J.; Mühlberger, E.; Olejnik, J. Forty-Five Years of Marburg Virus Research. Viruses 2012, 4, 1878–1927. [Google Scholar] [CrossRef]
- Ebola Haemorrhagic Fever in Sudan, 1976. Bull. World Health Organ. 1978, 56, 247.
- Srivastava, S.; Sharma, D.; Kumar, S.; Sharma, A.; Rijal, R.; Asija, A.; Adhikari, S.; Rustagi, S.; Sah, S.; Al-qaim, Z.H.; et al. Emergence of Marburg Virus: A Global Perspective on Fatal Outbreaks and Clinical Challenges. Front. Microbiol. 2023, 14, 1239079. [Google Scholar] [CrossRef]
- Bausch, D.G.; Nichol, S.T.; Muyembe-Tamfum, J.J.; Borchert, M.; Rollin, P.E.; Sleurs, H.; Campbell, P.; Tshioko, F.K.; Roth, C.; Colebunders, R.; et al. Marburg Hemorrhagic Fever Associated with Multiple Genetic Lineages of Virus. N. Engl. J. Med. 2006, 355, 909–919. [Google Scholar] [CrossRef]
- Available online: https://www.phe.gov/s3/bioriskmanagement/biosafety/pages/risk-groups.aspx (accessed on 22 October 2023).
- Breman, J.G.; Johnson, K.M.; van der Groen, G.; Robbins, C.B.; Szczeniowski, M.V.; Ruti, K.; Webb, P.A.; Meier, F.; Heymann, D.L. Ebola Virus Study Teams A Search for Ebola Virus in Animals in the Democratic Republic of the Congo and Cameroon: Ecologic, Virologic, and Serologic Surveys, 1979–1980. J. Infect. Dis. 1999, 179, S139–S147. [Google Scholar] [CrossRef] [PubMed]
- Leirs, H.; Mills, J.N.; Krebs, J.W.; Childs, J.E.; Akaibe, D.; Woollen, N.; Ludwig, G.; Peters, C.J.; Ksiazek, T.G.; other study group members. Search for the Ebola Virus Reservoir in Kikwit, Democratic Republic of the Congo: Reflections on a Vertebrate Collection. J. Infect. Dis. 1999, 179, S155–S163. [Google Scholar] [CrossRef] [PubMed]
- Reiter, P.; Turell, M.; Coleman, R.; Miller, B.; Maupin, G.; Liz, J.; Kuehne, A.; Barth, J.; Geisbert, J.; Dohm, D.; et al. Field Investigations of an Outbreak of Ebola Hemorrhagic Fever, Kikwit, Democratic Republic of the Congo, 1995: Arthropod Studies. J. Infect. Dis. 1999, 179, S148–S154. [Google Scholar] [CrossRef]
- Monath, T.P. Ecology of Marburg and Ebola Viruses: Speculations and Directions for Future Research. J. Infect. Dis. 1999, 179, S127–S138. [Google Scholar] [CrossRef]
- Peterson, A.T.; Carroll, D.S.; Mills, J.N.; Johnson, K.M. Potential Mammalian Filovirus Reservoirs. Emerg. Infect. Dis. 2004, 10, 2073–2081. [Google Scholar] [CrossRef] [PubMed]
- Peterson, A.T.; Lash, R.R.; Carroll, D.S.; Johnson, K.M. Geographic Potential for Outbreaks of Marburg Hemorrhagic Fever; American Society of Tropical Medicine and Hygiene: Arlington, VA, USA, 2006. [Google Scholar]
- Bausch, D.G.; Borchert, M.; Grein, T.; Roth, C.; Swanepoel, R.; Libande, M.L.; Talarmin, A.; Bertherat, E.; Muyembe-Tamfum, J.-J.; Tugume, B.; et al. Risk Factors for Marburg Hemorrhagic Fever, Democratic Republic of the Congo. Emerg. Infect. Dis. 2003, 9, 1531–1537. [Google Scholar] [CrossRef]
- Towner, J.S.; Pourrut, X.; Albariño, C.G.; Nkogue, C.N.; Bird, B.H.; Grard, G.; Ksiazek, T.G.; Gonzalez, J.-P.; Nichol, S.T.; Leroy, E.M. Marburg Virus Infection Detected in a Common African Bat. PLoS ONE 2007, 2, e764. [Google Scholar] [CrossRef]
- Swanepoel, R.; Smit, S.B.; Rollin, P.E.; Formenty, P.; Leman, P.A.; Kemp, A.; Burt, F.J.; Grobbelaar, A.A.; Croft, J.; Bausch, D.G.; et al. Studies of Reservoir Hosts for Marburg Virus. Emerg. Infect. Dis. 2007, 13, 1847–1851. [Google Scholar] [CrossRef]
- Maganga, G.D.; Bourgarel, M.; Ebang Ella, G.; Drexler, J.F.; Gonzalez, J.-P.; Drosten, C.; Leroy, E.M. Is Marburg Virus Enzootic in Gabon? J. Infect. Dis. 2011, 204, S800–S803. [Google Scholar] [CrossRef]
- Pourrut, X.; Souris, M.; Towner, J.S.; Rollin, P.E.; Nichol, S.T.; Gonzalez, J.-P.; Leroy, E. Large Serological Survey Showing Cocirculation of Ebola and Marburg Viruses in Gabonese Bat Populations, and a High Seroprevalence of Both Viruses in Rousettus Aegyptiacus. BMC Infect. Dis. 2009, 9, 159. [Google Scholar] [CrossRef]
- Singh, J.P.; Abdeljawad, T.; Baleanu, D.; Kumar, S. Transmission Dynamics of a Novel Fractional Model for the Marburg Virus and Recommended Actions. Eur. Phys. J. Spec. Top. 2023. [Google Scholar] [CrossRef]
- Kortepeter, M.G.; Dierberg, K.; Shenoy, E.S.; Cieslak, T.J. Marburg Virus Disease: A Summary for Clinicians. Int. J. Infect. Dis. 2020, 99, 233–242. [Google Scholar] [CrossRef] [PubMed]
- Dulin, N.; Spanier, A.; Merino, K.; Hutter, J.N.; Waterman, P.E.; Lee, C.; Hamer, M.J. Systematic Review of Marburg Virus Vaccine Nonhuman Primate Studies and Human Clinical Trials. Vaccine 2021, 39, 202–208. [Google Scholar] [CrossRef]
- Abir, M.H.; Rahman, T.; Das, A.; Etu, S.N.; Nafiz, I.H.; Rakib, A.; Mitra, S.; Emran, T.B.; Dhama, K.; Islam, A.; et al. Pathogenicity and Virulence of Marburg Virus. Virulence 2022, 13, 609–633. [Google Scholar] [CrossRef] [PubMed]
- Ehn, M.; Eriksson, L.C.; Åkerberg, N.; Johansson, A.-C. Activity Monitors as Support for Older Persons’ Physical Activity in Daily Life: Qualitative Study of the Users’ Experiences. JMIR MHealth UHealth 2018, 6, e34. [Google Scholar] [CrossRef] [PubMed]
- Camp, N.; Lewis, M.; Hunter, K.; Johnston, J.; Zecca, M.; Di Nuovo, A.; Magistro, D. Technology Used to Recognize Activities of Daily Living in Community-Dwelling Older Adults. Int. J. Environ. Res. Public Health 2020, 18, 163. [Google Scholar] [CrossRef]
- Buecking, B.; Eschbach, D.; Knobe, M.; Oberkircher, L.; Balzer-Geldsetzer, M.; Dodel, R.; Sielski, R.; Doering, B.; Ruchholtz, S.; Bliemel, C. Predictors of Noninstitutionalized Survival 1 Year after Hip Fracture: A Prospective Observational Study to Develop the Marburg Rehabilitation Tool for Hip Fractures (MaRTHi). Medicine 2017, 96, e7820. [Google Scholar] [CrossRef] [PubMed]
- Factsheet about Marburg Virus Disease. Available online: https://www.ecdc.europa.eu/en/infectious-disease-topics/z-disease-list/ebola-virus-disease/facts/factsheet-about-marburg-virus (accessed on 22 October 2023).
- Cross, R.W.; Longini, I.M.; Becker, S.; Bok, K.; Boucher, D.; Carroll, M.W.; Díaz, J.V.; Dowling, W.E.; Draghia-Akli, R.; Duworko, J.T.; et al. An Introduction to the Marburg Virus Vaccine Consortium, MARVAC. PLoS Pathog. 2022, 18, e1010805. [Google Scholar] [CrossRef]
- O’Donnell, K.L.; Feldmann, F.; Kaza, B.; Clancy, C.S.; Hanley, P.W.; Fletcher, P.; Marzi, A. Rapid Protection of Nonhuman Primates against Marburg Virus Disease Using a Single Low-Dose VSV-Based Vaccine. EBioMedicine 2023, 89, 104463. [Google Scholar] [CrossRef]
- Douglas, K.M.; Sutton, R.M.; Cichocka, A. The Psychology of Conspiracy Theories. Curr. Dir. Psychol. Sci. 2017, 26, 538–542. [Google Scholar] [CrossRef]
- Douglas, K.M.; Sutton, R.M. What Are Conspiracy Theories? A Definitional Approach to Their Correlates, Consequences, and Communication. Annu. Rev. Psychol. 2023, 74, 271–298. [Google Scholar] [CrossRef]
- Franks, B.; Bangerter, A.; Bauer, M.W.; Hall, M.; Noort, M.C. Beyond “Monologicality”? Exploring Conspiracist Worldviews. Front. Psychol. 2017, 8, 861. [Google Scholar] [CrossRef] [PubMed]
- Douglas, K.M.; Sutton, R.M.; Callan, M.J.; Dawtry, R.J.; Harvey, A.J. Someone Is Pulling the Strings: Hypersensitive Agency Detection and Belief in Conspiracy Theories. Think. Reason. 2016, 22, 57–77. [Google Scholar] [CrossRef]
- Uscinski, J.E.; Parent, J.M. American Conspiracy Theories; Oxford University Press: London, UK, 2014; ISBN 9780199351800. [Google Scholar]
- Freeman, D.; Bentall, R.P. The Concomitants of Conspiracy Concerns. Soc. Psychiatry Psychiatr. Epidemiol. 2017, 52, 595–604. [Google Scholar] [CrossRef] [PubMed]
- Craft, S.; Ashley, S.; Maksl, A. News Media Literacy and Conspiracy Theory Endorsement. Commun. Public 2017, 2, 388–401. [Google Scholar] [CrossRef]
- Douglas, K.M. Are Conspiracy Theories Harmless? Span. J. Psychol. 2021, 24, e13. [Google Scholar] [CrossRef] [PubMed]
- Jolley, D.; Douglas, K.M. The Effects of Anti-Vaccine Conspiracy Theories on Vaccination Intentions. PLoS ONE 2014, 9, e89177. [Google Scholar] [CrossRef] [PubMed]
- Einstein, K.L.; Glick, D.M. Do I Think BLS Data Are BS? The Consequences of Conspiracy Theories. Polit. Behav. 2015, 37, 679–701. [Google Scholar] [CrossRef]
- Sternisko, A.; Cichocka, A.; Van Bavel, J.J. The Dark Side of Social Movements: Social Identity, Non-Conformity, and the Lure of Conspiracy Theories. Curr. Opin. Psychol. 2020, 35, 1–6. [Google Scholar] [CrossRef]
- Bilewicz, M.; Winiewski, M.; Kofta, M.; Wójcik, A. Harmful Ideas, the Structure and Consequences of anti-Semitic Beliefs in Poland. Polit. Psychol. 2013, 34, 821–839. [Google Scholar] [CrossRef]
- Golec de Zavala, A.; Cichocka, A. Collective Narcissism and Anti-Semitism in Poland. Group Process. Intergroup Relat. 2012, 15, 213–229. [Google Scholar] [CrossRef]
- Kofta, M.; Soral, W.; Bilewicz, M. What Breeds Conspiracy Antisemitism? The Role of Political Uncontrollability and Uncertainty in the Belief in Jewish Conspiracy. J. Pers. Soc. Psychol. 2020, 118, 900–918. [Google Scholar] [CrossRef] [PubMed]
- Douglas, K.M.; Sutton, R.M. Climate Change: Why the Conspiracy Theories Are Dangerous. Bull. At. Sci. 2015, 71, 98–106. [Google Scholar] [CrossRef]
- Lewandowsky, S.; Gignac, G.E.; Oberauer, K. The Role of Conspiracist Ideation and Worldviews in Predicting Rejection of Science. PLoS ONE 2013, 8, e75637. [Google Scholar] [CrossRef] [PubMed]
- Uscinski, J.E.; Douglas, K.; Lewandowsky, S. Climate Change Conspiracy Theories. In Oxford Research Encyclopedia of Climate Science; Oxford University Press: Oxford, UK, 2017. [Google Scholar] [CrossRef]
- Craciun, C.; Baban, A. “Who Will Take the Blame?”: Understanding the Reasons Why Romanian Mothers Decline HPV Vaccination for Their Daughters. Vaccine 2012, 30, 6789–6793. [Google Scholar] [CrossRef] [PubMed]
- Lamberty, P.; Imhoff, R. Powerful Pharma and Its Marginalized Alternatives?: Effects of Individual Differences in Conspiracy Mentality on Attitudes toward Medical Approaches. Soc. Psychol. 2018, 49, 255–270. [Google Scholar] [CrossRef]
- Oliver, J.E.; Wood, T. Medical Conspiracy Theories and Health Behaviors in the United States. JAMA Intern. Med. 2014, 174, 817. [Google Scholar] [CrossRef] [PubMed]
- Grebe, E.; Nattrass, N. AIDS Conspiracy Beliefs and Unsafe Sex in Cape Town. AIDS Behav. 2012, 16, 761–773. [Google Scholar] [CrossRef]
- Thorburn, S.; Bogart, L.M. Conspiracy Beliefs about Birth Control: Barriers to Pregnancy Prevention among African Americans of Reproductive Age. Health Educ. Behav. 2005, 32, 474–487. [Google Scholar] [CrossRef]
- Natoli, E.E.; Marques, M.D. The Antidepressant Hoax: Conspiracy Theories Decrease Health-seeking Intentions. Br. J. Soc. Psychol. 2021, 60, 902–923. [Google Scholar] [CrossRef]
- Hartman, T.K.; Marshall, M.; Stocks, T.V.A.; McKay, R.; Bennett, K.; Butter, S.; Gibson Miller, J.; Hyland, P.; Levita, L.; Martinez, A.P.; et al. Different Conspiracy Theories Have Different Psychological and Social Determinants: Comparison of Three Theories about the Origins of the COVID-19 Virus in a Representative Sample of the UK Population. Front. Polit. Sci. 2021, 3, 642510. [Google Scholar] [CrossRef]
- Marinthe, G.; Brown, G.; Delouvée, S.; Jolley, D. Looking out for Myself: Exploring the Relationship between Conspiracy Mentality, Perceived Personal Risk, and COVID-19 Prevention Measures. Br. J. Health Psychol. 2020, 25, 957–980. [Google Scholar] [CrossRef] [PubMed]
- Wood, C.; Finlay, W.M.L. British National Party Representations of Muslims in the Month after the London Bombings: Homogeneity, Threat, and the Conspiracy Tradition. Br. J. Soc. Psychol. 2008, 47, 707–726. [Google Scholar] [CrossRef] [PubMed]
- Uscinski, J.E. Conspiracy Theories and the People Who Believe Them; Oxford University Press: London, UK, 2018; ISBN 9780190844073. [Google Scholar]
- Metaxas, P.; Finn, S. The Infamous #Pizzagate Conspiracy Theory: Insight from a TwitterTrails Investigation. Available online: https://repository.wellesley.edu/islandora/object/ir%3A300/datastream/PDF/view (accessed on 22 October 2023).
- Sunstein, C.R.; Vermeule, A. Conspiracy Theories: Causes and Cures. J. Polit. Philos. 2009, 17, 202–227. [Google Scholar] [CrossRef]
- Zollo, F.; Novak, P.K.; Del Vicario, M.; Bessi, A.; Mozetič, I.; Scala, A.; Caldarelli, G.; Quattrociocchi, W. Emotional Dynamics in the Age of Misinformation. PLoS ONE 2015, 10, e0138740. [Google Scholar] [CrossRef] [PubMed]
- Sapountzis, A.; Condor, S. Conspiracy Accounts as Intergroup Theories: Challenging Dominant Understandings of Social Power and Political Legitimacy. Polit. Psychol. 2013, 34, 731–752. [Google Scholar] [CrossRef]
- Lantian, A.; Muller, D.; Nurra, C.; Klein, O.; Berjot, S.; Pantazi, M. Stigmatized Beliefs: Conspiracy Theories, Anticipated Negative Evaluation of the Self, and Fear of Social Exclusion. Eur. J. Soc. Psychol. 2018, 48, 939–954. [Google Scholar] [CrossRef]
- Mavragani, A.; Ochoa, G.; Tsagarakis, K.P. Assessing the Methods, Tools, and Statistical Approaches in Google Trends Research: Systematic Review. J. Med. Internet Res. 2018, 20, e270. [Google Scholar] [CrossRef]
- Shahid, F.; Zameer, A.; Muneeb, M. Predictions for COVID-19 with Deep Learning Models of LSTM, GRU and Bi-LSTM. Chaos Solitons Fractals 2020, 140, 110212. [Google Scholar] [CrossRef]
- Chandra, R.; Jain, A.; Singh Chauhan, D. Deep Learning via LSTM Models for COVID-19 Infection Forecasting in India. PLoS ONE 2022, 17, e0262708. [Google Scholar] [CrossRef]
- Alabdulrazzaq, H.; Alenezi, M.N.; Rawajfih, Y.; Alghannam, B.A.; Al-Hassan, A.A.; Al-Anzi, F.S. On the Accuracy of ARIMA Based Prediction of COVID-19 Spread. Results Phys. 2021, 27, 104509. [Google Scholar] [CrossRef]
- Anne, W.R.; Jeeva, S.C. ARIMA Modelling of Predicting COVID-19 Infections. bioRxiv 2020. [Google Scholar] [CrossRef]
- Katoch, R.; Sidhu, A. An Application of ARIMA Model to Forecast the Dynamics of COVID-19 Epidemic in India. Glob. Bus. Rev. 2021, 097215092098865. [Google Scholar] [CrossRef]
- Ospina, R.; Gondim, J.A.M.; Leiva, V.; Castro, C. An Overview of Forecast Analysis with ARIMA Models during the COVID-19 Pandemic: Methodology and Case Study in Brazil. Mathematics 2023, 11, 3069. [Google Scholar] [CrossRef]
- Vilinová, K.; Petrikovičová, L. Spatial Autocorrelation of COVID-19 in Slovakia. Trop. Med. Infect. Dis. 2023, 8, 298. [Google Scholar] [CrossRef]
- El Deeb, O. Spatial Autocorrelation and the Dynamics of the Mean Center of COVID-19 Infections in Lebanon. Front. Appl. Math. Stat. 2021, 6, 620064. [Google Scholar] [CrossRef]
- Iftikhar, H.; Daniyal, M.; Qureshi, M.; Tawaiah, K.; Ansah, R.K.; Afriyie, J.K. A Hybrid Forecasting Technique for Infection and Death from the Mpox Virus. Digit. Health 2023, 9, 20552076231204748. [Google Scholar] [CrossRef]
- Long, B.; Tan, F.; Newman, M. Forecasting the Monkeypox Outbreak Using ARIMA, Prophet, NeuralProphet, and LSTM Models in the United States. Forecasting 2023, 5, 127–137. [Google Scholar] [CrossRef]
- Nakayama, E.; Saijo, M. Animal Models for Ebola and Marburg Virus Infections. Front. Microbiol. 2013, 4, 267. [Google Scholar] [CrossRef]
- Shifflett, K.; Marzi, A. Marburg Virus Pathogenesis—Differences and Similarities in Humans and Animal Models. Virol. J. 2019, 16, 165. [Google Scholar] [CrossRef]
- Wei, W.; Wang, G.; Tao, X.; Luo, Q.; Chen, L.; Bao, X.; Liu, Y.; Jiang, J.; Liang, H.; Ye, L. Time Series Prediction for the Epidemic Trends of Monkeypox Using the ARIMA, Exponential Smoothing, GM (1, 1) and LSTM Deep Learning Methods. J. Gen. Virol. 2023, 104, 001839. [Google Scholar] [CrossRef]
- Xiao, J.; Mo, M.; Wang, Z.; Zhou, C.; Shen, J.; Yuan, J.; He, Y.; Zheng, Y. The Application and Comparison of Machine Learning Models for the Prediction of Breast Cancer Prognosis: Retrospective Cohort Study. JMIR Med. Inform. 2022, 10, e33440. [Google Scholar] [CrossRef] [PubMed]
- Priyadarshini, I.; Mohanty, P.; Kumar, R.; Taniar, D. Monkeypox Outbreak Analysis: An Extensive Study Using Machine Learning Models and Time Series Analysis. Computers 2023, 12, 36. [Google Scholar] [CrossRef]
- Pathan, R.K.; Uddin, M.A.; Paul, A.M.; Uddin, M.I.; Hamd, Z.Y.; Aljuaid, H.; Khandaker, M.U. Monkeypox Genome Mutation Analysis Using a Timeseries Model Based on Long Short-Term Memory. PLoS ONE 2023, 18, e0290045. [Google Scholar] [CrossRef] [PubMed]
- Eid, M.M.; El-Kenawy, E.-S.M.; Khodadadi, N.; Mirjalili, S.; Khodadadi, E.; Abotaleb, M.; Alharbi, A.H.; Abdelhamid, A.A.; Ibrahim, A.; Amer, G.M.; et al. Meta-Heuristic Optimization of LSTM-Based Deep Network for Boosting the Prediction of Monkeypox Cases. Mathematics 2022, 10, 3845. [Google Scholar] [CrossRef]
- Patwary, M.M.; Hossan, J.; Billah, S.M.; Kabir, M.P.; Rodriguez-Morales, A.J. Mapping Spatio-Temporal Distribution of Monkeypox Disease Incidence: A Global Hotspot Analysis. New Microbes New Infect. 2023, 53, 101150. [Google Scholar] [CrossRef]
- Du, M.; Yan, W.; Zhu, L.; Liang, W.; Liu, M.; Liu, J. Trends in the Baidu Index in Search Activity Related to Mpox at Geographical and Economic Levels and Associated Factors in China: National Longitudinal Analysis. JMIR Form. Res. 2023, 7, e44031. [Google Scholar] [CrossRef]
- Oleksy, T.; Wnuk, A.; Maison, D.; Łyś, A. Content Matters. Different Predictors and Social Consequences of General and Government-Related Conspiracy Theories on COVID-19. Pers. Individ. Dif. 2021, 168, 110289. [Google Scholar] [CrossRef]
- McKay, D.; Heisler, M.; Mishori, R.; Catton, H.; Kloiber, O. Attacks against Health-Care Personnel Must Stop, Especially as the World Fights COVID-19. Lancet 2020, 395, 1743–1745. [Google Scholar] [CrossRef]
- Ball, P.; Maxmen, A. The Epic Battle against Coronavirus Misinformation and Conspiracy Theories. Nature 2020, 581, 371–374. [Google Scholar] [CrossRef]
- Goodman, J.; Carmichael, F. Coronavirus Tests: Swabs Don’t Damage the Brain and Other Claims Fact-Checked. BBC, 18 July 2020. [Google Scholar]
- Leung, N.H.L.; Chu, D.K.W.; Shiu, E.Y.C.; Chan, K.-H.; McDevitt, J.J.; Hau, B.J.P.; Yen, H.-L.; Li, Y.; Ip, D.K.M.; Peiris, J.S.M.; et al. Respiratory Virus Shedding in Exhaled Breath and Efficacy of Face Masks. Nat. Med. 2020, 26, 676–680. [Google Scholar] [CrossRef] [PubMed]
- Desta, T.T.; Mulugeta, T. Living with COVID-19-Triggered Pseudoscience and Conspiracies. Int. J. Public Health 2020, 65, 713–714. [Google Scholar] [CrossRef] [PubMed]
- Coronavirus (COVID-19) Overview. Available online: https://www.webmd.com/lung/news/20200728/webmd-covid-vaccine-poll (accessed on 23 October 2023).
- Langguth, J.; Filkuková, P.; Brenner, S.; Schroeder, D.T.; Pogorelov, K. COVID-19 and 5G Conspiracy Theories: Long Term Observation of a Digital Wildfire. Int. J. Data Sci. Anal. 2023, 15, 329–346. [Google Scholar] [CrossRef] [PubMed]
- Bateman, C. Paying the Price for AIDS Denialism. S. Afr. Med. J. 2007, 97, 912. [Google Scholar]
- Simelela, N.; Venter, W.D.F.; Pillay, Y.; Barron, P. A Political and Social History of HIV in South Africa. Curr. HIV/AIDS Rep. 2015, 12, 256–261. [Google Scholar] [CrossRef]
- Nattrass, N. AIDS and the Scientific Governance of Medicine in Post-Apartheid South Africa. Afr. Aff. 2008, 107, 157–176. [Google Scholar] [CrossRef]
- Freeman, D.; Waite, F.; Rosebrock, L.; Petit, A.; Causier, C.; East, A.; Jenner, L.; Teale, A.-L.; Carr, L.; Mulhall, S.; et al. Coronavirus Conspiracy Beliefs, Mistrust, and Compliance with Government Guidelines in England. Psychol. Med. 2022, 52, 251–263. [Google Scholar] [CrossRef]
- Motta, M.; Stecula, D.; Farhart, C. How Right-Leaning Media Coverage of COVID-19 Facilitated the Spread of Misinformation in the Early Stages of the Pandemic in the U.s. Can. J. Polit. Sci. 2020, 53, 335–342. [Google Scholar] [CrossRef]
- Morejón-Llamas, N.; Cristòfol, F.J. Monkeypox, Disinformation, and Fact-Checking: A Review of Ten Iberoamerican Countries in the Context of Public Health Emergency. Information 2023, 14, 390. [Google Scholar] [CrossRef]
- Zenone, M.; Caulfield, T. Using Data from a Short Video Social Media Platform to Identify Emergent Monkeypox Conspiracy Theories. JAMA Netw. Open 2022, 5, e2236993. [Google Scholar] [CrossRef]
- Aslanidis, N.; Bariviera, A.F.; López, Ó.G. The Link between Cryptocurrencies and Google Trends Attention. Fin. Res. Lett. 2022, 47, 102654. [Google Scholar] [CrossRef]
- Arratia, A.; López-Barrantes, A.X. Do Google Trends Forecast Bitcoins? Stylized Facts and Statistical Evidence. J. Bank. Financ. Technol. 2021, 5, 45–57. [Google Scholar] [CrossRef]
- Błajda, J.; Kucab, A.; Miazga, A.; Masłowski, M.; Kopańska, M.; Nowak, A.; Barnaś, E. Google Trends Analysis Reflecting Internet Users’ Interest in Selected Terms of Sexual and Reproductive Health in Ukraine. Healthcare 2023, 11, 1541. [Google Scholar] [CrossRef] [PubMed]
- Dolkar, T.; Gowda, S.; Chatterjee, S. Cardiac Symptoms during the Russia-Ukraine War: A Google Trends Analysis. Cureus 2023, 15, e36676. [Google Scholar] [CrossRef] [PubMed]
- Dancy, G.; Fariss, C.J. The Global Resonance of Human Rights: What Google Trends Can Tell Us. Am. Polit. Sci. Rev. 2023, 1–22. [Google Scholar] [CrossRef]
- Voukelatou, V.; Miliou, I.; Giannotti, F.; Pappalardo, L. Understanding Peace through the World News. EPJ Data Sci. 2022, 11, 2. [Google Scholar] [CrossRef]
- Puksas, A.; Gudelis, D.; Raišienė, A.G.; Gudelienė, N. Business, Government, Society and Science Interest in Co-Production by Relative Evaluation Using Google Trends. Manag. Organ. Syst. Res. 2019, 81, 55–71. [Google Scholar] [CrossRef]
- Bełej, M. Does Google Trends Show the Strength of Social Interest as a Predictor of Housing Price Dynamics? Sustainability 2022, 14, 5601. [Google Scholar] [CrossRef]
- Di Spirito, F.; Bramanti, A.; Cannatà, D.; Coppola, N.; Di Palo, M.P.; Savarese, G.; Amato, M. Oral and Dental Needs and Teledentistry Applications in the Elderly: Real-Time Surveillance Using Google Trends. Appl. Sci. 2023, 13, 5416. [Google Scholar] [CrossRef]
- Wang, H.-W.; Chen, D.-R.; Yu, H.-W.; Chen, Y.-M. Forecasting the Incidence of Dementia and Dementia-Related Outpatient Visits with Google Trends: Evidence from Taiwan. J. Med. Internet Res. 2015, 17, e264. [Google Scholar] [CrossRef]
- Alqhtani, M.; Saad, K.M.; Shah, R.; Hamanah, W.M. Discovering Novel Soliton Solutions for (3+1)-Modified Fractional Zakharov–Kuznetsov Equation in Electrical Engineering through an Analytical Approach. Opt. Quantum Electron. 2023, 55, 1149. [Google Scholar] [CrossRef]
- Alshehry, A.S.; Yasmin, H.; Shah, R.; Ullah, R.; Khan, A. Fractional-Order Modeling: Analysis of Foam Drainage and Fisher’s Equations. Open Phys. 2023, 21, 20230115. [Google Scholar] [CrossRef]
- Yasmin, H.; Aljahdaly, N.H.; Saeed, A.M.; Shah, R. Probing Families of Optical Soliton Solutions in Fractional Perturbed Radhakrishnan–Kundu–Lakshmanan Model with Improved Versions of Extended Direct Algebraic Method. Fractal Fract. 2023, 7, 512. [Google Scholar] [CrossRef]
- Nuti, S.V.; Wayda, B.; Ranasinghe, I.; Wang, S.; Dreyer, R.P.; Chen, S.I.; Murugiah, K. The Use of Google Trends in Health Care Research: A Systematic Review. PLoS ONE 2014, 9, e109583. [Google Scholar] [CrossRef]
- Cervellin, G.; Comelli, I.; Lippi, G. Is Google Trends a Reliable Tool for Digital Epidemiology? Insights from Different Clinical Settings. J. Epidemiol. Glob. Health 2017, 7, 185. [Google Scholar] [CrossRef]
- Sivesind, T.E.; Szeto, M.D.; Kim, W.; Dellavalle, R.P. Google Trends in Dermatology: Scoping Review of the Literature. JMIR Dermatol. 2021, 4, e27712. [Google Scholar] [CrossRef]
- Ginsberg, J.; Mohebbi, M.H.; Patel, R.S.; Brammer, L.; Smolinski, M.S.; Brilliant, L. Detecting Influenza Epidemics Using Search Engine Query Data. Nature 2009, 457, 1012–1014. [Google Scholar] [CrossRef]
- Kapitány-Fövény, M.; Ferenci, T.; Sulyok, Z.; Kegele, J.; Richter, H.; Vályi-Nagy, I.; Sulyok, M. Can Google Trends Data Improve Forecasting of Lyme Disease Incidence? Zoonoses Public Health 2019, 66, 101–107. [Google Scholar] [CrossRef]
- Verma, M.; Kishore, K.; Kumar, M.; Sondh, A.R.; Aggarwal, G.; Kathirvel, S. Google Search Trends Predicting Disease Outbreaks: An Analysis from India. Healthc. Inform. Res. 2018, 24, 300. [Google Scholar] [CrossRef]
- Young, S.D.; Torrone, E.A.; Urata, J.; Aral, S.O. Using Search Engine Data as a Tool to Predict Syphilis. Epidemiology 2018, 29, 574–578. [Google Scholar] [CrossRef]
- Young, S.D.; Zhang, Q. Using Search Engine Big Data for Predicting New HIV Diagnoses. PLoS ONE 2018, 13, e0199527. [Google Scholar] [CrossRef] [PubMed]
- Morsy, S.; Dang, T.N.; Kamel, M.G.; Zayan, A.H.; Makram, O.M.; Elhady, M.; Hirayama, K.; Huy, N.T. Prediction of Zika-Confirmed Cases in Brazil and Colombia Using Google Trends. Epidemiol. Infect. 2018, 146, 1625–1627. [Google Scholar] [CrossRef] [PubMed]
- Google Trends. Available online: https://trends.google.com/trends/ (accessed on 27 October 2023).
- Carneiro, H.A.; Mylonakis, E. Google Trends: A Web-based Tool for Real-time Surveillance of Disease Outbreaks. Clin. Infect. Dis. 2009, 49, 1557–1564. [Google Scholar] [CrossRef] [PubMed]
- Fang, Y.; Shepherd, T.A.; Smith, H.E. Examining the Trends in Online Health Information–Seeking Behavior about Chronic Obstructive Pulmonary Disease in Singapore: Analysis of Data from Google Trends and the Global Burden of Disease Study. J. Med. Internet Res. 2021, 23, e19307. [Google Scholar] [CrossRef]
- Arora, V.S.; McKee, M.; Stuckler, D. Google Trends: Opportunities and Limitations in Health and Health Policy Research. Health Policy 2019, 123, 338–341. [Google Scholar] [CrossRef]
- Mellon, J. Where and When Can We Use Google Trends to Measure Issue Salience? PS Polit. Sci. Polit. 2013, 46, 280–290. [Google Scholar] [CrossRef]
- Holle, R.; Hochadel, M.; Reitmeir, P.; Meisinger, C.; Wichmann, H.-E. Prolonged Recruitment Efforts in Health Surveys: Effects on Response, Costs, and Potential Bias. Epidemiology 2006, 17, 639–643. [Google Scholar] [CrossRef]
- Thakur, N.; Cui, S.; Patel, K.A.; Hall, I.; Duggal, Y.N. A Large-Scale Dataset of Search Interests Related to Disease X Originating from Different Geographic Regions. Data 2023, 8, 163. [Google Scholar] [CrossRef]
- Adawi, M.; Bragazzi, N.L.; Watad, A.; Sharif, K.; Amital, H.; Mahroum, N. Discrepancies between Classic and Digital Epidemiology in Searching for the Mayaro Virus: Preliminary Qualitative and Quantitative Analysis of Google Trends. JMIR Public Health Surveill. 2017, 3, e93. [Google Scholar] [CrossRef]
- Szmuda, T.; Ali, S.; Hetzger, T.V.; Rosvall, P.; Słoniewski, P. Are Online Searches for the Novel Coronavirus (COVID-19) Related to Media or Epidemiology? A Cross-Sectional Study. Int. J. Infect. Dis. 2020, 97, 386–390. [Google Scholar] [CrossRef]
- Yuan, K.; Huang, G.; Wang, L.; Wang, T.; Liu, W.; Jiang, H.; Yang, A.C. Predicting Norovirus in the United States Using Google Trends: Infodemiology Study. J. Med. Internet Res. 2021, 23, e24554. [Google Scholar] [CrossRef]
- Lee, J.; Kwan, Y.; Lee, J.Y.; Shin, J.I.; Lee, K.H.; Hong, S.H.; Han, Y.J.; Kronbichler, A.; Smith, L.; Koyanagi, A.; et al. Public Interest in Immunity and the Justification for Intervention in the Early Stages of the COVID-19 Pandemic: Analysis of Google Trends Data. J. Med. Internet Res. 2021, 23, e26368. [Google Scholar] [CrossRef] [PubMed]
- Wilkinson, M.D.; Dumontier, M.; Aalbersberg, I.J.; Appleton, G.; Axton, M.; Baak, A.; Blomberg, N.; Boiten, J.-W.; da Silva Santos, L.B.; Bourne, P.E.; et al. The FAIR Guiding Principles for Scientific Data Management and Stewardship. Sci. Data 2016, 3, 160018. [Google Scholar] [CrossRef] [PubMed]
- Wishart, D.S.; Guo, A.; Oler, E.; Wang, F.; Anjum, A.; Peters, H.; Dizon, R.; Sayeeda, Z.; Tian, S.; Lee, B.L.; et al. HMDB 5.0: The Human Metabolome Database for 2022. Nucleic Acids Res. 2022, 50, D622–D631. [Google Scholar] [CrossRef]
- Slenter, D.N.; Kutmon, M.; Hanspers, K.; Riutta, A.; Windsor, J.; Nunes, N.; Mélius, J.; Cirillo, E.; Coort, S.L.; Digles, D.; et al. WikiPathways: A Multifaceted Pathway Database Bridging Metabolomics to Other Omics Research. Nucleic Acids Res. 2018, 46, D661–D667. [Google Scholar] [CrossRef]
- Banda, J.M.; Tekumalla, R.; Wang, G.; Yu, J.; Liu, T.; Ding, Y.; Artemova, E.; Tutubalina, E.; Chowell, G. A Large-Scale COVID-19 Twitter Chatter Dataset for Open Scientific Research—An International Collaboration. Epidemiologia 2021, 2, 315–324. [Google Scholar] [CrossRef] [PubMed]
- Thakur, N. A Large-Scale Dataset of Twitter Chatter about Online Learning during the Current COVID-19 Omicron Wave. Data 2022, 7, 109. [Google Scholar] [CrossRef]
- Nia, Z.M.; Bragazzi, N.L.; Wu, J.; Kong, J.D. A Twitter Dataset for Monkeypox, May 2022. Data Brief 2023, 48, 109118. [Google Scholar] [CrossRef]
- Gjerding, M.N.; Taghizadeh, A.; Rasmussen, A.; Ali, S.; Bertoldo, F.; Deilmann, T.; Knøsgaard, N.R.; Kruse, M.; Larsen, A.H.; Manti, S.; et al. Recent Progress of the Computational 2D Materials Database (C2DB). 2D Mater. 2021, 8, 044002. [Google Scholar] [CrossRef]
- Kearnes, S.M.; Maser, M.R.; Wleklinski, M.; Kast, A.; Doyle, A.G.; Dreher, S.D.; Hawkins, J.M.; Jensen, K.F.; Coley, C.W. The Open Reaction Database. J. Am. Chem. Soc. 2021, 143, 18820–18826. [Google Scholar] [CrossRef]
- Goodsell, D.S.; Zardecki, C.; Di Costanzo, L.; Duarte, J.M.; Hudson, B.P.; Persikova, I.; Segura, J.; Shao, C.; Voigt, M.; Westbrook, J.D.; et al. RCSB Protein Data Bank: Enabling Biomedical Research and Drug Discovery. Protein Sci. 2020, 29, 52–65. [Google Scholar] [CrossRef] [PubMed]
- Urban, M.; Cuzick, A.; Seager, J.; Wood, V.; Rutherford, K.; Venkatesh, S.Y.; De Silva, N.; Martinez, M.C.; Pedro, H.; Yates, A.D.; et al. PHI-Base: The Pathogen–Host Interactions Database. Nucleic Acids Res. 2019, 48, D613–D620. [Google Scholar] [CrossRef] [PubMed]
- Seltzer, W. The Promise and Pitfalls of Data Mining: Ethical Issues. Available online: https://ww2.amstat.org/committees/ethics/linksdir/Jsm2005Seltzer.pdf (accessed on 12 November 2023).
- Ethical Guidelines for Statistical Practice. Available online: https://www.amstat.org/your-career/ethical-guidelines-for-statistical-practice (accessed on 12 November 2023).
- Google Trends Support. Available online: https://support.google.com/trends/answer/4365533 (accessed on 12 November 2023).
- Privacy Policy—Privacy & Terms—Google. Available online: https://policies.google.com/privacy?hl=en-US (accessed on 12 November 2023).
- Dubber, M.D.; Pasquale, F.; Das, S. The Oxford Handbook of Ethics of AI; Oxford Handbooks; Oxford University Press: Oxford, UK, 2020; ISBN 9780190067397. [Google Scholar]


| List of Regions |
|---|
| Afghanistan, Åland Islands, Albania, Algeria, American Samoa, Andorra, Angola, Antigua and Barbuda, Argentina, Armenia, Aruba, Australia, Austria, Azerbaijan, Bahamas, Bahrain, Bangladesh, Barbados, Belarus, Belgium, Belize, Benin, Bermuda, Bhutan, Bolivia, Bosnia and Herzegovina, Botswana, Brazil, British Virgin Islands, Brunei, Bulgaria, Burkina, Faso, Burundi, Cambodia, Cameroon, Canada, Cape Verde, Cayman Islands, Chad, Chile, China, Colombia, Comoros, Congo—Brazzaville, Congo—Kinshasa, Costa Rica, Côte d’Ivoire, Croatia, Cuba, Curaçao, Cyprus, Czechia, Denmark, Djibouti, Dominica, Dominican Republic, Ecuador, Egypt, El Salvador, Equatorial Guinea, Estonia, Eswatini, Ethiopia, Faroe Islands, Fiji, Finland, France, French, Guiana, French, Polynesia, Gabon, Gambia, Georgia, Germany, Ghana, Gibraltar, Greece, Greenland, Grenada, Guadeloupe, Guam, Guatemala, Guernsey, Guinea, Guinea-Bissau, Guyana, Haiti, Honduras, Hong Kong, Hungary, Iceland, India, Indonesia, Iran, Iraq, Ireland, Isle of Man, Israel, Italy, Jamaica, Japan, Jersey, Jordan, Kazakhstan, Kenya, Kosovo, Kuwait, Kyrgyzstan, Laos, Latvia, Lebanon, Lesotho, Liberia, Libya, Liechtenstein, Lithuania, Luxembourg, Macao, Madagascar, Malawi, Malaysia, Maldives, Mali, Malta, Martinique, Mauritania, Mauritius, Mexico, Moldova, Mongolia, Montenegro, Morocco, Mozambique, Myanmar (Burma), Namibia, Nepal, Netherlands, New Caledonia, New Zealand, Nicaragua, Niger, Nigeria, North Macedonia, Northern Mariana Islands, Norway, Oman, Pakistan, Palestine, Panama, Papua New Guinea, Paraguay, Peru, Philippines, Poland, Portugal, Puerto Rico, Qatar, Réunion, Romania, Russia, Rwanda, Samoa, San Marino, Saudi Arabia, Senegal, Serbia, Seychelles, Sierra Leone, Singapore, Sint Maarten, Slovakia, Slovenia, Solomon Islands, Somalia, South Africa, South Korea, South Sudan, Spain, Sri Lanka, St. Barthélemy, St. Helena, St. Kitts and Nevis, St. Lucia, St. Martin, St. Pierre and Miquelon, St. Vincent and Grenadines, Sudan, Suriname, Sweden, Switzerland, Syria, Taiwan, Tajikistan, Tanzania, Thailand, Timor-Leste, Togo, Trinidad and Tobago, Tunisia, Türkiye, Turkmenistan, Turks and Caicos Islands, U.S. Virgin Islands, Uganda, Ukraine, United Arab Emirates, United Kingdom, Uruguay, USA, Uzbekistan, Vanuatu, Venezuela, Vietnam, Western Sahara, Yemen, Zambia, Zimbabwe |
| Country Name | RMSE for ARIMA (Train Set) | MSE for ARIMA (Train Set) | MAE for ARIMA (Train Set) | RMSE for ARIMA (Test Set) | MSE for ARIMA (Test Set) | MAE for ARIMA (Test Set) |
|---|---|---|---|---|---|---|
| Afghanistan | 0 | 0 | 0 | 0 | 0 | 0 |
| Åland Islands | 0 | 0 | 0 | 0 | 0 | 0 |
| Albania | 13.78808 | 190.1111 | 3.809524 | 20.00595 | 400.2381 | 6.095238 |
| Algeria | 9.59249 | 92.01587 | 3.68254 | 22.13272 | 489.8571 | 6.571429 |
| American Samoa | 0 | 0 | 0 | 0 | 0 | 0 |
| Andorra | 0 | 0 | 0 | 0 | 0 | 0 |
| Angola | 9.029933 | 81.53968 | 3.396825 | 2.488067 | 6.190476 | 0.761905 |
| Antigua and Barbuda | 16.74837 | 280.5079 | 7.253968 | 5.442338 | 29.61905 | 2.380952 |
| Argentina | 8.276952 | 68.50794 | 2.571429 | 1.091089 | 1.190476 | 0.47619 |
| Armenia | 0 | 0 | 0 | 0 | 0 | 0 |
| Aruba | 0 | 0 | 0 | 0 | 0 | 0 |
| Australia | 5.370407 | 28.84127 | 2.222222 | 7.309485 | 53.42857 | 2.952381 |
| Austria | 16.61277 | 275.9841 | 5.126984 | 5.019011 | 25.19048 | 1.809524 |
| Azerbaijan | 16.67762 | 278.1429 | 5.47619 | 4.396969 | 19.33333 | 2.190476 |
| Bahamas | 13.89616 | 193.1032 | 5.261905 | 7.857359 | 61.7381 | 3.404762 |
| Bahrain | 12.02181 | 144.5238 | 5.873016 | 16.74885 | 280.5238 | 8.095238 |
| Bangladesh | 7.380261 | 54.46825 | 3.801587 | 5.561346 | 30.92857 | 2.166667 |
| Barbados | 10.33257 | 106.7619 | 3.873016 | 9.209209 | 84.80952 | 3.904762 |
| Belarus | 0 | 0 | 0 | 0 | 0 | 0 |
| Belgium | 14.64772 | 214.5556 | 4.285714 | 3.070598 | 9.428571 | 0.952381 |
| Belize | 9.096485 | 82.74603 | 3.68254 | 6.488084 | 42.09524 | 2.904762 |
| Benin | 7.529835 | 56.69841 | 3.650794 | 13.73386 | 188.619 | 5.095238 |
| Bermuda | 0 | 0 | 0 | 0 | 0 | 0 |
| Bhutan | 12.06892 | 145.6587 | 4.833333 | 8.063734 | 65.02381 | 2.880952 |
| Bolivia | 11.99669 | 143.9206 | 4.047619 | 8.524475 | 72.66667 | 3.809524 |
| Bosnia and Herzegovina | 7.268108 | 52.8254 | 2.079365 | 7.057586 | 49.80952 | 2 |
| Botswana | 18.51833 | 342.9286 | 5.865079 | 7.851297 | 61.64286 | 3.833333 |
| Brazil | 1.339272 | 1.793651 | 0.619048 | 2.654735 | 7.047619 | 1.238095 |
| British Virgin Islands | 0 | 0 | 0 | 0 | 0 | 0 |
| Brunei | 16.08213 | 258.6349 | 5.730159 | 14.56512 | 212.1429 | 5.095238 |
| Bulgaria | 17.32463 | 300.1429 | 6.460317 | 13.12758 | 172.3333 | 5.47619 |
| Burkina Faso | 21.58924 | 466.0952 | 7.825397 | 6.636838 | 44.04762 | 2.904762 |
| Burundi | 9.040473 | 81.73016 | 2.984127 | 9.829499 | 96.61905 | 4 |
| Cambodia | 16.83628 | 283.4603 | 7.920635 | 15.45654 | 238.9048 | 8.809524 |
| Cameroon | 6.508846 | 42.36508 | 2.730159 | 24.94756 | 622.381 | 10.57143 |
| Canada | 2.875733 | 8.269841 | 1.746032 | 0.845154 | 0.714286 | 0.47619 |
| Cape Verde | 18.35886 | 337.0476 | 7.761905 | 12.40584 | 153.9048 | 6.095238 |
| Cayman Islands | 6.670237 | 44.49206 | 2.142857 | 5.300494 | 28.09524 | 2.380952 |
| Chad | 8.387443 | 70.34921 | 3.047619 | 3.690399 | 13.61905 | 1.666667 |
| Chile | 9.139136 | 83.52381 | 1.444444 | 15.43651 | 238.2857 | 2.571429 |
| China | 20.72534 | 429.5397 | 9.047619 | 10.89779 | 118.7619 | 4.285714 |
| Côte d’Ivoire | 7.041825 | 49.5873 | 2.412698 | 13.30592 | 177.0476 | 5.047619 |
| Colombia | 5.540615 | 30.69841 | 1.603175 | 0.872872 | 0.761905 | 0.380952 |
| Comoros | 5.889188 | 34.68254 | 2.126984 | 6.113996 | 37.38095 | 2.714286 |
| Congo—Brazzaville | 11.52774 | 132.8889 | 3.809524 | 8.582929 | 73.66667 | 3.47619 |
| Congo—Kinshasa | 13.79383 | 190.2698 | 5.190476 | 4.918381 | 24.19048 | 2.142857 |
| Costa Rica | 11.30599 | 127.8254 | 4.619048 | 27.79431 | 772.5238 | 11.28571 |
| Croatia | 15.55431 | 241.9365 | 5.253968 | 16.54719 | 273.8095 | 5.238095 |
| Cuba | 14.12754 | 199.5873 | 5.650794 | 15.76615 | 248.5714 | 3.714286 |
| Curaçao | 0 | 0 | 0 | 0 | 0 | 0 |
| Cyprus | 14.44969 | 208.7937 | 5.142857 | 9.534399 | 90.90476 | 4.619048 |
| Czechia | 9.922317 | 98.45238 | 3.246032 | 7.453028 | 55.54762 | 3.5 |
| Denmark | 13.02013 | 169.5238 | 4.396825 | 9.329931 | 87.04762 | 3.571429 |
| Djibouti | 0 | 0 | 0 | 0 | 0 | 0 |
| Dominica | 0 | 0 | 0 | 0 | 0 | 0 |
| Dominican Republic | 18.38305 | 337.9365 | 6.571429 | 6.879922 | 47.33333 | 2.47619 |
| Ecuador | 8.286056 | 68.65873 | 2.722222 | 4.49603 | 20.21429 | 1.928571 |
| Egypt | 9.951868 | 99.03968 | 5.214286 | 7.123068 | 50.7381 | 3.404762 |
| El Salvador | 14.10449 | 198.9365 | 3.222222 | 2.43975 | 5.952381 | 1 |
| Equatorial Guinea | 14.94275 | 223.2857 | 5.603175 | 18.76547 | 352.1429 | 7.952381 |
| Estonia | 13.93238 | 194.1111 | 4.428571 | 22.47856 | 505.2857 | 9.333333 |
| Eswatini | 17.02706 | 289.9206 | 6.968254 | 21.07809 | 444.2857 | 9.333333 |
| Ethiopia | 18.62879 | 347.0317 | 7.714286 | 23.99603 | 575.8095 | 10.47619 |
| Faroe Islands | 0 | 0 | 0 | 0 | 0 | 0 |
| Fiji | 20.84523 | 434.5238 | 8.634921 | 13.99149 | 195.7619 | 6.428571 |
| Finland | 7.618899 | 58.04762 | 2.412698 | 3.450328 | 11.90476 | 1.52381 |
| France | 1.480026 | 2.190476 | 0.603175 | 1.647509 | 2.714286 | 0.761905 |
| French Guiana | 0 | 0 | 0 | 0 | 0 | 0 |
| French Polynesia | 0 | 0 | 0 | 0 | 0 | 0 |
| Gabon | 8.54679 | 73.04762 | 3.142857 | 14.2361 | 202.6667 | 6.095238 |
| Gambia | 14.50999 | 210.5397 | 5.968254 | 11.53256 | 133 | 3.952381 |
| Georgia | 15.58082 | 242.7619 | 5.587302 | 5.550633 | 30.80952 | 2.190476 |
| Germany | 2.173067 | 4.722222 | 1.18254 | 2.198484 | 4.833333 | 1.214286 |
| Ghana | 13.6376 | 185.9841 | 7.095238 | 25.91837 | 671.7619 | 11.66667 |
| Gibraltar | 0 | 0 | 0 | 0 | 0 | 0 |
| Greece | 7.662525 | 58.71429 | 2.857143 | 19.79177 | 391.7143 | 7.238095 |
| Greenland | 0 | 0 | 0 | 0 | 0 | 0 |
| Grenada | 14.38363 | 206.8889 | 4.47619 | 12.02775 | 144.6667 | 4.619048 |
| Guadeloupe | 5.747325 | 33.03175 | 2.126984 | 2.115701 | 4.47619 | 0.666667 |
| Guam | 0 | 0 | 0 | 0 | 0 | 0 |
| Guatemala | 14.58799 | 212.8095 | 5.365079 | 5.89996 | 34.80952 | 2.380952 |
| Guernsey | 0 | 0 | 0 | 0 | 0 | 0 |
| Guinea | 12.59567 | 158.6508 | 5.285714 | 11.49534 | 132.1429 | 4.952381 |
| Guinea-Bissau | 17.11956 | 293.0794 | 4.952381 | 12.12828 | 147.0952 | 4.333333 |
| Guyana | 9.763066 | 95.31746 | 1.857143 | 14.83561 | 220.0952 | 2.619048 |
| Haiti | 10.07433 | 101.4921 | 3.650794 | 1.690309 | 2.857143 | 0.761905 |
| Honduras | 11.29827 | 127.6508 | 4.31746 | 9.892277 | 97.85714 | 3.952381 |
| Hong Kong | 10.86497 | 118.0476 | 4.460317 | 9.170346 | 84.09524 | 3.52381 |
| Hungary | 7.077799 | 50.09524 | 2.936508 | 15.23155 | 232 | 6.571429 |
| Iceland | 8.991177 | 80.84127 | 3.619048 | 28.24721 | 797.9048 | 9.142857 |
| India | 1.939563 | 3.761905 | 0.888889 | 0.9759 | 0.952381 | 0.380952 |
| Indonesia | 1.425393 | 2.031746 | 0.809524 | 1.195229 | 1.428571 | 0.714286 |
| Iran | 8.369446 | 70.04762 | 3.31746 | 6.33208 | 40.09524 | 3.238095 |
| Iraq | 17.57027 | 308.7143 | 8.126984 | 12.94126 | 167.4762 | 6.380952 |
| Ireland | 1.268069 | 1.608 | 0.488 | 1.625687 | 2.642857 | 0.642857 |
| Isle of Man | 0 | 0 | 0 | 0 | 0 | 0 |
| Israel | 11.54494 | 133.2857 | 5.031746 | 19.18705 | 368.1429 | 10.2381 |
| Italy | 4.059087 | 16.47619 | 1.888889 | 2.77746 | 7.714286 | 1.142857 |
| Jamaica | 6.163126 | 37.98413 | 2.873016 | 10.28175 | 105.7143 | 3.857143 |
| Japan | 11.6585 | 135.9206 | 4.492063 | 13.88216 | 192.7143 | 5.095238 |
| Jersey | 0 | 0 | 0 | 0 | 0 | 0 |
| Jordan | 5.61602 | 31.53968 | 2.206349 | 9.337584 | 87.19048 | 3.571429 |
| Kazakhstan | 0 | 0 | 0 | 0 | 0 | 0 |
| Kenya | 9.204899 | 84.73016 | 3.968254 | 16.88617 | 285.1429 | 8 |
| Kosovo | 8.073079 | 65.1746 | 2.15873 | 9.623879 | 92.61905 | 3.52381 |
| Kuwait | 15.4509 | 238.7302 | 7 | 24.9819 | 624.0952 | 10.85714 |
| Kyrgyzstan | 0 | 0 | 0 | 0 | 0 | 0 |
| Laos | 0 | 0 | 0 | 0 | 0 | 0 |
| Latvia | 12.78454 | 163.4444 | 4.492063 | 21.67839 | 469.9524 | 6.619048 |
| Lebanon | 16.85701 | 284.1587 | 6.285714 | 7.412987 | 54.95238 | 2.380952 |
| Lesotho | 11.6986 | 136.8571 | 5.365079 | 26.57245 | 706.0952 | 12.90476 |
| Liberia | 11.81303 | 139.5476 | 5.039683 | 16.28248 | 265.119 | 7.833333 |
| Libya | 10.5492 | 111.2857 | 5.190476 | 11.81605 | 139.619 | 4.809524 |
| Liechtenstein | 0 | 0 | 0 | 0 | 0 | 0 |
| Lithuania | 11.90038 | 141.619 | 3.809524 | 6.45866 | 41.71429 | 2.380952 |
| Luxembourg | 6.737717 | 45.39683 | 2 | 24.15919 | 583.6667 | 10.2381 |
| Macao | 14.08985 | 198.5238 | 4.285714 | 6.561068 | 43.04762 | 2.190476 |
| Madagascar | 11.76894 | 138.5079 | 3.52381 | 25.11213 | 630.619 | 9.190476 |
| Malawi | 13.69973 | 187.6825 | 4.603175 | 17.36718 | 301.619 | 6.095238 |
| Malaysia | 4.101877 | 16.8254 | 2.222222 | 4.649629 | 21.61905 | 2 |
| Maldives | 12.7895 | 163.5714 | 4.301587 | 21.52629 | 463.381 | 9.333333 |
| Mali | 10.19103 | 103.8571 | 3.873016 | 19.22548 | 369.619 | 10.90476 |
| Malta | 13.12093 | 172.1587 | 4.857143 | 5.191568 | 26.95238 | 2.285714 |
| Martinique | 12.62336 | 159.3492 | 4.285714 | 29.56188 | 873.9048 | 13.38095 |
| Mauritania | 20.30404 | 412.254 | 8.761905 | 12.12043 | 146.9048 | 4.857143 |
| Mauritius | 12.63593 | 159.6667 | 4.777778 | 24.51336 | 600.9048 | 11.04762 |
| Mexico | 4.037522 | 16.30159 | 1.380952 | 1.759329 | 3.095238 | 1 |
| Moldova | 0 | 0 | 0 | 0 | 0 | 0 |
| Mongolia | 8.125504 | 66.02381 | 2.626984 | 4.753445 | 22.59524 | 2.214286 |
| Montenegro | 13.7708 | 189.6349 | 3.444444 | 8.799351 | 77.42857 | 3.142857 |
| Morocco | 17.04033 | 290.373 | 7.309524 | 17.09985 | 292.4048 | 7.119048 |
| Mozambique | 11.9227 | 142.1508 | 3.007937 | 8.617535 | 74.2619 | 3.595238 |
| Myanmar (Burma) | 9.760627 | 95.26984 | 2.349206 | 15.51497 | 240.7143 | 3.047619 |
| Namibia | 12.94524 | 167.5794 | 4.944444 | 22.81969 | 520.7381 | 7.166667 |
| Nepal | 16.66381 | 277.6825 | 6.52381 | 4.353433 | 18.95238 | 1.428571 |
| Netherlands | 15.66363 | 245.3492 | 4.52381 | 10.36937 | 107.5238 | 4.333333 |
| New Caledonia | 0 | 0 | 0 | 0 | 0 | 0 |
| New Zealand | 6.948792 | 48.28571 | 3.047619 | 10.13246 | 102.6667 | 3.904762 |
| Nicaragua | 5.087333 | 25.88095 | 1.515873 | 1.870829 | 3.5 | 0.880952 |
| Niger | 4.739232 | 22.46032 | 1.809524 | 22.90872 | 524.8095 | 7.52381 |
| Nigeria | 9.814955 | 96.33333 | 3.888889 | 9.763879 | 95.33333 | 3.52381 |
| North Macedonia | 14.08928 | 198.5079 | 4.063492 | 4.203173 | 17.66667 | 1.857143 |
| Northern Mariana Islands | 0 | 0 | 0 | 0 | 0 | 0 |
| Norway | 8.161563 | 66.61111 | 3.02381 | 4.896549 | 23.97619 | 2.309524 |
| Oman | 12.69921 | 161.2698 | 5.666667 | 21.22218 | 450.381 | 8.52381 |
| Pakistan | 9.568467 | 91.55556 | 3.349206 | 6.06316 | 36.7619 | 2.190476 |
| Palestine | 0 | 0 | 0 | 0 | 0 | 0 |
| Panama | 14.65097 | 214.6508 | 5.444444 | 18 | 324 | 5.571429 |
| Papua New Guinea | 0 | 0 | 0 | 0 | 0 | 0 |
| Paraguay | 15.67882 | 245.8254 | 4.984127 | 18.52926 | 343.3333 | 7.190476 |
| Peru | 10.9982 | 120.9603 | 3.738095 | 1.779513 | 3.166667 | 0.833333 |
| Philippines | 1.43095 | 2.047619 | 0.714286 | 2.035401 | 4.142857 | 0.809524 |
| Poland | 4.712361 | 22.20635 | 1.920635 | 6.611678 | 43.71429 | 2.952381 |
| Portugal | 15.74348 | 247.8571 | 5.730159 | 13.20714 | 174.4286 | 4.428571 |
| Puerto Rico | 15.98064 | 255.381 | 5.809524 | 2.21467 | 4.904762 | 0.904762 |
| Qatar | 15.13694 | 229.127 | 6.047619 | 30.71451 | 943.381 | 12.71429 |
| Réunion | 13.52159 | 182.8333 | 4.277778 | 12.2756 | 150.6905 | 5.880952 |
| Romania | 5.274978 | 27.8254 | 2.412698 | 9.162553 | 83.95238 | 3.190476 |
| Russia | 3.825561 | 14.63492 | 1.333333 | 1.889822 | 3.571429 | 0.904762 |
| Rwanda | 19.74721 | 389.9524 | 6.555556 | 19.97141 | 398.8571 | 9.571429 |
| Samoa | 0 | 0 | 0 | 0 | 0 | 0 |
| San Marino | 0 | 0 | 0 | 0 | 0 | 0 |
| Saudi Arabia | 13.8587 | 192.0635 | 6.666667 | 11.56966 | 133.8571 | 5.952381 |
| Senegal | 17.12605 | 293.3016 | 6.507937 | 5.928141 | 35.14286 | 2.809524 |
| Serbia | 10.56123 | 111.5397 | 3.47619 | 23.95929 | 574.0476 | 8.666667 |
| Seychelles | 13.68118 | 187.1746 | 5.936508 | 16.06831 | 258.1905 | 7.047619 |
| Sierra Leone | 16.17881 | 261.754 | 4.97619 | 17.98611 | 323.5 | 8.02381 |
| Singapore | 4.708149 | 22.16667 | 1.642857 | 6.559254 | 43.02381 | 2.738095 |
| Sint Maarten | 0 | 0 | 0 | 0 | 0 | 0 |
| Slovakia | 18.30973 | 335.246 | 7.357143 | 12.3645 | 152.881 | 4.738095 |
| Slovenia | 16.02379 | 256.7619 | 5.571429 | 16.71754 | 279.4762 | 6.285714 |
| Solomon Islands | 0 | 0 | 0 | 0 | 0 | 0 |
| Somalia | 7.06433 | 49.90476 | 3.285714 | 21.97726 | 483 | 9.571429 |
| South Africa | 4.974538 | 24.74603 | 2.761905 | 8.745067 | 76.47619 | 3.809524 |
| South Korea | 10.1848 | 103.7302 | 4.698413 | 8.807464 | 77.57143 | 4.952381 |
| South Sudan | 15.41799 | 237.7143 | 5.079365 | 14.0153 | 196.4286 | 7.095238 |
| Spain | 2.817181 | 7.936508 | 1.15873 | 1.812654 | 3.285714 | 0.809524 |
| Sri Lanka | 19.99127 | 399.6508 | 7.888889 | 12.70171 | 161.3333 | 4.952381 |
| St. Barthelemy | 0 | 0 | 0 | 0 | 0 | 0 |
| St. Helena | 20.96747 | 439.6349 | 11.09524 | 20.79034 | 432.2381 | 9.857143 |
| St. Kitts and Nevis | 0 | 0 | 0 | 0 | 0 | 0 |
| St. Lucia | 6.988653 | 48.84127 | 2.619048 | 22.619 | 511.619 | 6.952381 |
| St. Martin | 0 | 0 | 0 | 0 | 0 | 0 |
| St. Pierre and Miquelon | 0 | 0 | 0 | 0 | 0 | 0 |
| St. Vincent and Grenadines | 11.6046 | 134.6667 | 2.84127 | 15.86551 | 251.7143 | 4.190476 |
| Sudan | 20.89182 | 436.4683 | 9.452381 | 14.86046 | 220.8333 | 8.261905 |
| Suriname | 0 | 0 | 0 | 0 | 0 | 0 |
| Sweden | 13.94661 | 194.5079 | 4.650794 | 9.795529 | 95.95238 | 2.761905 |
| Switzerland | 14.39246 | 207.1429 | 4.111111 | 14.48973 | 209.9524 | 3.857143 |
| Syria | 0 | 0 | 0 | 0 | 0 | 0 |
| Taiwan | 12.05543 | 145.3333 | 5.31746 | 2.581989 | 6.666667 | 1.238095 |
| Tajikistan | 0 | 0 | 0 | 0 | 0 | 0 |
| Tanzania | 20.46949 | 419 | 6.968254 | 26.45301 | 699.7619 | 13.19048 |
| Thailand | 2.603417 | 6.777778 | 1.015873 | 2.78602 | 7.761905 | 1.190476 |
| Timor-Leste | 0 | 0 | 0 | 0 | 0 | 0 |
| Togo | 15.50627 | 240.4444 | 5.714286 | 26.70741 | 713.2857 | 11.7619 |
| Trinidad and Tobago | 11.38294 | 129.5714 | 4.428571 | 33.98669 | 1155.095 | 16.71429 |
| Türkiye | 2.134375 | 4.555556 | 0.968254 | 2.845213 | 8.095238 | 1.190476 |
| Tunisia | 17.81341 | 317.3175 | 6.47619 | 22.72192 | 516.2857 | 7.333333 |
| Turkmenistan | 0 | 0 | 0 | 0 | 0 | 0 |
| Turks and Caicos Islands | 0 | 0 | 0 | 0 | 0 | 0 |
| U.S. Virgin Islands | 0 | 0 | 0 | 0 | 0 | 0 |
| Uganda | 16.43216 | 270.0159 | 6.920635 | 29.3428 | 861 | 12.52381 |
| Ukraine | 7.148648 | 51.10317 | 2.849206 | 6.269731 | 39.30952 | 2.642857 |
| United Arab Emirates | 13.60964 | 185.2222 | 6.984127 | 10.91962 | 119.2381 | 4.380952 |
| United Kingdom | 0.629941 | 0.396825 | 0.285714 | 0.899735 | 0.809524 | 0.238095 |
| United States | 2.33843 | 5.468254 | 0.928571 | 0.46291 | 0.214286 | 0.214286 |
| Uruguay | 14.211 | 201.9524 | 5.285714 | 10.68154 | 114.0952 | 4.904762 |
| Uzbekistan | 14.3737 | 206.6032 | 3.873016 | 8.41201 | 70.7619 | 3.47619 |
| Vanuatu | 0 | 0 | 0 | 0 | 0 | 0 |
| Venezuela | 9.136531 | 83.47619 | 2.301587 | 5.830952 | 34 | 1.809524 |
| Vietnam | 2.081666 | 4.333333 | 0.857143 | 2.171241 | 4.714286 | 1 |
| Western Sahara | 0 | 0 | 0 | 0 | 0 | 0 |
| Yemen | 0 | 0 | 0 | 0 | 0 | 0 |
| Zambia | 13.4772 | 181.6349 | 5.698413 | 14.46342 | 209.1905 | 6.285714 |
| Zimbabwe | 12.54832 | 157.4603 | 5.190476 | 14.32613 | 205.2381 | 6.380952 |
| Country Name | RMSE of Autocorrelation (Train Set) | MSE of Autocorrelation (Train Set) | MAE of Autocorrelation (Train Set) | RMSE of Autocorrelation (Test Set) | MSE of Autocorrelation (Test Set) | MAE of Autocorrelation (Test Set) |
|---|---|---|---|---|---|---|
| Afghanistan | 0 | 0 | 0 | 0 | 0 | 0 |
| Åland Islands | 0 | 0 | 0 | 0 | 0 | 0 |
| Albania | 9.547236 | 266.6762 | 3.449842 | 16.33022 | 266.6762 | 6.070559 |
| Algeria | 5.983334 | 309.8742 | 3.026799 | 17.60324 | 309.8742 | 8.755387 |
| American Samoa | 0 | 0 | 0 | 0 | 0 | 0 |
| Andorra | 0 | 0 | 0 | 0 | 0 | 0 |
| Angola | 6.06661 | 31.05337 | 3.182088 | 5.572555 | 31.05337 | 3.188894 |
| Antigua and Barbuda | 10.53139 | 29.9032 | 5.786529 | 5.468382 | 29.9032 | 4.685652 |
| Argentina | 5.160407 | 3.124834 | 1.915264 | 1.76772 | 3.124834 | 0.977066 |
| Armenia | 0 | 0 | 0 | 0 | 0 | 0 |
| Aruba | 0 | 0 | 0 | 0 | 0 | 0 |
| Australia | 4.096864 | 33.99733 | 2.078919 | 5.830723 | 33.99733 | 2.770755 |
| Austria | 10.83433 | 22.50378 | 4.518217 | 4.743815 | 22.50378 | 3.749277 |
| Azerbaijan | 11.01557 | 13.87758 | 3.86089 | 3.725262 | 13.87758 | 3.252013 |
| Bahamas | 9.789052 | 48.23301 | 5.390787 | 6.944999 | 48.23301 | 4.775422 |
| Bahrain | 8.451745 | 203.8561 | 6.220559 | 14.27782 | 203.8561 | 9.989248 |
| Bangladesh | 4.524827 | 24.08574 | 2.864864 | 4.907722 | 24.08574 | 3.710554 |
| Barbados | 8.051779 | 44.85521 | 2.938033 | 6.697403 | 44.85521 | 2.92712 |
| Belarus | 0 | 0 | 0 | 0 | 0 | 0 |
| Belgium | 8.85279 | 8.422725 | 2.9068 | 2.902193 | 8.422725 | 2.344049 |
| Belize | 6.027706 | 22.24202 | 3.190105 | 4.716145 | 22.24202 | 2.821407 |
| Benin | 4.729482 | 112.321 | 2.869876 | 10.59816 | 112.321 | 4.86543 |
| Bermuda | 0 | 0 | 0 | 0 | 0 | 0 |
| Bhutan | 7.641408 | 61.58425 | 4.080188 | 7.847563 | 61.58425 | 4.348069 |
| Bolivia | 8.978993 | 41.01737 | 4.208674 | 6.404481 | 41.01737 | 3.756414 |
| Bosnia and Herzegovina | 4.779151 | 28.62655 | 1.992647 | 5.350379 | 28.62655 | 2.262842 |
| Botswana | 12.67149 | 78.44828 | 6.246121 | 8.857103 | 78.44828 | 6.110068 |
| Brazil | 0.882356 | 3.935664 | 0.516444 | 1.983851 | 3.935664 | 0.931681 |
| British Virgin Islands | 0 | 0 | 0 | 0 | 0 | 0 |
| Brunei | 9.480926 | 308.6751 | 4.700313 | 17.56915 | 308.6751 | 8.426272 |
| Bulgaria | 11.95635 | 83.69336 | 6.315804 | 9.148408 | 83.69336 | 6.237365 |
| Burkina Faso | 14.31467 | 41.75848 | 7.148378 | 6.46208 | 41.75848 | 5.400082 |
| Burundi | 7.373451 | 65.44432 | 3.422807 | 8.089767 | 65.44432 | 5.022543 |
| Cambodia | 11.88999 | 345.2464 | 8.282581 | 18.58081 | 345.2464 | 12.45667 |
| Cameroon | 4.86618 | 348.1162 | 2.915288 | 18.65787 | 348.1162 | 9.084295 |
| Canada | 2.264004 | 0.868871 | 1.600211 | 0.932133 | 0.868871 | 0.783274 |
| Cape Verde | 11.46525 | 110.7488 | 5.873995 | 10.52372 | 110.7488 | 6.187318 |
| Cayman Islands | 5.534619 | 22.40385 | 2.6401 | 4.73327 | 22.40385 | 3.189553 |
| Chad | 5.274818 | 10.57232 | 2.418889 | 3.25151 | 10.57232 | 1.981079 |
| Chile | 1.705141 | 237.0363 | 0.797758 | 15.39598 | 237.0363 | 3.170539 |
| China | 14.75331 | 128.8751 | 8.077444 | 11.35232 | 128.8751 | 7.216554 |
| Côte d’Ivoire | 9.282463 | 432.434 | 3.350107 | 20.79505 | 432.434 | 11.19471 |
| Colombia | 3.824796 | 1.991984 | 1.483824 | 1.411377 | 1.991984 | 1.206169 |
| Comoros | 4.57128 | 52.32465 | 2.782305 | 7.233578 | 52.32465 | 4.655305 |
| Congo—Brazzaville | 7.258426 | 54.2349 | 3.104642 | 7.364435 | 54.2349 | 3.767057 |
| Congo—Kinshasa | 9.466793 | 17.27012 | 4.488946 | 4.155734 | 17.27012 | 3.452318 |
| Costa Rica | 6.153947 | 677.8751 | 3.521392 | 26.03604 | 677.8751 | 14.58405 |
| Croatia | 9.937297 | 322.4361 | 4.849895 | 17.95651 | 322.4361 | 8.571793 |
| Cuba | 9.673677 | 115.8269 | 4.788526 | 10.76229 | 115.8269 | 3.96974 |
| Curaçao | 0 | 0 | 0 | 0 | 0 | 0 |
| Cyprus | 10.9392 | 105.7162 | 5.734284 | 10.28184 | 105.7162 | 7.269532 |
| Czechia | 6.525328 | 38.41361 | 2.827252 | 6.197872 | 38.41361 | 3.605674 |
| Denmark | 9.850139 | 56.46845 | 4.841825 | 7.514549 | 56.46845 | 4.829783 |
| Djibouti | 0 | 0 | 0 | 0 | 0 | 0 |
| Dominica | 0 | 0 | 0 | 0 | 0 | 0 |
| Dominican Republic | 12.21003 | 51.48443 | 5.875481 | 7.175265 | 51.48443 | 5.859984 |
| Ecuador | 5.591392 | 15.12805 | 2.355274 | 3.889479 | 15.12805 | 2.040708 |
| Egypt | 6.149146 | 45.76967 | 4.304301 | 6.765329 | 45.76967 | 4.941281 |
| El Salvador | 47.795 | 4031.202 | 17.61659 | 63.49175 | 4031.202 | 28.50461 |
| Equatorial Guinea | 10.05492 | 185.1663 | 4.273236 | 13.60758 | 185.1663 | 6.827011 |
| Estonia | 9.493435 | 320.6342 | 4.461361 | 17.90626 | 320.6342 | 10.35126 |
| Eswatini | 10.11582 | 292.2951 | 5.50259 | 17.09664 | 292.2951 | 8.906344 |
| Ethiopia | 11.90093 | 255.0395 | 7.506921 | 15.96996 | 255.0395 | 8.341224 |
| Faroe Islands | 0 | 0 | 0 | 0 | 0 | 0 |
| Fiji | 14.37325 | 132.6001 | 7.861227 | 11.51521 | 132.6001 | 7.789546 |
| Finland | 5.233477 | 6.194874 | 2.325577 | 2.488951 | 6.194874 | 1.932455 |
| France | 1.120485 | 2.003828 | 0.607629 | 1.415566 | 2.003828 | 0.863699 |
| French Guiana | 0 | 0 | 0 | 0 | 0 | 0 |
| French Polynesia | 0 | 0 | 0 | 0 | 0 | 0 |
| Gabon | 6.045124 | 165.8478 | 3.727497 | 12.87819 | 165.8478 | 7.123294 |
| Gambia | 9.52169 | 71.51402 | 5.396629 | 8.456596 | 71.51402 | 5.872677 |
| Georgia | 12.25343 | 100.2455 | 7.121271 | 10.01227 | 100.2455 | 7.364313 |
| Germany | 1.575677 | 2.520911 | 1.036421 | 1.587738 | 2.520911 | 1.119649 |
| Ghana | 8.127446 | 471.2825 | 5.614317 | 21.70904 | 471.2825 | 13.16765 |
| Gibraltar | 0 | 0 | 0 | 0 | 0 | 0 |
| Greece | 5.555145 | 244.8915 | 2.747845 | 15.64901 | 244.8915 | 7.481647 |
| Greenland | 0 | 0 | 0 | 0 | 0 | 0 |
| Grenada | 12.86441 | 151.6387 | 6.159252 | 12.31417 | 151.6387 | 8.262845 |
| Guadeloupe | 4.134032 | 3.222124 | 1.949929 | 1.795028 | 3.222124 | 1.376126 |
| Guam | 0 | 0 | 0 | 0 | 0 | 0 |
| Guatemala | 9.344646 | 29.69501 | 5.26385 | 5.449313 | 29.69501 | 4.369718 |
| Guernsey | 0 | 0 | 0 | 0 | 0 | 0 |
| Guinea | 8.020519 | 95.65707 | 4.661525 | 9.780443 | 95.65707 | 5.539834 |
| Guinea-Bissau | 11.16234 | 85.9241 | 4.971446 | 9.269526 | 85.9241 | 4.876213 |
| Guyana | 2.517421 | 235.7208 | 0.902204 | 15.3532 | 235.7208 | 3.061355 |
| Haiti | 6.585808 | 6.792683 | 3.144837 | 2.606278 | 6.792683 | 2.40467 |
| Honduras | 9.296952 | 57.77398 | 4.400755 | 7.60092 | 57.77398 | 4.649517 |
| Hong Kong | 7.353977 | 41.40477 | 3.82363 | 6.434654 | 41.40477 | 3.466788 |
| Hungary | 5.225407 | 122.7043 | 3.140391 | 11.0772 | 122.7043 | 5.309302 |
| Iceland | 5.922715 | 419.9142 | 3.113922 | 20.49181 | 419.9142 | 8.49435 |
| India | 1.289805 | 0.900497 | 0.749746 | 0.948945 | 0.900497 | 0.731705 |
| Indonesia | 1.103112 | 0.782783 | 0.686736 | 0.88475 | 0.782783 | 0.668795 |
| Iran | 5.515225 | 31.68146 | 2.994191 | 5.628629 | 31.68146 | 3.877756 |
| Iraq | 12.55775 | 87.60657 | 7.057821 | 9.359838 | 87.60657 | 6.396014 |
| Ireland | 0.974491 | 1.729115 | 0.547556 | 1.314958 | 1.729115 | 0.70643 |
| Isle of Man | 0 | 0 | 0 | 0 | 0 | 0 |
| Israel | 7.903272 | 196.6148 | 4.960509 | 14.02194 | 196.6148 | 8.713525 |
| Italy | 3.133917 | 4.316491 | 1.612017 | 2.077617 | 4.316491 | 1.404546 |
| Jamaica | 4.290459 | 71.54644 | 2.75134 | 8.458513 | 71.54644 | 5.632011 |
| Japan | 7.735241 | 106.0027 | 4.238804 | 10.29576 | 106.0027 | 4.884764 |
| Jersey | 0 | 0 | 0 | 0 | 0 | 0 |
| Jordan | 3.708129 | 86.17836 | 1.7919 | 9.28323 | 86.17836 | 4.655009 |
| Kazakhstan | 0 | 0 | 0 | 0 | 0 | 0 |
| Kenya | 5.960261 | 137.8703 | 3.875778 | 11.74182 | 137.8703 | 7.767086 |
| Kosovo | 6.359459 | 49.82043 | 1.686356 | 7.058359 | 49.82043 | 3.073302 |
| Kuwait | 10.19731 | 714.7134 | 6.009618 | 26.73413 | 714.7134 | 15.32199 |
| Kyrgyzstan | 0 | 0 | 0 | 0 | 0 | 0 |
| Laos | 0 | 0 | 0 | 0 | 0 | 0 |
| Latvia | 8.898493 | 233.3365 | 4.326054 | 15.27536 | 233.3365 | 6.396053 |
| Lebanon | 11.15287 | 53.26224 | 5.987507 | 7.298098 | 53.26224 | 5.779635 |
| Lesotho | 7.575091 | 401.5749 | 4.781264 | 20.03934 | 401.5749 | 10.72093 |
| Liberia | 7.775482 | 175.9486 | 4.44222 | 13.26456 | 175.9486 | 8.237929 |
| Libya | 7.048344 | 111.3744 | 4.542626 | 10.55341 | 111.3744 | 5.525318 |
| Liechtenstein | 0 | 0 | 0 | 0 | 0 | 0 |
| Lithuania | 9.031481 | 24.0281 | 3.696522 | 4.901846 | 24.0281 | 2.652109 |
| Luxembourg | 5.203751 | 584.4337 | 2.55309 | 24.17506 | 584.4337 | 11.75841 |
| Macao | 16.37218 | 626.3795 | 7.214573 | 25.02758 | 626.3795 | 12.00941 |
| Madagascar | 8.056012 | 373.3813 | 3.166608 | 19.32308 | 373.3813 | 9.879311 |
| Malawi | 9.456212 | 214.1751 | 4.590584 | 14.63472 | 214.1751 | 6.548388 |
| Malaysia | 3.027362 | 14.55967 | 1.985457 | 3.815713 | 14.55967 | 2.213564 |
| Maldives | 11.05308 | 538.4476 | 5.323819 | 23.20447 | 538.4476 | 13.88415 |
| Mali | 7.121835 | 306.3747 | 4.064986 | 17.50356 | 306.3747 | 11.27971 |
| Malta | 9.056621 | 31.83283 | 4.657467 | 5.642059 | 31.83283 | 4.712883 |
| Martinique | 9.748098 | 689.4085 | 5.245546 | 26.25659 | 689.4085 | 15.4876 |
| Mauritania | 13.13171 | 88.15271 | 7.200627 | 9.388968 | 88.15271 | 7.662908 |
| Mauritius | 8.761748 | 453.3572 | 3.836104 | 21.29219 | 453.3572 | 11.63681 |
| Mexico | 2.612147 | 2.922535 | 1.126163 | 1.709542 | 2.922535 | 1.043981 |
| Moldova | 0 | 0 | 0 | 0 | 0 | 0 |
| Mongolia | 5.169104 | 11.07499 | 2.21608 | 3.32791 | 11.07499 | 2.116271 |
| Montenegro | 10.46805 | 102.2567 | 4.440561 | 10.11221 | 102.2567 | 6.26818 |
| Morocco | 12.27848 | 241.1229 | 6.936316 | 15.52813 | 241.1229 | 8.58022 |
| Mozambique | 8.961407 | 35.63636 | 2.413428 | 5.969619 | 35.63636 | 2.639244 |
| Myanmar (Burma) | 2.407638 | 235.912 | 1.352414 | 15.35943 | 235.912 | 3.643141 |
| Namibia | 7.874785 | 239.0842 | 4.49069 | 15.46235 | 239.0842 | 6.310737 |
| Nepal | 12.96567 | 29.01789 | 5.968387 | 5.386826 | 29.01789 | 3.733779 |
| Netherlands | 10.6473 | 61.49948 | 4.320568 | 7.842161 | 61.49948 | 4.930311 |
| New Caledonia | 0 | 0 | 0 | 0 | 0 | 0 |
| New Zealand | 5.092617 | 77.35123 | 2.885639 | 8.794955 | 77.35123 | 5.253943 |
| Nicaragua | 3.552405 | 1.662006 | 1.395157 | 1.289188 | 1.662006 | 0.812994 |
| Niger | 3.915178 | 266.4439 | 1.529212 | 16.32311 | 266.4439 | 4.886317 |
| Nigeria | 6.694565 | 52.00449 | 4.023198 | 7.211414 | 52.00449 | 4.40873 |
| North Macedonia | 10.75917 | 13.58104 | 3.545521 | 3.685246 | 13.58104 | 2.548404 |
| Northern Mariana Islands | 0 | 0 | 0 | 0 | 0 | 0 |
| Norway | 5.832329 | 14.17639 | 2.866471 | 3.765155 | 14.17639 | 2.452245 |
| Oman | 7.612618 | 479.1339 | 4.955876 | 21.88913 | 479.1339 | 10.12697 |
| Pakistan | 6.305306 | 46.19294 | 3.045765 | 6.796539 | 46.19294 | 4.200318 |
| Palestine | 0 | 0 | 0 | 0 | 0 | 0 |
| Panama | 7.976283 | 265.3628 | 5.033874 | 16.28996 | 265.3628 | 8.038425 |
| Papua New Guinea | 0 | 0 | 0 | 0 | 0 | 0 |
| Paraguay | 9.36601 | 264.2494 | 4.172757 | 16.25575 | 264.2494 | 6.955869 |
| Peru | 7.624232 | 5.534475 | 3.702979 | 2.352547 | 5.534475 | 2.082666 |
| Philippines | 0.885505 | 3.714283 | 0.54972 | 1.927247 | 3.714283 | 1.078276 |
| Poland | 3.660544 | 29.904 | 2.081432 | 5.468454 | 29.904 | 2.813396 |
| Portugal | 10.46164 | 101.0983 | 5.017028 | 10.05477 | 101.0983 | 5.165927 |
| Puerto Rico | 10.56894 | 16.33975 | 4.928882 | 4.042246 | 16.33975 | 3.629358 |
| Qatar | 11.173 | 452.4833 | 6.37943 | 21.27166 | 452.4833 | 10.9481 |
| Réunion | 8.809801 | 73.17947 | 3.499218 | 8.554501 | 73.17947 | 4.389758 |
| Romania | 3.335597 | 44.26107 | 2.133118 | 6.652899 | 44.26107 | 3.023861 |
| Russia | 2.254237 | 3.029526 | 1.0317 | 1.740553 | 3.029526 | 1.230431 |
| Rwanda | 11.03336 | 237.3087 | 4.619325 | 15.40483 | 237.3087 | 7.975922 |
| Samoa | 0 | 0 | 0 | 0 | 0 | 0 |
| San Marino | 0 | 0 | 0 | 0 | 0 | 0 |
| Saudi Arabia | 9.002735 | 77.40342 | 5.940556 | 8.797921 | 77.40342 | 6.727711 |
| Senegal | 11.0033 | 35.37583 | 5.909475 | 5.947758 | 35.37583 | 4.661211 |
| Serbia | 7.371186 | 269.5461 | 3.115696 | 16.41786 | 269.5461 | 6.858306 |
| Seychelles | 8.71973 | 166.6366 | 5.428664 | 12.90878 | 166.6366 | 8.045354 |
| Sierra Leone | 10.5304 | 186.5661 | 4.744025 | 13.65892 | 186.5661 | 7.072295 |
| Singapore | 3.037643 | 21.66193 | 1.64868 | 4.654238 | 21.66193 | 2.354216 |
| Sint Maarten | 0 | 0 | 0 | 0 | 0 | 0 |
| Slovakia | 13.65778 | 174.2823 | 7.24118 | 13.2016 | 174.2823 | 6.851287 |
| Slovenia | 10.04812 | 190.0684 | 4.762657 | 13.78653 | 190.0684 | 7.438249 |
| Solomon Islands | 0 | 0 | 0 | 0 | 0 | 0 |
| Somalia | 5.218272 | 314.7882 | 3.14686 | 17.74227 | 314.7882 | 8.515299 |
| South Africa | 3.03295 | 81.68939 | 2.224909 | 9.038219 | 81.68939 | 5.821945 |
| South Korea | 6.544425 | 42.94735 | 4.220322 | 6.553423 | 42.94735 | 4.802469 |
| South Sudan | 10.60482 | 110.5208 | 5.30904 | 10.51289 | 110.5208 | 6.626357 |
| Spain | 1.771953 | 3.135097 | 0.968608 | 1.770621 | 3.135097 | 1.226833 |
| Sri Lanka | 13.79162 | 122.2438 | 8.492347 | 11.05639 | 122.2438 | 9.245106 |
| St. Barthélemy | 0 | 0 | 0 | 0 | 0 | 0 |
| St. Helena | 15.04679 | 340.1374 | 11.16958 | 18.44281 | 340.1374 | 13.80565 |
| St. Kitts and Nevis | 0 | 0 | 0 | 0 | 0 | 0 |
| St. Lucia | 4.452625 | 297.2686 | 2.350638 | 17.24148 | 297.2686 | 7.538465 |
| St. Martin | 0 | 0 | 0 | 0 | 0 | 0 |
| St. Pierre and Miquelon | 0 | 0 | 0 | 0 | 0 | 0 |
| St. Vincent and Grenadines | 6.327033 | 278.5168 | 2.980384 | 16.68882 | 278.5168 | 6.829061 |
| Sudan | 13.20677 | 120.0613 | 7.874987 | 10.95725 | 120.0613 | 7.766244 |
| Suriname | 0 | 0 | 0 | 0 | 0 | 0 |
| Sweden | 11.12028 | 58.18556 | 5.451402 | 7.627945 | 58.18556 | 4.439981 |
| Switzerland | 9.620514 | 106.2319 | 4.179798 | 10.30689 | 106.2319 | 4.711903 |
| Syria | 0 | 0 | 0 | 0 | 0 | 0 |
| Taiwan | 8.542505 | 15.32091 | 4.834299 | 3.914193 | 15.32091 | 3.708639 |
| Tajikistan | 0 | 0 | 0 | 0 | 0 | 0 |
| Tanzania | 13.1928 | 315.0844 | 5.843148 | 17.75062 | 315.0844 | 8.659294 |
| Thailand | 1.851518 | 4.061004 | 0.964724 | 2.015193 | 4.061004 | 1.023623 |
| Timor-Leste | 0 | 0 | 0 | 0 | 0 | 0 |
| Togo | 12.46273 | 797.6442 | 6.573539 | 28.2426 | 797.6442 | 16.86038 |
| Trinidad and Tobago | 7.231444 | 603.9144 | 3.430544 | 24.57467 | 603.9144 | 10.77016 |
| Türkiye | 1.404136 | 3.480567 | 0.863614 | 1.865628 | 3.480567 | 0.956541 |
| Tunisia | 12.71008 | 298.4444 | 7.344201 | 17.27554 | 298.4444 | 11.5082 |
| Turkmenistan | 0 | 0 | 0 | 0 | 0 | 0 |
| Turks and Caicos Islands | 0 | 0 | 0 | 0 | 0 | 0 |
| U.S. Virgin Islands | 0 | 0 | 0 | 0 | 0 | 0 |
| Uganda | 11.36024 | 450.5361 | 6.53962 | 21.22584 | 450.5361 | 8.999745 |
| Ukraine | 5.236922 | 22.31077 | 2.880307 | 4.723428 | 22.31077 | 3.211289 |
| United Arab Emirates | 9.81296 | 83.8914 | 6.364535 | 9.159225 | 83.8914 | 6.592083 |
| United Kingdom | 0.502379 | 0.518618 | 0.357571 | 0.720152 | 0.518618 | 0.395022 |
| United States | 2.039879 | 0.648399 | 1.119234 | 0.805232 | 0.648399 | 0.716547 |
| Uruguay | 11.51783 | 67.03862 | 4.861215 | 8.187712 | 67.03862 | 4.772031 |
| Uzbekistan | 11.15424 | 32.51257 | 3.755985 | 5.70198 | 32.51257 | 3.538633 |
| Vanuatu | 0 | 0 | 0 | 0 | 0 | 0 |
| Venezuela | 6.573665 | 18.05486 | 2.575041 | 4.249101 | 18.05486 | 2.422974 |
| Vietnam | 1.382188 | 3.861088 | 0.888741 | 1.964965 | 3.861088 | 1.055109 |
| Western Sahara | 0 | 0 | 0 | 0 | 0 | 0 |
| Yemen | 0 | 0 | 0 | 0 | 0 | 0 |
| Zambia | 9.028182 | 153.7403 | 5.60782 | 12.3992 | 153.7403 | 7.333309 |
| Zimbabwe | 7.700711 | 137.9502 | 4.806979 | 11.74522 | 137.9502 | 7.465501 |
| Country Name | RSME for LSTM (Train Set) | MSE for LSTM (Train Set) | MAE for LSTM (Train Set) | RSME for LSTM (Test Set) | MSE for LSTM (Test Set) | MAE for LSTM (Test Set) |
|---|---|---|---|---|---|---|
| Afghanistan | 0 | 0 | 0 | 0 | 0 | 0 |
| Åland Islands | 0 | 0 | 0 | 0 | 0 | 0 |
| Albania | 9.7336 | 94.7436 | 3.5539 | 16.6119 | 275.9568 | 5.6548 |
| Algeria | 6.6306 | 43.9647 | 3.5466 | 15.7074 | 246.7213 | 5.0684 |
| American Samoa | 0 | 0 | 0 | 0 | 0 | 0 |
| Andorra | 0 | 0 | 0 | 0 | 0 | 0 |
| Angola | 6.4459 | 41.5499 | 3.3475 | 2.4405 | 5.956 | 2.2836 |
| Antigua and Barbuda | 11.0468 | 122.031 | 6.0127 | 4.8425 | 23.4496 | 4.6417 |
| Argentina | 5.7685 | 33.2755 | 2.3629 | 1.5811 | 2.4999 | 1.5477 |
| Armenia | 0 | 0 | 0 | 0 | 0 | 0 |
| Aruba | 0 | 0 | 0 | 0 | 0 | 0 |
| Australia | 4.1825 | 17.493 | 2.2748 | 5.5779 | 31.113 | 2.8582 |
| Austria | 11.5956 | 134.458 | 4.6221 | 4.0483 | 16.3884 | 3.0249 |
| Azerbaijan | 11.5166 | 132.6323 | 4.5556 | 3.4383 | 11.8218 | 2.9832 |
| Bahamas | 9.9308 | 98.6212 | 5.095 | 6.1092 | 37.3224 | 4.3574 |
| Bahrain | 8.9706 | 80.4724 | 6.1036 | 11.9741 | 143.38 | 7.3561 |
| Bangladesh | 4.8026 | 23.0654 | 2.796 | 3.8962 | 15.1806 | 2.4461 |
| Barbados | 7.2388 | 52.4007 | 2.9072 | 6.7102 | 45.0273 | 3.4134 |
| Belarus | 0 | 0 | 0 | 0 | 0 | 0 |
| Belgium | 10.2021 | 104.0831 | 3.7289 | 3.159 | 9.9791 | 2.926 |
| Belize | 5.5824 | 31.1636 | 2.9676 | 4.4613 | 19.9031 | 2.6012 |
| Benin | 5.1852 | 26.8863 | 3.2811 | 9.9706 | 99.4121 | 4.3851 |
| Bermuda | 0 | 0 | 0 | 0 | 0 | 0 |
| Bhutan | 7.9446 | 63.1166 | 4.1197 | 2.9389 | 8.6371 | 2.5615 |
| Bolivia | 9.2951 | 86.3995 | 4.4767 | 6.4988 | 42.2346 | 4.119 |
| Bosnia and Herzegovina | 5.0982 | 25.9919 | 1.9803 | 5.0099 | 25.0987 | 1.9786 |
| Botswana | 13.3231 | 177.504 | 5.5976 | 5.7334 | 32.8716 | 4.4417 |
| Brazil | 0.9128 | 0.8331 | 0.527 | 1.8464 | 3.4091 | 0.7874 |
| British Virgin Islands | 0 | 0 | 0 | 0 | 0 | 0 |
| Brunei | 9.7336 | 94.7437 | 4.1091 | 7.5546 | 57.0713 | 3.8908 |
| Bulgaria | 12.4939 | 156.0973 | 6.1303 | 9.1211 | 83.1944 | 5.3772 |
| Burkina Faso | 15.8841 | 252.3046 | 7.2073 | 5.3209 | 28.3122 | 4.2953 |
| Burundi | 6.3309 | 40.08 | 2.5513 | 6.8236 | 46.5612 | 3.018 |
| Cambodia | 11.8045 | 139.3459 | 6.8832 | 9.143 | 83.6081 | 7.0224 |
| Cameroon | 5.1216 | 26.2312 | 2.9666 | 18.5825 | 345.3106 | 7.9996 |
| Canada | 2.6211 | 6.87 | 1.8806 | 1.1596 | 1.3447 | 1.0067 |
| Cape Verde | 12.4699 | 155.4981 | 6.69 | 10.1468 | 102.9573 | 6.2734 |
| Cayman Islands | 4.6226 | 21.3684 | 1.9359 | 3.6719 | 13.4827 | 1.9941 |
| Chad | 5.8912 | 34.7066 | 2.7076 | 3.1258 | 9.7707 | 2.112 |
| Chile | 1.7669 | 3.122 | 0.5652 | 0.3484 | 0.1214 | 0.2118 |
| China | 15.108 | 228.2521 | 8.4072 | 8.1723 | 66.7864 | 6.0264 |
| Colombia | 3.9174 | 15.3456 | 1.5493 | 0.9076 | 0.8236 | 0.8517 |
| Comoros | 4.5292 | 20.5136 | 2.1552 | 4.7915 | 22.9588 | 2.7124 |
| Congo—Brazzaville | 7.8349 | 61.3854 | 3.3439 | 4.1571 | 17.2815 | 2.6733 |
| Congo—Kinshasa | 9.666 | 93.4313 | 5.0803 | 4.2111 | 17.7335 | 3.7272 |
| Costa Rica | 6.258 | 39.1631 | 3.4591 | 18.6752 | 348.7649 | 6.6876 |
| Côte d’Ivoire | 4.8461 | 23.4845 | 1.9603 | 9.3519 | 87.4575 | 3.6104 |
| Croatia | 11.0201 | 121.4419 | 4.758 | 16.1631 | 261.2445 | 6.0549 |
| Cuba | 8.7039 | 75.7581 | 4.2015 | 11.2715 | 127.0462 | 4.359 |
| Curaçao | 0 | 0 | 0 | 0 | 0 | 0 |
| Cyprus | 10.738 | 115.3048 | 4.2122 | 6.805 | 46.3087 | 3.9958 |
| Czechia | 6.8512 | 46.9389 | 2.7323 | 5.1385 | 26.4047 | 2.9119 |
| Denmark | 10.105 | 102.111 | 4.4315 | 6.8243 | 46.5713 | 3.9834 |
| Djibouti | 0 | 0 | 0 | 0 | 0 | |
| Dominica | 0 | 0 | 0 | 0 | 0 | 0 |
| Dominican Republic | 12.6183 | 159.2206 | 5.3687 | 5.3812 | 28.9569 | 4.1157 |
| Ecuador | 5.7229 | 32.7513 | 2.4758 | 3.9822 | 15.8582 | 2.3963 |
| Egypt | 6.8698 | 47.1942 | 4.7907 | 5.1174 | 26.188 | 4.015 |
| El Salvador | 10.4495 | 109.1914 | 3.653 | 2.358 | 5.5603 | 2.2743 |
| Equatorial Guinea | 10.323 | 106.5634 | 4.7069 | 12.9413 | 167.4777 | 5.6865 |
| Estonia | 9.6458 | 93.0424 | 3.7614 | 15.7026 | 246.5723 | 5.7316 |
| Eswatini | 11.5948 | 134.4386 | 6.2858 | 14.3755 | 206.6537 | 6.7783 |
| Ethiopia | 13.1243 | 172.2469 | 7.2049 | 16.5128 | 272.6729 | 8.1253 |
| Faroe Islands | 0 | 0 | 0 | 0 | 0 | 0 |
| Fiji | 14.9577 | 223.7334 | 7.9468 | 9.792 | 95.8828 | 6.61 |
| Finland | 5.2825 | 27.9046 | 2.1186 | 2.4099 | 5.8076 | 1.7092 |
| France | 1.1711 | 1.3714 | 0.6354 | 1.4494 | 2.1007 | 0.8726 |
| French Guiana | 0 | 0 | 0 | 0 | 0 | 0 |
| French Polynesia | 0 | 0 | 0 | 0 | 0 | 0 |
| Gabon | 6.2507 | 39.0707 | 3.2634 | 11.2189 | 125.8636 | 4.6094 |
| Gambia | 9.9696 | 99.3936 | 5.6935 | 8.2451 | 67.9817 | 4.8419 |
| Georgia | 12.4274 | 154.4396 | 5.5388 | 4.3531 | 18.9494 | 3.3823 |
| Germany | 1.6134 | 2.6031 | 1.0412 | 1.5203 | 2.3113 | 2.3113 |
| Ghana | 8.8601 | 78.5015 | 5.8293 | 17.6815 | 312.6347 | 8.4393 |
| Gibraltar | 0 | 0 | 0 | 0 | 0 | 0 |
| Greece | 5.5339 | 30.6236 | 2.4596 | 14.0572 | 197.6036 | 4.6971 |
| Greenland | 0 | 0 | 0 | 0 | 0 | 0 |
| Grenada | 5.9433 | 35.3233 | 3.6672 | 8.6918 | 75.5475 | 4.3353 |
| Guadeloupe | 4.5099 | 20.3389 | 2.0812 | 1.7321 | 3.0003 | 1.3416 |
| Guam | 0 | 0 | 0 | 0 | 0 | 0 |
| Guatemala | 10.0255 | 100.5112 | 4.9873 | 4.5187 | 20.4187 | 3.2909 |
| Guernsey | 0 | 0 | 0 | 0 | 0 | 0 |
| Guinea | 8.7292 | 76.1994 | 4.9657 | 8.9506 | 80.1132 | 5.006 |
| Guinea-Bissau | 11.9285 | 142.2889 | 4.4322 | 8.488 | 72.0512 | 4.0859 |
| Guyana | 2.8462 | 8.1007 | 1.3192 | 1.1068 | 1.2251 | 1.0212 |
| Haiti | 7.169 | 51.3949 | 3.4521 | 2.2058 | 4.8655 | 2.136 |
| Honduras | 9.5497 | 91.1969 | 5.1703 | 7.8877 | 62.2158 | 5.1749 |
| Hong Kong | 7.5697 | 57.3006 | 3.9035 | 6.4165 | 41.1715 | 3.5521 |
| Hungary | 5.3615 | 28.7455 | 2.9516 | 10.839 | 117.4837 | 4.988 |
| Iceland | 6.1778 | 38.1655 | 3.0443 | 20.0922 | 403.6946 | 6.2659 |
| India | 1.3647 | 1.8625 | 0.7525 | 0.7327 | 0.5368 | 0.5564 |
| Indonesia | 1.0416 | 1.085 | 0.7564 | 0.88 | 0.7743 | 0.7189 |
| Iran | 5.8074 | 33.7257 | 2.8256 | 4.2489 | 18.0528 | 2.6769 |
| Iraq | 13.019 | 169.4941 | 7.7934 | 9.1199 | 83.1722 | 6.6574 |
| Ireland | 1.022 | 1.0444 | 0.4302 | 1.319 | 1.7398 | 0.5476 |
| Isle of Man | 0 | 0 | 0 | 0 | 0 | 0 |
| Israel | 8.1316 | 66.1237 | 5.1369 | 12.9617 | 168.0064 | 7.0347 |
| Italy | 3.1791 | 10.1064 | 1.6558 | 2.0621 | 4.2523 | 1.433 |
| Jamaica | 4.3067 | 18.5479 | 2.5403 | 7.1705 | 51.4166 | 3.1201 |
| Japan | 8.6611 | 75.0151 | 4.0985 | 9.7806 | 95.6608 | 4.3546 |
| Jersey | 0 | 0 | 0 | 0 | 0 | 0 |
| Jordan | 3.8336 | 14.6967 | 1.9276 | 8.9228 | 79.616 | 3.7557 |
| Kazakhstan | 0 | 0 | 0 | 0 | 0 | 0 |
| Kenya | 6.2116 | 38.5844 | 3.3232 | 11.6125 | 134.8494 | 5.2644 |
| Kosovo | 5.8571 | 34.3056 | 2.3665 | 6.9648 | 48.5085 | 3.1255 |
| Kuwait | 10.7792 | 116.1902 | 6.1713 | 27.6976 | 767.1596 | 13.8547 |
| Kyrgyzstan | 0 | 0 | 0 | 0 | 0 | 0 |
| Laos | 0 | 0 | 0 | 0 | 0 | 0 |
| Latvia | 9.0329 | 81.5935 | 4.0577 | 15.363 | 236.0222 | 4.8141 |
| Lebanon | 11.8732 | 140.9722 | 5.5145 | 5.7114 | 32.6202 | 3.8723 |
| Lesotho | 7.8351 | 61.3887 | 5.0121 | 19.4631 | 378.8121 | 9.5002 |
| Liberia | 8.8601 | 78.502 | 4.7636 | 13.7897 | 190.1569 | 7.7805 |
| Libya | 7.2756 | 52.9345 | 4.8078 | 10.27 | 105.4736 | 5.4583 |
| Liechtenstein | 0 | 0 | 0 | 0 | 0 | 0 |
| Lithuania | 9.4687 | 89.6554 | 3.6307 | 4.7039 | 22.1269 | 2.4119 |
| Luxembourg | 5.4328 | 29.5153 | 2.0352 | 19.7734 | 390.9885 | 8.0012 |
| Macao | 10.3247 | 106.5986 | 4.4586 | 5.4317 | 29.5037 | 3.4083 |
| Madagascar | 8.1859 | 67.0095 | 3.0837 | 17.8244 | 317.7098 | 5.9622 |
| Malawi | 9.475 | 89.7765 | 3.9896 | 12.203 | 148.9136 | 4.5393 |
| Malaysia | 3.2457 | 10.5344 | 2.1438 | 3.4703 | 12.0428 | 2.018 |
| Maldives | 9.0192 | 81.3456 | 3.7675 | 19.1721 | 367.5694 | 7.3871 |
| Mali | 6.9092 | 47.7376 | 3.441 | 13.9836 | 195.5414 | 7.0168 |
| Malta | 9.4541 | 89.3806 | 4.5121 | 3.9692 | 15.7546 | 3.1479 |
| Martinique | 8.9073 | 79.3393 | 4.2866 | 21.8366 | 476.8377 | 10.2019 |
| Mauritania | 13.8648 | 192.2316 | 7.3301 | 8.6391 | 74.6336 | 6.0727 |
| Mauritius | 8.7301 | 76.2139 | 3.9971 | 19.6992 | 388.0597 | 9.2592 |
| Mexico | 2.7721 | 7.6848 | 1.1133 | 1.1494 | 1.321 | 0.7958 |
| Moldova | 0 | 0 | 0 | 0 | 0 | 0 |
| Mongolia | 5.6577 | 32.0097 | 2.1858 | 3.2 | 10.2402 | 1.7923 |
| Montenegro | 9.6568 | 93.2531 | 2.8187 | 6.145 | 37.7609 | 2.7985 |
| Morocco | 13.3511 | 178.2515 | 7.0624 | 11.0452 | 121.9971 | 5.9386 |
| Mozambique | 8.3459 | 69.6548 | 2.3825 | 5.9153 | 34.9914 | 2.6254 |
| Myanmar (Burma) | 2.7862 | 7.7632 | 1.6896 | 1.6621 | 2.7626 | 1.3676 |
| Namibia | 8.8703 | 78.6822 | 4.1666 | 16.1122 | 259.6045 | 5.3507 |
| Nepal | 12.7623 | 162.8764 | 6.2004 | 3.956 | 15.6502 | 3.4753 |
| Netherlands | 10.9354 | 119.582 | 4.1819 | 7.2466 | 52.513 | 4.3334 |
| New Caledonia | 0 | 0 | 0 | 0 | 0 | 0 |
| New Zealand | 5.3017 | 28.1082 | 2.6547 | 6.0864 | 37.0443 | 2.6479 |
| Nicaragua | 2.0237 | 4.0952 | 0.976 | 1.2777 | 1.6325 | 0.8717 |
| Niger | 3.9517 | 15.6159 | 2.3765 | 16.9702 | 287.9891 | 5.9528 |
| Nigeria | 7.3737 | 54.371 | 3.9092 | 6.8294 | 46.6407 | 3.2942 |
| North Macedonia | 10.1685 | 103.3987 | 3.4865 | 3.0711 | 9.4314 | 2.3936 |
| Northern Mariana Islands | 0 | 0 | 0 | 0 | 0 | 0 |
| Norway | 6.2307 | 38.8211 | 3.1065 | 3.4664 | 12.0158 | 2.4974 |
| Oman | 8.5704 | 73.451 | 5.2916 | 20.3843 | 415.5193 | 8.2069 |
| Pakistan | 6.5964 | 43.5123 | 3.1347 | 4.3147 | 18.6169 | 2.693 |
| Palestine | 0 | 0 | 0 | 0 | 0 | 0 |
| Panama | 7.9751 | 63.6014 | 4.062 | 6.3065 | 39.7718 | 3.3684 |
| Papua New Guinea | 0 | 0 | 0 | 0 | 0 | 0 |
| Paraguay | 10.0941 | 101.8901 | 3.8105 | 7.7531 | 60.1103 | 4.1264 |
| Peru | 8.3073 | 69.0105 | 3.7563 | 2.2829 | 5.2117 | 2.1975 |
| Philippines | 0.9395 | 0.8827 | 0.5583 | 1.7197 | 2.9573 | 0.716 |
| Poland | 3.8525 | 14.8416 | 2.1698 | 4.8759 | 23.774 | 2.8208 |
| Portugal | 11.0247 | 121.5435 | 4.7544 | 9.3369 | 87.177 | 4.4406 |
| Puerto Rico | 10.9783 | 120.5236 | 4.8751 | 3.6483 | 13.3099 | 3.5062 |
| Qatar | 11.8303 | 139.9554 | 6.1867 | 22.1425 | 490.2905 | 9.8335 |
| Réunion | 9.4096 | 88.5414 | 3.8012 | 8.316 | 69.1552 | 4.3294 |
| Romania | 3.64 | 13.2498 | 2.1245 | 6.4228 | 41.2524 | 2.6677 |
| Russia | 2.6839 | 7.2032 | 1.3379 | 1.3486 | 1.8187 | 1.0539 |
| Rwanda | 13.5939 | 184.7951 | 5.4912 | 14.0024 | 196.066 | 7.3586 |
| Samoa | 0 | 0 | 0 | 0 | 0 | |
| San Marino | 0 | 0 | 0 | 0 | 0 | 0 |
| Saudi Arabia | 9.7894 | 95.8327 | 6.1933 | 7.8526 | 61.6632 | 5.6638 |
| Senegal | 11.5231 | 132.7812 | 5.6435 | 4.8321 | 23.3488 | 4.1911 |
| Serbia | 7.611 | 57.927 | 2.9919 | 17.0023 | 289.0791 | 5.6237 |
| Seychelles | 9.7918 | 95.8801 | 5.3783 | 11.0476 | 122.0504 | 6.0669 |
| Sierra Leone | 11.3299 | 128.3673 | 4.4383 | 12.7055 | 161.4305 | 5.8939 |
| Singapore | 3.3178 | 11.0079 | 1.6058 | 4.6327 | 21.4623 | 2.1795 |
| Sint Maarten | 0 | 0 | 0 | 0 | 0 | 0 |
| Slovakia | 13.6908 | 187.4372 | 6.9251 | 10.8927 | 118.6518 | 6.2567 |
| Slovenia | 11.0111 | 121.245 | 4.6098 | 16.2637 | 264.5094 | 7.3231 |
| Solomon Islands | 0 | 0 | 0 | 0 | 0 | 0 |
| Somalia | 5.5604 | 30.9179 | 3.0668 | 18.3508 | 336.7535 | 7.4377 |
| South Africa | 3.3346 | 11.1196 | 2.3929 | 7.63 | 58.2163 | 3.674 |
| South Korea | 6.9248 | 47.9534 | 4.1089 | 6.3652 | 40.5161 | 4.3734 |
| South Sudan | 12.0022 | 144.0526 | 5.4966 | 10.1429 | 102.8774 | 6.1574 |
| Spain | 1.9102 | 3.6489 | 0.9706 | 1.5247 | 2.3247 | 0.991 |
| Sri Lanka | 14.6585 | 214.872 | 7.5076 | 9.0582 | 82.0501 | 5.1946 |
| St. Barthélemy | 0 | 0 | 0 | 0 | 0 | 0 |
| St. Helena | 15.9633 | 254.8255 | 11.5785 | 14.6825 | 215.5751 | 10.5333 |
| St. Kitts and Nevis | 0 | 0 | 0 | 0 | 0 | 0 |
| St. Lucia | 4.7856 | 22.9015 | 2.1552 | 16.1445 | 260.6449 | 4.5544 |
| St. Martin | 0 | 0 | 0 | 0 | 0 | 0 |
| St. Pierre and Miquelon | 0 | 0 | 0 | 0 | 0 | 0 |
| St. Vincent and Grenadines | 5.2222 | 27.2719 | 1.8175 | 2.3939 | 5.7306 | 1.4965 |
| Sudan | 14.5817 | 212.6251 | 8.5627 | 10.8392 | 117.4878 | 8.11 |
| Suriname | 0 | 0 | 0 | 0 | 0 | 0 |
| Sweden | 11.6771 | 136.355 | 4.8831 | 7.5428 | 56.8932 | 3.8568 |
| Switzerland | 10.4482 | 109.1649 | 4.191 | 10.3482 | 107.0847 | 3.9763 |
| Syria | 0 | 0 | 0 | 0 | 0 | 0 |
| Taiwan | 8.8644 | 78.5776 | 5.0119 | 3.2031 | 10.2601 | 3.1236 |
| Tajikistan | 0 | 0 | 0 | 0 | 0 | 0 |
| Tanzania | 14.1549 | 200.3618 | 5.935 | 19.8001 | 392.0455 | 9.7499 |
| Thailand | 1.9054 | 3.6305 | 1.0064 | 1.9381 | 3.7561 | 1.0714 |
| Timor-Leste | 0 | 0 | 0 | 0 | 0 | 0 |
| Togo | 10.8943 | 118.6865 | 5.5198 | 18.8062 | 353.675 | 8.7223 |
| Trinidad and Tobago | 7.7539 | 60.1228 | 3.7991 | 23.8618 | 569.3841 | 10.0506 |
| Tunisia | 13.1773 | 173.6403 | 6.5249 | 16.0612 | 257.9623 | 6.6638 |
| Türkiye | 1.4536 | 2.1131 | 0.8458 | 1.9669 | 3.8686 | 0.9816 |
| Turkmenistan | 0 | 0 | 0 | 0 | 0 | 0 |
| Turks and Caicos Islands | 0 | 0 | 0 | 0 | 0 | 0 |
| U.S. Virgin Islands | 0 | 0 | 0 | 0 | 0 | 0 |
| Uganda | 11.888 | 141.3237 | 6.5723 | 20.396 | 415.9966 | 9.0454 |
| Ukraine | 5.6833 | 32.3001 | 2.9119 | 4.5614 | 20.806 | 2.7815 |
| United Arab Emirates | 10.7911 | 116.4471 | 6.5811 | 8.1413 | 66.2805 | 5.1778 |
| United Kingdom | 0.5346 | 0.2858 | 0.3984 | 0.7138 | 0.5095 | 0.379 |
| Uruguay | 11.8371 | 140.1164 | 4.9007 | 7.7883 | 60.6579 | 4.3273 |
| USA | 2.082 | 4.3347 | 1.0967 | 0.7681 | 0.59 | 0.6998 |
| Uzbekistan | 10.5539 | 111.384 | 3.6693 | 6.5989 | 43.5455 | 3.4136 |
| Vanuatu | 0 | 0 | 0 | 0 | 0 | 0 |
| Venezuela | 6.7539 | 45.6146 | 2.3677 | 4.2025 | 17.6609 | 2.055 |
| Vietnam | 1.4709 | 2.1637 | 0.8434 | 1.1411 | 1.3021 | 0.7516 |
| Western Sahara | 0 | 0 | 0 | 0 | 0 | 0 |
| Yemen | 0 | 0 | 0 | 0 | 0 | 0 |
| Zambia | 9.7314 | 94.6992 | 5.5258 | 9.9891 | 99.782 | 5.2326 |
| Zimbabwe | 8.7034 | 75.7499 | 4.6912 | 9.7996 | 96.0318 | 5.0848 |
| Region Name | Pearsons r-Value | Pearsons p-Value | Nature of Correlation |
|---|---|---|---|
| Afghanistan | no correlation | no correlation | not significant |
| Åland Islands | no correlation | no correlation | not significant |
| Albania | −0.090702335 | 0.673391 | not significant |
| Algeria | 0.063822565 | 0.767019 | not significant |
| American Samoa | no correlation | no correlation | not significant |
| Andorra | no correlation | no correlation | not significant |
| Angola | −0.100306446 | 0.640968 | not significant |
| Antigua and Barbuda | −0.149116075 | 0.486791 | not significant |
| Argentina | 0.600519482 | 0.001917 | statistically significant |
| Armenia | no correlation | no correlation | not significant |
| Aruba | no correlation | no correlation | not significant |
| Australia | 0.292544706 | 0.165371 | not significant |
| Austria | 0.120643913 | 0.574431 | not significant |
| Azerbaijan | −0.195744703 | 0.359316 | not significant |
| Bahamas | 0.125273682 | 0.559721 | not significant |
| Bahrain | −0.012787181 | 0.952711 | not significant |
| Bangladesh | −0.35785392 | 0.085994 | not significant |
| Barbados | 0.00500911 | 0.981467 | not significant |
| Belarus | no correlation | no correlation | not significant |
| Belgium | 0.398859048 | 0.053522 | not significant |
| Belize | −0.056937592 | 0.79158 | not significant |
| Benin | −0.104711124 | 0.626304 | not significant |
| Bermuda | no correlation | no correlation | not significant |
| Bhutan | 0.926431913 | 8.35 × 10⁻¹¹ | statistically significant |
| Bolivia | 0.052467553 | 0.807631 | not significant |
| Bosnia and Herzegovina | −0.129338946 | 0.546946 | not significant |
| Botswana | −0.088522736 | 0.680831 | not significant |
| Brazil | −0.094590223 | 0.660194 | not significant |
| British Virgin Islands | no correlation | no correlation | not significant |
| Brunei | 0.100533352 | 0.640209 | not significant |
| Bulgaria | −0.182949839 | 0.392176 | not significant |
| Burkina Faso | −0.032792753 | 0.879096 | not significant |
| Burundi | 0.7706899 | 1.05 × 10⁻⁵ | statistically significant |
| Cambodia | 0.179998984 | 0.399988 | not significant |
| Cameroon | −0.159382001 | 0.456936 | not significant |
| Canada | −0.082672028 | 0.700944 | not significant |
| Cape Verde | −0.108891312 | 0.612513 | not significant |
| Cayman Islands | −0.127280178 | 0.553399 | not significant |
| Chad | −0.112659974 | 0.600189 | not significant |
| Chile | −0.16714496 | 0.435013 | not significant |
| China | −0.09808207 | 0.648424 | not significant |
| Colombia | −0.087660028 | 0.683784 | not significant |
| Comoros | 0.138615038 | 0.518311 | not significant |
| Congo—Brazzaville | 0.043158214 | 0.841295 | not significant |
| Congo—Kinshasa | −0.108070629 | 0.615211 | not significant |
| Costa Rica | 0.159105556 | 0.457727 | not significant |
| Côte d’Ivoire | 0.008714964 | 0.967762 | not significant |
| Croatia | −0.23280304 | 0.27363 | not significant |
| Cuba | −0.205104729 | 0.336332 | not significant |
| Curaçao | no correlation | no correlation | not significant |
| Cyprus | −0.096785209 | 0.652786 | not significant |
| Czechia | 0.149096414 | 0.486849 | not significant |
| Denmark | 0.075805761 | 0.724799 | not significant |
| Djibouti | no correlation | no correlation | not significant |
| Dominica | no correlation | no correlation | not significant |
| Dominican Republic | −0.245334391 | 0.247889 | not significant |
| Ecuador | −0.109050224 | 0.611992 | not significant |
| Egypt | −0.213337626 | 0.316862 | not significant |
| El Salvador | −0.042349142 | 0.844235 | not significant |
| Equatorial Guinea | −0.218142785 | 0.305823 | not significant |
| Estonia | −0.075414291 | 0.726166 | not significant |
| Eswatini | 0.279329839 | 0.18621 | not significant |
| Ethiopia | −0.031797057 | 0.882742 | not significant |
| Faroe Islands | no correlation | no correlation | not significant |
| Fiji | −0.121750998 | 0.570898 | not significant |
| Finland | 0.209053889 | 0.326905 | not significant |
| France | 0.668053741 | 0.00036 | statistically significant |
| French Guiana | no correlation | no correlation | not significant |
| French Polynesia | no correlation | no correlation | not significant |
| Gabon | 0.095426878 | 0.657366 | not significant |
| Gambia | −0.171380952 | 0.423293 | not significant |
| Georgia | 0.362478283 | 0.08173 | not significant |
| Germany | −0.010345017 | 0.961736 | not significant |
| Ghana | 0.414314395 | 0.044129 | statistically significant |
| Gibraltar | no correlation | no correlation | not significant |
| Greece | −0.156444286 | 0.46538 | not significant |
| Greenland | no correlation | no correlation | not significant |
| Grenada | −0.127654746 | 0.552222 | not significant |
| Guadeloupe | −0.111315525 | 0.604574 | not significant |
| Guam | no correlation | no correlation | not significant |
| Guatemala | −0.153540723 | 0.473804 | not significant |
| Guernsey | no correlation | no correlation | not significant |
| Guinea | −0.088577053 | 0.680645 | not significant |
| Guinea-Bissau | no correlation | no correlation | not significant |
| Guyana | −0.075872122 | 0.724567 | not significant |
| Haiti | −0.036662844 | 0.864948 | not significant |
| Honduras | −0.10367876 | 0.629729 | not significant |
| Hong Kong | −0.292628068 | 0.165245 | not significant |
| Hungary | 0.066502821 | 0.757515 | not significant |
| Iceland | −0.134859125 | 0.529818 | not significant |
| India | 0.112910195 | 0.599374 | not significant |
| Indonesia | −0.132631908 | 0.536698 | not significant |
| Iran | 0.255540055 | 0.228129 | not significant |
| Iraq | −0.317866272 | 0.130111 | not significant |
| Ireland | 3.47 × 10⁻¹⁸ | 1 | not significant |
| Isle of Man | no correlation | no correlation | not significant |
| Israel | 0.094336362 | 0.661052 | not significant |
| Italy | 0.20022065 | 0.348213 | not significant |
| Jamaica | 0.257952873 | 0.223615 | not significant |
| Japan | −0.029859044 | 0.889845 | not significant |
| Jersey | no correlation | no correlation | not significant |
| Jordan | −0.103746534 | 0.629504 | not significant |
| Kazakhstan | no correlation | no correlation | not significant |
| Kenya | 0.004281525 | 0.984159 | not significant |
| Kosovo | −0.090909091 | 0.672687 | not significant |
| Kuwait | −0.098624292 | 0.646603 | not significant |
| Kyrgyzstan | no correlation | no correlation | not significant |
| Laos | no correlation | no correlation | not significant |
| Latvia | −0.082679045 | 0.70092 | not significant |
| Lebanon | 0.850399011 | 1.42 × 10⁻⁷ | statistically significant |
| Lesotho | 0.015013135 | 0.944491 | not significant |
| Liberia | −0.139923493 | 0.514331 | not significant |
| Libya | −0.05606639 | 0.794702 | not significant |
| Liechtenstein | no correlation | no correlation | not significant |
| Lithuania | −0.157291159 | 0.462937 | not significant |
| Luxembourg | −0.075264917 | 0.726688 | not significant |
| Macao | 0.013177024 | 0.951271 | not significant |
| Madagascar | 0.801624529 | 2.49 × 10⁻⁶ | statistically significant |
| Malawi | −0.14378595 | 0.502668 | not significant |
| Malaysia | −0.066896998 | 0.75612 | not significant |
| Maldives | −0.027905873 | 0.897012 | not significant |
| Mali | −0.116449557 | 0.587902 | not significant |
| Malta | −0.111690871 | 0.603348 | not significant |
| Martinique | −0.116775918 | 0.586849 | not significant |
| Mauritania | −0.093022948 | 0.665502 | not significant |
| Mauritius | −0.03932881 | 0.855225 | not significant |
| Mexico | −0.083723737 | 0.697314 | not significant |
| Moldova | no correlation | no correlation | not significant |
| Mongolia | −0.147166174 | 0.49257 | not significant |
| Montenegro | −0.072167714 | 0.737541 | not significant |
| Morocco | −0.046490381 | 0.829211 | not significant |
| Mozambique | −0.020588279 | 0.923928 | not significant |
| Myanmar (Burma) | 0.870771295 | 3.14 × 10⁻⁸ | statistically significant |
| Namibia | −0.119343675 | 0.578592 | not significant |
| Nepal | −0.199158241 | 0.35083 | not significant |
| Netherlands | 0.077685891 | 0.718241 | not significant |
| New Caledonia | no correlation | no correlation | not significant |
| New Zealand | 0.034430784 | 0.873103 | not significant |
| Nicaragua | −0.147146008 | 0.49263 | not significant |
| Niger | −0.104590084 | 0.626705 | not significant |
| Nigeria | 0.370403039 | 0.074795 | not significant |
| North Macedonia | −0.166045252 | 0.438084 | not significant |
| Northern Mariana Islands | no correlation | no correlation | not significant |
| Norway | −0.316463118 | 0.13191 | not significant |
| Oman | −0.088556261 | 0.680716 | not significant |
| Pakistan | −0.055013307 | 0.79848 | not significant |
| Palestine | no correlation | no correlation | not significant |
| Panama | −0.093918925 | 0.662465 | not significant |
| Papua New Guinea | no correlation | no correlation | not significant |
| Paraguay | −0.313893217 | 0.13525 | not significant |
| Peru | 0.415475269 | 0.04348 | statistically significant |
| Philippines | 0.215999599 | 0.310717 | not significant |
| Poland | 0.145549599 | 0.497387 | not significant |
| Portugal | 0.178016266 | 0.405285 | not significant |
| Puerto Rico | 0.170419543 | 0.425938 | not significant |
| Qatar | −0.085169268 | 0.692335 | not significant |
| Réunion | −0.161577247 | 0.450679 | not significant |
| Romania | 0.436293089 | 0.033055 | statistically significant |
| Russia | −0.287145768 | 0.173678 | not significant |
| Rwanda | −0.08690683 | 0.686366 | not significant |
| Samoa | no correlation | no correlation | not significant |
| San Marino | no correlation | no correlation | not significant |
| Saudi Arabia | 0.095406704 | 0.657434 | not significant |
| Senegal | 0.073499192 | 0.732869 | not significant |
| Serbia | −0.267267654 | 0.206747 | not significant |
| Seychelles | 0.070774484 | 0.742439 | not significant |
| Sierra Leone | −0.146647907 | 0.494111 | not significant |
| Singapore | 0.04074778 | 0.850058 | not significant |
| Sint Maarten | no correlation | no correlation | not significant |
| Slovakia | −0.192522789 | 0.367435 | not significant |
| Slovenia | −0.052580012 | 0.807226 | not significant |
| Solomon Islands | no correlation | no correlation | not significant |
| Somalia | −0.098682014 | 0.64641 | not significant |
| South Africa | −0.515288309 | 0.009968 | statistically significant |
| South Korea | 0.505629707 | 0.011716 | statistically significant |
| South Sudan | −0.103285849 | 0.631034 | not significant |
| Spain | −0.010395398 | 0.961549 | not significant |
| Sri Lanka | −0.316011788 | 0.132492 | not significant |
| St. Barthélemy | no correlation | no correlation | not significant |
| St. Helena | 0.046822547 | 0.828009 | not significant |
| St. Kitts and Nevis | no correlation | no correlation | not significant |
| St. Lucia | −0.059897491 | 0.780996 | not significant |
| St. Martin | no correlation | no correlation | not significant |
| St. Pierre and Miquelon | no correlation | no correlation | not significant |
| St. Vincent and Grenadines | −0.199562952 | 0.349832 | not significant |
| Sudan | −0.090807231 | 0.673034 | not significant |
| Suriname | no correlation | no correlation | not significant |
| Sweden | −0.21857412 | 0.304843 | not significant |
| Switzerland | −0.245401511 | 0.247755 | not significant |
| Syria | no correlation | no correlation | not significant |
| Taiwan | −0.147082649 | 0.492818 | not significant |
| Tajikistan | no correlation | no correlation | not significant |
| Tanzania | −0.110427608 | 0.607477 | not significant |
| Thailand | 0.069503569 | 0.746915 | not significant |
| Timor-Leste | no correlation | no correlation | not significant |
| Togo | −0.109324789 | 0.611091 | not significant |
| Trinidad and Tobago | −0.155064952 | 0.469372 | not significant |
| Tunisia | −0.328907162 | 0.116573 | not significant |
| Türkiye | −0.131694408 | 0.539607 | not significant |
| Turkmenistan | no correlation | no correlation | not significant |
| Turks and Caicos Islands | no correlation | no correlation | not significant |
| U.S. Virgin Islands | no correlation | no correlation | not significant |
| Uganda | −0.182196864 | 0.394161 | not significant |
| Ukraine | −0.338520286 | 0.10565 | not significant |
| United Arab Emirates | −0.03805935 | 0.859852 | not significant |
| United Kingdom | 0.110722888 | 0.606511 | not significant |
| USA | 0.632244176 | 0.000918 | statistically significant |
| Uruguay | 0.780639033 | 6.78 × 10⁻⁶ | statistically significant |
| Uzbekistan | 0.164119111 | 0.44349 | not significant |
| Vanuatu | no correlation | no correlation | not significant |
| Venezuela | −0.15483844 | 0.47003 | not significant |
| Vietnam | −0.192602426 | 0.367233 | not significant |
| Western Sahara | no correlation | no correlation | not significant |
| Yemen | no correlation | no correlation | not significant |
| Zambia | 0.033333374 | 0.877117 | not significant |
| Zimbabwe | −0.135748266 | 0.527083 | not significant |
| Region Name | Pearsons r-Value | Pearsons p-Value | Nature of Correlation |
|---|---|---|---|
| Afghanistan | −0.09595 | 0.6556 | not significant |
| Åland Islands | 0.078697 | 0.714724 | not significant |
| Albania | 0.011993 | 0.955647 | not significant |
| Algeria | −0.1165 | 0.587731 | not significant |
| American Samoa | −0.1263 | 0.556475 | not significant |
| Andorra | 0.343671 | 0.100117 | not significant |
| Angola | −0.04035 | 0.851492 | not significant |
| Antigua and Barbuda | 0.088904 | 0.679529 | not significant |
| Argentina | 0.382087 | 0.065397 | not significant |
| Armenia | −0.16178 | 0.450095 | not significant |
| Aruba | 0.014382 | 0.946823 | not significant |
| Australia | −0.3429 | 0.10093 | not significant |
| Austria | 0.046433 | 0.82942 | not significant |
| Azerbaijan | −0.06898 | 0.748768 | not significant |
| Bahamas | 0.124811 | 0.561182 | not significant |
| Bahrain | −0.01622 | 0.940023 | not significant |
| Bangladesh | −0.03106 | 0.885457 | not significant |
| Barbados | −0.08025 | 0.709316 | not significant |
| Belarus | 0.073615 | 0.732464 | not significant |
| Belgium | 0.034153 | 0.874118 | not significant |
| Belize | −0.20214 | 0.343505 | not significant |
| Benin | 0.079631 | 0.711478 | not significant |
| Bermuda | 0.119492 | 0.578115 | not significant |
| Bhutan | −0.02986 | 0.889843 | not significant |
| Bolivia | 0.255697 | 0.227834 | not significant |
| Bosnia and Herzegovina | −0.02618 | 0.903345 | not significant |
| Botswana | 0.005875 | 0.978264 | not significant |
| Brazil | 0.367615 | 0.077181 | not significant |
| British Virgin Islands | 0.042156 | 0.844936 | not significant |
| Brunei | −0.19561 | 0.359643 | not significant |
| Bulgaria | −0.12217 | 0.569568 | not significant |
| Burkina Faso | 0.097461 | 0.650512 | not significant |
| Burundi | 0.005958 | 0.977956 | not significant |
| Cambodia | 0.342958 | 0.10087 | not significant |
| Cameroon | 0.03725 | 0.862805 | not significant |
| Canada | 0.466469 | 0.021577 | statistically significant |
| Cape Verde | 0.096654 | 0.653228 | not significant |
| Cayman Islands | −0.13711 | 0.522906 | not significant |
| Chad | −0.26642 | 0.20824 | not significant |
| Chile | 0.203786 | 0.339516 | not significant |
| China | −0.2226 | 0.295803 | not significant |
| Colombia | −0.04168 | 0.846681 | not significant |
| Comoros | 0.16589 | 0.438519 | not significant |
| Congo—Brazzaville | 0.039259 | 0.855478 | not significant |
| Congo—Kinshasa | −0.01833 | 0.932257 | not significant |
| Costa Rica | −0.04959 | 0.817994 | not significant |
| Côte d’Ivoire | 0.088248 | 0.681771 | not significant |
| Croatia | 0.090166 | 0.67522 | not significant |
| Cuba | 0.024516 | 0.909469 | not significant |
| Curaçao | 0.117277 | 0.585235 | not significant |
| Cyprus | −0.03672 | 0.864739 | not significant |
| Czechia | −0.18693 | 0.381775 | not significant |
| Denmark | 0.207912 | 0.329615 | not significant |
| Djibouti | −0.03659 | 0.865206 | not significant |
| Dominica | 0.014971 | 0.944645 | not significant |
| Dominican Republic | −0.06974 | 0.74608 | not significant |
| Ecuador | 0.307463 | 0.143872 | not significant |
| Egypt | 0.066507 | 0.757499 | not significant |
| El Salvador | −0.06432 | 0.765254 | not significant |
| Equatorial Guinea | −0.18634 | 0.383297 | not significant |
| Estonia | −0.00644 | 0.976169 | not significant |
| Eswatini | −0.02406 | 0.911145 | not significant |
| Ethiopia | 0.099336 | 0.644216 | not significant |
| Faroe Islands | −0.00035 | 0.998714 | not significant |
| Fiji | −0.17233 | 0.42068 | not significant |
| Finland | 0.073906 | 0.731445 | not significant |
| France | 0.098315 | 0.647641 | not significant |
| French Guiana | −0.05422 | 0.801314 | not significant |
| French Polynesia | −0.16382 | 0.444329 | not significant |
| Gabon | 0.128604 | 0.549245 | not significant |
| Gambia | −0.09829 | 0.647714 | not significant |
| Georgia | 0.062136 | 0.773018 | not significant |
| Germany | 0.120046 | 0.576343 | not significant |
| Ghana | 0.035662 | 0.868604 | not significant |
| Gibraltar | 0.062093 | 0.773169 | not significant |
| Greece | 0.091659 | 0.670135 | not significant |
| Greenland | 0.151738 | 0.479073 | not significant |
| Grenada | −0.16569 | 0.439078 | not significant |
| Guadeloupe | −0.17654 | 0.409241 | not significant |
| Guam | −0.19768 | 0.354478 | not significant |
| Guatemala | −0.08468 | 0.694017 | not significant |
| Guernsey | 0.016417 | 0.939308 | not significant |
| Guinea | 0.093087 | 0.665285 | not significant |
| Guinea-Bissau | no correlation | no correlation | not significant |
| Guyana | −0.05355 | 0.803751 | not significant |
| Haiti | 0.097893 | 0.649058 | not significant |
| Honduras | −0.0947 | 0.659824 | not significant |
| Hong Kong | −0.42424 | 0.038813 | statistically significant |
| Hungary | 0.107359 | 0.617554 | not significant |
| Iceland | 0.0398 | 0.853508 | not significant |
| India | 0.039949 | 0.852966 | not significant |
| Indonesia | −0.06099 | 0.777109 | not significant |
| Iran | −0.19558 | 0.359735 | not significant |
| Iraq | 0.135739 | 0.527111 | not significant |
| Ireland | 0.051086 | 0.812607 | not significant |
| Isle of Man | 0.073164 | 0.734045 | not significant |
| Israel | −0.09267 | 0.666686 | not significant |
| Italy | 0.07234 | 0.736935 | not significant |
| Jamaica | 0.213237 | 0.317096 | not significant |
| Japan | −0.35339 | 0.090271 | not significant |
| Jersey | 0.16045 | 0.453885 | not significant |
| Jordan | 0.088905 | 0.679525 | not significant |
| Kazakhstan | −0.20714 | 0.331451 | not significant |
| Kenya | 0.018438 | 0.931856 | not significant |
| Kosovo | −0.14557 | 0.497324 | not significant |
| Kuwait | 0.19782 | 0.354143 | not significant |
| Kyrgyzstan | −0.05025 | 0.815624 | not significant |
| Laos | −0.16247 | 0.44816 | not significant |
| Latvia | 0.287447 | 0.173207 | not significant |
| Lebanon | 0.110645 | 0.606766 | not significant |
| Lesotho | 0.06515 | 0.762308 | not significant |
| Liberia | −0.21222 | 0.319458 | not significant |
| Libya | 0.08889 | 0.679576 | not significant |
| Liechtenstein | −0.07501 | 0.727568 | not significant |
| Lithuania | −0.11568 | 0.590391 | not significant |
| Luxembourg | 0.094974 | 0.658897 | not significant |
| Macao | −0.05698 | 0.791434 | not significant |
| Madagascar | −0.09165 | 0.670158 | not significant |
| Malawi | −0.04478 | 0.835413 | not significant |
| Malaysia | −0.3219 | 0.125036 | not significant |
| Maldives | 0.076795 | 0.721346 | not significant |
| Mali | −0.08522 | 0.692171 | not significant |
| Malta | −0.04598 | 0.831055 | not significant |
| Martinique | −0.27954 | 0.185867 | not significant |
| Mauritania | 0.819754 | 9.51 × 10⁻⁷ | statistically significant |
| Mauritius | −0.03636 | 0.86604 | not significant |
| Mexico | 0.393424 | 0.057171 | not significant |
| Moldova | −0.03068 | 0.886823 | not significant |
| Mongolia | 0.412104 | 0.045387 | statistically significant |
| Montenegro | −0.09137 | 0.671121 | not significant |
| Morocco | 0.160407 | 0.454008 | not significant |
| Mozambique | −0.17488 | 0.413754 | not significant |
| Myanmar (Burma) | 0.034417 | 0.873154 | not significant |
| Namibia | 0.121531 | 0.571599 | not significant |
| Nepal | −0.11723 | 0.585373 | not significant |
| Netherlands | 0.14285 | 0.505484 | not significant |
| New Caledonia | −0.2661 | 0.208817 | not significant |
| New Zealand | 0.124488 | 0.562206 | not significant |
| Nicaragua | −0.03112 | 0.885239 | not significant |
| Niger | 0.156955 | 0.463905 | not significant |
| Nigeria | 0.217549 | 0.307175 | not significant |
| North Macedonia | 0.173099 | 0.418589 | not significant |
| Northern Mariana Islands | 0.646713 | 0.000638 | statistically significant |
| Norway | 0.08754 | 0.684195 | not significant |
| Oman | −0.03557 | 0.868938 | not significant |
| Pakistan | −0.13549 | 0.527882 | not significant |
| Palestine | 0.098489 | 0.647058 | not significant |
| Panama | 0.168015 | 0.432593 | not significant |
| Papua New Guinea | −0.07654 | 0.722227 | not significant |
| Paraguay | 0.153044 | 0.475254 | not significant |
| Peru | 0.234161 | 0.270762 | not significant |
| Philippines | −0.39349 | 0.057128 | not significant |
| Poland | 0.173083 | 0.418631 | not significant |
| Portugal | 0.143596 | 0.50324 | not significant |
| Puerto Rico | −0.02542 | 0.906154 | not significant |
| Qatar | 0.125201 | 0.55995 | not significant |
| Réunion | 0.054686 | 0.799656 | not significant |
| Romania | 0.025209 | 0.906921 | not significant |
| Russia | −0.05316 | 0.805152 | not significant |
| Rwanda | 0.014844 | 0.945115 | not significant |
| Samoa | −0.28245 | 0.181134 | not significant |
| San Marino | 0.060922 | 0.777342 | not significant |
| Saudi Arabia | −0.03375 | 0.875606 | not significant |
| Senegal | 0.072302 | 0.737068 | not significant |
| Serbia | −0.1206 | 0.574572 | not significant |
| Seychelles | 0.013748 | 0.949161 | not significant |
| Sierra Leone | −0.14807 | 0.489887 | not significant |
| Singapore | 0.255118 | 0.228925 | not significant |
| Sint Maarten | −0.12123 | 0.572562 | not significant |
| Slovakia | 0.048977 | 0.820217 | not significant |
| Slovenia | 0.127292 | 0.553361 | not significant |
| Solomon Islands | 0.013335 | 0.950688 | not significant |
| Somalia | 0.109009 | 0.612126 | not significant |
| South Africa | 0.052403 | 0.807865 | not significant |
| South Korea | 0.368282 | 0.076606 | not significant |
| South Sudan | −0.18285 | 0.392433 | not significant |
| Spain | 0.139112 | 0.516797 | not significant |
| Sri Lanka | −0.05101 | 0.81287 | not significant |
| St. Barthélemy | 0.071335 | 0.740467 | not significant |
| St. Helena | 0.001053 | 0.996102 | not significant |
| St. Kitts and Nevis | −0.05172 | 0.810321 | not significant |
| St. Lucia | −0.24535 | 0.24786 | not significant |
| St. Martin | −0.08901 | 0.679155 | not significant |
| St. Pierre and Miquelon | 0.02774 | 0.897619 | not significant |
| St. Vincent and Grenadines | 0.132365 | 0.537525 | not significant |
| Sudan | −0.11314 | 0.598624 | not significant |
| Suriname | 0.054396 | 0.800697 | not significant |
| Sweden | 0.136607 | 0.524449 | not significant |
| Switzerland | 0.017598 | 0.934952 | not significant |
| Syria | 0.015707 | 0.941928 | not significant |
| Taiwan | 0.4215 | 0.040229 | statistically significant |
| Tajikistan | 0.172028 | 0.421518 | not significant |
| Tanzania | −0.1645 | 0.442414 | not significant |
| Thailand | −0.01067 | 0.960521 | not significant |
| Timor-Leste | 0.5755 | 0.003256 | statistically significant |
| Togo | 0.099706 | 0.642978 | not significant |
| Trinidad and Tobago | 0.137748 | 0.520958 | not significant |
| Tunisia | 0.106702 | 0.619719 | not significant |
| Türkiye | 0.284156 | 0.178401 | not significant |
| Turkmenistan | 0.137217 | 0.522581 | not significant |
| Turks and Caicos Islands | 0.319718 | 0.127765 | not significant |
| U.S. Virgin Islands | 0.06417 | 0.765787 | not significant |
| Uganda | 0.013549 | 0.949899 | not significant |
| Ukraine | 0.089928 | 0.67603 | not significant |
| United Arab Emirates | −0.05261 | 0.80713 | not significant |
| United Kingdom | 0.39561 | 0.055681 | not significant |
| Uruguay | 0.204763 | 0.337156 | not significant |
| Uzbekistan | −0.42842 | 0.036735 | statistically significant |
| Vanuatu | −0.07757 | 0.718644 | not significant |
| Venezuela | 0.110428 | 0.607474 | not significant |
| Vietnam | 0.118984 | 0.579746 | not significant |
| Western Sahara | 0.151467 | 0.479867 | not significant |
| Yemen | 0.088108 | 0.68225 | not significant |
| Zambia | 0.2617 | 0.216722 | not significant |
| Zimbabwe | −0.07489 | 0.727997 | not significant |
| Region Name | Search Interest at 2 PM | Search Interest at 3 PM | Percentage Increase |
|---|---|---|---|
| Algeria | 6 | 16 | 166.6667 |
| Argentina | 31 | 39 | 25.80645 |
| Austria | 18 | 20 | 11.11111 |
| Belgium | 19 | 22 | 15.78947 |
| Bolivia | 10 | 22 | 120 |
| Cambodia | 22 | 77 | 250 |
| Canada | 52 | 58 | 11.53846 |
| Costa Rica | 5 | 10 | 100 |
| Cuba | 13 | 14 | 7.692308 |
| Denmark | 29 | 33 | 13.7931 |
| Dominican Republic | 4 | 5 | 25 |
| Finland | 8 | 9 | 12.5 |
| France | 23 | 25 | 8.695652 |
| Greece | 8 | 18 | 125 |
| Guatemala | 4 | 7 | 75 |
| Hungary | 11 | 21 | 90.90909 |
| India | 64 | 70 | 9.375 |
| Indonesia | 62 | 66 | 6.451613 |
| Israel | 13 | 16 | 23.07692 |
| Italy | 32 | 34 | 6.25 |
| Jersey | 2 | 10 | 400 |
| Lebanon | 6 | 10 | 66.66667 |
| Mexico | 39 | 41 | 5.128205 |
| Morocco | 16 | 19 | 18.75 |
| Nigeria | 31 | 47 | 51.6129 |
| Palestine | 6 | 8 | 33.33333 |
| Poland | 39 | 46 | 17.94872 |
| Portugal | 12 | 14 | 16.66667 |
| Qatar | 20 | 23 | 15 |
| Senegal | 8 | 9 | 12.5 |
| Slovenia | 2 | 4 | 100 |
| South Korea | 80 | 87 | 8.75 |
| Spain | 38 | 41 | 7.894737 |
| Sri Lanka | 22 | 34 | 54.54545 |
| Sweden | 27 | 32 | 18.51852 |
| Switzerland | 11 | 14 | 27.27273 |
| Taiwan | 16 | 87 | 443.75 |
| Tunisia | 6 | 11 | 83.33333 |
| Turks and Caicos Islands | 4 | 7 | 75 |
| Ukraine | 25 | 28 | 12 |
| United Kingdom | 18 | 19 | 5.555556 |
| United States | 51 | 100 | 96.07843 |
| Uruguay | 2 | 8 | 300 |
| Vietnam | 55 | 62 | 12.72727 |
| Zambia | 11 | 14 | 27.27273 |
Disclaimer/Publisher’s Note: The statements, opinions and data contained in all publications are solely those of the individual author(s) and contributor(s) and not of MDPI and/or the editor(s). MDPI and/or the editor(s) disclaim responsibility for any injury to people or property resulting from any ideas, methods, instructions or products referred to in the content. |
© 2023 by the authors. Licensee MDPI, Basel, Switzerland. This article is an open access article distributed under the terms and conditions of the Creative Commons Attribution (CC BY) license (https://creativecommons.org/licenses/by/4.0/).
Share and Cite
Thakur, N.; Cui, S.; Patel, K.A.; Azizi, N.; Knieling, V.; Han, C.; Poon, A.; Shah, R. Marburg Virus Outbreak and a New Conspiracy Theory: Findings from a Comprehensive Analysis and Forecasting of Web Behavior. Computation 2023, 11, 234. https://doi.org/10.3390/computation11110234
Thakur N, Cui S, Patel KA, Azizi N, Knieling V, Han C, Poon A, Shah R. Marburg Virus Outbreak and a New Conspiracy Theory: Findings from a Comprehensive Analysis and Forecasting of Web Behavior. Computation. 2023; 11(11):234. https://doi.org/10.3390/computation11110234
Chicago/Turabian StyleThakur, Nirmalya, Shuqi Cui, Kesha A. Patel, Nazif Azizi, Victoria Knieling, Changhee Han, Audrey Poon, and Rishika Shah. 2023. "Marburg Virus Outbreak and a New Conspiracy Theory: Findings from a Comprehensive Analysis and Forecasting of Web Behavior" Computation 11, no. 11: 234. https://doi.org/10.3390/computation11110234
APA StyleThakur, N., Cui, S., Patel, K. A., Azizi, N., Knieling, V., Han, C., Poon, A., & Shah, R. (2023). Marburg Virus Outbreak and a New Conspiracy Theory: Findings from a Comprehensive Analysis and Forecasting of Web Behavior. Computation, 11(11), 234. https://doi.org/10.3390/computation11110234