Abstract
The maximum independent set problem is a classic and fundamental combinatorial challenge, where the objective is to find the largest subset of vertices in a graph such that no two vertices are adjacent. In this paper, we introduce a novel linear prioritized local algorithm tailored to address this problem on random d-regular graphs with a small and fixed degree d. Through exhaustive numerical simulations, we empirically investigated the independence ratio, i.e., the ratio between the cardinality of the independent set found and the order of the graph, which was achieved by our algorithm across random d-regular graphs with degree d ranging from 5 to 100. Remarkably, for every d within this range, our results surpassed the existing lower bounds determined by theoretical methods. Consequently, our findings suggest new conjectured lower bounds for the MIS problem on such graph structures. This finding has been obtained using a prioritized local algorithm. This algorithm is termed ‘prioritized’ because it strategically assigns priority in vertex selection, thereby iteratively adding them to the independent set.
1. Introduction
Given a graph , where is the set of vertices of cardinality , and E is the set of edges of cardinality , finding the maximum set of vertices wherein no two of which are adjacent is a very difficult task. This problem is known as the maximum independent set problem (MIS). The maximum independent set problem can be visualized as a quest to find the largest group of non-neighboring vertices within a graph. Imagine a party where guests represent vertices and the friendships between them represent edges. The MIS is akin to inviting the maximum number of guests such that no two of them are friends, thus ensuring no prior friendships exist within this subset of guests. In graph theoretic terms, it seeks to identify the largest subset of vertices in which no two vertices share an edge. This problem has broad implications and applications, ranging from network design, scheduling, and even in areas such as biology, where one may wish to determine the maximum set of species in a habitat without competition. It was shown to be NP-hard, and no known polynomial algorithm can be guaranteed to solve it [1]. In other words, finding a set of vertices, with the maximum cardinality, such that for every two vertices , there is no edge connecting the two, i.e., , needs a time that is super-polynomial if P ≠ NP.
For example, the first nontrivial exact algorithm for the MIS was due to Tarjan and Trojanowski’s algorithm in 1977 [2]. Since then, many improvements have been obtained. Today, the best algorithm that can solve the MIS exactly needs a time [3]. Those results are bound obtained in the worst-case scenario [4]. We direct the interested reader to [3], and the references therein, for a complete discussion on exact algorithms.
The MIS is important for applications in computer science, operations research, and engineering via such uses as graph coloring, assigning channels to the radio stations, register allocation in a compiler, artificial intelligence etc. [5,6,7,8].
In addition to having several direct applications [9], the MIS is closely related to another well-known optimization problem, the maximum clique problem [10,11]. In order to find the maximum clique (the largest complete subgraph) of a graph , it suffices to search for the maximum independent set of the complement of .
The MIS has been studied on many different random structures, in particular on Erdős-Rényi graphs (ER) and random d-regular graphs (RRG). An Erdős-Rényi graph is a graph that is selected from the distribution of all graphs of order N, where two different vertices are connected to each other via a probability p. A random d-regular graph is a graph that is selected from the distribution of all d-regular graphs on N vertices, with being even. A d-regular graph is defined as a graph where each vertex has the same number of neighbors, i.e., d.
For the Erdős-Rényi class, with , known local search algorithms can find solutions at a rate of only up to half the maximum independent set present, which is [12] in the limit .
This behavior also appears for random d-regular graphs .
1.1. Related Works
For example, Gamarnik and Sudan [13] showed that, for a sufficiently large value of d, local algorithms cannot find the size of the largest independent set in a d-regular graph of a large girth with an arbitrarily small multiplicative error.
The result of Gamarnik and Sudan [13] was improved by Rahman and Virág [14], who analyzed the intersection densities of many independent sets in random d-regular graphs. They proved that for any , local algorithms cannot find independent sets in random d-regular graphs with an independence ratio larger than if d is sufficiently large. The independence ratio is defined as the density of the independent set; thus, . Recently, the exact value of the independence ratio for all sufficiently large d values was given by Ding et al. [15].
However, these results appear to say nothing about small and fixed d values. When d is small and fixed, e.g., or , indeed, only lower and upper limits, expressed in terms of the independence ratio, are known.
Lower bounds on the independent sets’ size identify sets that an efficient algorithm can find, while upper bounds are on the actual maximum independent set, not just on the size an algorithm can find.
The first upper bound for such a problem was given in 1981 by Bollobás [16]. He showed that the supremum of the independence ratio of 3-regular graphs with large girths was less than in the limit of .
McKay, in 1987, improved and generalized this result to d-regular graphs with large girths, for different values of d [17], by using the same technique and a much more careful calculation. For example, for the cubic graph (the 3-regular graph), he was able to push Bollobás upper bound down to . However, since then, only for cubic graphs, the upper bound has been improved by Balogh et al. [18], namely, to . Cavity methods suggest a slightly lower upper bound and, thus, a smaller gap at small values of d [19]. For example, the upper bound given in [19] for was , while for , it was . In [15], it was shown that this approach can be rigorously proven, but again, only for large d values. Recently, however, this approach has been proven for in [20].
Remarkable results for lower bounds were first obtained by Wormald in 1995 [21]. He considered processes in which random graphs are labeled as they are generated and derived the conditions under which the parameters of the process concentrate around the values that come from the solution of an associated system of differential equations, which are equations for the populations of various configurations in the graph as it is grown. By solving the differential equations, he computed the lower bounds for any fixed d returned by a prioritized algorithm, thereby improving the values of the bounds given by Shearer [22].
This algorithm is called prioritized, because there is a priority in choosing vertices added to the independent set [23]. It follows the procedure of choosing vertices in the independent set one by one, with the condition that the next vertex is chosen randomly from those with the maximum number of neighbors adjacent to the vertices already in . After each new vertex in is chosen (or labeled with an I), we must complete all of its remaining connections and label the neighbors, which are identified as members of the set (for vertex cover). Although each vertex in can be chosen according to its priority, the covering vertices that complete its unfilled connections must then be chosen at random among the remaining connections to satisfy Bolobas’ configuration model [21].
This priority is a simple way to minimize the size of the set of covered vertices and maximize the number of sites remaining as candidates for the set . More precisely, we are given a random d-regular graph , and we randomly choose a site i from the set of vertices . We set i into , and we set all of the vertices neighboring i into a set . We label the elements of with the letter I, while the elements of are labeled with the letter V. Then, from the subset of vertices in that are neighbors of vertices in , but are not yet labeled I or V, we randomly choose the element k that has the maximum number of connections with sites in . We set it into . The vertices neighboring k, which are not in , are added to the set . This rule is repeated until . Along with this algorithm, one can consider an associated algorithm that simultaneously generates the random d-regular graph and labels vertices with the letter I or V. This associated algorithm, which will be described in detail in the next sections, allowed Wormald to build up the system of differential equations used for computing lower bounds for the MIS.
Improvements on this algorithm were achieved by Duckworth et al. [24]. These improvements were obtained by observing, broadly speaking, that the size of the structure produced by the algorithm is almost the same for d-regular graphs of very large girths as it is for a random d-regular graph. However, since then, new lower bounds have been achieved only at small values of d, e.g., and . Interesting results at have been achieved by Csóka, Gerencsér, Harangi, and Virág [25]. They were able to find an independent set of cardinality of up to using invariant Gaussian processes on the infinite d-regular tree. This result was once again improved by Csóka [26] alone, who was able to increase the cardinality of the independent set on large-girth 3-regular graph by up to and on a large-girth 4-regular graph by up to , by numerically solving the associated system of differential equations.
These improvements were obtained by deferring the decision as to whether a site must be labeled with the letter I or V. More precisely, this requires that the sites for which a decision is deferred need additional (temporary) labels. This means that counting the evolution of their populations, either through a differential equation or with an experiment, becomes more complicated.
Csóka [26] was able to improve the lower bounds for and , but his method was not applicable to values of . These bounds cannot be considered fully rigorous, as they require some kind of computer simulation or estimation [20].
1.2. Main Results
This paper aims to compute independent set density for any using an experimental approach, i.e., algorithms that are linear in N. Table 1 presents the best upper and lower bounds for in the first and second columns, respectively. Recently, the authors in [27] presented a Monte Carlo method that can experimentally outperform any algorithm in finding a large independent set in random d-regular graphs, in a (using the words of the authors) “running time growing more than linearly in N” [27]. These authors conjectured lower bound improvements only for and , but with experimental results obtained on random d-regular graphs of the order . However, in this work, we are interested in comparing our results with the ones given by the family of prioritized algorithms, because we believe that a rigorous analysis of the computational complexity should be performed on these types of algorithms.

Table 1.
The table shows the values of upper and lower bounds for the independence ratio for random d-regular graphs with small and fixed values of d. d is the degree of the random d-regular graph. The column describes the upper bound computed by Harangi [20] for and by Barbier et al. in [19] for . Upper bounds identify the actual maximum values of the independent set fraction. The column identifies the best independent set density values obtained in [21,24,26,28]. Lower bounds identify the size of independent sets that an efficient algorithm can find. The last column, i.e., , instead identifies the confidence intervals of the conjectured new bounds.
In this paper, as stated above, we present the experimental results of a greedy algorithm, i.e., a deferred decision algorithm built upon existing heuristic strategies, which leads to improvements on the known lower bounds of a large independent set in random d-regular graphs [21,24,28]. These bounds cannot be considered fully rigorous, as they require computer simulations and estimations. However, the main contribution of this manuscript is to present a new method that is able to return, on average, independent sets for random d-regular graphs that before were not possible. This new algorithm runs in linear time and melds Wormald’s, Duckworth’s and Zito’s, and Csoka’s ideas of prioritized algorithms [21,24,26,28]. The results obtained here are conjectured new lower bounds for a large independent set in random d-regular graphs. They were obtained by inferring the asymptotic values that our algorithm can reach when and by averaging sufficient simulations to achieve confidence intervals at . These results led to improvements on the known lower bounds that, as far as we know, have not been reached by any other greedy algorithm (see fourth column Table 1). Although the gap regarding upper bounds is still present, these improvements may imply new rigorous results for finding a large independent set in random d-regular graphs.
1.3. Paper Structure
The paper is structured as follows: in Section 2, we define our deferred decision algorithm, and we introduce a site labeling, which will identify those sites for which we defer the labeling decisions. In Section 3, we present the deferred decision algorithm for , and we introduce the experimental results obtained on random 3-regular graphs of sizes up to as a sanity check of our experimental results. We recall that the order of a graph is the cardinality of its vertex set , while the size of a graph is the cardinality of its edge set E. In Section 4, we present our deferred decision algorithm for , and the experimental results associated with it, using extrapolation on random d-regular graphs with sizes of up to .
2. Notation and the General Operations of the Deferred Decision Algorithm
In this section, we define the notation used throughout this manuscript, and we define all of the operations that will be used to understand the deferred decision algorithm. As a starting point, and also for the following section, we define the set as the set of unlabeled nodes. We start by recalling that we deal with random d-regular graphs , where d is the degree of each vertex , where is the set of vertices, and . All vertices are unlabeled.
In order to build a random d-regular graph, we used the method described in [21] and introduced in [16].
Definition 1
(Generator of Random d-Regular Graphs Algorithm). We take points, with being even, and distribute them in N urns that are labeled , with d points in each urn. We choose a random pairing of the points such that . Each urn identifies a site in . Each point is in only one pair , and no pair contains two points in the same urn. No two pairs contain four points from just two urns. In order to build a d-regular graph , we then connect two distinct vertices i and j if some pair has a point in urn i and one in urn j. The conditions on the pairing prevent the formation of loops and multiple edges.
The referred pairing must be chosen uniformly at random and subjected to the constraints given. This can be done by repeatedly choosing an unpaired point and then choosing a partner for this point to create a new pair. As long as the partner is chosen uniformly at random from the remaining unpaired points, and as long as the process is restarted if a loop or multiple edge is/are created, the result is a random pairing of the required type [21].
In this paper, we use the method described above so that while we generate the random d-regular graph , concurrently with our labeling process, we identify new links as labeling sites.
The graphs built using the Generator of Random d-Regular Graphs Algorithm prevent the formation of loops and multiple edges without introducing bias in the distribution where we sample the graphs [21,23].
We define two separate sets and for independent and vertex cover sites, respectively. identifies the set of graph nodes that satisfies the property wherein no two nodes are adjacent, and is its complement. A site is labeled with the letter I, while a site is labeled with the letter V.
We define to be the degree of a vertex i, i.e., the number of links that a site is connected with, while is the antidegree of a vertex i, i.e., the number of free connections that i needs to complete during the graph-building process. Of course, the constraint is always preserved . At the beginning of the graph-building process, all have . At the end of the graph-building process, all graph nodes will have . We define to be the set that contains all of the neighbors of i.
For the sake of clarity, we define a simple subroutine on a single site of the Generator of Random d-Regular Graphs Algorithm (Subroutine GA(i, )) that will be useful for describing the algorithm presented in the next sections. The Subroutine GA(i, ) generates the remaining connections of site i. It keeps the supporting data to reflect the evolution of the network growth.
| Algorithm 1: Subroutine GA(i, ). |
|
Input: , ; Output: i connected with d sites; 1 Using the rules in Definition 1, i is connected randomly with -sites; 2 ; 3 ; 4 return i connected with d sites; |
The sites that we choose following some priority, either the one we describe or any other scheme, will be called P sites. The sites that are found by following links from the P sites (or by randomly generating connections from the P sites) are called C sites. More precisely, each site that we choose that is not labeled yet with any letter (C or P), s.t. and the random connection(s) present on j is(are) on site(s) in , is a P site. The set defines the set of P sites. The set is kept in ascending order with respect to the degree of each site .
In general, a site i that is labeled as P will be surrounded by two sites that are labeled as C. Because the labeling of those sites is deferred, we call those structures virtual sites. A single virtual site, , has an antidegree equal to the sum of all of the antidegrees of sites l that compose site , i.e., . The number of sites is equal to the cardinality of . The degree of is . As an example, we show in Figure 1 the operation of how a virtual site is created from a site with and , as well as two sites with , , , and . Let us assume that a site s.t. exists. This is possible because a site is connected with it. This means that s must be labeled as P and put into . Let us run Subroutine GA(s, ) on s and assume that the s connects with two neighbors . Given that are connected to a P site, they are labeled as C values. We then define . This set is a virtual node with .
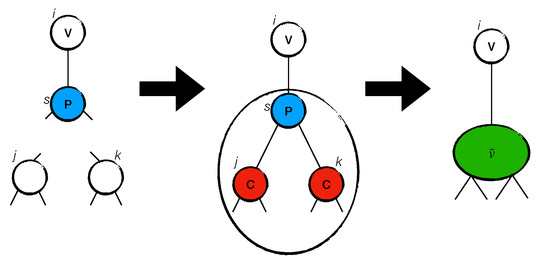
Figure 1.
The figure shows the equivalence of a structure with a site of antidegree . The site s, labeled P, is connected to site with two random sites, j and k, labeled C values. The resulting structure is a virtual site .
We define to be the set of virtual sites. The set is kept in ascending order with respect to the degree of each virtual site . Virtual sites can be created—as described above—expanded, or merged together (creating a new virtual site ). Two examples are shown in Figure 2 and Figure 3.
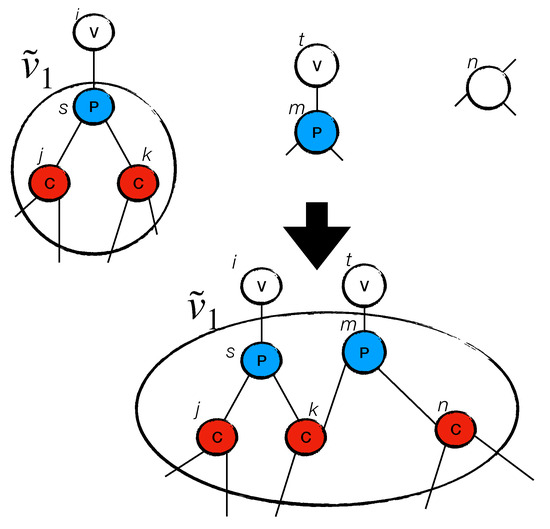
Figure 2.
The figure shows how the virtual site is expanded.
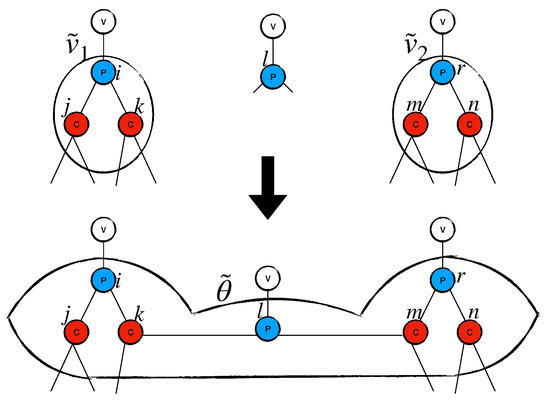
Figure 3.
The figure shows how a virtual site with is created.
Figure 2 shows how to expand a virtual site . Let us imagine that a site , with antidegree , is chosen. Let us run Subroutine GA(m, ) on m. Assume that m connects with () and with (). In this case, expands itself, thereby swallowing sites m and n and having a .
Figure 3 shows how two virtual sites merge together. Let us imagine that a site , with antidegree , is chosen during the graph-building process. Let us run Subroutine GA(p, ) on m. Assume that p connects with two virtual sites and , with and . The new structure is a virtual site with .
We define in the following a list of operations that will be useful for understanding the algorithm presented in the next sections.
Definition 2
(). Let and be two sets. Let and . We define to be the operation that moves the site from the set to , i.e., and .
For example, moves from the set to , i.e., and . Instead, the operation moves from the set to , i.e., and . We recall that when a site is set into , it is labeled with I, while when a site is set into , it is labeled with V.
Definition 3
(). Let be the set that contains the virtual nodes . We define to be the operation that deletes the site from the set , i.e., the element anymore, and it applies the operation on each site through the following rule:
- if is labeled with the letter P, then and ;
- if is labeled with the letter C, then and .
Definition 4
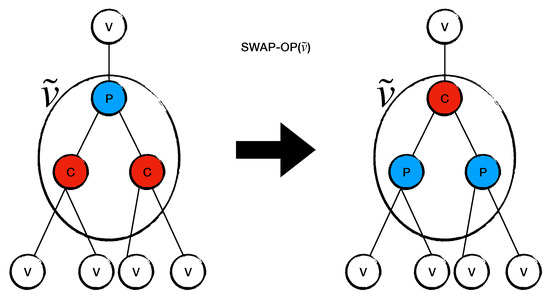
(). Let . We define to be the operation such that :
- if i is labeled as P, then the label P swaps to C;
- if i is labeled as C, then the label C swaps to P.
Figure 4 shows how acts on a virtual site .

Figure 4.
The figure shows how works on a virtual site , which has . swaps all P sites in into C sites and all C sites in into P sites.
3. The Deferred Decision Algorithm for
In this section, we present our algorithm, which is simpler and slightly different from the one in [26], but it is based on the same idea for determining a large independent set in random d-regular graphs with , i.e., . The algorithm in [26] works only for and . This exercise is performed as a sanity check for the algorithm. This algorithm will also be at the core of the algorithm developed in Section 4.
As mentioned above, the algorithm discussed in this paper is basically a prioritized algorithm, i.e., an algorithm that makes local choices in which there is a priority in selecting a certain site. Our algorithm belongs to this class.
We start the discussion on the local algorithm for by giving the pseudocode of the algorithm in Algorithm 2.
The algorithm starts by building up a set of sites of cardinality , and from the set it randomly picks a site i. Then, the algorithm completes the connections of site i in a random way by following the method described in Algorithm 1. Once all its connections are completed, site i has and . It is labeled with the letter V, erased from , and set into . In other words, operation is applied on it. Each neighbor of i, i.e., , has degree and antidegree . Therefore, they are set into and thus labeled P values.
The algorithm picks a site k from with the minimum remaining connections. In general, if k has , the algorithm completes all its connections, and it removes it from . Each site connected with a P value is automatically labeled with the letter C. If a site connects to another site , with , j is removed from , and it is labeled as a C value.
If has , the site k is set into , and it is removed from and , i.e., the algorithm applies the operation .
As defined in Section 2, a structure is equivalent to a single virtual site, , which has an antidegree . Each virtual site is created with , and it is inserted into the set .
Once the set is empty, and if and only if in the virtual sites with antidegrees less than or equal to 2 are not present, the algorithm selects a site with the largest antidegree , and it applies the operation after having completed all the connections with by using Algorithm 1 on each with .
We apply operation on virtual sites with the largest antidegree, because we hope the random connections outgoing from those sites will reduce the antidegrees of the existing virtual sites in in such a way that the probability of having virtual nodes with antidegrees of increases. In other words, we want to create islands of virtual sites that are surrounded by a sea of V sites in order to apply the on those nodes. This protocol, indeed, makes it possible to increase the independent set cardinality and decrease the vertex cover set cardinality.
| Algorithm 2: local algorithm for d = 3. |
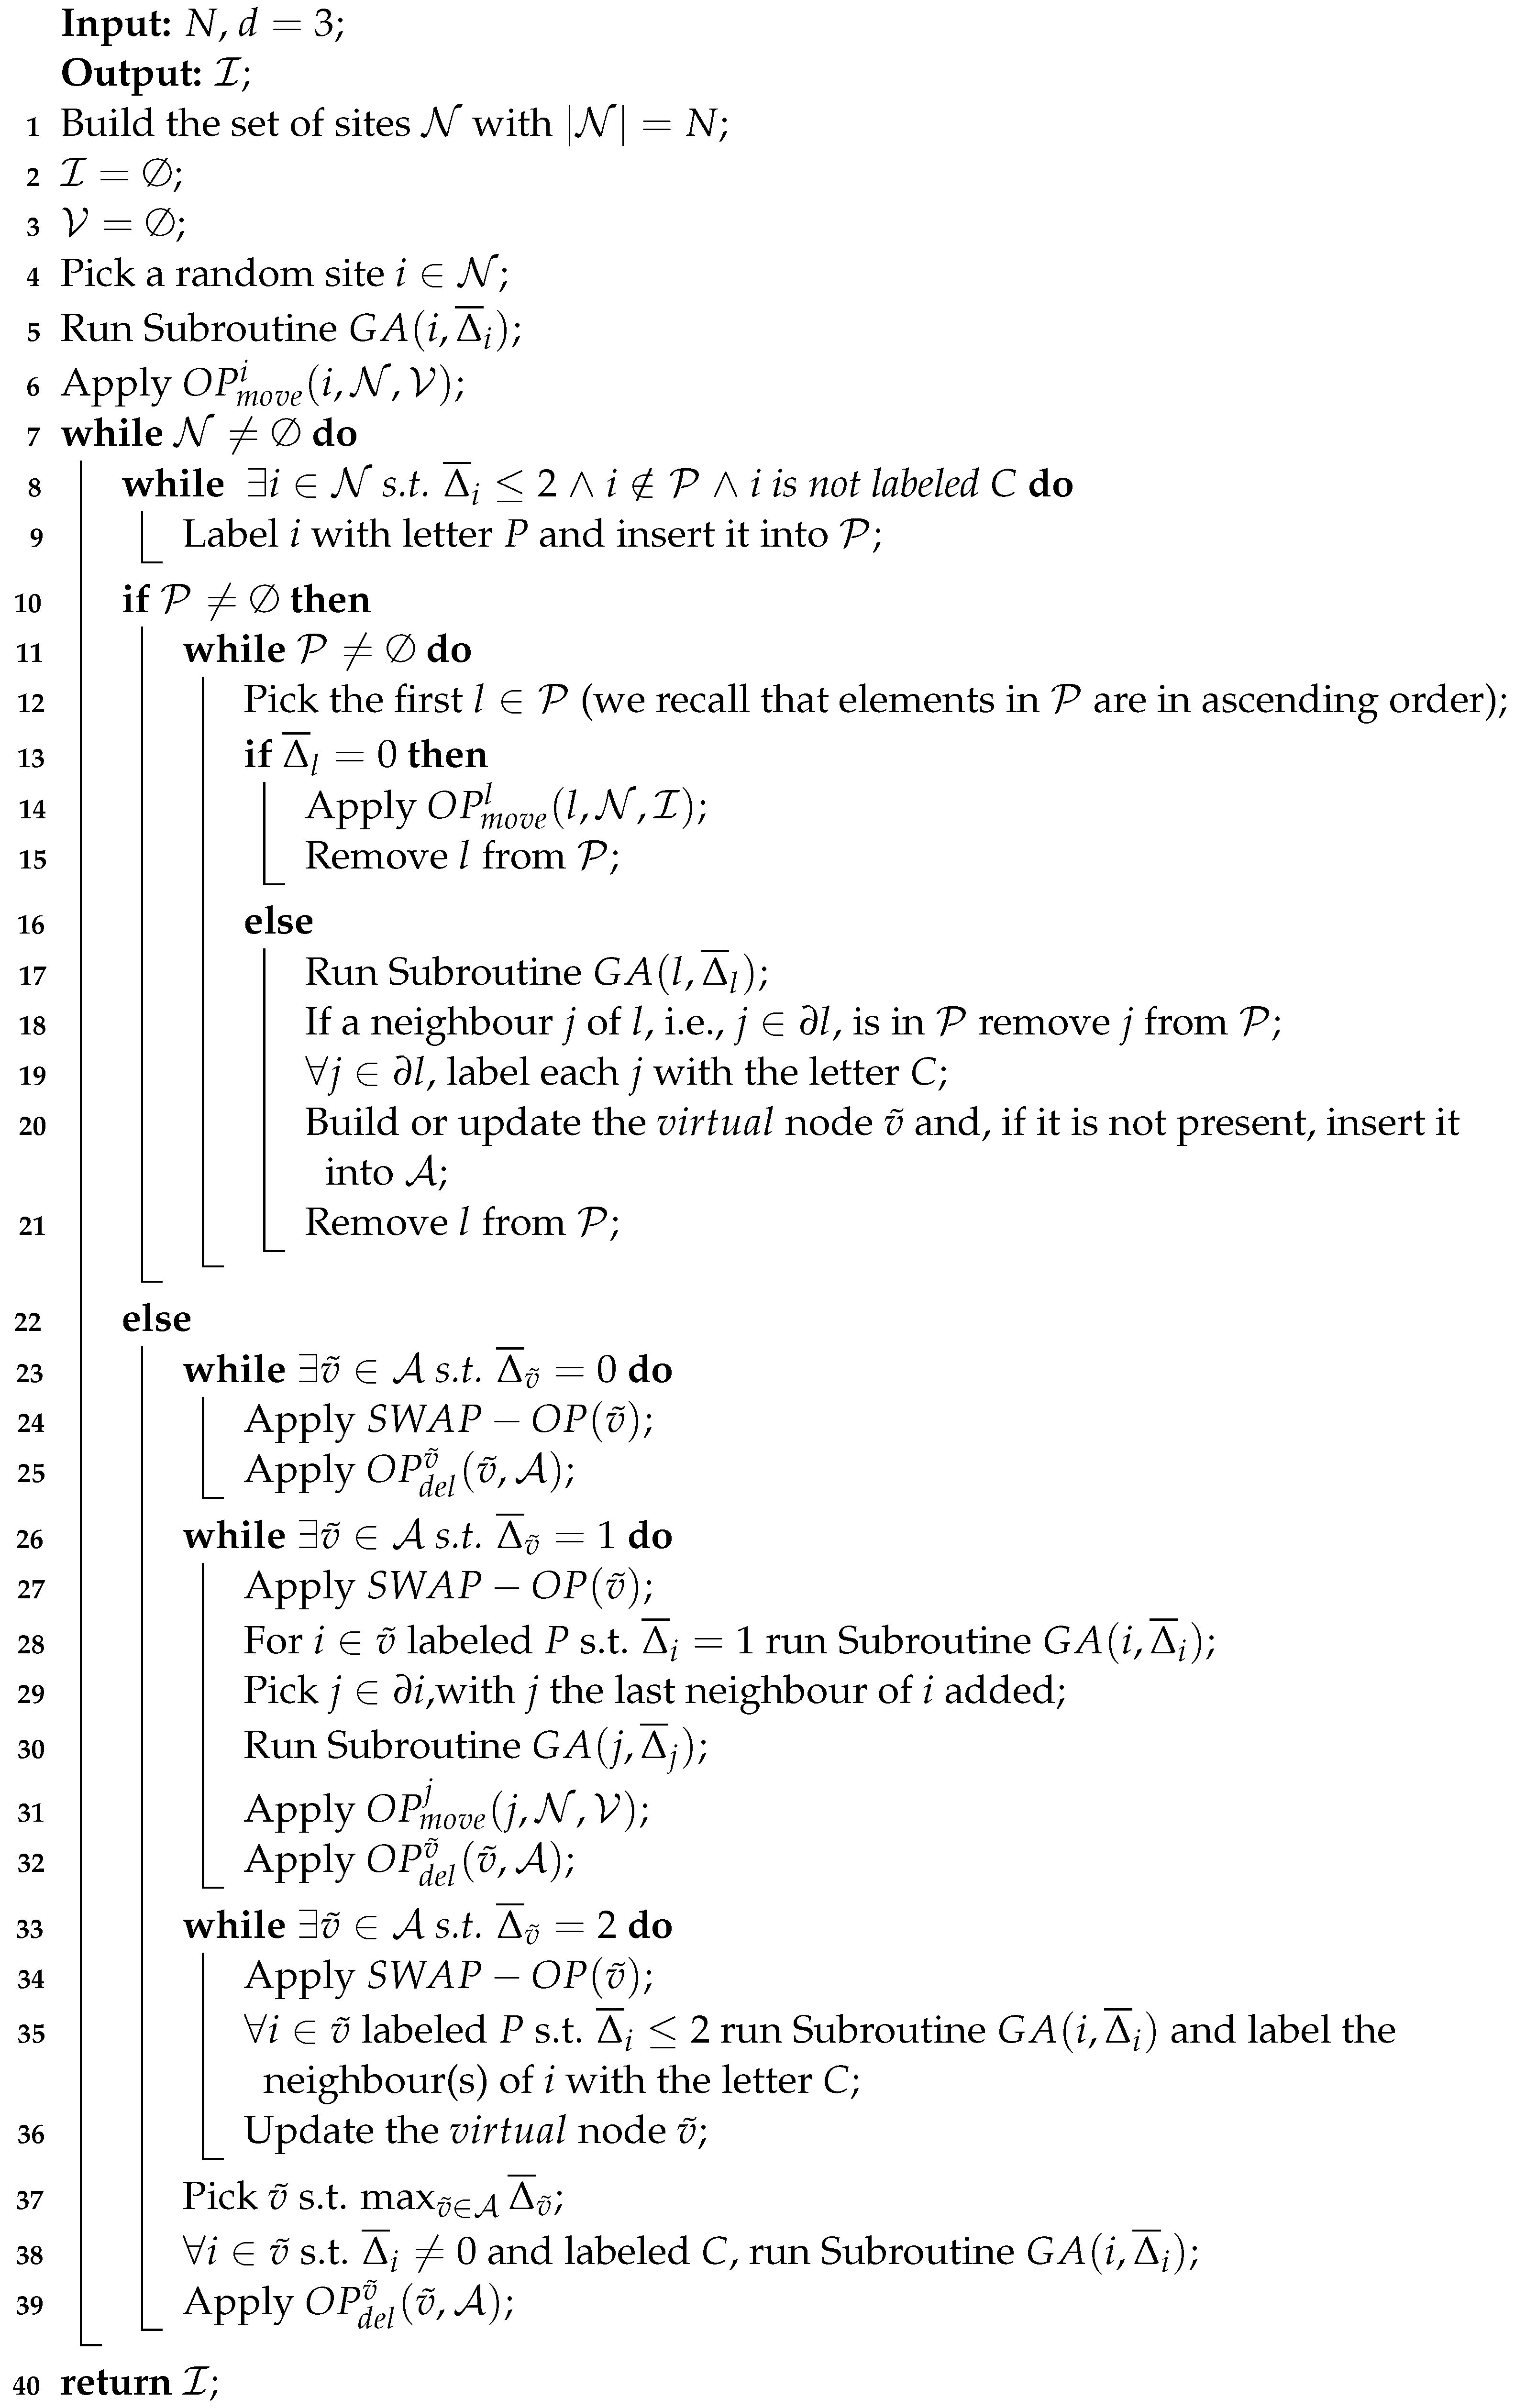 |
For this reason, if virtual nodes with antidegrees of exist in , those sites have the highest priority in being selected. More precisely, the algorithm follows the priority rule:
- s.t. , the algorithm sequentially applies the operation and then the operation .
- If no virtual sites with are present, then the algorithm looks for those that have . s.t. , it applies the operation , completes the last connection of the site with , applies on the last neighbour of i added to , and then applies .
- If no virtual sites with and are present, then the algorithm looks for those that have . s.t. , it applies the operation , completes the last connections of the sites with , labels the new added sites with the letter C, and updates the degree and the antidegree of the virtual node .
The algorithm proceeds by selecting virtual nodes and creating sites labeled as P values until . Once , it returns the set , which is the set of independent sites. The code of the algorithm can be released upon request.
We are comparing numerical results for independence ratios that agree with theoretical ones, at least up to the fifth digit. For this reason, we performed an accurate analysis on random 3-regular graphs, starting from those that had an order of and pushing the number up to .
This analysis aimed to compute the sample mean of the independence ratio size that was outputted by our algorithm. Each average was obtained in the following manner: for graphs of the order , we averaged over a sample of graphs; for the order , we made an average over a sample of graphs; for the order , we made an average over a sample of graphs; for the order , the average was performed over a sample of graphs; we performed this average for the over graphs, for the over graphs, for the over graphs, for the over 50 graphs, and for the over 10 graphs. The mean and the standard deviation for each analyzed sample are reported in Table 2. Upon observing that the values of each independent set ratio sample mean reached an asymptotic value, we performed a linear regression on the model in order to estimate the parameter (blue line in Figure 5). When , the first term of the regression, i.e., , went to 0, thereby leaving out the value of that describes the asymptotic value of the independence ratio that our algorithm can reach. After adopting the model , one might naturally question the rationale behind the specific choice of as a regressor. This decision is grounded in the intrinsic nature of large graphs. In numerous instances, as seen in small-world networks, the properties of these networks scale logarithmically with their size. The logarithmic factor effectively translates the expansive range of data values into a scale that is more analytically tractable. By employing as our regressor, we are capturing the progressively diminishing influence of augmenting N on our parameter, . With each incremental increase in N, the relative change it induces becomes less significant. This logarithmic term encapsulates this tapering sensitivity, thereby making it a fitting choice for our regression model. Using the numerical standard errors obtained from each sample, we applied a general least square (GLS) method [29] in order to infer the values of the parameters , thereby averaging sufficient simulations to achieve a confidence interval of on them. The value of is the most important, because it is the asymptotic value that our algorithm can reach when . From the theory of GLS, we know that the estimator of the parameter is unbiased, consistent, and efficient, and a confidence interval on this parameter is justified. The analysis, performed on data reported in Table 2, shows that the independent set ratio reached the asymptotic value . This value agrees with the theoretical value proposed in [26].

Table 2.
The table shows the sample average and standard deviation values of the independent set ratio the for random regular graphs of order N and .
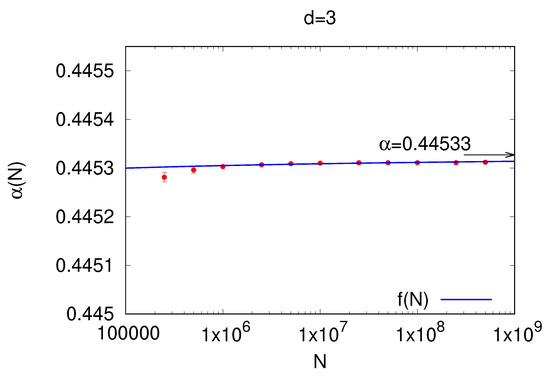
Figure 5.
The figure shows the extrapolation of the independent set ratio as a function of the graph order, i.e., and . The error bars identify the standard errors multiplied by the quantile of the t distribution . The asymptotic value , extrapolated by fitting the data using a function (blue line), where , identifies the values that our algorithm can reach when . The confidence interval of of (in Table 1) agrees with the theoretical value of = 0.44533.
4. The Deferred Decision Algorithm for
In this section, we present how to generalize the prioritized algorithm for all . It, as with the one previously described in Section 3, builds the random regular graph and, at the same time, tries to maximize the independent set cardinality . The main idea that we propose is to melt down two existing algorithms, namely, the one in [21] and the one described above, into a new prioritized algorithm, which is able to maximize the independent set cardinality, thereby providing improved estimates of the lower bounds. The new conjectured lower bounds come from extrapolation on random d-regular graphs of sizes up to .
Before introducing the algorithm, we present a new operation that will allow us to simplify the discussion.
Definition 5
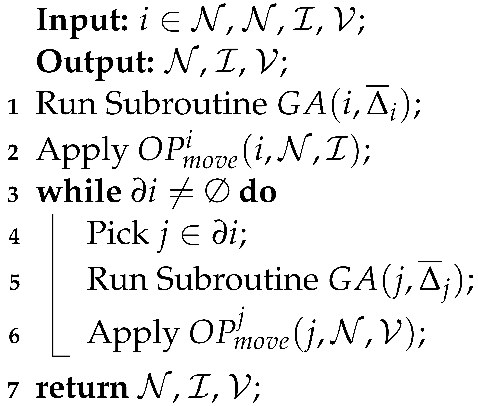
(). Let . We define as the operation that connects i to sites following the Algorithm 1 rules, applies , and, , sequentially runs Algorithm 1 and applies the operation .
The pseudocode of the last operation is described in Algorithm 3.
| Algorithm 3: . |
 |
We start the discussion on the local algorithm for by giving the pseudocode of the algorithm in Algorithm 4.
The algorithm starts randomly selecting a site z from the set of all nodes , i.e., . It then applies on the site z (see Figure 6). This operation creates nodes with different degrees and antidegrees. The algorithm proceeds in choosing the node m from those values with minimum values. If the node m has values, the algorithm applies the operation on site m. In other words, we are using the algorithm developed in [21] until a site with pops up. When such a case appears, we label it as a P site and we move it into the set .
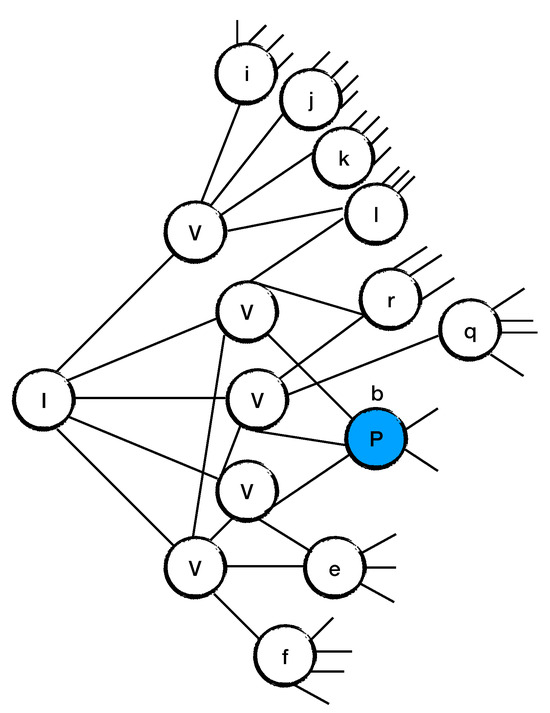
Figure 6.
The figure shows how a P site appears, i.e., a site b with , in a random d-regular graph with degree . In the event that a P site has not been created, the algorithm picks a site with minimum and applies operation on it.
As described in Section 3, once the set is not empty, the sites in the set have the highest priority in being processed for creating virtual nodes.
| Algorithm 4: local algorithm for d 5. |
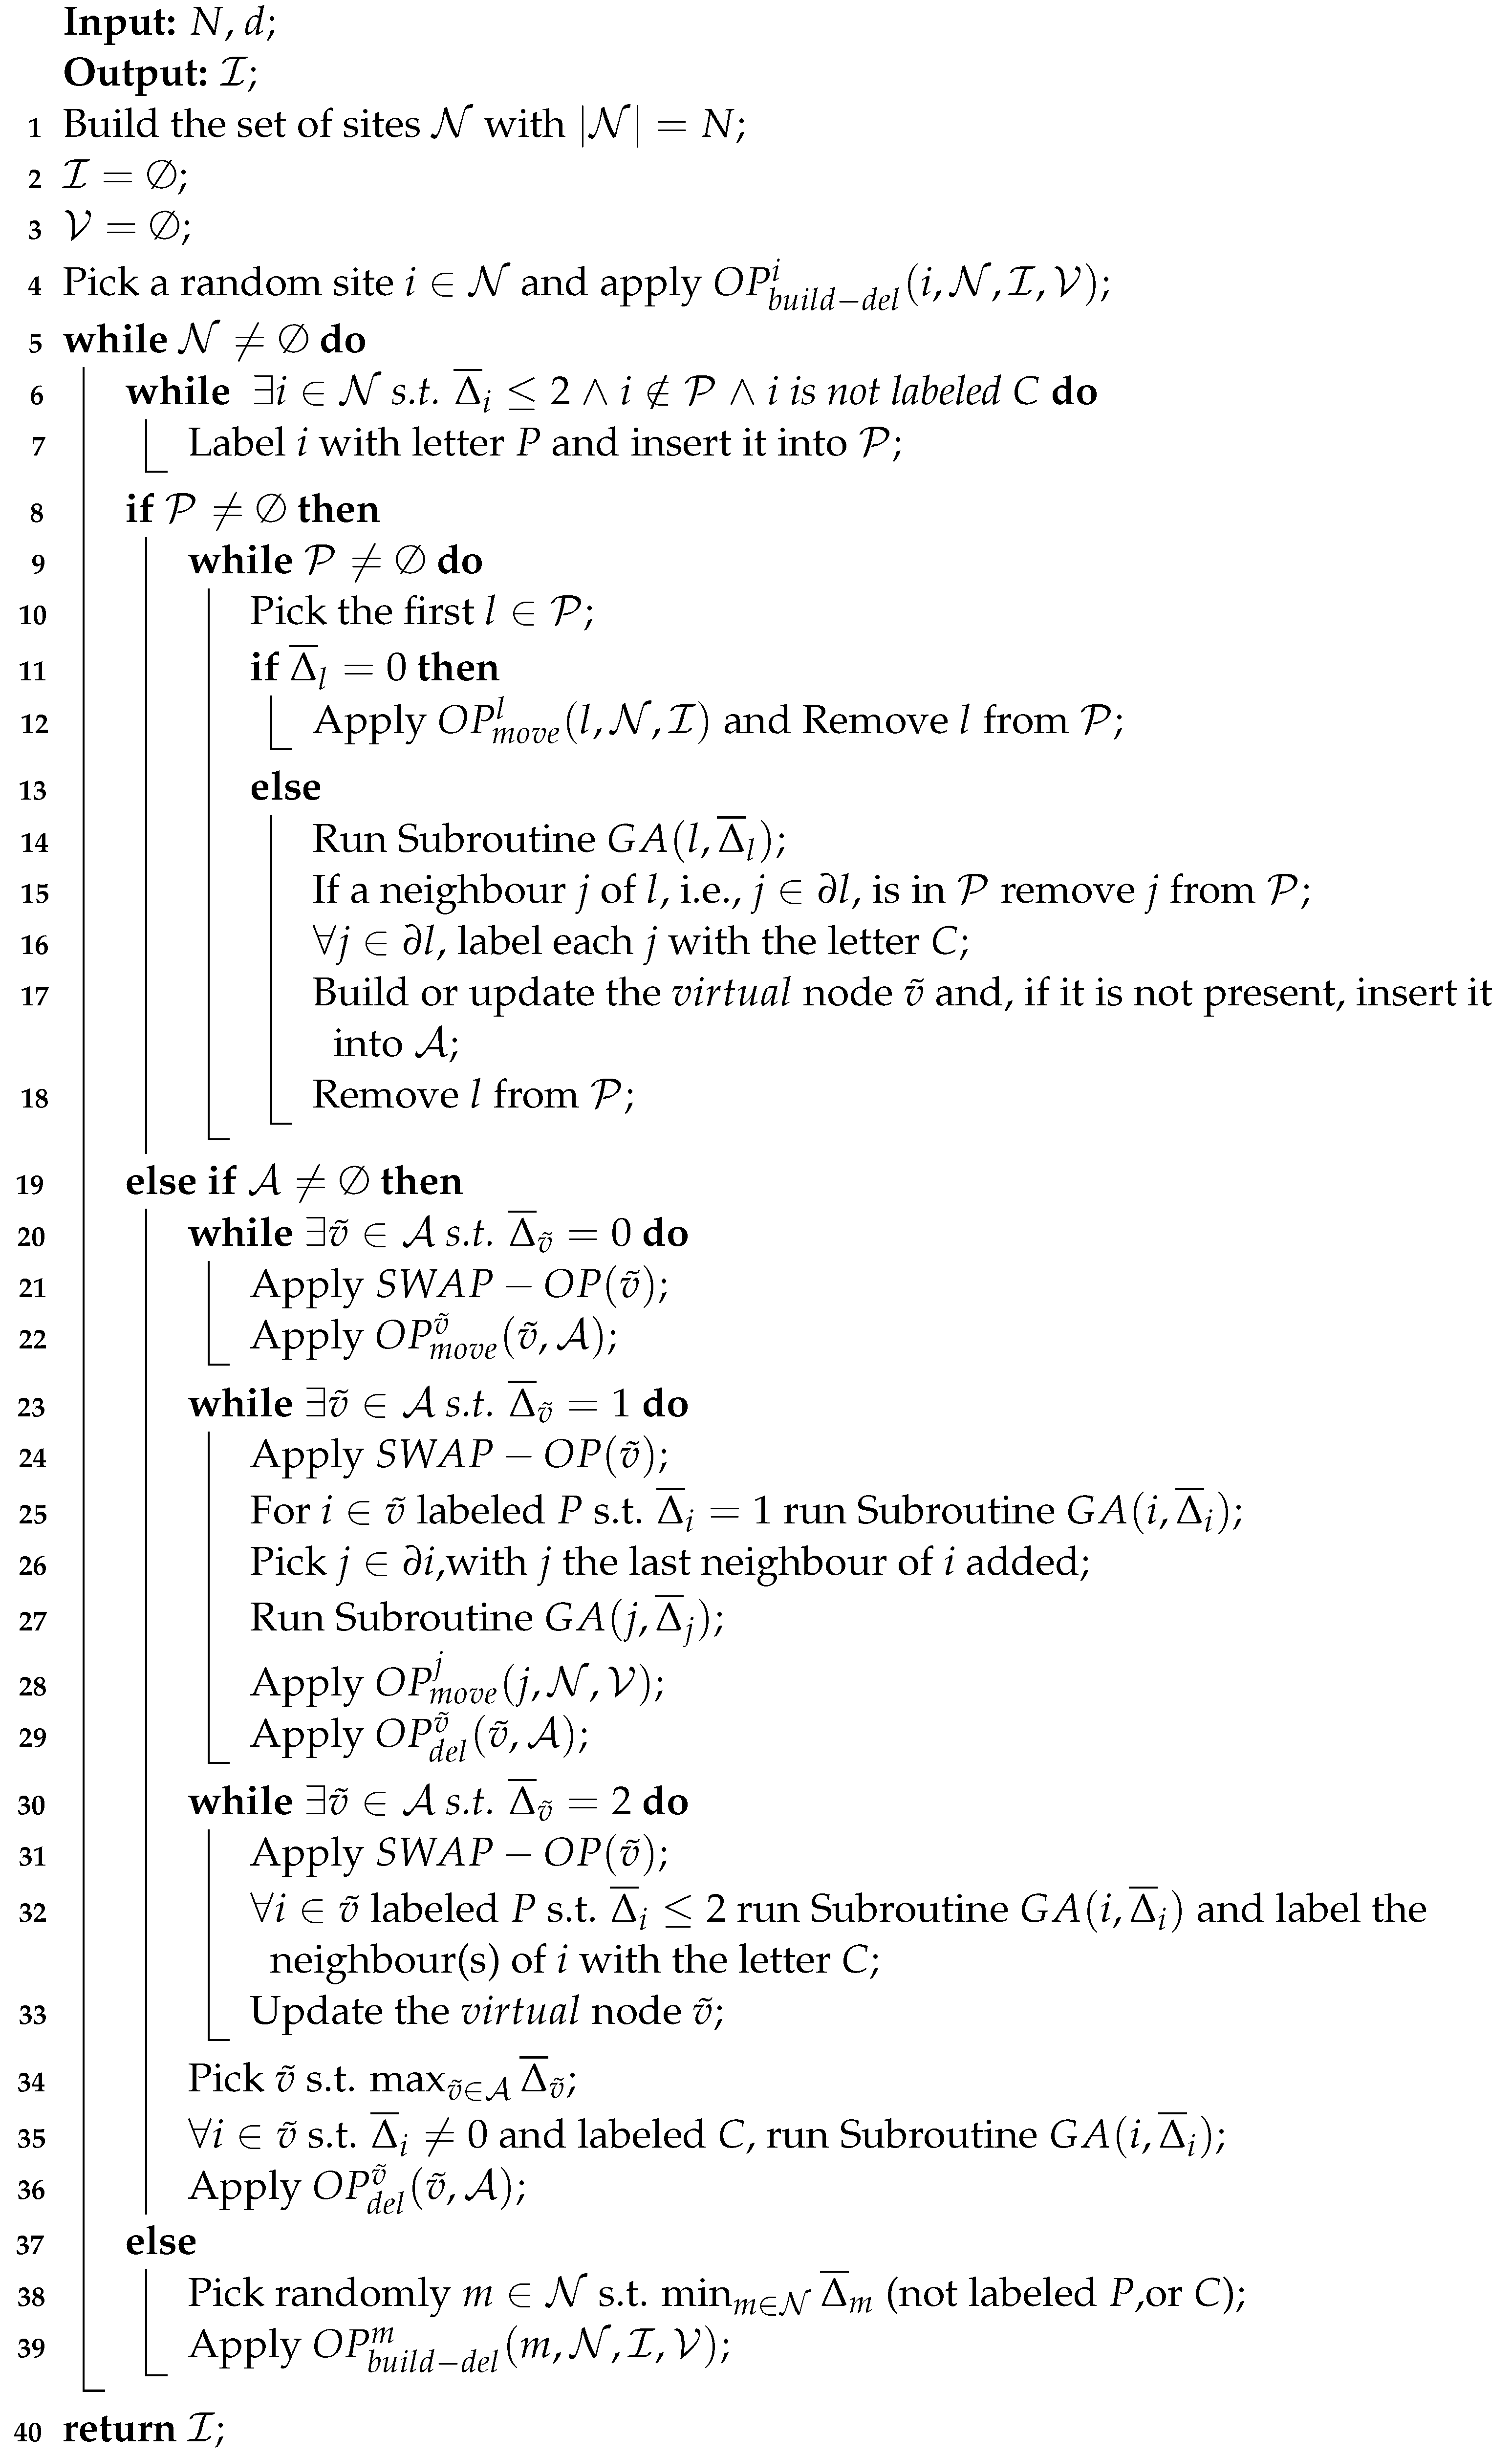 |
Until the set is empty, the algorithm builds virtual sites, which are set into .
Once the set is empty, the highest priority in being processed is placed on the virtual sites contained in . Again, we want the random connections outgoing from the virtual sites to reduce the antidegrees of the other existing virtual sites in in such a way that the probability of having virtual sites with antidegrees of becomes bigger. In order to have that, we list below the priority order that the algorithm follows for processing the virtual sites contained in :
- s.t. , the algorithm sequentially applies operation and the operation . (in the case that , the algorithm applies on the last added site the operation before it completes the absent connection for the site with . Then on the virtual site , it sequentially applies operations and ).
- If s.t. s.t , the algorithm chooses with the highest priority the site with . Then, it applies operation on , it runs the Subroutine with , and it labels each neighbor(s) of i with letter C.
- If s.t. ∧ s.t. , the algorithm chooses a site with the maximum , and it applies the with the maximum after having run the Subroutine on each such that .
- In the case that , the algorithm takes a site with a minimum , and it applies the operation .
The algorithm works until the following condition is true: . Then, it checks that all sites in are covered only by sites in , and it checks that no site in connects to any other site in .
The results obtained by the algorithm for different values of d, and different orders N, are presented in Table 3, Table 4 and Table 5. The confidence intervals of the asymptotic independent set ratio values, obtained using the extrapolation described in the previous section, are presented in Table 1. In other words, we performed simulations for each value of d by computing the sample mean and the standard error of the independence ratio for some values of N. Then, we used GLS methods in order to extrapolate the values of and build up its confidence interval.

Table 3.
The table shows the sample average and standard deviation values of the independent set ratio for random regular graphs of order N and degree .

Table 4.
The table shows the sample average and standard deviation values of the independent set ratio for random regular graphs of order N and degree .

Table 5.
The table shows the sample average and standard deviation values of the independent set ratio for random regular graphs of order N and degree .
From our analysis, we observed that, , our results, as far as we know, exceed the best theoretical lower bounds given by greedy algorithms. Those improvements were obtained because we allowed the virtual nodes to increase and decrease their antidegrees. In other words, this process transforms the random d-regular graph into a sparse random graph, wherein it is much easier making local rearrangements (our move) to enlarge the independent set. More precisely, the creation of virtual nodes that increase or decrease their antidegrees allows us to deal with a graph that is no longer d-regular but has average connectivity .
However, this improvement decreases as d becomes large, , and disappears when (see Figure 7, bottom panel). Indeed, the number of P labeled sites decreased during the graph-building process (see Figure 7, top panel), thus invalidating the creation of the virtual nodes that are at the core of our algorithm. This means that our algorithm for values of d, such that , will reach the same asymptotic independent set ratio values obtained by the algorithm in [21].
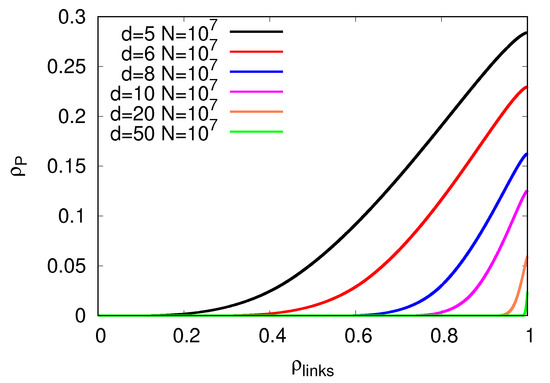
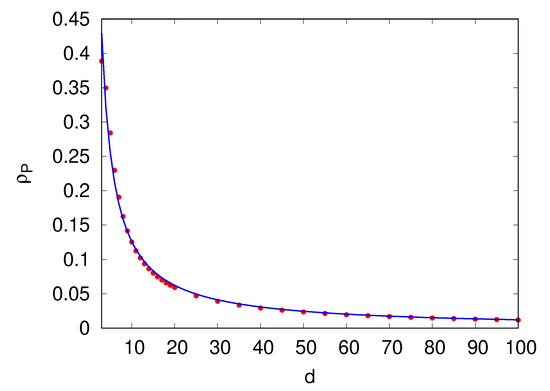
Figure 7.
The figure shows how the dynamics of the fraction of P sites in the graph-building process appear as a function of links inserted in (top panel), and the total fraction of P sites appears as a function of d (lower panel). The fraction of P sites decreases from to when d becomes large. As stated in the main text, this behavior shows that, for , our algorithm matches the one in [21].
In conclusion, for any fixed and small d, we have that the two algorithms are distinct, and our algorithm produces better results without increasing the computational complexity.
5. Conclusions
This manuscript presents a new local prioritized algorithm for finding a large independent set in a random d-regular graph at fixed connectivity. This algorithm makes a deferred decision in choosing which site must be set into the independent set or into the vertex cover set. This deferred strategy can be seen as a depth-first search delayed in time, without backtracking. It works, and it shows very interesting results.
For all , we conjecture new lower bounds for this problem. All the new bounds improve upon the best previous bounds. All of them have been obtained using extrapolation on the samples of random d-regular graphs of sizes up to . For random 3-regular graphs, our algorithm is able to reach, when , the asymptotic value presented in [26]. We recall that the algorithm in [26] cannot be used for any . However, we think that this approach can also provide conjectured lower bound for . Indeed, as shown in Figure 7, there is still space to use our algorithm for computing independent sets. Moreover, new strategies could be implemented for improving our conjectured bounds.
The improvements upon the best bounds are due to reducing the density of the graph, thereby introducing regions in which virtual sites replace multiple original nodes, and optimal labelings can be identified. The creation of virtual sites makes it possible to group together nodes of the graph to label each at a different instant with respect to their creation. Those blobs of nodes transform the random d-regular graphs into a sparse graph, where the searching of a large independent set is simpler.
Undoubtedly, more complex virtual nodes can be defined, and additional optimizations can be identified. This will be addressed in a future manuscript.
Author Contributions
Conceptualization, R.M. and S.K.; methodology, R.M. and S.K.; software, R.M.; validation, R.M. and S.K.; formal analysis, R.M. and S.K.; investigation, R.M. and S.K.; resources, R.M. and S.K.; data curation, R.M. and S.K.; writing—original draft preparation, R.M. and S.K.; writing—review and editing, R.M. and S.K.; visualization, R.M. and S.K.; supervision, R.M. and S.K.; project administration, R.M. and S.K.; All authors have read and agreed to the published version of the manuscript.
Funding
S.K. is supported by the Federman Cyber Security Center at the Hebrew University of Jerusalem. R.M. is supported by #NEXTGENERATIONEU (NGEU) and funded by the Ministry of University and Research (MUR), the National Recovery and Resilience Plan (NRRP), and the project MNESYS (PE0000006)—A multiscale integrated approach to the study of the nervous system in health and disease (DN. 1553 11.10.2022).
Data Availability Statement
The code of the algorithm can be released upon request.
Acknowledgments
R.M. would like to thank Nicolas Macris for a first reading of the manuscript and Endre Csóka for useful discussions.
Conflicts of Interest
The authors declare no conflict of interest.
References
- Cook, S. The P versus NP problem. In The Millennium Prize Problems; American Mathematical Society: Providence, RI, USA, 2006; pp. 87–104. [Google Scholar]
- Tarjan, R.E.; Trojanowski, A.E. Finding a maximum independent set. SIAM J. Comput. 1977, 6, 537–546. [Google Scholar] [CrossRef]
- Xiao, M.; Nagamochi, H. Exact algorithms for maximum independent set. Inf. Comput. 2017, 255, 126–146. [Google Scholar] [CrossRef]
- Mezard, M.; Montanari, A. Information, Physics, and Computation; Oxford University Press: Oxford, UK, 2009. [Google Scholar]
- Mohseni, M.; Eppens, D.; Strumpfer, J.; Marino, R.; Denchev, V.; Ho, A.K.; Isakov, S.V.; Boixo, S.; Ricci-Tersenghi, F.; Neven, H. Nonequilibrium Monte Carlo for unfreezing variables in hard combinatorial optimization. arXiv 2021, arXiv:2111.13628. [Google Scholar]
- Marino, R.; Parisi, G.; Ricci-Tersenghi, F. The backtracking survey propagation algorithm for solving random K-SAT problems. Nat. Commun. 2016, 7, 12996. [Google Scholar] [CrossRef] [PubMed]
- Marino, R.; Macris, N. Solving non-linear Kolmogorov equations in large dimensions by using deep learning: A numerical comparison of discretization schemes. J. Sci. Comput. 2023, 94, 8. [Google Scholar] [CrossRef]
- Marino, R. Learning from survey propagation: A neural network for MAX-E-3-SAT. Mach. Learn. Sci. Technol. 2021, 2, 035032. [Google Scholar] [CrossRef]
- Bomze, I.M.; Budinich, M.; Pardalos, P.M.; Pelillo, M. The maximum clique problem. In Handbook of Combinatorial Optimization; Springer: Berlin/Heidelberg, Germany, 1999; pp. 1–74. [Google Scholar]
- Karp, R.M. Reducibility among combinatorial problems. In Complexity of Computer Computations; Springer: Berlin/Heidelberg, Germany, 1972; pp. 85–103. [Google Scholar]
- Marino, R.; Kirkpatrick, S. Hard optimization problems have soft edges. Sci. Rep. 2023, 13, 3671. [Google Scholar] [CrossRef]
- Wein, A.S. Optimal Low-Degree Hardness of Maximum Independent Set. arXiv 2020, arXiv:2010.06563. [Google Scholar] [CrossRef]
- Gamarnik, D.; Sudan, M. Limits of local algorithms over sparse random graphs. In Proceedings of the 5th Conference on Innovations in Theoretical Computer Science, Princeton, NJ, USA, 12–14 January 2014; pp. 369–376. [Google Scholar]
- Rahman, M.; Virag, B. Local algorithms for independent sets are half-optimal. Ann. Probab. 2017, 45, 1543–1577. [Google Scholar] [CrossRef]
- Ding, J.; Sly, A.; Sun, N. Maximum independent sets on random regular graphs. Acta Math. 2016, 217, 263–340. [Google Scholar] [CrossRef]
- Bollobás, B. The independence ratio of regular graphs. Proc. Am. Math. Soc. 1981, 83, 433–436. [Google Scholar] [CrossRef]
- McKay, B. lndependent sets in regular graphs of high girth. Ars Comb. 1987, 23, 179–185. [Google Scholar]
- Balogh, J.; Kostochka, A.; Liu, X. Cubic graphs with small independence ratio. arXiv 2017, arXiv:1708.03996. [Google Scholar] [CrossRef] [PubMed]
- Barbier, J.; Krzakala, F.; Zdeborová, L.; Zhang, P. The hard-core model on random graphs revisited. In Proceedings of the ELC International Meeting on Inference, Computation, and Spin Glasses (ICSG2013), Sapporo, Japan, 28–30 July 2013; Journal of Physics: Conference Series. IOP Publishing: Bristol, UK, 2013; Volume 473, p. 012021. [Google Scholar]
- Harangi, V. Improved replica bounds for the independence ratio of random regular graphs. J. Stat. Phys. 2023, 190, 60. [Google Scholar] [CrossRef]
- Wormald, N.C. Differential equations for random processes and random graphs. Ann. Appl. Probab. 1995, 5, 1217–1235. [Google Scholar] [CrossRef]
- Shearer, J.B. A note on the independence number of triangle-free graphs. Discret. Math. 1983, 46, 83–87. [Google Scholar] [CrossRef]
- Wormald, N.C. Analysis of greedy algorithms on graphs with bounded degrees. Discret. Math. 2003, 273, 235–260. [Google Scholar] [CrossRef]
- Duckworth, W.; Zito, M. Large independent sets in random regular graphs. Theor. Comput. Sci. 2009, 410, 5236–5243. [Google Scholar] [CrossRef]
- Csóka, E.; Gerencsér, B.; Harangi, V.; Virág, B. Invariant Gaussian processes and independent sets on regular graphs of large girth. Random Struct. Algorithms 2015, 47, 284–303. [Google Scholar] [CrossRef]
- Csóka, E. Independent sets and cuts in large-girth regular graphs. arXiv 2016, arXiv:1602.02747. [Google Scholar]
- Angelini, M.C.; Ricci-Tersenghi, F. Monte Carlo algorithms are very effective in finding the largest independent set in sparse random graphs. Phys. Rev. E 2019, 100, 013302. [Google Scholar] [CrossRef] [PubMed]
- Hoppen, C.; Wormald, N. Local algorithms, regular graphs of large girth, and random regular graphs. Combinatorica 2018, 38, 619–664. [Google Scholar] [CrossRef]
- Bishop, C.M. Pattern Recognition and Machine Learning; Springer: Berlin/Heidelberg, Germany, 2006. [Google Scholar]
Disclaimer/Publisher’s Note: The statements, opinions and data contained in all publications are solely those of the individual author(s) and contributor(s) and not of MDPI and/or the editor(s). MDPI and/or the editor(s) disclaim responsibility for any injury to people or property resulting from any ideas, methods, instructions or products referred to in the content. |
© 2023 by the authors. Licensee MDPI, Basel, Switzerland. This article is an open access article distributed under the terms and conditions of the Creative Commons Attribution (CC BY) license (https://creativecommons.org/licenses/by/4.0/).