1. Introduction
Machine learning and deep learning models are used in various real-time domains such as industrial automation, design of design support systems for medical domains and multimedia analysis [
1,
2,
3,
4,
5]. Pandemics occur and lead to extensive morbidity and mortality worldwide. In December of 2019, a case of pneumonia of unknown origin was reported in Wuhan, China. From there, the epidemic of the coronavirus swiftly spread to other countries [
6,
7,
8,
9,
10], leading to the widespread outbreak of COVID-19 on the mainland. The severe acute respiratory syndrome coronavirus is causing a pandemic of coronavirus disease 2019 (COVID-19) all over the globe, and China is one of the countries affected (SARS-COV-2). China was the first country to have an outbreak of the disease. It was also the first country to respond with harsh measures, such as lockdowns and rules about wearing face masks. China was also one of the first countries to get the outbreak under control. The coronavirus (COVID-19) viruses have made their way to many parts of the world. This virus has a high rate of spread and is harmful to humans [
11].
Italy was the first European country to experience a significant COVID-19 outbreak, with the detection of the first case on the 21 February 2020 in the province of Lodi in the region of Lombardy. While each province in Italy had confirmed cases of the virus by mid-March 2020, the diffusion of the outbreak in the country was very heterogeneous. The majority of cases were concentrated in Lombardy in the north of the country [
12,
13].
The World Health Organization (WHO) called the COVID-19 outbreak the sixth public health emergency of international concern (PHEIC) on 30 January 2020. On 11 March 2020, the WHO said that COVID-19 had become a pandemic [
14]. This year’s new coronavirus killed 85,522 people on 9 April 2020, and the case fatality rate (CFR) was 5.95%. COVID-19 has been classified by the WHO as having a very high global risk. Because lockdowns have been implemented in so many areas, the pandemic scenario has impacted virtually every aspect of society, including the economy [
15,
16]. Coronavirus disease (COVID-19) is a pandemic and an issue that exists in more than 200 nations throughout the world. Many countries have been badly affected by COVID-19 and lots of people have died in the last two years [
16]. The high volume of international travel was the primary factor in the disease’s dissemination around the globe; the presence of local contagious links played a secondary role. For example, in 2018, more than 4 billion individuals, or almost six out of every ten persons on the planet, traveled worldwide by means of commercial airplanes [
17].
In response to the unusual spread of the illness, there have been concerted attempts on a worldwide scale to collaborate on combating the pandemic. The creation of a vaccine is one of the potential strategies that may be used to combat the COVID-19 pandemic. A chemical that stimulates the development of adaptive immunity in the body and hence assists in the body’s fight against various illnesses and diseases is known as a vaccine [
17,
18,
19]. Many organizations have developed vaccines to avoid and overcome this situation. People have to vaccinate themselves to reduce the threat of this malignant disease [
20]. For this, they need some opinion about different types of vaccines available in the market to select the most suitable vaccine for themselves. Social media platforms such as Twitter have proved to be a valuable resource that provides instantaneous access for information tracking and evaluation. In pandemic times, Twitter has been used in various studies as a source of information, e.g., back in 2009 during the HINI outbreak [
21]. Twitter has been widely used in various studies for the identification of user’s concerns, misinformation spread and sentiment analysis [
22]. Twitter users have expressed their opinions regarding COVID-19 vaccination. Only a few research studies have analyzed public sentiments towards COVID-19 vaccination. This research will help them to select their desired vaccines from Sinovac, Pfizer, Moderna, AstraZeneca and Sinopharm. To the best of our knowledge, in previous studies, researchers have tested two to three vaccinations and found accuracy. This research collects and analyzes opinions on five major vaccinations and identifies the most effective machine learning (ML) algorithm to predict the sentiment analysis about five different types of COVID-19 vaccines. In addition to this, the research aims to analyze the sentiments of people towards COVID-19 vaccination on the basis of data obtained from social media. The proposed research will address the following research questions:
What are people’s sentiments toward COVID-19 vaccination on the social media Twitter platform?
What is the most effective machine learning algorithm to predict the sentiment analysis about five different types of COVID-19 vaccines?
Supervised intelligence enables complex and larger data to be processed and analyzed along with the desired results being achieved. Machine learning offers a novel approach to bringing together the methodologies of fundamental research and technical analysis. We aim to find better results for the sentiment classification of COVID-19 vaccination by applying ML models. The key contributions of this research are as follows:
This research presents a methodology for sentiment analysis of the perceptions and perspectives of public tweets related to COVID-19 vaccination. In this regard, a global dataset has been created by extracting tweets related to people’s sentiments towards COVID-19 vaccination.
The TextBlob approach has been applied to determine the polarity of sentiments into positive, negative and neutral. Different supervised machine learning models were applied to the annotated dataset in order to obtain optimal performance.
In related state-of-the-art research, the researchers have tested two to three vaccinations for sentiment classification. This research will collect opinions on five vaccinations including Sinovac, Pfizer, Moderna, AstraZeneca and Sinopharm and aims to discover which vaccine produces the best results. The proposed research is validated by comparing the performance with the state-of-the-art approaches.
The rest of the article is organized into five sections.
Section 2 presents a comprehensive review of the related work. The proposed methodology is discussed in
Section 3.
Section 4 provides a description of the datasets used for experiments, the metrics used for evaluation and a discussion of the results.
Section 5 concludes the research and provides directions for future research.
2. Related Work
This section presents a review of the recent literature on the COVID-19 pandemic which emphasizes the importance of effective vaccination for the whole population.
Machine learning and neural networks have applications in difference domains such as aerial image classification [
23,
24,
25,
26], face recognition [
27], Internet of Things [
28,
29], healthcare [
30,
31,
32] and sentiment analysis, etc. Manguri et al. [
33] stated that the rise of social data on the internet has accelerated. This leads to study in order to obtain access to the data and information for a variety of academic and commercial purposes. The global COVID-19 sickness has now expanded internationally, and social data on the web includes numerous real-life incidents that happened in everyday life. Many people, including media outlets and government institutions, are disseminating the newest information and viewpoints on the coronavirus. The Twitter data was crawled from Twitter social media through a python programming language, and sentiment analysis was performed using the text blob library in python. The evaluation results of sentiment analysis are shown as a graphical representation based on the data. The information originated from Twitter, where it was discovered via the use of a search for two distinct hashtag keywords: (COVID-19 and coronavirus). In another study [
34], the authors argued that a global infrastructure to enable both normal and pandemic/epidemic adult vaccination is urgently needed because of the global connections. Since the number of older persons is continually increasing, the need for a framework to propose vaccinations and establish strong platforms to distribute them was obvious. For older individuals, their families, communities, and nations, adult vaccination as a policy has the potential to protect and improve medical, social, and economic results. COVID-19 vaccinations will soon be available, but it is important to remember that currently, a number of vaccines are available that can keep adults healthy.
Meena et al. [
35] pointed out that social media talks about healthcare were an excellent starting point for assessing people’s feelings. COVID-19 vaccination was the primary hope of practically every human being on Earth. Many people took to Twitter to express their feelings in response to Russia’s first vaccination announcement. Data from tweets were analyzed for the emotions and psychology of the people and the issue of interest they were discussing. The social emotions were disclosed and displayed using computational approaches and algorithms, such as machine-learned and LDA. Sentiment analysis is a technique for recognizing and categorizing views or feelings represented in the source material. A vast amount of data that is rich in sentiment is generated by various types of social media, such as tweets, status updates, blog posts, and so on. The application of sentiment analysis to this user-generated data may be highly helpful in identifying the perspective of the general population. Because of the existence of slang phrases and misspellings, Twitter sentiment analysis is more complex than conventional sentiment analysis. On Twitter, the maximum number of characters permitted is 140. According to authors, there are two methodologies that are employed for interpreting the sentiment gleaned from the text. These are the knowledge-based approach. Alliheibi [
36], mentioned that individuals in Saudi Arabia who had received the COVID-19 vaccination were studied via their tweets. People’s replies were classified using computational lexical-semantic approaches. The findings show that the majority of Saudi Arabians have an unfavorable view of the government’s COVID-19 immunization take-up campaign. According to the findings, the use of data mining applications in government institutions and departments can identify trends that could have an adverse impact on policies and practices, as well as help government institutions make appropriate decisions and adopt reliable and workable policies and procedures.
Yousefinaghani et al. [
37] pointed out that COVID-19 vaccinations are the subject of an estimated 4.5 million tweets being analyzed in their investigation. It is possible that Twitter, as it was in this study, may be an effective tool for promoting public health by increasing vaccination uptake and decreasing vaccine resistance. Public health officials might benefit from better knowing vaccine feelings and opinions in order to amplify good postings with supportive language and debunk negative ones with confrontational language that spreads misinformation. Public health organizations may also be able to use Twitter and other media to raise positive messaging and actively minimize negative and opposing messages.
Ezhilan et al. [
38] performed a study using a convolutional neural network and a recurrent neural network built for sentiment analysis based on text data related to Twitter data sentiment analysis. CNN and RNN sentiment classifiers performed better than other sentiment classifiers, such as SVM, logistic regression, and Nave Bayes, in terms of accuracy and recall, according to the empirical assessment in this study. Also shown in the study was the performance of general-purpose emotion analyzers such as text blob and Vader. Understanding public opinions regarding coronavirus and COVID-19 helps to detect the rise in dread sentiment and unpleasant feelings, which were important for developing much-needed remedies to stop the rapid spread of the pandemic. The use of exploratory and descriptive text analytics and data visualization methodologies helps to uncover the most basic of ideas. Andrzejczak-Grzadko et al. [
39] observed that the Vaccine side effects are widespread, although individuals respond to immunizations in various ways. Manufacturers give a list of their goods’ adverse effects. Adverse responses indicate that immunizations are effective and that the immune system is reacting. It compares the AstraZeneca and Pfizer vaccines’ side effects. These responses were more prevalent after the first dosage of the AstraZeneca vaccination than after the first and second doses of the Pfizer vaccine, although they were less common after the Pfizer formulation. The survey was made available on the internet. It was performed on patients who had been immunized with Pfizer or AstraZeneca vaccines. The participants were questioned about adverse effects such as injection site discomfort, arm pain, muscle pain, headache, fever, chills, and exhaustion after receiving the first and second doses of the vaccinations. A total of 705 persons responded to the survey. Pfizer had vaccinated 196 of them, whereas AstraZeneca had immunized 509. A total of 96.5% of those who received the first dose of the AstraZeneca vaccine had at least one post-vaccination response. All of the adverse effects mentioned in the survey were reported by 17.1% of respondents. Vaccine responses were recorded by 93.9% of those who received the first Pfizer dosage, while just 2% of those who received the second dose suffered all of the adverse events listed in the survey. Most of the subjects had post-vaccinal reactions after the second dose of the Pfizer vaccine: 54.8% had more adverse reactions, and 15.8% had fewer adverse reactions than after the first dose, and 29.4% had the same side effects after the first and second doses of the Pfizer vaccine.
Saeed et al. [
40] stated that some people were reluctant to get their children vaccinated because they were afraid of the unknown. The first and second post-vaccination side effects of the Sinopharm COVID-19 vaccine were shown to be common and moderate, predictable, non-serious, and not life-threatening. For the first time, the Sinopharm vaccine’s adverse effects have been evaluated among an age group, and the findings might help lessen public vaccination skepticism. Dubey [
41] performed a study to explain. In India, the campaign to prevent COVID-19 began on 16 January 2021. Oxford-Covishield AstraZeneca’s and Bharat Biotech’s Covaxin were two vaccines employed in this campaign. This initiative has already surpassed 600,000 people in its first four days, and the government has declared that it would be increased in the following days to secure residents’ immunity. However, there is still a segment of the population that is skeptical about the COVID-19 vaccine. It was carried out to examine the emotions expressed in India’s tweets about these two vaccinations. While the majority of the public has favorable feelings about these vaccinations, the study indicates that there are also negative feelings about them, which are linked to emotions such as fear and wrath. Dumre et al. [
42] performed a statistical and sentiment analysis and observed that people in India have begun developing opinions towards them as a result of the impending availability of a vaccine against COVID-19. An investigation of the attitudes and viewpoints of individuals with respect to vaccinations. Out of 200 participants, 32 doctors and 35 participants were vaccinated. The main objectives were to analyze the response to the survey and draw conclusions with the help of data analysis techniques and performed sentiment analysis on participants’ responses to identify what stops people from getting vaccinated.
Cotfas et al. [
43] described that machine learning-based posture detection was used to analyze the one-month time between the initial announcement of a coronavirus vaccine and the first real immunization procedure outside of the limited clinical trials. The best classifier was selected after a thorough evaluation of the performance of a number of different conventional and deep learning methods. The suggested method was able to classify the tweets into three primary categories, namely in favor, against, and neutral, with an accuracy of 78.94%. The authors in [
44] analyzed that the tweets were categorized into four different emotions based on their content: fear, sadness, rage, and joy. A pleasant environment was produced in the healthcare authorities by using phrases such as “thank you”, “well”, and “good” instead of terms that instill dread in the minds of those who hear them. In light of these findings, local governments have been pushed to impose fact-checkers on social media to combat misleading propaganda. There has been a lack of research on how to verify and categorize tweets, which has led to a rise in the spread of false information. As a result, the authors used Bert, a unique deep-learning model, to obtain better classification accuracy in comparison to standard models of ML. Bert’s 89% accuracy outperformed other models including LR, SVM, and LSTM, according to the results. The research results helped to clarify public opinion on pandemics and provided a guideline to medical authorities, public, and private sector employees to overcome unnecessary concern during pandemics.
3. Research Methodology
This research presents a framework for sentiment analysis of COVID-19 vaccines. We have used python as a programming language and several libraries for text mining that will be explained.
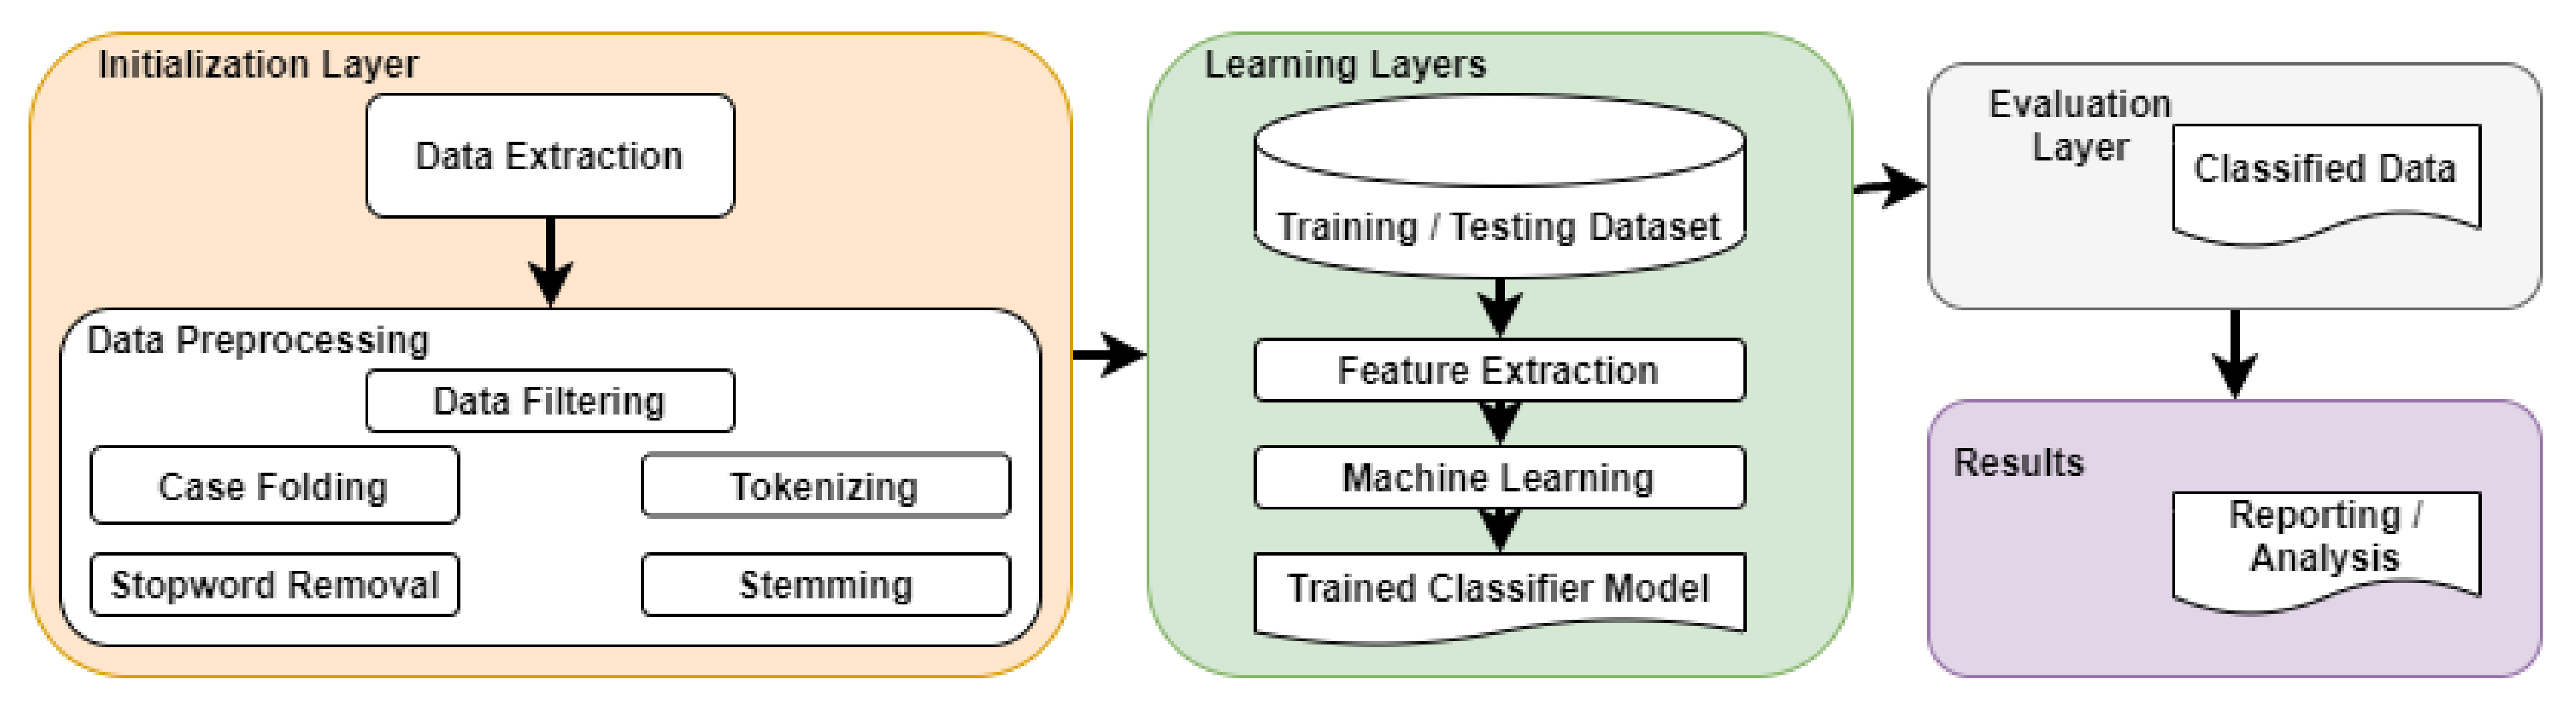
Figure 1 demonstrates the steps of the proposed methodology framework for sentiment analysis organized in four multiple layers. In the first step, data crawling and pre-processing are performed. The second layer is the learning layer where the pre-processing data will be spilt into training (70% data) and test (30% data) subsets. The training test ratio is chosen in accordance with state-of-the-art research. Empirical studies show that the best results are obtained if we use 20–30% of the data for testing, and the remaining 70–80% of the data for training [
17,
45]. The training will be used to train five different ML models namely Random Forest (RF), Naive Bayes (NB), Decision Tree (DT), Logistic Regression (LR) and Support Vector Machine (SVM). Again, the run-time behavior of five trained models using model-based testing techniques will be used to check the model’s predictions. The third layer is the evaluation layer, the performance of models will be compared on the basis of the evaluation metrics. The task of sentiment classification can usually be seen as a two-class classification (positive and negative). In this research, we add one class namely Neutral, to get the Twitter sentiment. This type of work is essentially a matter of text classification. The fourth layer is the result layer, it presents an analysis and discussion of the results.
3.1. Data Collection
This study performed sentiment analysis for COVID-19 vaccination. For this purpose, the dataset contains tweets related to the COVID-19 vaccination. To extract the tweets from Twitter with specific keywords, such as COVID-19 vaccine, corona Vaccine, COVID-19 vaccination, and corona vaccination. For this research, we have extracted tweets from tweeter using developer account access keys and Python popular library tweepy. We have searched Twitter using keyword search. Hence, we grabbed about 25,004 tweets containing our search keywords. Then pandas library was used to store the tweets in a data frame and then in a CSV file for further manipulation. In this study, AstraZeneca, Pfizer, Sinovac and Sinopharm employed 5001, 5001, 5001, 5001 and 5000 tweets, respectively.
3.2. Data Pre-Processing
Data pre-processing is applied to pre-process the text when building an ML-based system based on tweet data. Text pre-processing includes the following steps: The text shown before and after applying some of the pre-processing steps is shown in
Table 1.
Case folding is the removal of the case-sensitive text by changing the text to upper or lower case. In this study, the lowercase text was applied.
Dataset filtering/document filtering removes special characters, mentions, links, URLs, hashtags, single characters, non-ASCII characters, punctuation, number and whitespace.
Tokenizing means splitting the text into words. The list of tokens is used for further processing.
Stop Word removal indicates that any words that are considered to be irrelevant or possibly irrelevant are removed.
Stemming means converting words into prevailing words.
3.3. Feature Selection/Extraction
After, the pre-processing stage, the data was processed to select the feature sets. For feature selection, TextBlob, a well-known lexicon-based approach for performing natural language processing (NLP) tasks on the raw text was used. TextBlob is a python package that allows you to manipulate text input using a programming interface. By using TextBlob, one can analyze sentiments in text, create part of speech (pos) tags, extract noun phrases, translate, classify and more. TextBlob package comes with different in-built functions that support the task of language processing. It works for many different languages such as Arabic, Spanish, English, etc. It works in conjunction with NLTK [
11].
3.4. Machine Learning Algorithms
Machine learning (ML) is a popular use of artificial intelligence since it automates the system and allows it to learn and improve from diverse experiences without being programmed. Computer programs can teach how to learn by giving them access to data and allowing them to utilize it for learning in ML. The learning process in ML begins with seeing the data through examples or instructions that humans offer; these observations enable ML to look for patterns in order to make the best predictions. Five different ML models were used to train the classifier and evaluate classification performance using the test dataset. These are discussed below.
3.4.1. Random Forest
The RF model is an ensemble model that generates high-precision predictions by combining the results obtained from several sub-trees.The supervised ML method known as RF may be used for both classification and regression analysis. The term “forest” refers to a collection of independent Decision Trees that are combined in order to reduce the amount of variance and provide more accurate data forecasts. L. Breiman [
46,
47] created the random forest algorithm in 2001, and it has been shown to be a very effective tool for classification and regression analysis across a variety of domains. The approach, which combines the predictions from a number of different randomized Decision Trees and then takes the average of those forecasts, has been shown to work well in circumstances in which the number of variables is more than the number of observations. In addition to this, it can be adapted to a wide range of ad hoc learning challenges and it may provide metrics of changing importance, both of which make it suited for use with large-scale problems [
47]. An RF can be represented as:
where
represent the Decision Trees in RF and
n denotes the number of trees.
3.4.2. Naive Bayes
The Bayes Theorem’s premise of class conditional independence is used in the NB classification technique. This indicates that the existence of one characteristic in the likelihood of a certain event has no bearing on the presence of another, and each predictor has an equal impact on the outcome. Multinomial NB, Bernoulli NB, and Gaussian NB are the three kinds of NB classifiers. Text categorization, spam detection, and recommendation systems are all applications of this technology. Classifiers are programs that give a class to an object or case based on the values of attributes used to characterize this item or case from a pre-defined list. To do so, NB classifiers employ a probabilistic method, in which they attempt to predict the outcome [
48].
3.4.3. Decision Tree
DTs are a technique for non-parametric supervised learning that may be used for classification and regression. DT is a model for ML that may be used for the problem-solving process of regression as well as classification. The purpose of this project is to build a model that can accurately forecast the value of a target variable by gleaning fundamental decision rules from the features of the data. A tree may be thought of as a piecewise constant’s approximation [
49]. Until the splits become atomic, the model employs the binary technique to split the dataset into
n number of subsets. When a data subset cannot be further split, it is said to be atomic. A DT with multiple branches of varying sizes is used in conjunction with partitioning the dataset into an incremental method of construction. The DT was employed in this investigation with a max depth hyper-parameter to minimize complexity and overcome model over-fitting [
17].
3.4.4. Logistic Regression
Logistic Regression is a statistical approach to data analysis in which one or more variables are utilized to determine the outcome. When the target variable is categorical, the optimum learning model to utilize is LR, which is the regression model that was used to estimate the likelihood of class members. Linear Regression uses a logistic function to estimate probabilities for the association between the categorical dependent variable and one or more independent variables [
50]. Logical regression is used whenever the dependent variables are categorical, such as “true” and “false” or “yes” and “no”, rather than continuous, as in the case of Linear Regression, which is employed if the dependent variables are continuous. Although both regression models seek to identify correlations between data inputs, logistic regression is often used when dealing with binary classification challenges such as spam detection since it is more effective at handling these problems. Logistic Regression is a technique that may be used to solve a classification issue. It generates a binomial outcome by stating, in terms of 0 and 1, the probability of an event happening or not occurring, taking into the process.
The prediction of whether a tumor is malignant or benign, for example, or if an Email is spam or not, are both instances of the binomial results that may be obtained by Logistic Regression. There can also be a multinomial result of Logistic Regression, such as predicting the favorite cuisine: Chinese, Italian, Mexican and others. There can also be ordinal outcomes, such as product ratings ranging from 1 to 5, and so on. As a result, Logistic Regression is concerned with the categorical prediction of the target variable. Whereas Linear Regression, on the other hand, is concerned with the prediction of values of continuous variables, such as real estate prices over a three-year period [
50].
The values for the S-shaped curve and the variable v of the LR ranges from to for actual numbers. To boost the performance of LR, the hyperparameter “liblinear” was utilized in this study. The hyperparameter `multi-class’ is set as `multinomial’ considering its effectiveness for binary classification problems.
3.4.5. Support Vector Machine
A support vector machine(SVM), which was created by Vladimir Vapnik, is a supervised learning model that can be used to both classify and regress data [
51]. On the other hand, the most popular use for it is in the realm of classification problems; in this context, it is used to generate a hyperplane on which the distance between two classes of data points is maximized. The decision boundary is a hyperplane that divides the different categories of data points that are located on each side of the plane (e.g., oranges vs. apples) [
51]. SVMs are capable of dealing with problems relating to both classification and regression. This method requires that the hyperplane, which acts as the decision boundary, be defined. A decision plane is necessary whenever there is a need to divide a set of things that belong to different categories. The items may or may not be separated linearly [
51].
3.5. Label Prediction
All datasets’ tweet data was labeled. The model was chosen in the previous stage was then used to predict the label.
4. Results and Discussion
This section presents the accuracy results of sentiment analysis carried out using five distinct methods applied to two distinct datasets, with the second dataset being further subdivided into five distinct vaccination datasets. The accuracy, precision, recall, F1 score, and support measurement are derived from the Random Forest, Naive Bayes, Decision Tree, Logistic Regression, and Support Vector Machine (SVM).
4.1. Description of Datasets
We have used two datasets for this research, Dataset 1 [
52]: COVID-19 Vaccine Tweets with Sentiment Annotation (CVSA) and Dataset 2: COVID-19 vaccines related user’s response crawled from Twitter platform to analyze the opinions about vaccines. Dataset 2 is further divided according to five known vaccine datasets, i.e., AstraZeneca, Pfizer, Sinovac, Moderna and Sinopharm, respectively. CVSA has 6000 rows and 3 columns (Tweets id, label, Tweets text). The Sinovac, Pfizer, Moderna, AstraZeneca and the Sinopharm datasets have 5001 rows and 5 columns, respectively (Srno, Datetime, Tweet Id, Text, Username).
4.2. Evaluation Metrics
This section explores the evaluation metrics utilized used for the quantitative evaluation of the proposed research. The metrics used for evaluation of the proposed research are:
- I.
Confusion matrix: The confusion matrix is often used in ML to analyze or show how models behave in supervised classification contexts [
53,
54]. It is a square matrix with rows representing the actual class of the examples and columns representing their anticipated class. The confusion matrix defined a comparison between actual and predicted values. The confusion matrix is an N × N matrix, where N is the number of classes or outputs. For two classes, we obtain a 2 × 2 matrix. Whereas for three classes or outputs, we obtain a 3 × 3 confusion matrix. The rows indicate the actual class of the instances. The confusion matrix has four terms to understand: True Positive (Tp), False Positive (Fp), True Negative (Tn), and False Negative (Fn). The datasets used in this research have three outputs or classes, Positive, Neutral, and Negative. In the multi-class classification problem, we won’t get Tp, Tn, Fp, and Fn values directly as in the binary classification problem. We need to calculate for each class.
This matrix includes all of the raw information that was created by a classification model when it was applied to a specific data set. This information pertains to the predictions that were produced. It is standard practice to use a testing data set that was not used during the learning phase of a model in order to assess the correctness of the model’s ability to generalize its findings. This is performed to see if the model was able to generalize its findings. A confusion matrix may provide the basis for the creation of a great number of artificial, one-dimensional performance metrics. Precision, recall and the F-score, etc. are the performance indicators that can be computed from the confusion matrix. In association with a 2 × 2 cost matrix, a confusion matrix can also be used to compute cost-sensitive performance indicators in cases when different types of errors are not assumed to be equal. The selection of the optimal performance indicator directly relates to the objectives of the learning problem. The confusion matrix is shown in
Table 2.
- II.
Recognition Accuracy (ACC): The classification accuracy (ACC) is the most generally used statistic for evaluating classification performance. It is defined as the total number of instances (TWEETS) correctly classified divided by the number of examples (TWEETS) in the dataset under consideration. It can be stated numerically as:
- III.
Recall: Recall is also used for performance measurement. Recall can be defined as the ratio between tweets classified correctly to the total number of tweets available in the database. Recall in the formula form can be written as:
- IV.
Precision: It is also known as positive predictive value (PPV), precision is widely used for performance measurement purposes. Precision can be defined as the ratio between tweets classified correctly to the total number of tweets classified. Precision in the formula form can be written as:
- V.
F-measure/F1-Score: The F-score is the harmonic mean of recall and accuracy; a higher value implies better predicting ability. System performance cannot be assessed just on the basis of accuracy or recall. The following formula may be used to determine the F-score:
4.3. Results for Dataset 1: COVID-19 Vaccine Tweets with Sentiment Annotation
This section presents a detailed analysis of the results obtained for dataset 1 by applying five ML algorithms. The results are demonstrated using a confusion matrix and bar graphs of different ML classifiers.
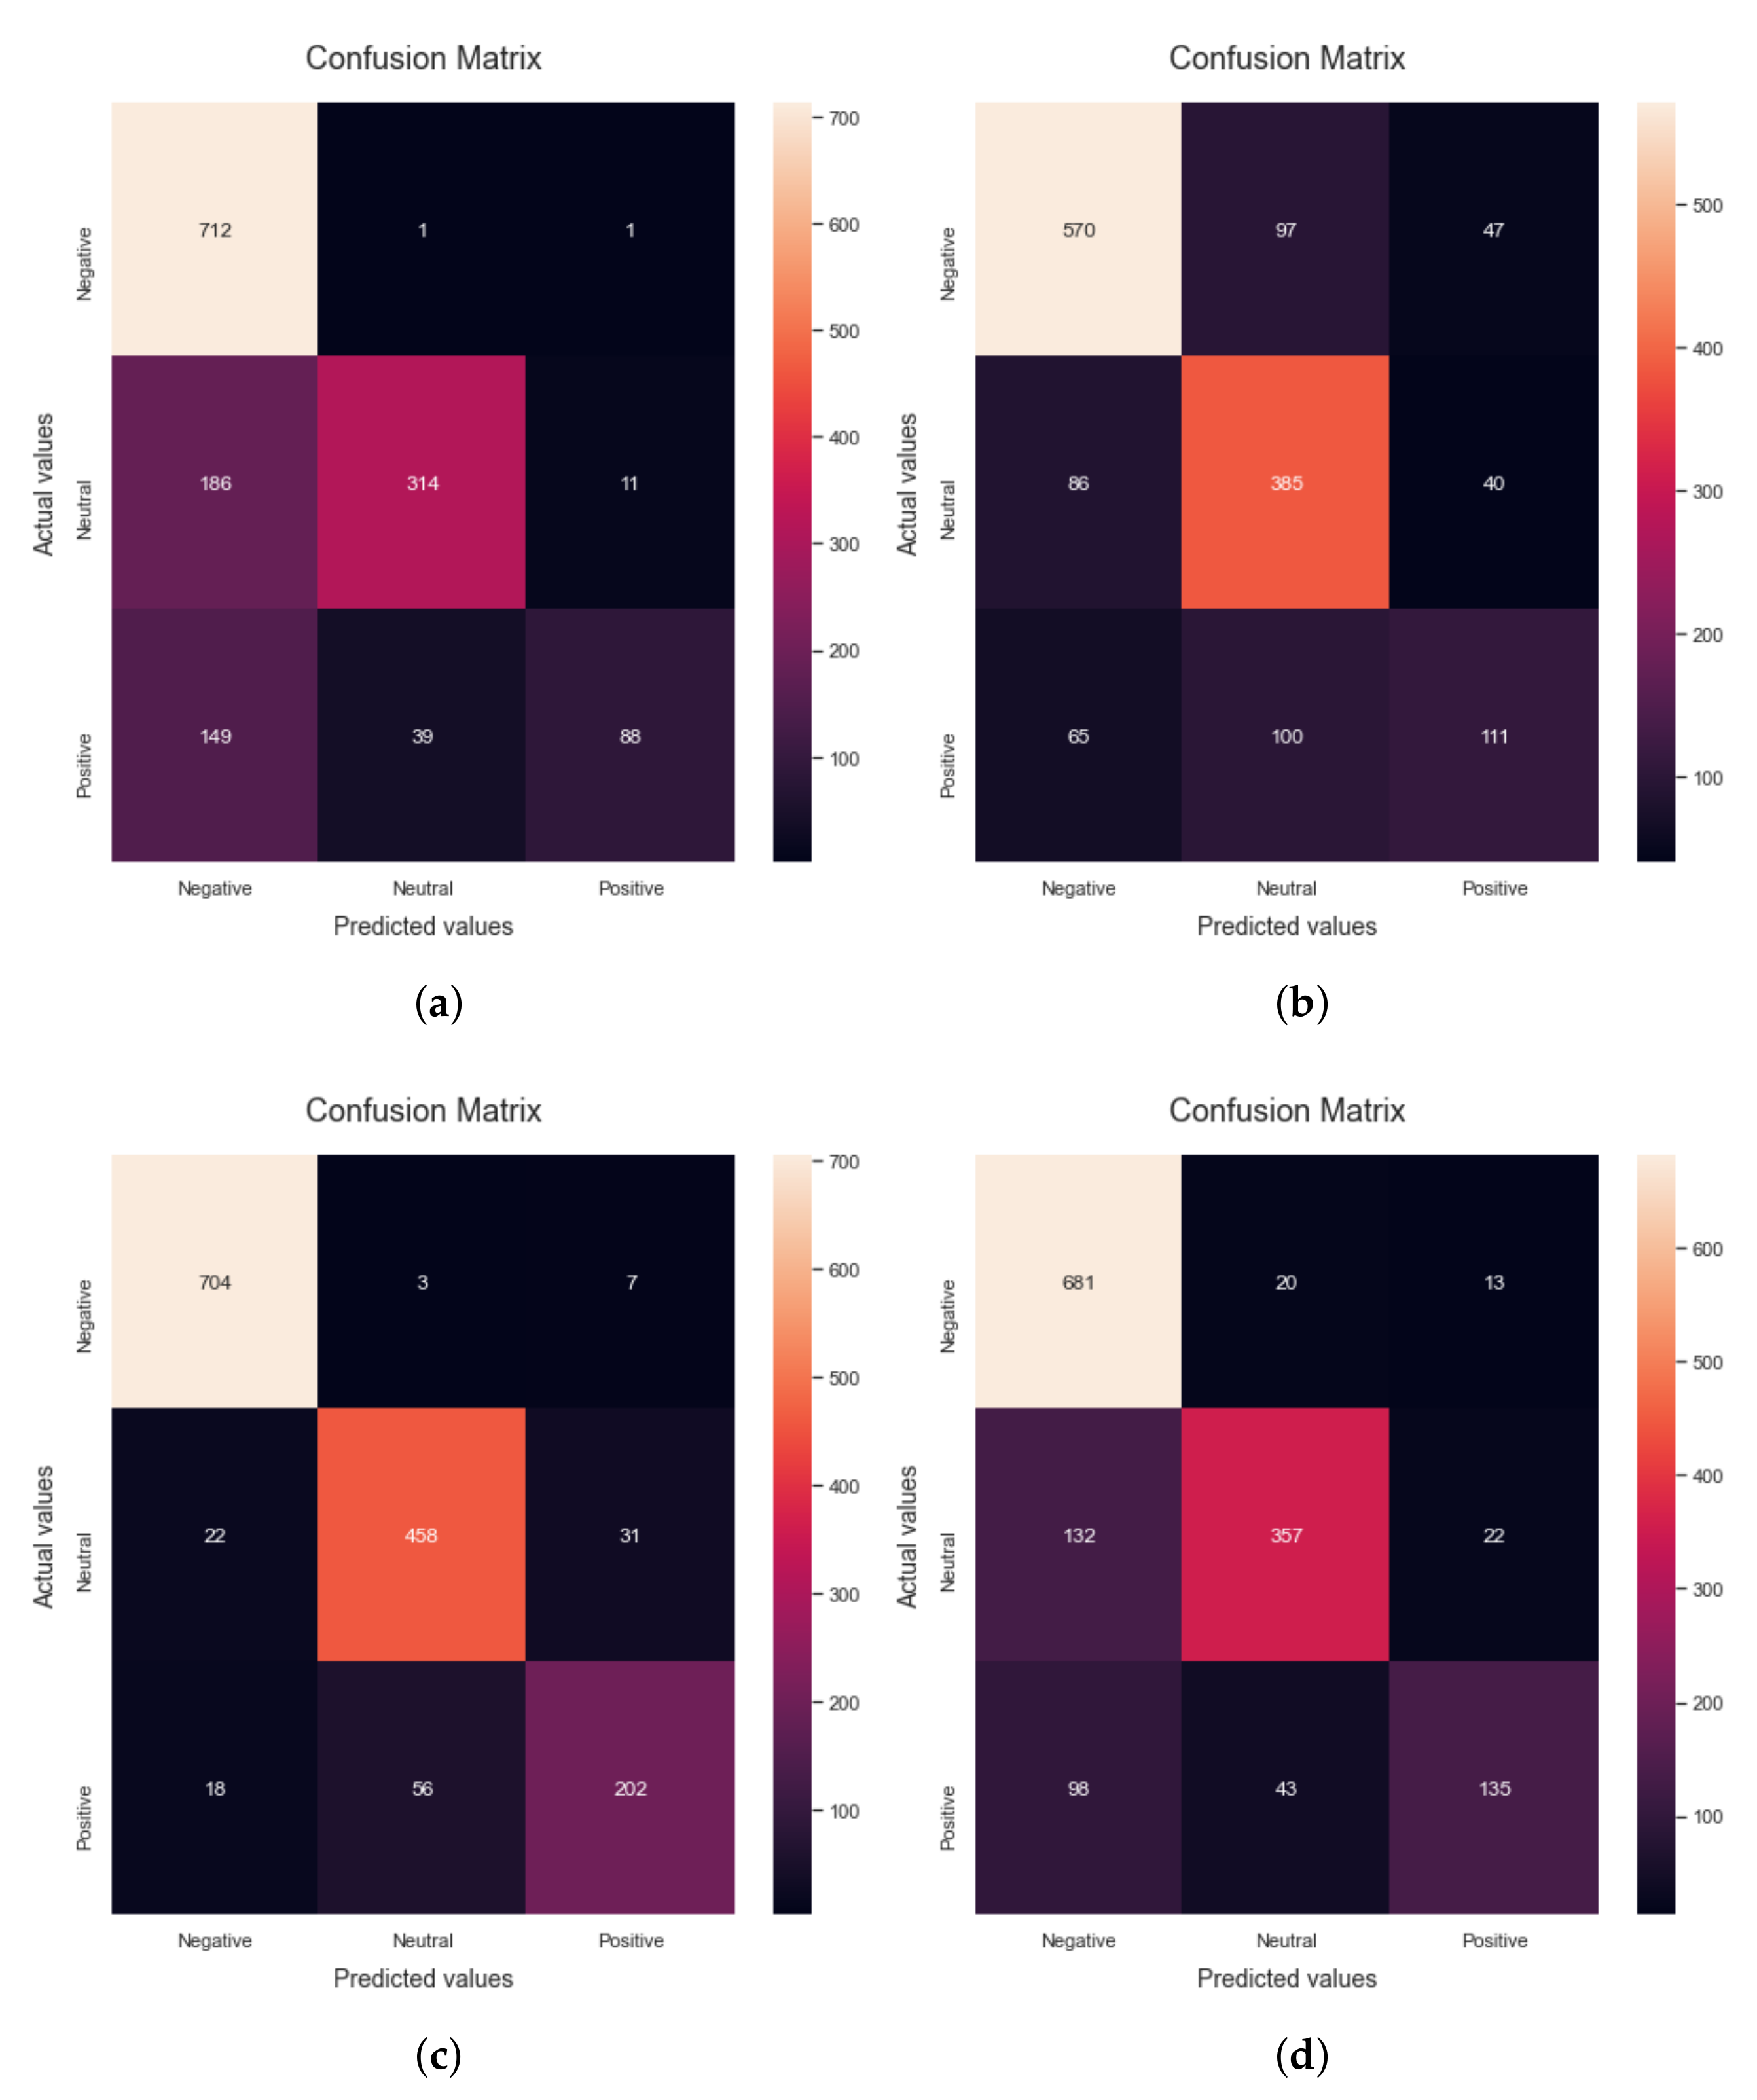
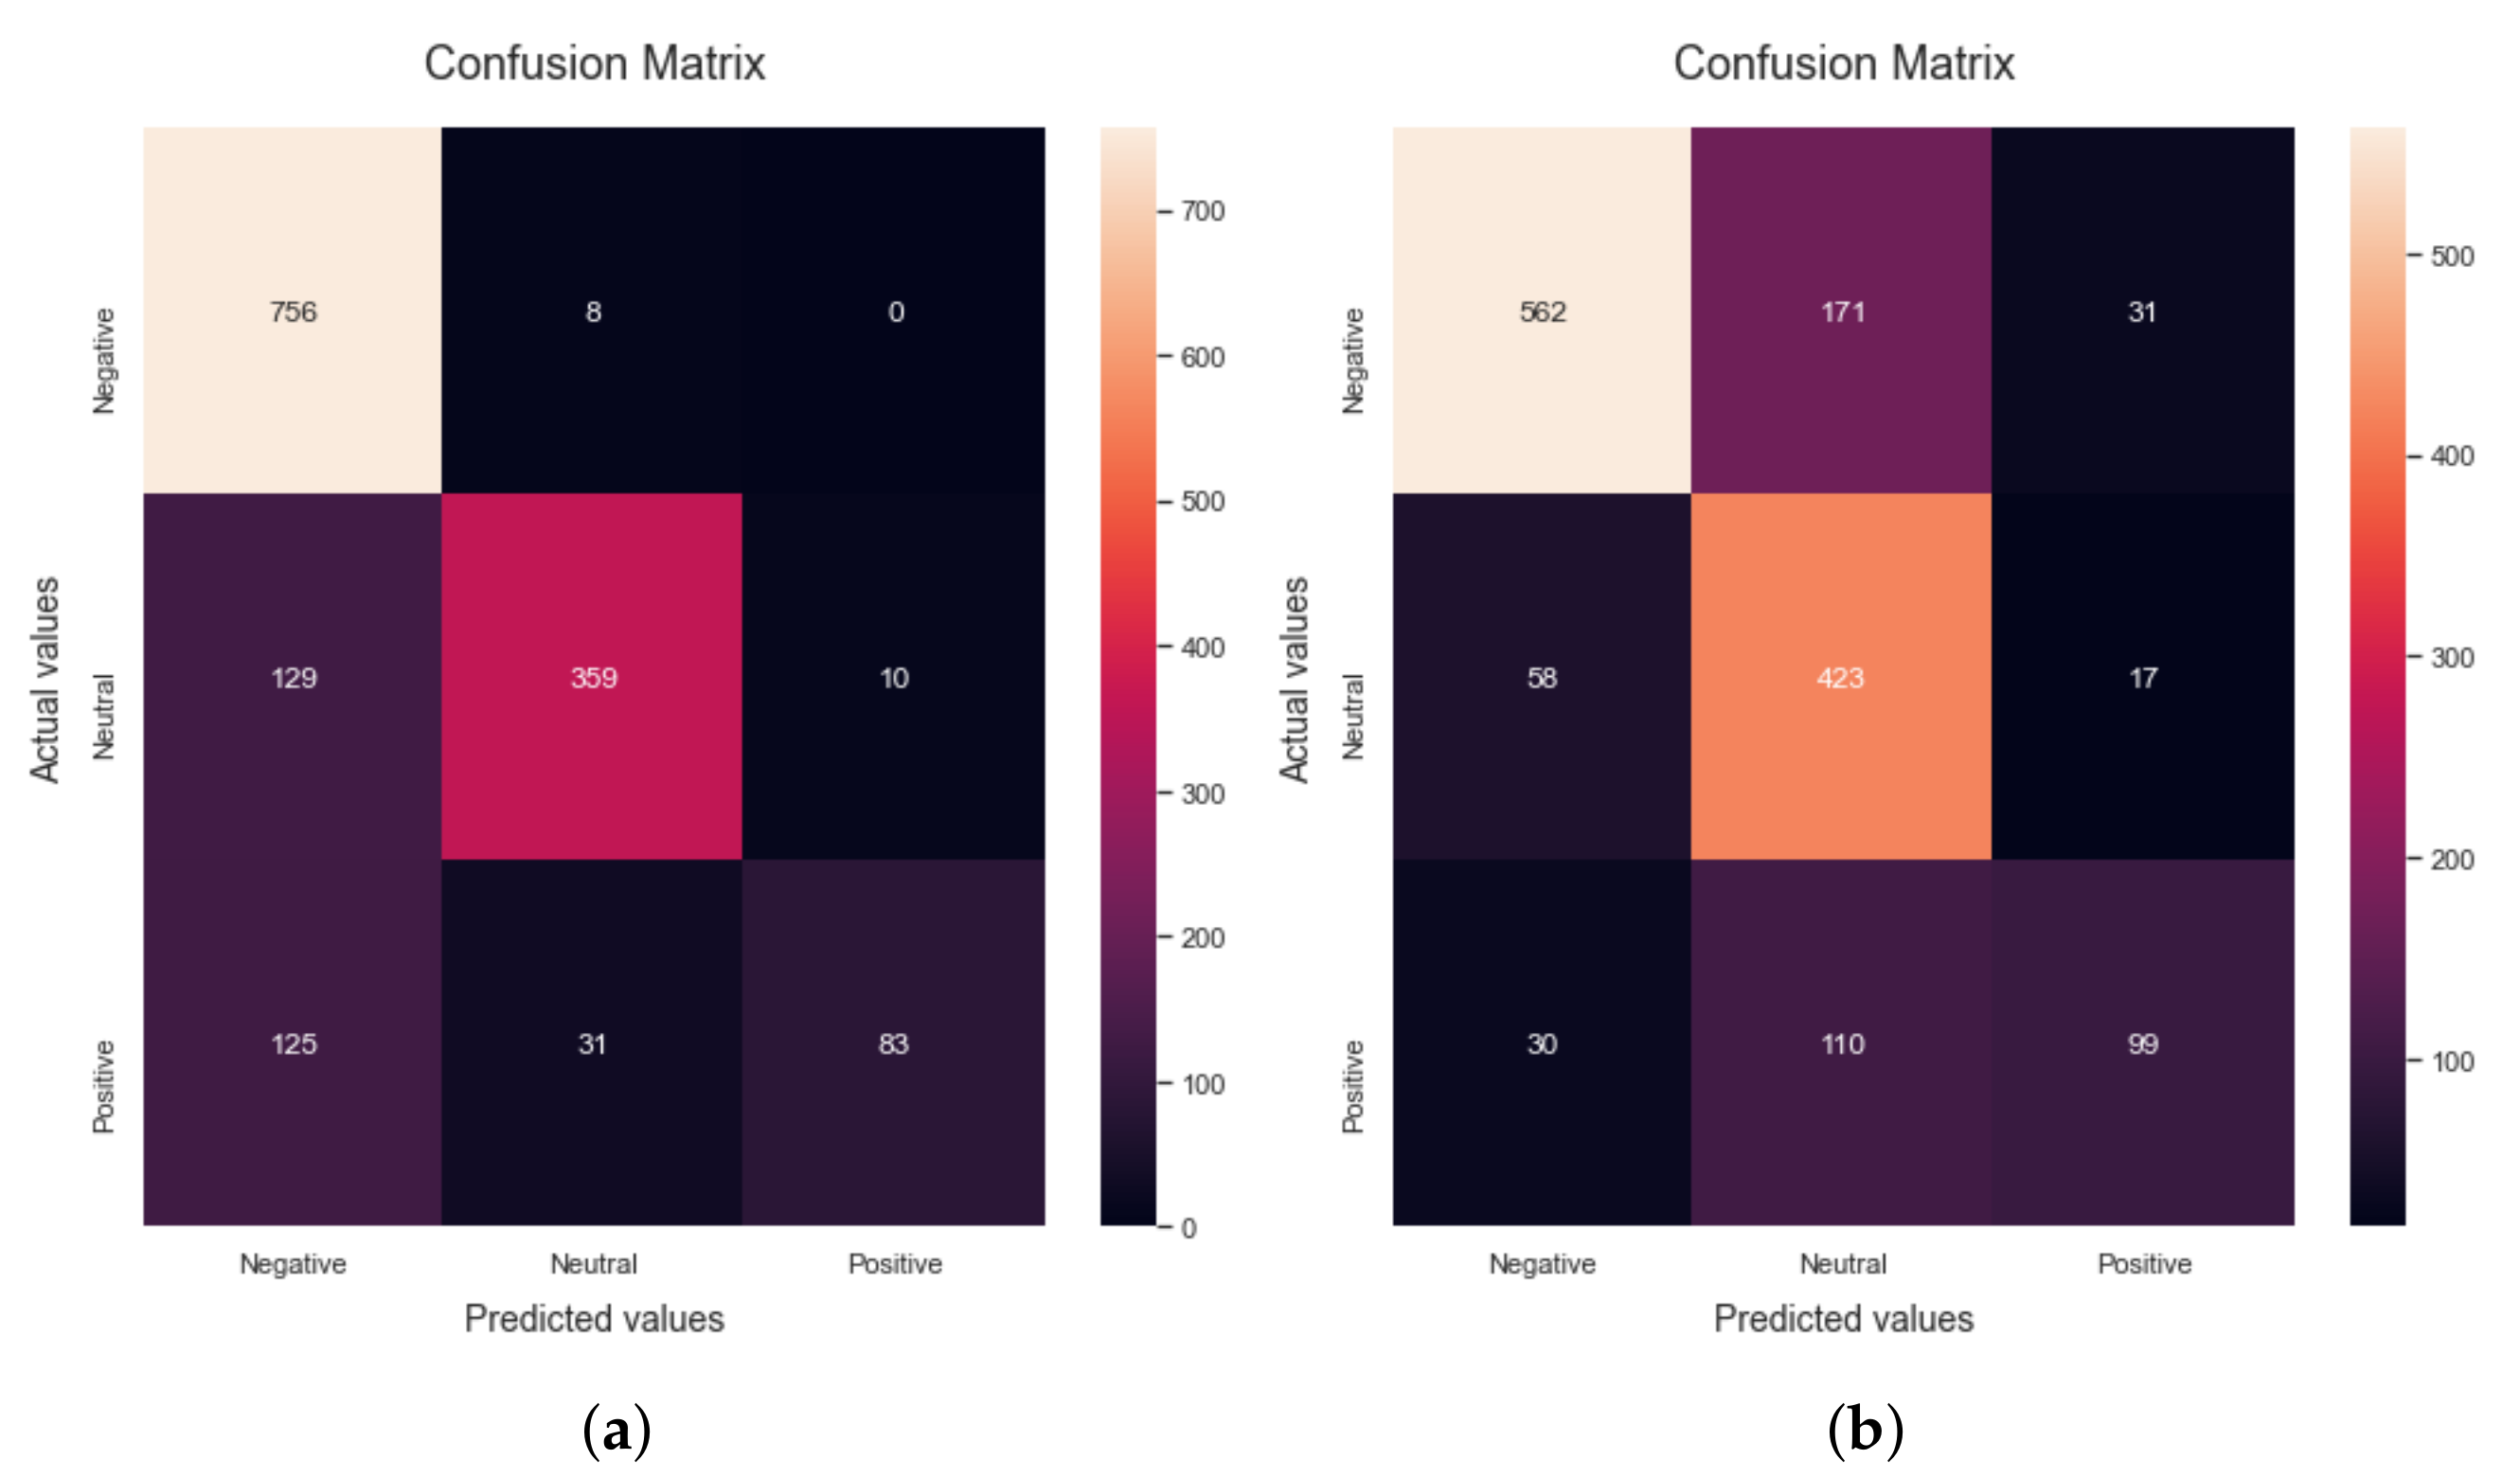
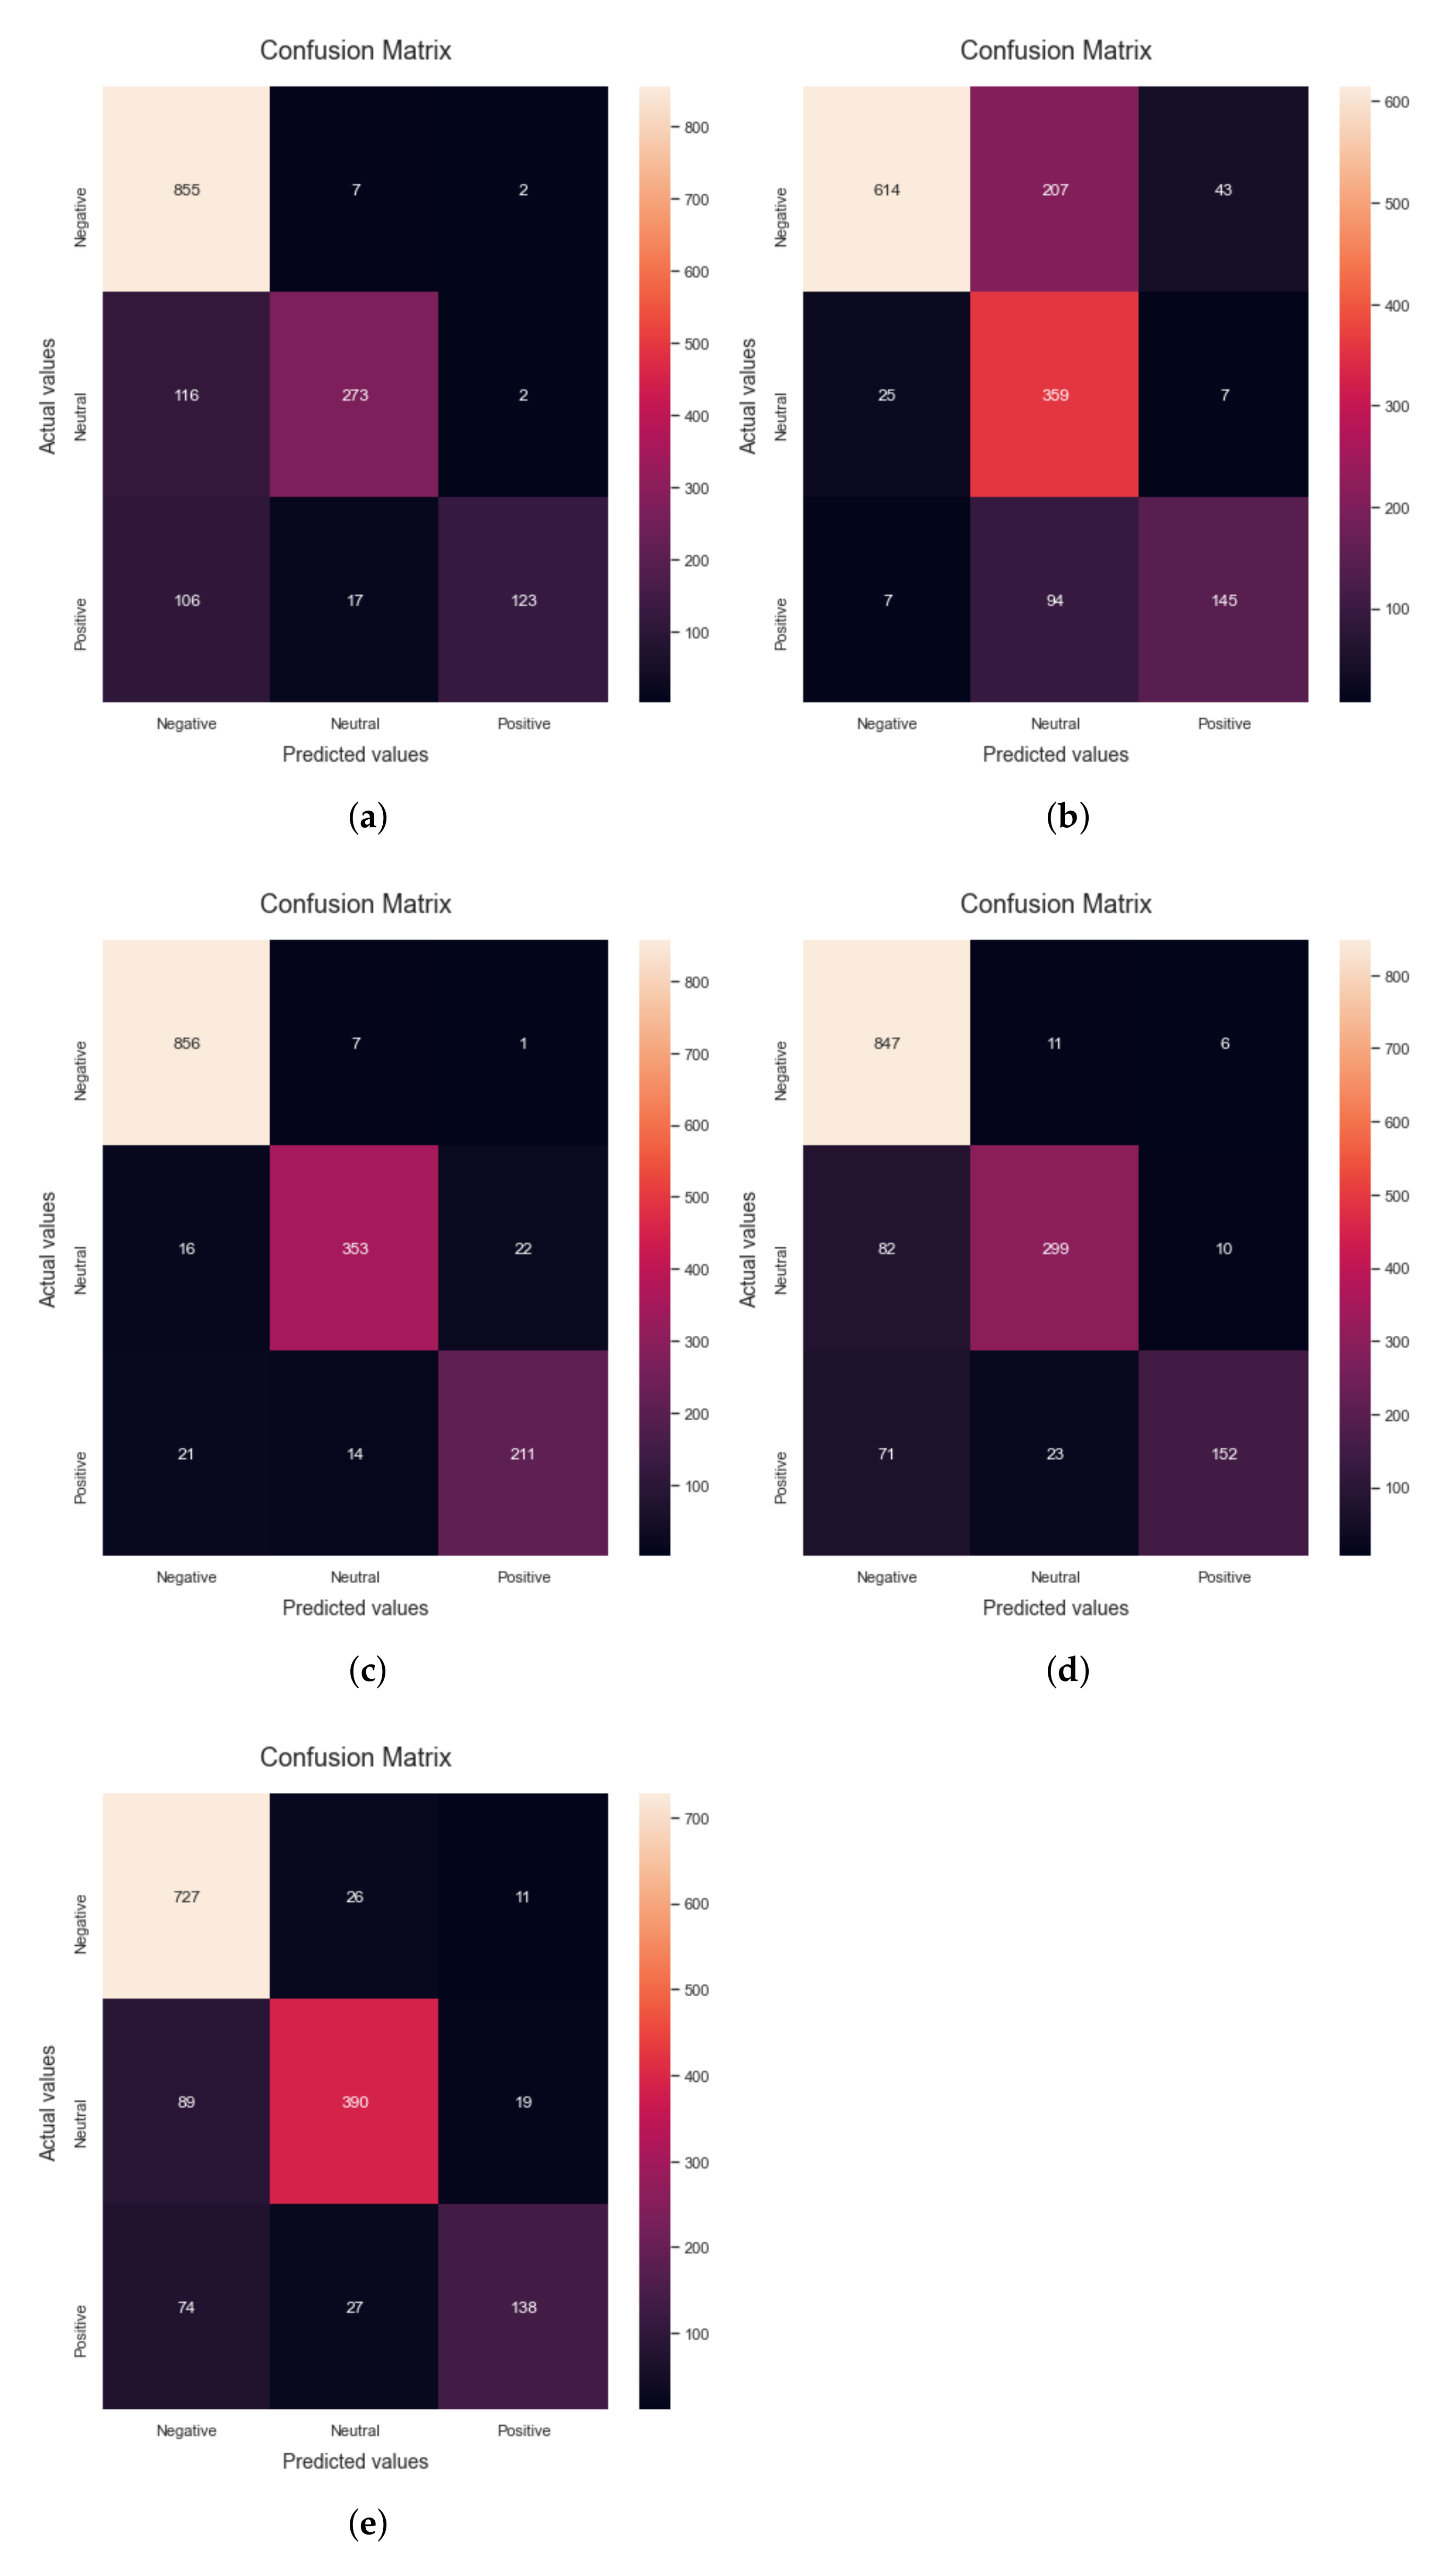
Figure 2 shows the confusion matrices obtained by applying different ML algorithms. As discussed earlier, Random Forest is an approach to supervised ML that may be flexible and is used for both classification and regression analysis. It can be observed that when the Random Forest algorithm is applied to the dataset, 81.94% accuracy is obtained. Confusion matrix
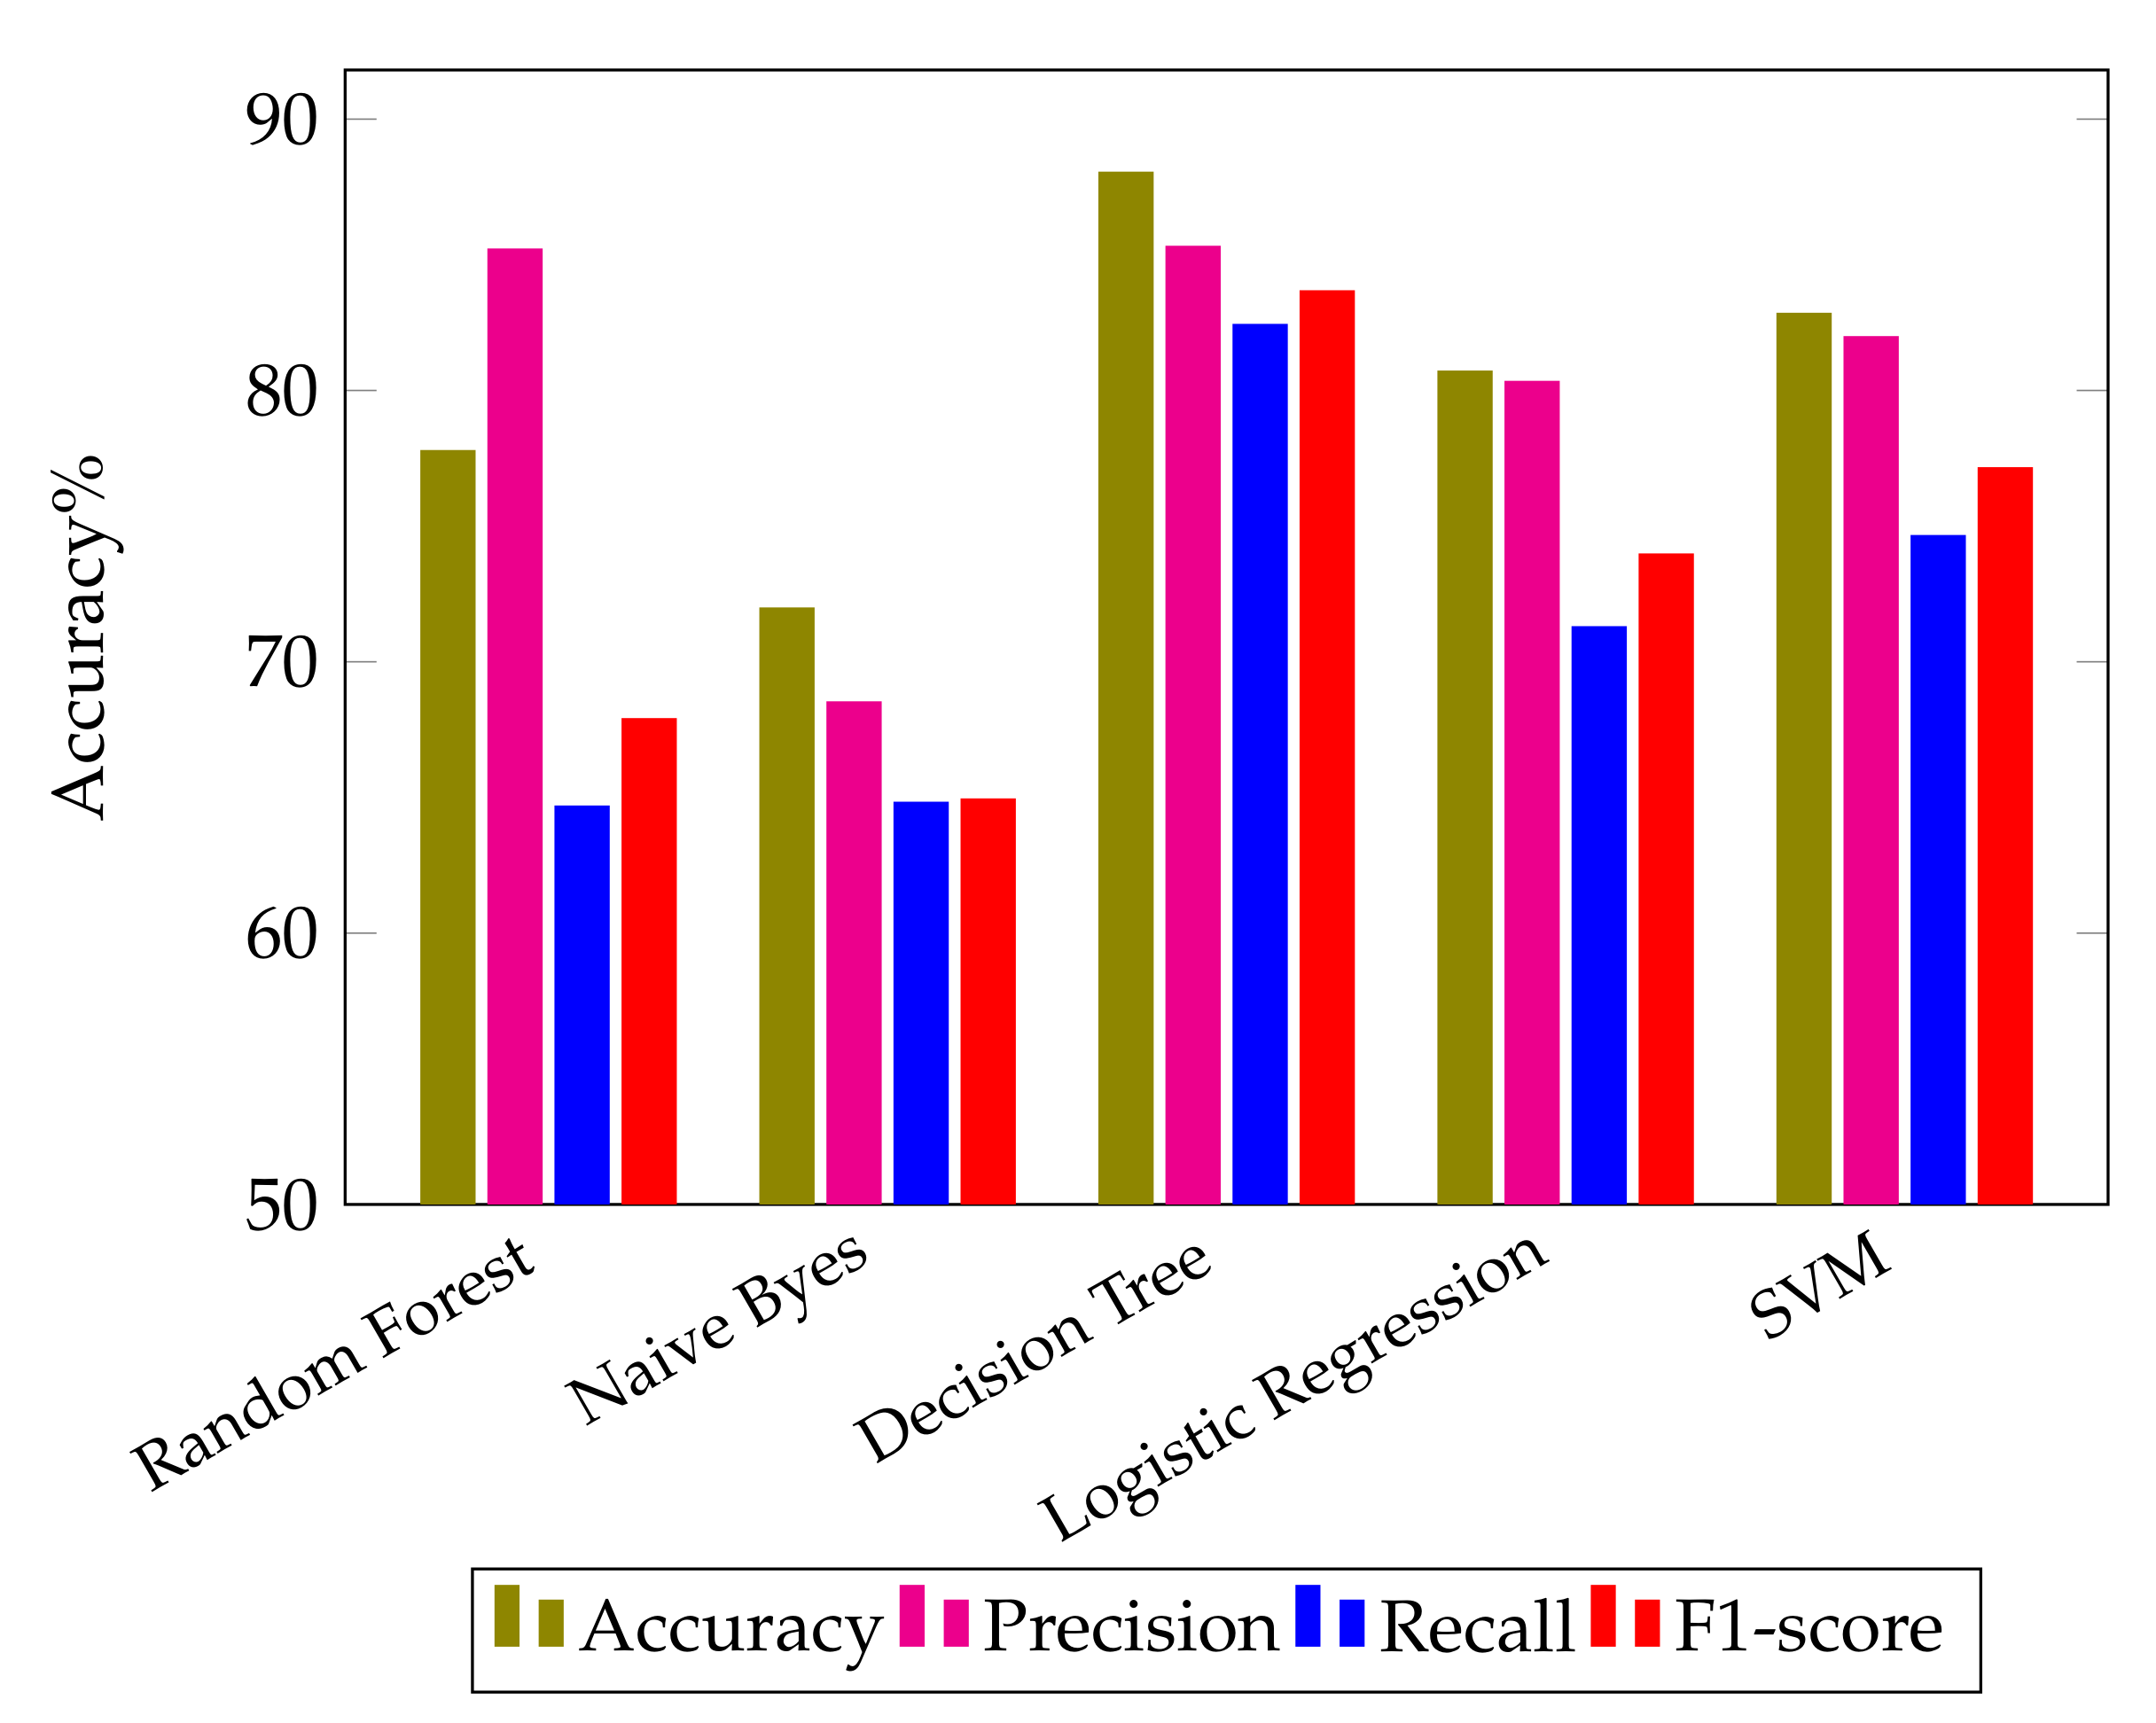
Figure 2a shows the results of precision, recall, F1-score and accuracy obtained by applying the Random Forest algorithm to the dataset. These values are calculated by using Tp, Tn, Fp and Fn parameters. The precision, recall, F1-score and accuracy achieved by applying the random forest ML model are 89.94%, 67.76%, 69.9% and 81.94%, respectively, and are shown in
Table 3.
The second algorithm used for the evaluation of the proposed research is Naive Bayes. It is a method of classification that is based on the Bayesian concept of conditional independence of class membership. This indicates that the existence of one characteristic does not have an influence on the likelihood of another characteristic being present in a given outcome and that each predictor has an equal impact on the given outcome. This technique is primarily used in text classification, spam identification, and recommendation systems. It can be observed that when the Naive Bayes algorithm is run on the dataset, 75.67% accuracy is obtained. Confusion matrix
Figure 2b shows the confusion matrix obtained by applying the Naive Bayes algorithm to the data set. Experimental results demonstrate that the precision, recall, F1-score, and accuracy scores using the NB algorithm are 71.55%, 63.19%, 63.2% and 75.67%, respectively, as shown in
Table 3.
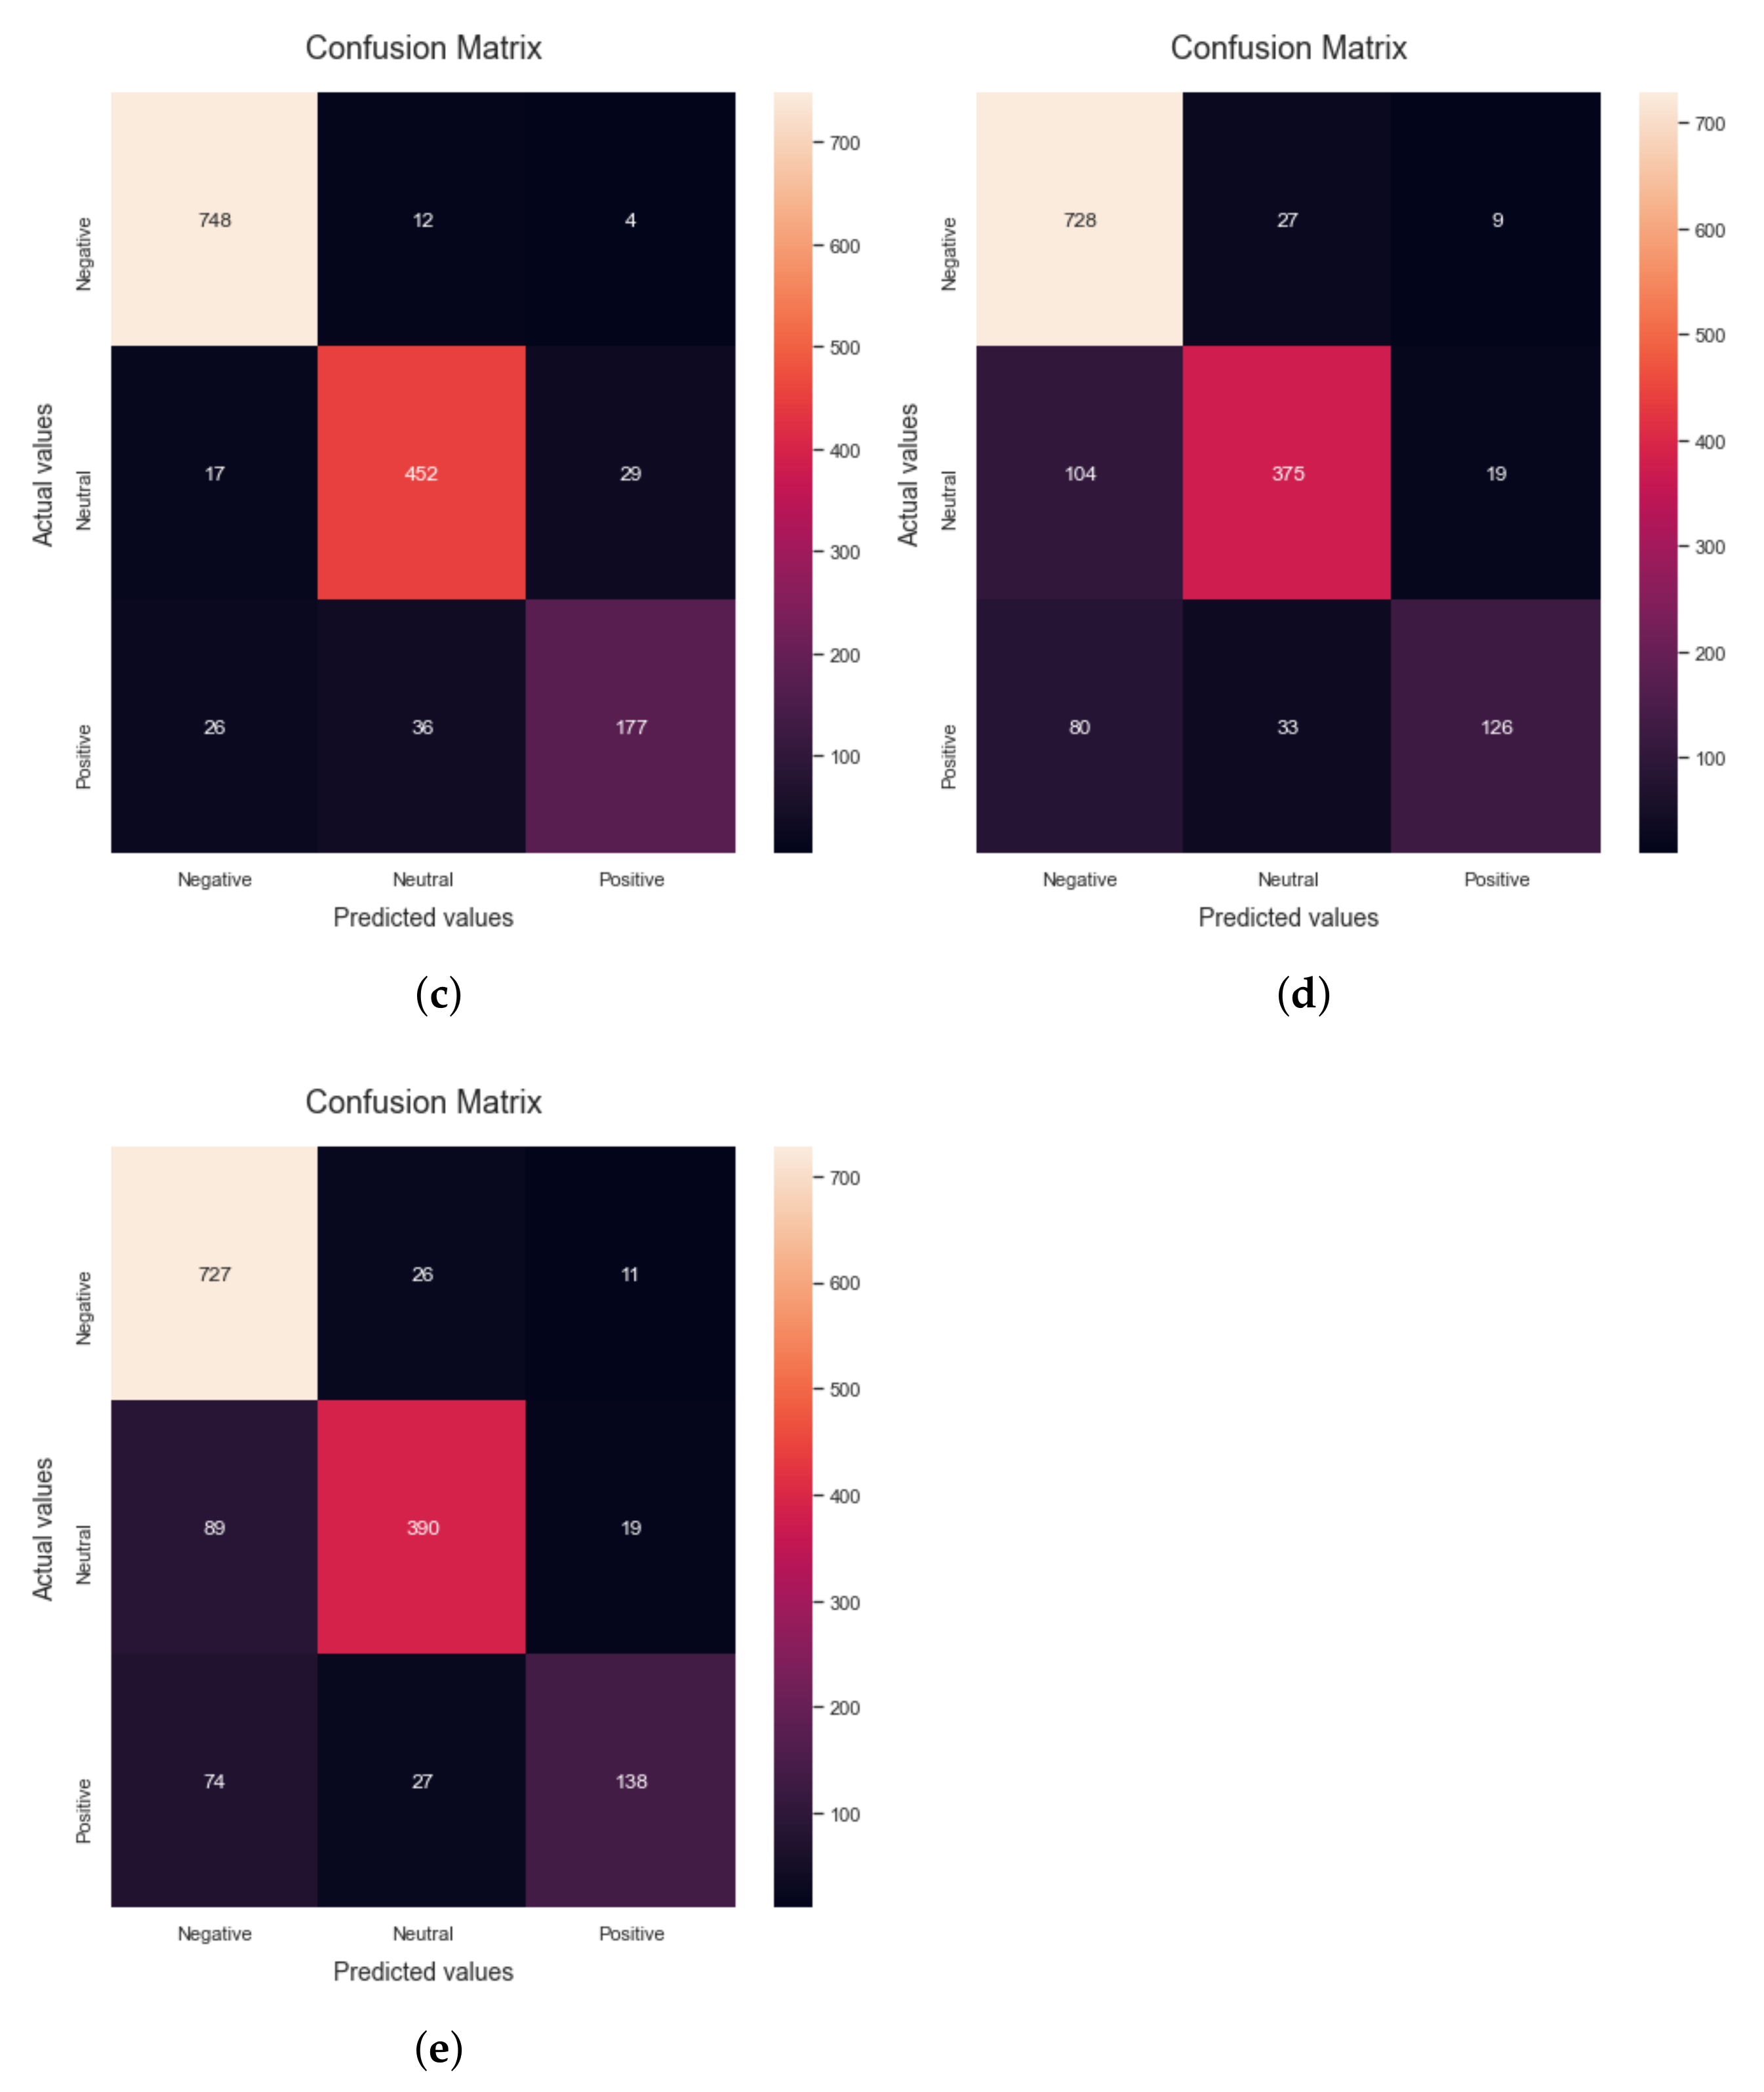
The third classifier applied for the evaluation of the proposed research is the Decision Tree. It is a kind of supervised learning that does not rely on parameters and may be used for classification and regression. The goal of this project is to come up with a model that can predict the value of a target variable by finding and using simple decision rules that are based on the data. It can be observed that when the decision tree algorithm is run on the dataset, 93% accuracy is obtained.
Figure 2c shows the confusion matrix obtained by applying the Naive Bayes algorithm to the dataset. The precision, recall, F1-score and accuracy scores using the DT algorithm are 90.43%, 88.27%, 89.24% and 93%, respectively. When the dependent variable is categorical—that is, when it has binary outputs such as “true” and “false” or “yes” and “no”—logistic regression is the method of choice to analyze the data. It can be observed that when the Logistic Regression algorithm is run on the dataset, 82.5% accuracy is obtained. Confusion matrix
Figure 2d shows the results of precision, recall, F1-score, support and accuracy obtained by applying the Logistic Regression algorithm to the data set. The precision, recall, F1-score and accuracy obtained by applying the logistic regression algorithm are 85.35%, 71.36%, 74.47% and 82.5%, respectively.
The last algorithm used for the evaluation of the proposed research is the support vector machine, which is a popular supervised learning model used for both data classification and regression. It works by creating a hyperplane with the greatest distance between two classes of data points. The decision boundary is a hyperplane that separates the classes of data points on each side of the plane. It can be observed that when the SVM algorithm is run on the dataset, 84.78% accuracy is obtained. Confusion matrix
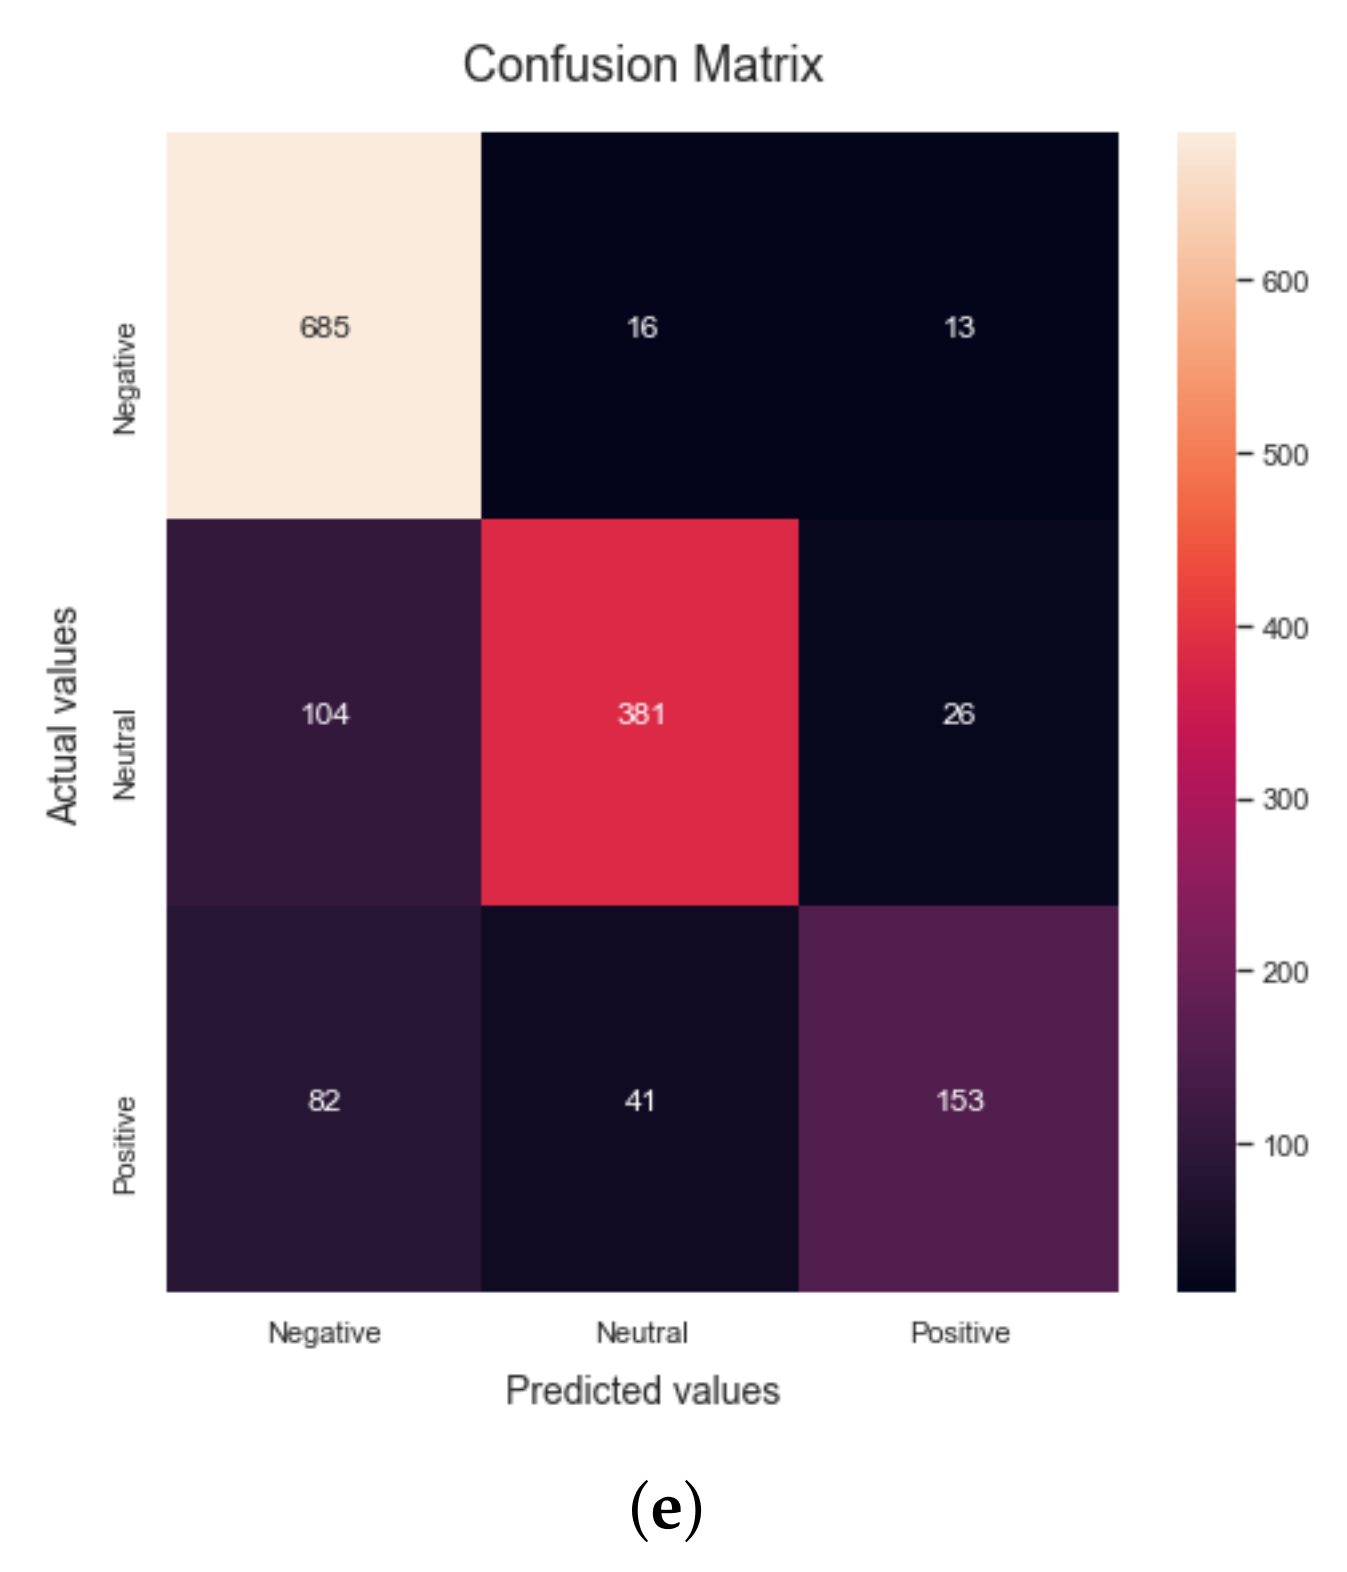
Figure 2e shows the results of precision, recall, F1-score and accuracy obtained by applying the Linear SVM algorithm to the data set. These values are calculated by using Tp, Tn, Fp and Fn parameters. The precision, recall, F1-score and accuracy obtained using the SVM classifier are 87.0%, 75.05%, 78.31% and 84.78%, respectively. It can be evidently seen from
Table 3 that the proposed research demonstrates the highest accuracy using the Decision Tree classifier.
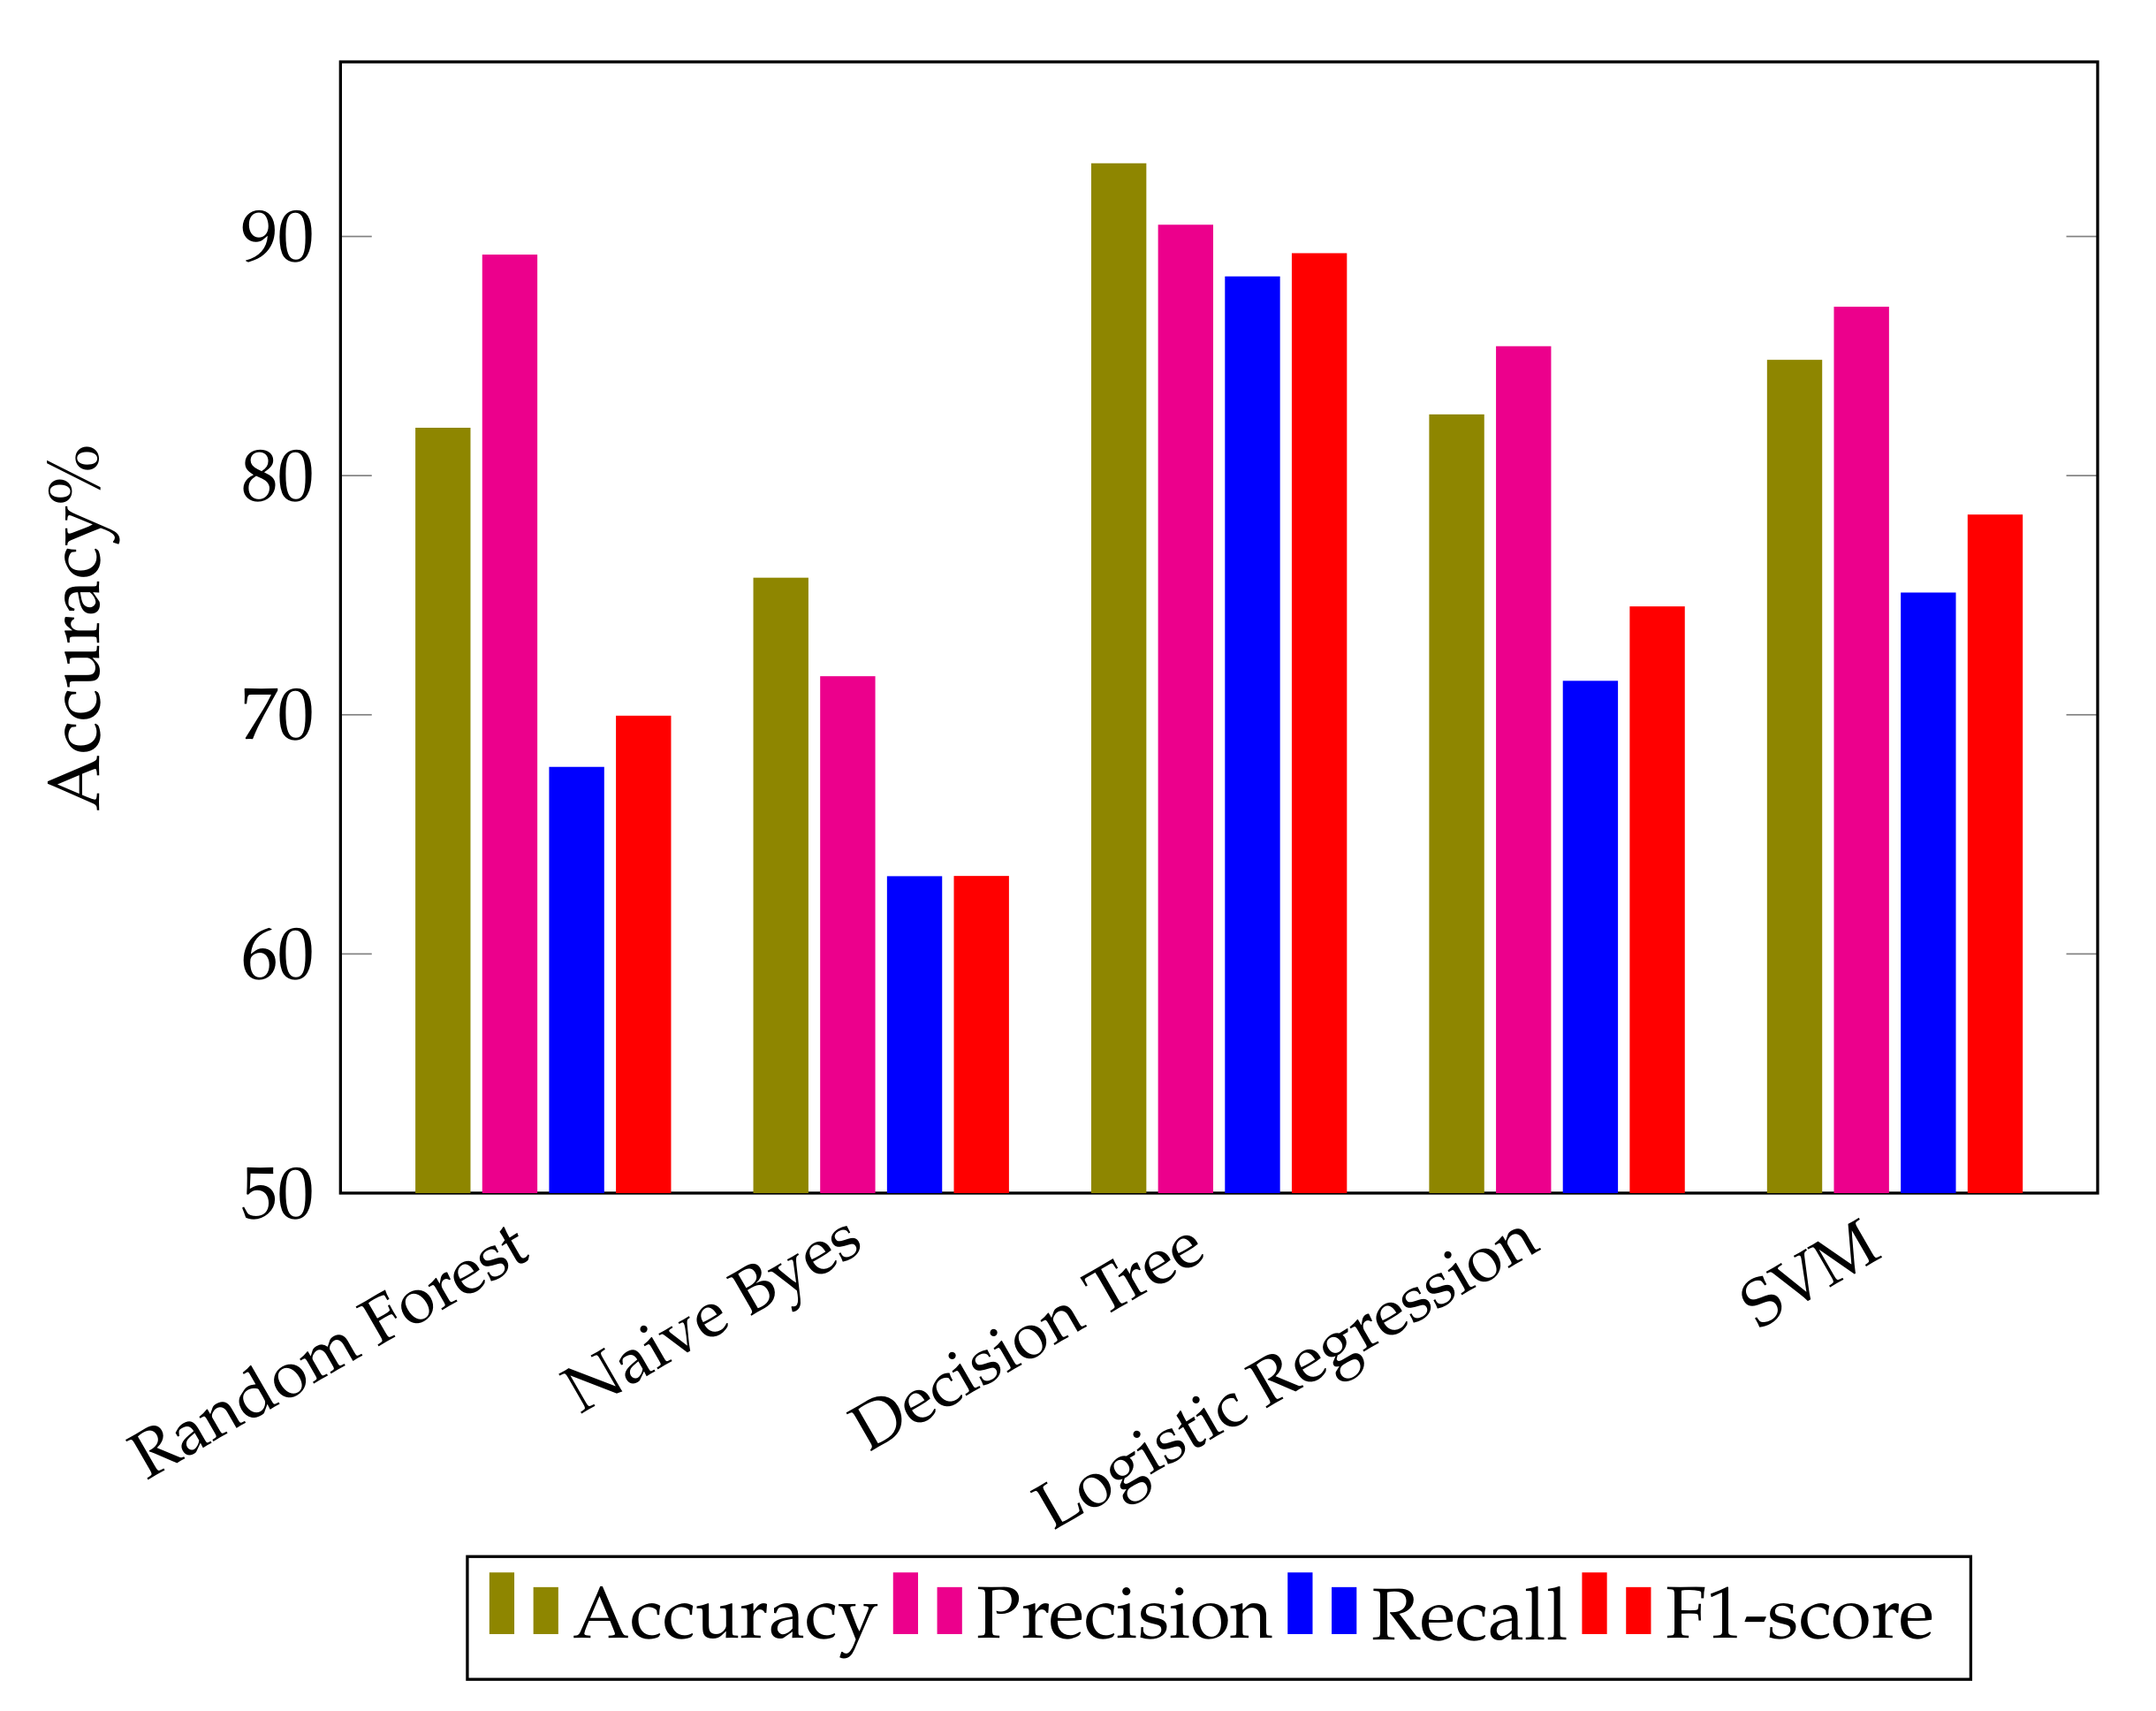
Figure 3 provides a graphical comparison of the precision, recall, F1-score and accuracy results obtained by applying the different ML classifiers. It can be safely concluded that the DT classifier outperforms the other ML classifiers in terms of classification accuracy for sentiment analysis.
4.4. Results for Dataset 2
This section presents a discussion on the experimental results obtained for dataset 2. The dataset is partitioned into five subsets; one representing each vaccine type.
4.4.1. Results for AstraZeneca Dataset
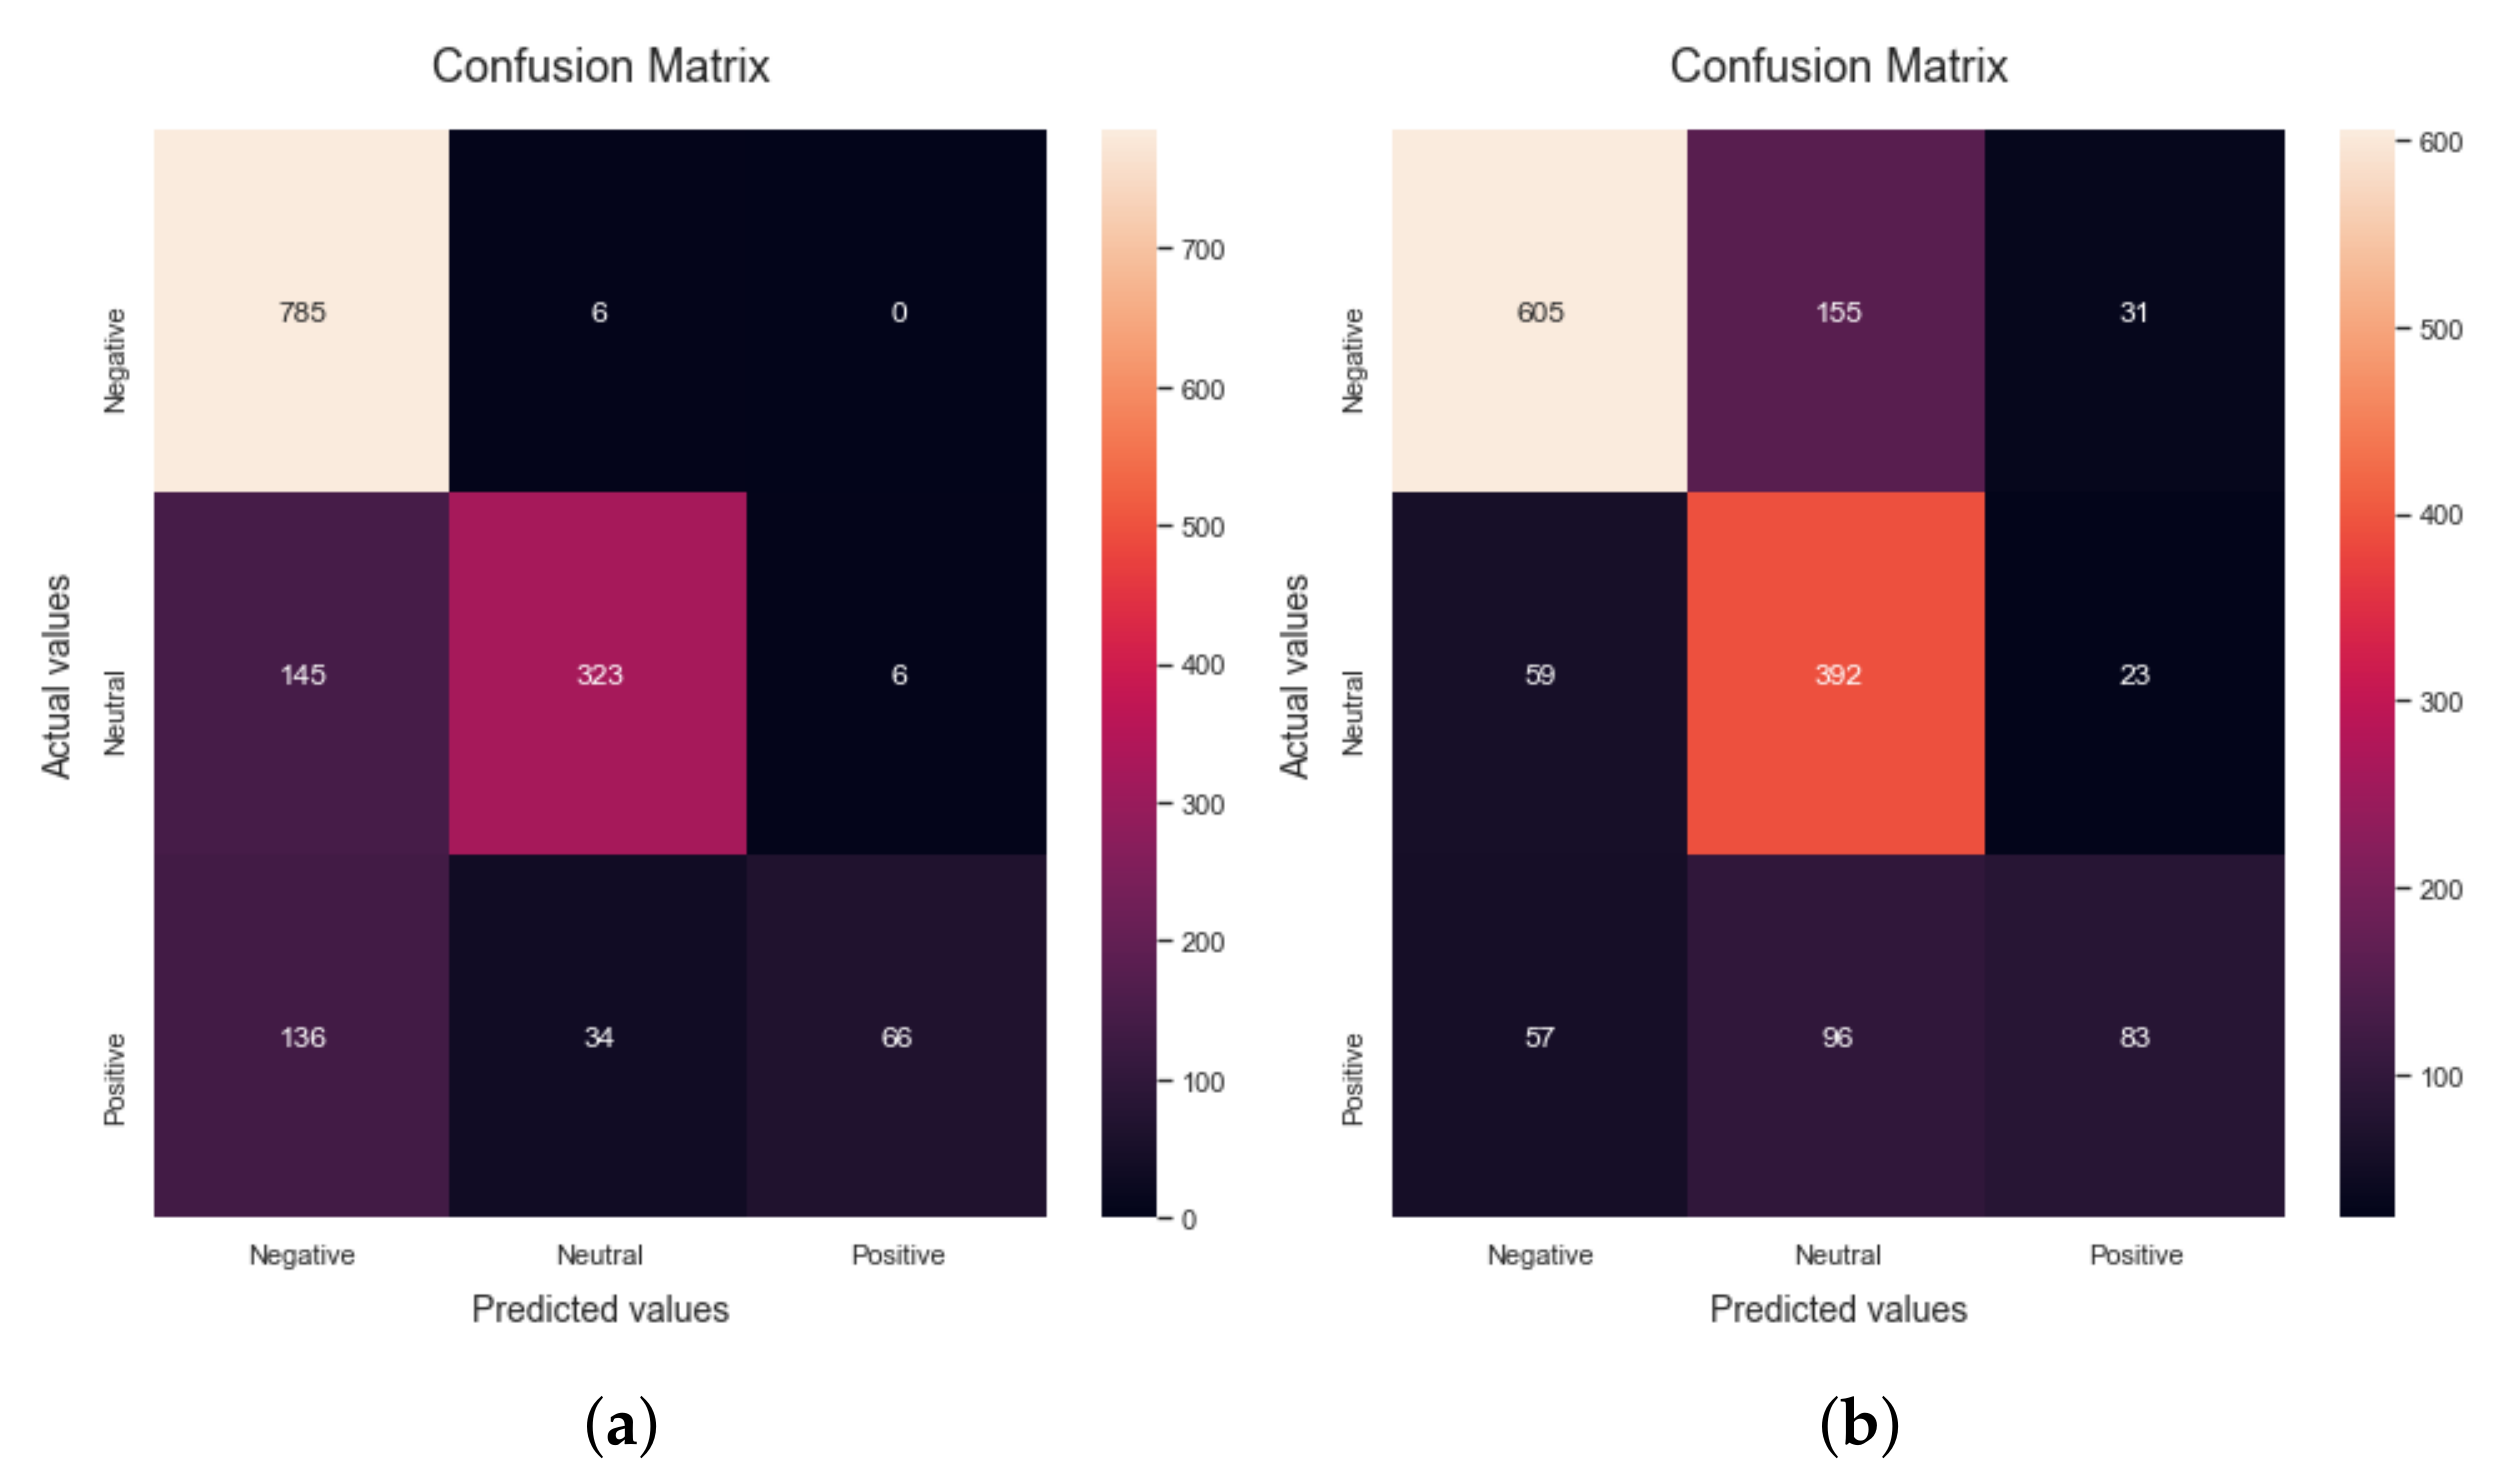
The first classifier applied to the dataset is the Random Forest method, which achieves an accuracy of 81.41%. The Precision, recall, F1-score, support, and accuracy statistics produced by using the Random Forest technique on the dataset are shown in confusion Matrix
Figure 4a. The Tp, Tn, Fp, and Fn parameters are used to compute these values. The computed scores of precision, recall, F1-score, and accuracy are 87.27%, 69.32%, 74.19% and 81.81%, respectively, as can be seen in
Table 4. The second algorithm used for the evaluation of the proposed research is the Multinomial Naive Bayes algorithm, and it results in 75.28% accuracy. The confusion matrix for the Naive Bayes algorithm is shown in
Figure 4b. The precision, recall, F1-score, and accuracy achieved by applying the NB are 70.46%, 70.9%, 69.76% and 75.28%, respectively.
When the Decision Tree algorithm is applied to the dataset, the accuracy is found to be 90.94%. The precision, recall, F1-score, support, and accuracy results obtained by using the Naive Bayes algorithm on the dataset are shown in confusion matrix
Figure 4c. The TP, TN, FP, and FN parameters are used to calculate these values. Precision, recall, F1-score, and accuracy are 87.33%, 86.09%, 86.67%, and 90.94%, respectively, as can be seen in
Table 4. The fourth algorithm used for the evaluation of the proposed research is the Logistic Regression algorithm, which yields an accuracy of 83.41%.
Figure 4d shows the Confusion matrix for the LR algorithm. The matrix gives the values of precision, recall, F1-score, and accuracy; as 84.41%, 73.3%, 77.07% and 83.41%, respectively.
The last algorithm used for the evaluation of the proposed research is the SVM, which results in an accuracy of 85.86%. The precision, recall, F1-score, support and accuracy results obtained by using the Linear SVM algorithm on the dataset are shown in confusion Matrix
Figure 4e. These values are calculated by using Tp, Tn, Fp, and Fn parameters. The precision, recall, F1-score, support and accuracy scores as obtained using the proposed research are 85.86%, 76.72%, 80.09% and 85.61%, respectively, as shown in
Table 4.
Figure 5 shows a graphical comparison of the different algorithms for the AstraZeneca vaccine dataset. It can be evidently seen that the highest accuracy is obtained by applying the Decision Tree algorithm.
4.4.2. Result of Pfizer Vaccines Dataset
This subsection presents the results obtained for the Pfizer vaccine dataset. When the Random Forest algorithm is applied to the dataset, it achieves an accuracy of 74.42%. The precision, recall, F1-score, support, and accuracy results obtained by using the Random Forest algorithm on the dataset are shown in confusion matrix
Figure 6a. The Tp, Tn, Fp, and Fn parameters are used to calculate these values. Precision, recall, F1-score and accuracy are 81.63%, 64.19%, 66.33% and 74.42%, respectively, according to this matrix as can be seen in
Table 5. The multinomial Naive Bayes algorithm results in 71.02% accuracy. The precision, recall, F1-score and accuracy results obtained by using the Naive Bayes algorithm on the dataset are shown in confusion Matrix
Figure 6b. The values of precision, recall, F1-score and accuracy as computed from the matrix are 67.09%, 65.13%, 65.58% and 71.02%, respectively.
When the Decision Tree algorithm is applied to the dataset, it yields a result of 91.07% accuracy. The precision, recall, F1-score and accuracy results obtained by using the Decision Tree algorithm on the dataset are shown in confusion matrix
Figure 6c. The precision, recall, F1-score and accuracy obtained by applying the DT algorithm are 89.36%, 87.48%, 88.3% and 91.07%, respectively, as can be seen in
Table 5, respectively.
When the Logistic Regression algorithm is applied to the dataset, the accuracy is found to be 78.72%. The precision, recall, F1-score and accuracy results obtained by using the Logistic Regression algorithm on the dataset are shown in the confusion matrix
Figure 6d. The values are determined by means of Tp, Tn, Fp and Fn parameters. This matrix tells the values of precision, recall, F1-score and accuracy as 79.72%, 71.38%, 73.68% and 78.72%, respectively. The last algorithm used for the evaluation of the proposed research is the SVM, which results in an accuracy of 81.21%. The precision, recall, F1-score and accuracy results obtained by using the Linear Support Vector Machine (SVM) algorithm on the dataset are shown in
Figure 6e. The precision, recall, F1-score and accuracy scores obtained are 81.77%, 75.31%, 77.37% and 81.21%, respectively, as shown in
Table 5. A graphical comparison of different ML algorithms is presented in
Figure 7. The Decision Tree outperforms other classifiers and achieves the highest accuracy for sentiment classification.
4.4.3. Results for Sinovac Vaccine Dataset
This subsection presents the results for the Sinovac vaccine dataset. The first algorithm used for evaluation on Sinovac dataset is the Random Forest, and it achieves an accuracy of 79.01%. The precision, recall, F1-score and accuracy results obtained by applying the Random Forest algorithm to the dataset are shown in
Figure 8a. The Tp, Tn, Fp and Fn parameters are used to calculate these values. Precision, recall, F1-score, and accuracy obtained for the RF are 85.28%, 67.28%, 70.27% and 79.01%, respectively, as summarized in
Table 6. The second algorithm used for evaluation is the Naive Bayes, which results in an accuracy of 72.22%. Confusion matrix
Figure 8b shows the results of precision, recall, F1-score and accuracy obtained by applying the multinomial NB algorithm on the dataset. The values of precision, recall, F1-score and accuracy as computed from the matrix are 71.3%, 66.64%, 66.64% and 72.22%, respectively.
When the Decision Tree algorithm is applied to the dataset, it yields a result of 92.8% accuracy. The precision, recall, F1-score and accuracy results obtained by using the Decision Tree algorithm on the dataset are shown in confusion matrix
Figure 8c. The Tp, Tn, Fp, and Fn parameters are used to calculate these values. Precision, recall, F1-score and accuracy values are 91.55%, 88.6%, 89.06% and 92.8%, respectively, according to this matrix. When the Logistic Regression algorithm is applied to the dataset, it yields an accuracy of 81.88%. The precision, recall, F1-score and accuracy results obtained by using the LR algorithm on the dataset are shown in
Figure 8d. This matrix gives the values of precision, recall, F1-score and accuracy are 82.62%, 74.44%, 77.13% and 81.88%, respectively, as summarized in
Table 6.
The last algorithm used for the evaluation of the proposed research is the support vector machine. When SVM is applied to the dataset, it yields an accuracy of 83.61%. The precision, recall, F1-score and accuracy results obtained by using the Linear SVM algorithm on the dataset are shown in confusion matrix
Figure 8e. These values are calculated by using Tp, Tn, Fp and Fn parameters. This matrix tells the values of precision, recall, F1-score and accuracy are 83.95%, 77.07%, 79.54%, and 83.61%, respectively, as shown in
Table 6.
Figure 9 provides a graphical comparison of the performance of different ML classifiers. It can be evidently seen that the highest performance for sentiment classification is obtained using the Decision Tree classifier.
4.4.4. Results for Moderna Vaccines Dataset
In this subsection, a discussion on the performance of ML algorithms for the Moderna vaccine dataset is presented. It can be seen that when the Random Forest algorithm is applied to the dataset, it achieves an accuracy of 77.75%. The precision, recall, F1-score and accuracy results obtained by using the RF algorithm on the dataset are shown in confusion matrix
Figure 10a. The Tp, Tn, Fp, and Fn parameters are used to calculate these values. Precision, recall, F1-score, and accuracy are 85.18%, 64.65%, 67.87% and 77.75%, respectively, as are shown in
Table 7.
The second algorithm used for the evaluation of the proposed research is the Naive Bayes algorithm. When NB is applied to the dataset, the accuracy is found to be 71.95%. The precision, recall, F1-score and accuracy results obtained by using the NB algorithm on the dataset are shown in
Figure 10b. These values are calculated by using Tp, Tn, Fp and Fn parameters. This matrix gives the values of precision, recall, F1-score and accuracy as 68.49%, 64.79%, 64.91% and 71.95%, respectively. When the Decision Tree algorithm is applied to the dataset, an accuracy of 88.01% is obtained. The precision, recall, F1-score and accuracy results obtained by using the Decision Tree algorithm on the dataset are shown in confusion matrix
Figure 10c. The precision, recall, F1-score and accuracy are 85.28%, 82.4%, 83.64%, and 88.01%, respectively, as are summarized in
Table 7.
When the Logistic Regression algorithm is applied to the dataset, an accuracy of 80.68% is obtained.
Figure 10d shows the confusion matrix for the LR algorithm. The values of precision, recall, F1-score and accuracy as obtained from the confusion matrix are 80.3%, 71.26%, 73.94% and 80.68%, respectively. Finally, the SVM algorithm is applied to the dataset and it achieves an accuracy of 82.81%. The precision, recall, F1-score and accuracy results obtained by using the Linear SVM algorithm on the dataset are shown in confusion matrix
Figure 10e. The Tp, Tn, Fp and Fn parameters are used to calculate these values. The computed values of precision, recall, F1-score and accuracy computed from this matrix are 81.95%, 74.62%, 77.12% and 82.81%, respectively, as shown in
Table 7. A graphical comparison of different ML classifiers for the Moderna vaccine dataset is presented in
Figure 11. As discussed earlier, the highest performance for sentiment classification is obtained with the Decision Tree classifier as compared to the other ML algorithms.
4.5. Results for Sinopharm Vaccines Dataset
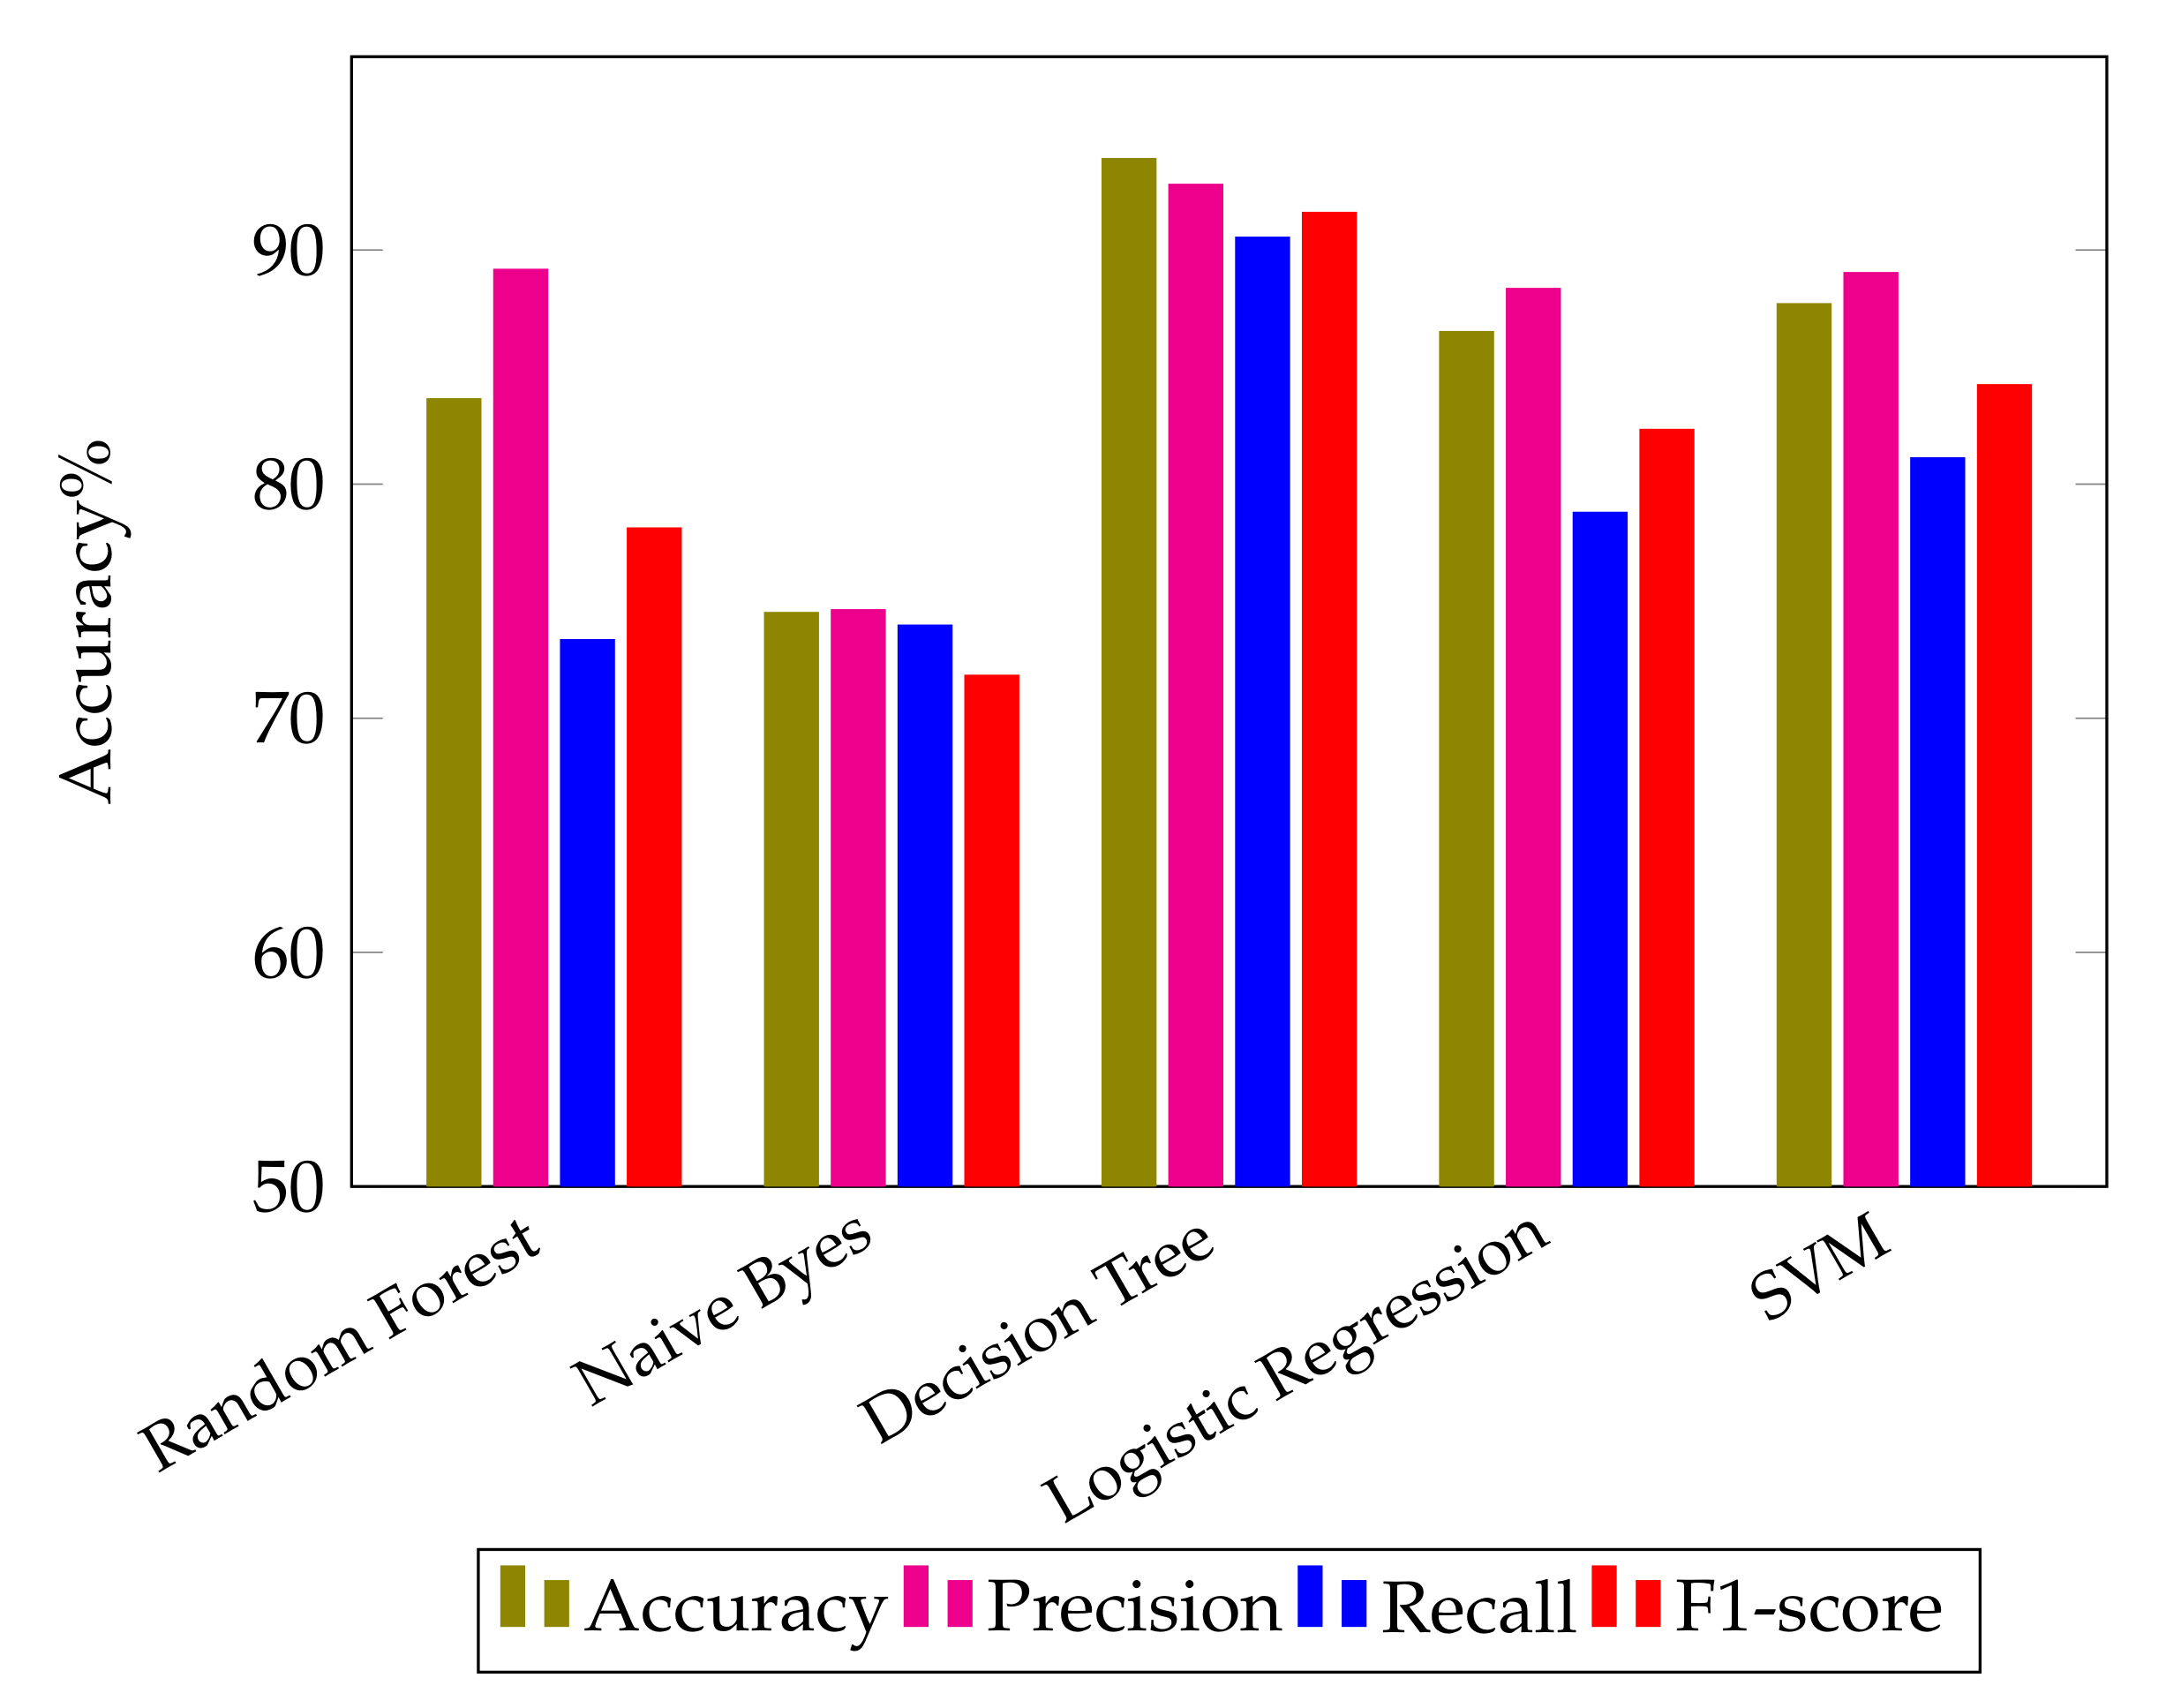
This subsection summarizes the results of the sinopharm vaccine dataset. When the Random Forest algorithm is applied to the dataset, an accuracy of 83.61% is obtained. The precision, recall, F1-score and accuracy results obtained by using the RF algorithm on the dataset are shown in confusion matrix
Figure 12a. The precision, recall, F1-score and accuracy are 89.14%, 73.32%, 78.09%, and 83.61%, respectively, according to this matrix. When the Naive Bayes algorithm is applied to the dataset, it yields a result of 74.48% accuracy. The precision, recall, F1-score and accuracy results obtained by using the NB algorithm on the dataset are shown in
Figure 12b. The values of precision, recall, F1-score and accuracy computed from the matrix are 74.6%, 73.94%, 71.8% and 74.48%, respectively, as shown in
Table 8.
When the Decision Tree algorithm is applied to the dataset, it yields a result of 93.87% accuracy.
Figure 12c shows the confusion matrix for the proposed research. The precision, recall, F1-score and accuracy values computed from the matrix are 92.77%, 90.51 %, 91.57% and 93.87%, respectively, as shown in
Table 8.
The fourth algorithm used for the evaluation of the proposed research is the Logistic Regression. When the LR algorithm is applied to the dataset, an accuracy of 86.48% is obtained. The precision, recall, F1-score and accuracy results obtained by using the LR algorithm on the dataset are displayed in the confusion matrix
Figure 12d. The Tp, Tn, Fp and Fn parameters are used to calculate these values. The obtained values of precision, recall, F1-score and accuracy are 88.32%, 78.76%, 82.3% and 86.48%, respectively. The last algorithm used for the evaluation of the proposed research is the SVM. When the SVM algorithm is applied to the dataset, it yields an accuracy of 87.67%. The precision, recall, F1-score and accuracy results obtained by using the Linear SVM algorithm on the dataset are shown in confusion matrix
Figure 12e. The computed values of precision, recall, F1-score and accuracy for the SVM algorithm are 89.0%, 81.09%, 84.21%, and 87.67%, respectively, as shown in
Table 8.
Figure 13 shows a graphical performance comparison of different ML algorithms for the Sinopharm vaccine dataset. It can be evidently seen that the Decision Tree algorithm outperforms the rest thereby achieving the highest accuracy for sentiment classification.
4.6. Comparison with State-of-the-Art Research
This article presents a performance comparison of five different ML algorithms for sentiment classification. All of these ML models were deployed using the COVID-19 vaccination tweets dataset that was collected in this study and the annotated sentiment dataset. Training and testing were carried out with the help of the annotated datasets provided by TextBlob.
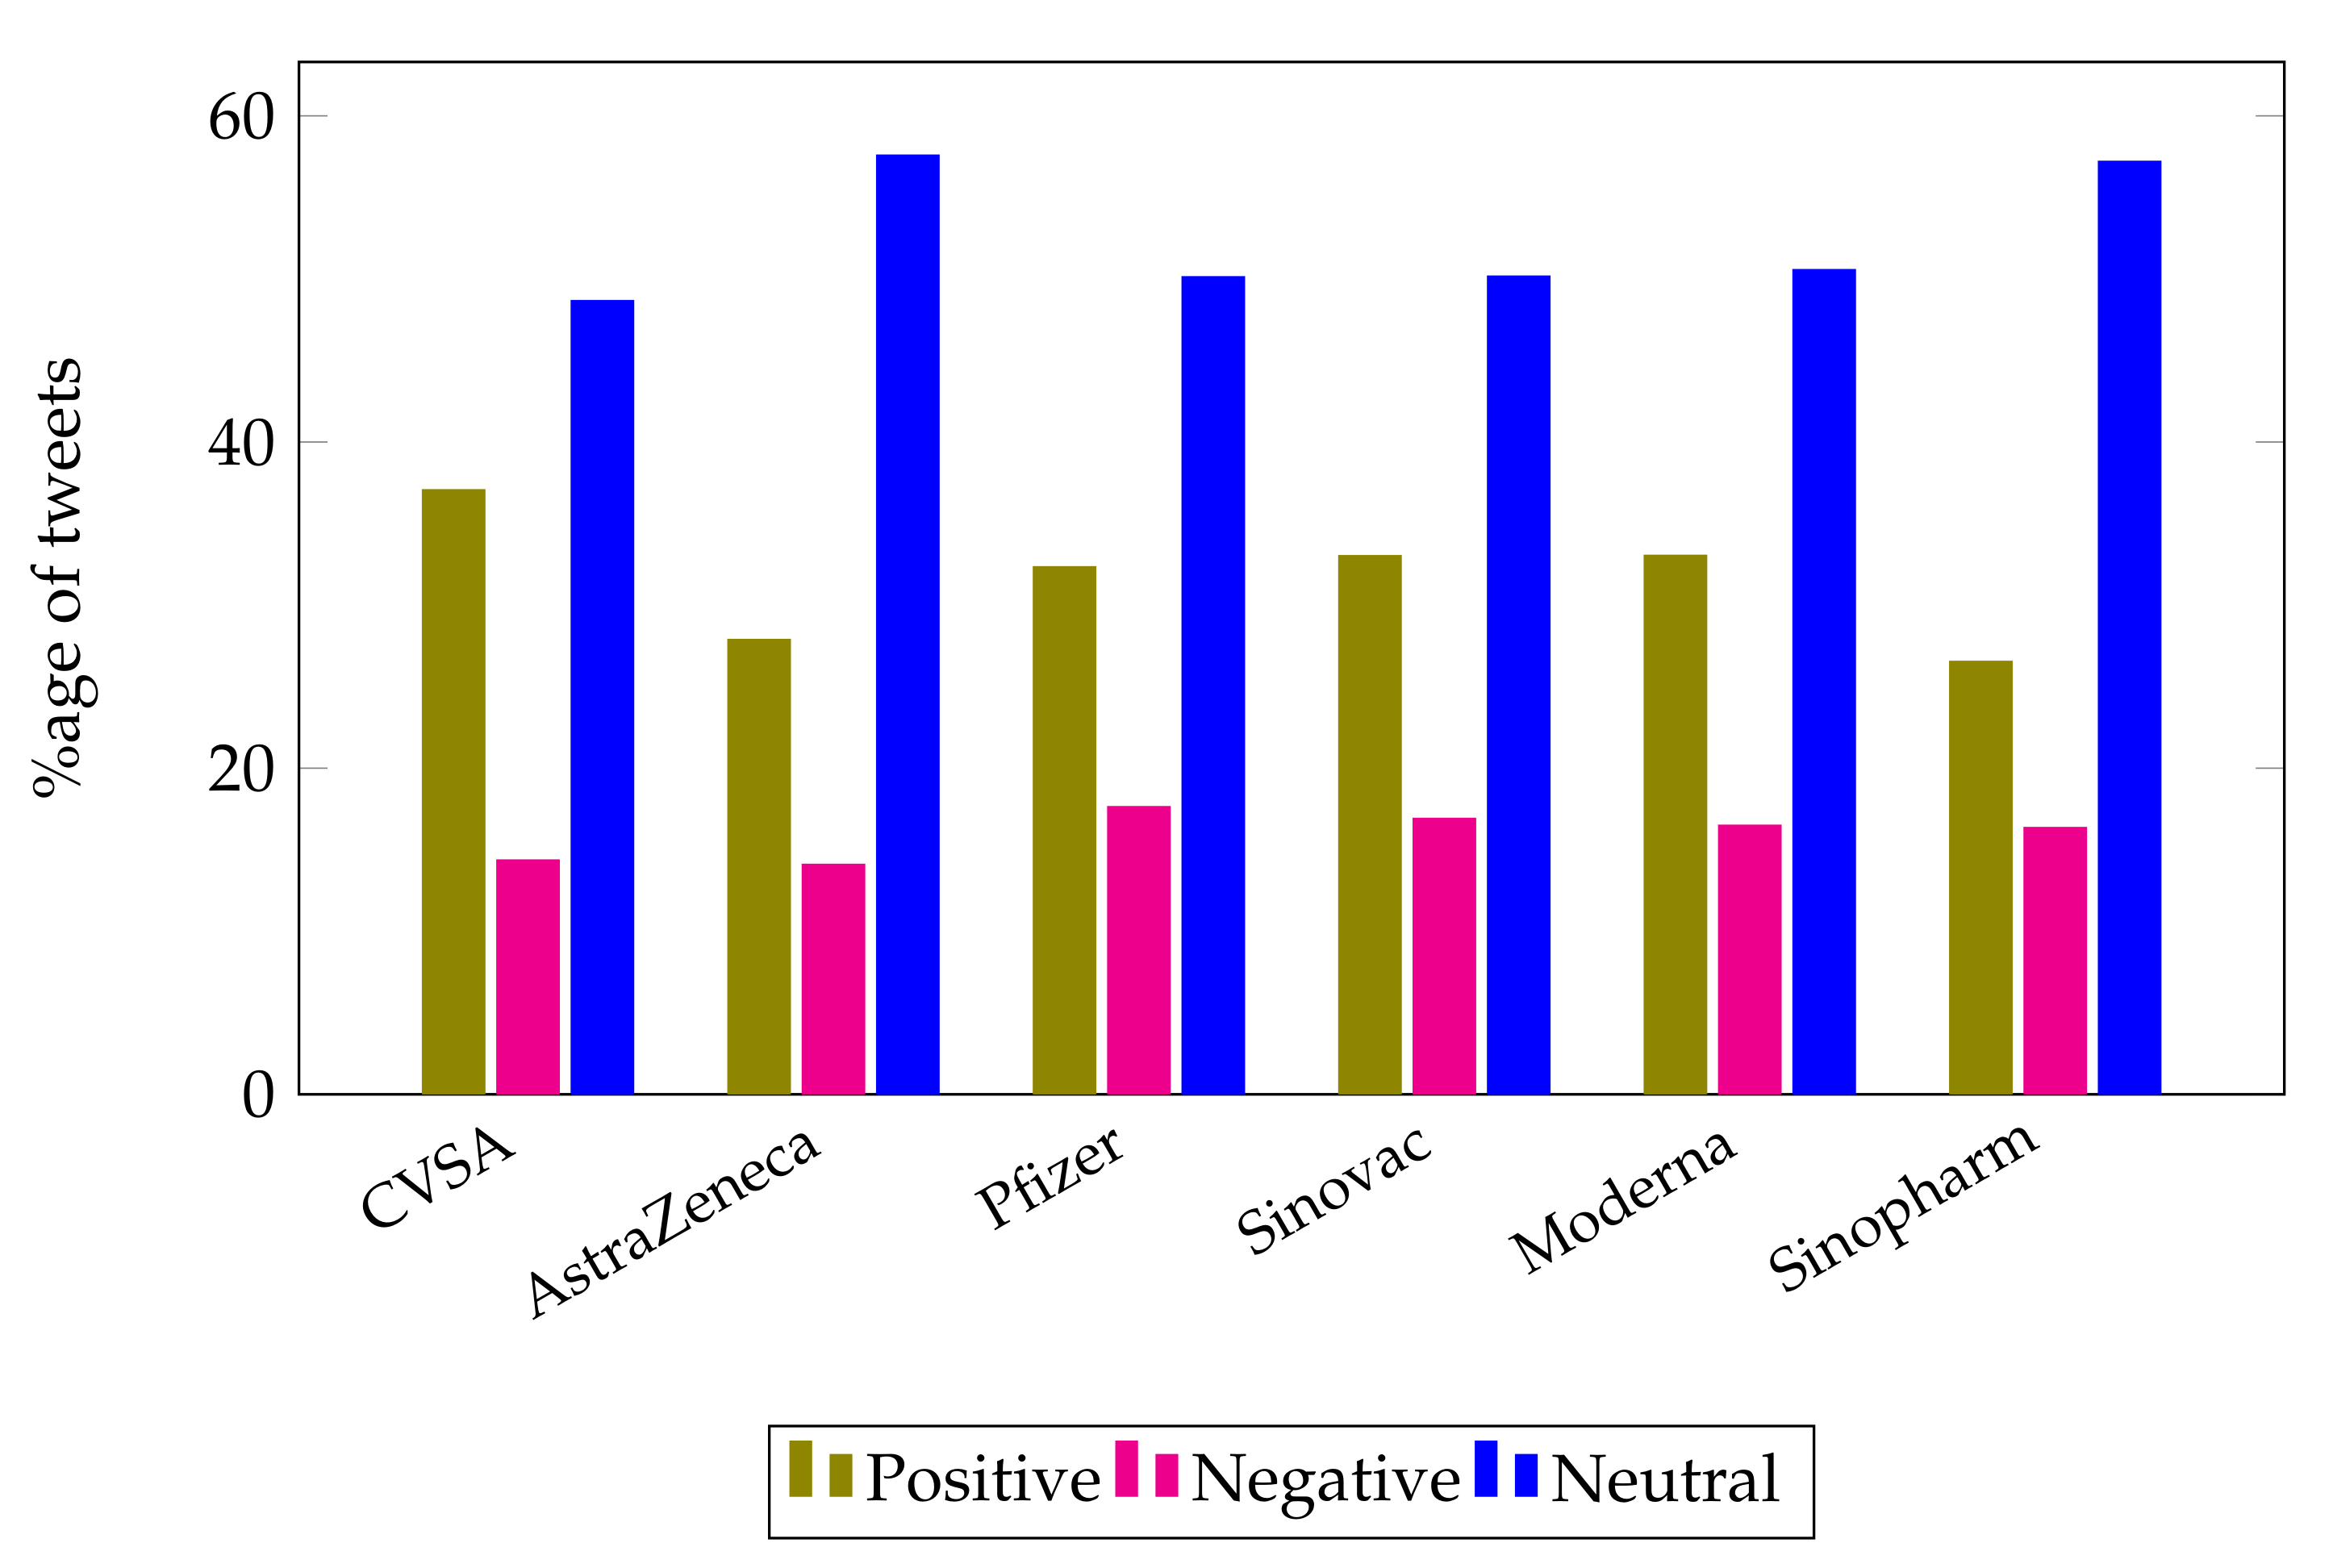
Figure 14 shows a graphical performance comparison of accuracy achieved by different ML algorithms on all datasets used in this research. Each bar illustrates the performance of different ML classifiers for the different tweet datasets. For example, the first bar shows the classification accuracy of different ML classifiers for CVSA dataset. Likewise, the other bars demonstrate the results achieved by various ML algorithms for AstraZeneca, Pfizer, Sinovac, Moderna and Sinopharm tweets datasets, respectively. It can be evidently seen, that the highest performance for all datasets is obtained with the Decision Tree algorithm as compared to the other ML classifiers.
To represent the significant performance of the proposed research, this subsection presents a comparison in the context of other studies.
Table 9 demonstrates the accuracy of results from state-of-the-art related research. As discussed earlier, the DT algorithm achieves the highest performance in the case of all datasets used for this research. Hence, the accuracy achieved using DT is shown in comparison with the state-of-the-art research in
Table 9. Results suggest that the proposed approach is significantly better than other studies in terms of accuracy. Despite using the different models in other studies, the proposed research showed superior performance with the Decision Tree classifier and obtained better accuracy for sentiments, which is significantly higher than previous studies. The key findings of this research can be summarized as follows:
The ratio of positive sentiments is high as compared to the ratio of negative sentiments in tweets related to COVID-19 vaccinations as can be seen in
Figure 15. The highest percentage of positive opinions is observed for the Moderna vaccine based on people’s sentiments.
Based on data on people’s perceptions, the ratio of sentiments for positive, neutral and negative sentiments may vary. However, on average, it may be concluded that the number of neutral sentiments is higher than the positive and negative sentiments.
The Decision Tree ML model proved to perform better as compared to the other four models. Tree-based ML models can be a good choice for obtaining higher classification performance when dealing with tweets’ textual data.
5. Conclusions
The WHO encourages rapid immunization of the whole population to reduce the danger of disease transmission and death. The government authorities, medical experts, and social workers recommend getting the vaccination, however, people have expressed worries and misgivings about the potential for side effects and other medical consequences. Sentiment analysis of social trends can help in effective decision making. This paper presents a framework for analyzing people’s worldwide perceptions and attitudes towards Covid-19 vaccines AstraZeneca, Pfizer, Sinovac, Moderna, and Sinopharm, respectively. We have evaluated the performance of five different machine learning classifiers for sentiment analysis. The quantitative comparisons demonstrate that the proposed research achieves better performance as compared to the state-of-the-art research. Based on the experimental results, the highest performance is obtained using the Decision Tree classifier, i.e., 93.0% using CVSA dataset, 93.87% using Sinopharm dataset, Sinovac dataset 92.8%, Pfizer dataset 91.07%, AstraZeneca dataset 90.94%, and for Moderna dataset 88.01%, respectively. In future, we aim to enhance the classification accuracy by applying different pre-processing techniques such as creating a normalization dictionary. Another approach to enhance the performance can be the implication of oversampling or under-sampling techniques such as SMOTE to handle imbalanced data. Additionally, the parameters in each classification model can be fine-tuned to obtain an increase in classifier performance. In future, the performance of deep learning models will be accessed for sentiment classification in order to achieve better accuracy results.


 ,
, 


