1. Introduction
During text classification, such as medical data with machine learning or deep learning techniques, employing terms such as features using vector space representation can cause a high dimensionality of feature space and sparsity [
1,
2]. This kind of condition introduces some issues, including high computation cost in data analysis and reducing the classification accuracy performance [
3]. The present study enhanced the classifier’s performance in classifying a diabetes medical condition [
4]. To address this concern [
5], the majority of studies introduce feature selection techniques [
6], which is a feature dimensionality reduction approach [
7]. Several evolution techniques were used for feature selection subset search as a sort of optimization issue, which include particle swarm optimization (PSO), ant colony optimization (ACO), and genetic algorithm (GA) [
8]. With well-optimized parameter tuning, PSO can locate optimal parts of the complicated search space and effectively traverse the search space to obtain global optima, but PSO comprises several numeral mathematical operations that need user-specified parameters with difficult-to-find optimal values [
9]. ACO is inspired by ants’ optimization behavior and effectively discovers optimum features by using ants’ shortest path; however, it suffers from insufficient pheromone update rules. On the other hand, GA is more ideal for large-scale issues, since it replicates the process of natural selection in producing an optimal feature set. Its effectiveness in feature selection is due to its capacity to search for solutions in a large search area and its high performance in optimization problems.
Running GA as a search function in many applications, on the other hand, has certain acknowledged flaws, such as premature convergence [
10]. The population diversity problem in feature selection, where simple GA starts with a varied population but after a few generations converges to a point where each chromosome tends to have similar solutions, is one of the causes that contribute to this difficulty. Premature convergence is one of the challenges in feature selection, which claims that it is one of the drawbacks when applied using basic GA. This constraint makes it difficult for the algorithm to find better answers in succeeding generations. The authors claimed that the aimless searching or simply randomized process in the crossover operator to create offspring might affect the algorithm’s convergence rate. Several studies [
11] applied GA feature selection and recorded inadequacy when selecting suboptimal features.
In this study, we proposed Enhanced Genetic Algorithm (EGA), which seta variable slice point on the size of the gene to be interchanged for every offspring generated and applied feature frequency scores in deciding the interchanging of genes. Our evaluation proved that our proposed technique obtained better results than standard GA.
Contributions: The main contributions of this study are the following:
- (1)
Improve genetic algorithm feature selection technique with improved convergence properties that better explore good solutions in the search space.
- (2)
Divide the dataset randomly into smaller subsets using the average splitting technique and separately model each subdivision using the decision tree classifier.
- (3)
Improve the performance of the proposed homogenous ensemble technique by using the accuracy ranking technique to retain excellent performing base models and reject worse performing ones.
To effectively evaluate the performance of our proposed scheme technique, the Pima Indian Diabetes Dataset (PIDD) was used. A comparative study is then conducted using well-known ensemble techniques, including XGBoost, Gradient boost and Catboost, as well as some recently published studies. Finally, our proposed scheme performance was evaluated using Accuracy, F1-score, Recall, Precision, and Auroc metrics.
2. Literature Review
In recent years, predictive classification using machine learning algorithms has been vibrant among data science researchers. The accuracy obtained by most researchers is reasonably good and acceptable (70–85%); see, for instance [
12,
13,
14]. Nevertheless, there is a lot to be understood in this area. This section presents some ensemble learning techniques and genetic algorithm feature selection related to our proposed study. Machine learning techniques can be applied in a variety of disciplines due to their excellent powerful classification capabilities. Therefore, there are many research studies on diabetes prediction continuously formulating novel techniques to improve classification accuracy performance. An example of such a technique is an ensemble learning method. Perveen et al. (2016) in [
15] compared the performance of Adaboost, J48 decision tree, and bagging using the Canadian primary care sentinel surveillance network medical dataset to classify diabetic and non-diabetic patients. The results obtained after the experiment using the weka data-mining toolkit show that the Adaboost ensemble technique outperforms the bagging ensemble technique and the J48 decision tree technique. Vijayan and Anjali (2016) in [
11] compared decision tree, SVM and naïve Bayes as Adaboost ensemble technique base classifiers. The authors constructed integrated models based on the three mentioned base classifiers for the early prediction of diabetes. The PIDD dataset was used to compare and evaluate the performance of the proposed integrated AdaBoost classifiers. The study revealed that integrating a single machine learning base classier yielded higher performance than a single machine learning classifier. The authors in [
16] applied different machine learning ensemble techniques such as bagging, AdaBoost and random forest along with the PSO feature selection method on a heart disease medical condition dataset. The experimental results show that bagging ensemble techniques outperformed other ensemble classifiers. Maclin (1999) in [
17] compares the performance of decision tree, neural network, bagging and boosting ensemble techniques.
The study’s experimental results demonstrated that bagging and boosting performed better than single classifiers such as decision tree and artificial neural network. The study also revealed that bagging outperformed boosting ensemble technique. Kala et al. (2011) in [
18] proposed a new, improved technique for diagnosing breast cancer using Artificial Neural Networks (ANN). This study’s proposed model was used to solve breast cancer prediction using a genetic algorithm to select the best features in a dataset and Artificial Neural Network for classification. In conclusion, the above study was shown to be both efficient and scalable. In what follows, Paul and Choubey (2017) in [
5] proposed a new hybrid algorithm using a genetic algorithm (GA) for selecting the most suitable features in the PIDD dataset, and in [
19] the Radial Basis Function Neural Network (RBFN) was used for classifying patient with diabetes and non-diabetes. The authors concluded that the hybrid method was better than the RBFN alone. Next, the authors applied in [
20] a genetic algorithm feature selection technique to find the most relevant features and eliminate the redundant features using different medical datasets. The SVM classification technique was applied. The authors reported a significant classification improvement across the datasets when GA feature selection was applied compared to when all features were used. In our current study, we aim to build and develop on what has been previously accomplished and come up with a well-performing ensemble learning technique for T2DM prediction.
3. Proposed Scheme
3.1. Dataset Description
The Pima Indian Diabetes Dataset (PIDD) was used to conduct our study, which is publicly available on the Kaggle dataset repository in CSV format [
20]. This dataset contains young females of at least 21 years of age of Pima Indian heritage living around Phoenix, Arizona, in the USA. The dataset contains 768 records of patients—268 (34.9%) patients tested positive for diabetes, 500 (65.1%) patients tested negative for diabetes—and nine attributes, including class variables. The dataset attributes and statistics are presented in
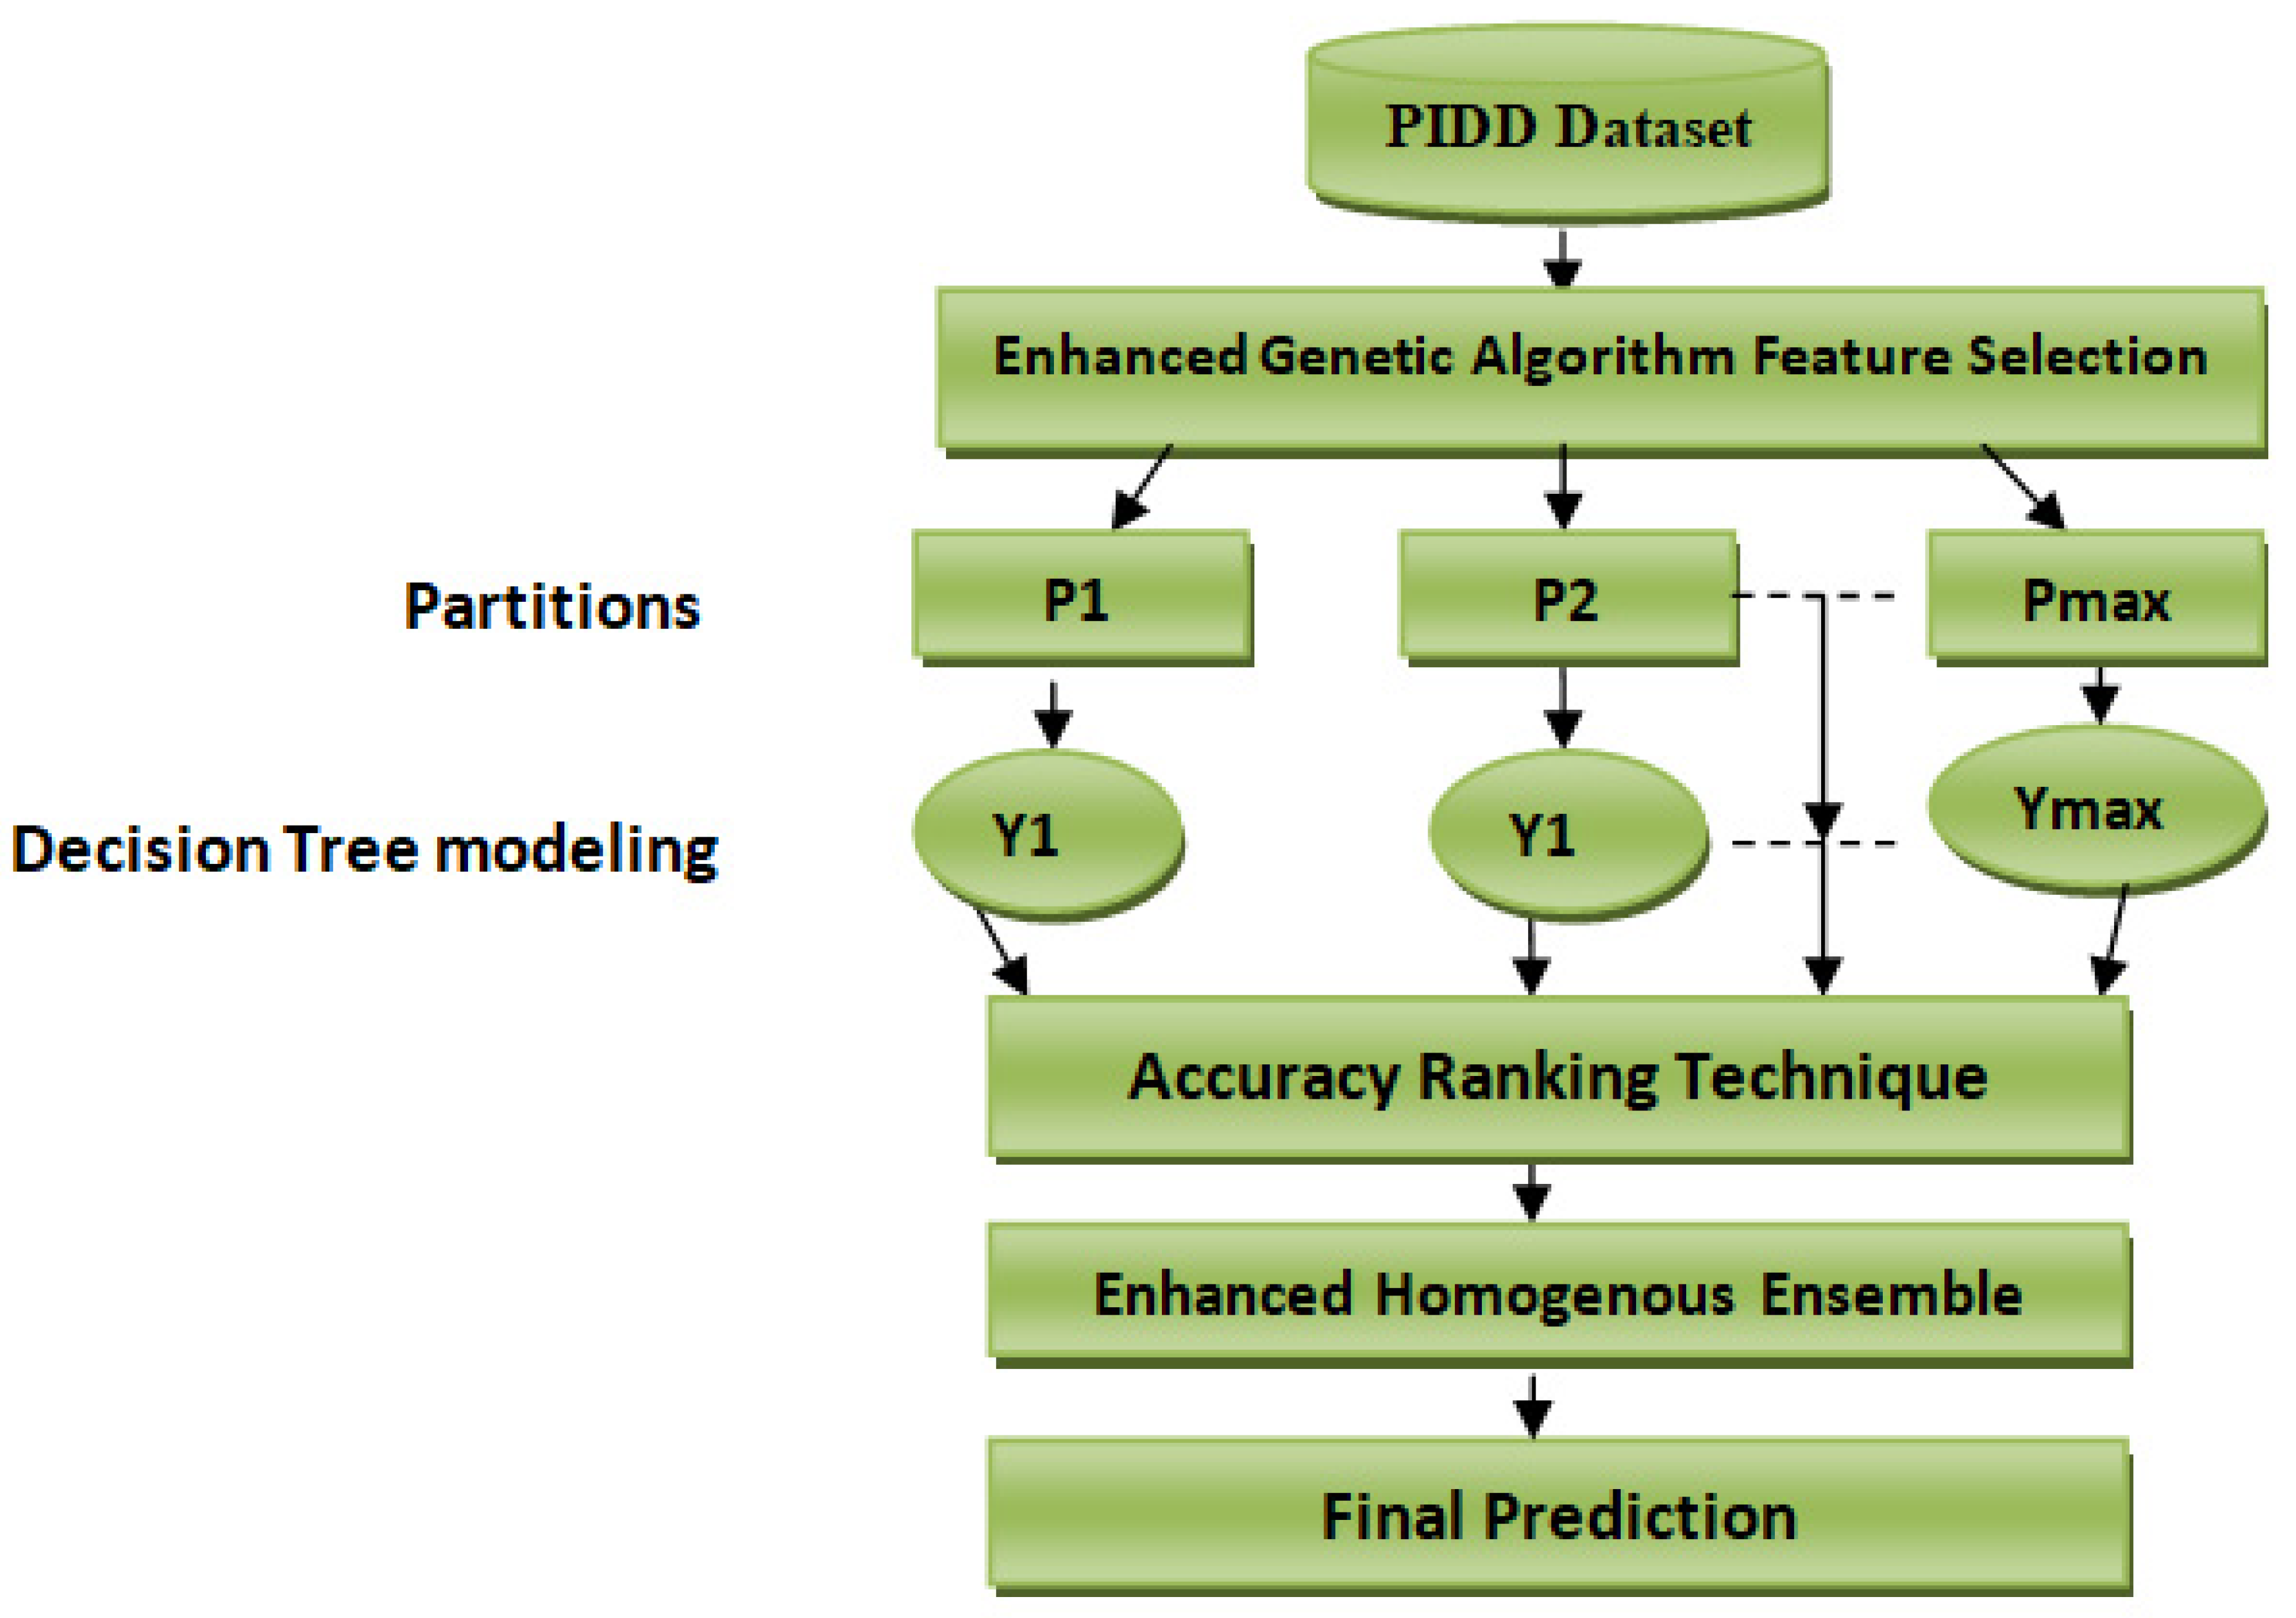
Table 1. This dataset reports a class imbalance that will occur when there is a great difference between minor classes and major classes in classes with binary values (0 or 1). This study’s primary purpose is to predict whether a person would test positive using diabetes medical test results that are provided in the dataset. We solve a binary class problem with a class value “1” being interpreted as a patient who tested positive for diabetes. The class value “0” is interpreted as a patient who tested negative for diabetes. Our proposed scheme is shown in
Figure 1.
3.2. Data Cleansing
Missing Values
Missing values imputation is a critical preprocessing approach. The Pima Indian Diabetes Dataset contains several missing and impossible figures for a normal living human being, such as 0 glucose, 0 blood pressures, 0 skin thickness, 0 insulin, and 0 BMI, indicating that the real value is missing. Missing values affect the performance of the classifier severely. So, it is essential to handle the missing values carefully. We applied K-mean clustering with a based distance data imputation technique [
21].
3.3. Data Subdivision
In this section, the proposed data subdivision technique will be presented. Let dataset (PIDD) be denoted by DT, where DT =
. The dataset’s independent variables are denoted as:
denotes the outcome variable of the dataset where
. For example, let one independent dataset variable of the different instance be:
The weighted average of
is computed as:
Data with additional weight contribute more to the weighted average than those with low weight. From Formula (3), weight can never be negative, although it can be 0.
To develop a proposed data subdivision algorithm that randomly subdivides the dataset into reduced subsets, i.e., each subset, the algorithm will randomly pick independent variable sets. The randomization technique can yield any amount of trees, and this will reduce variance and improve performance.
Let the original dataset be DT, which is the root node, and it represents the whole population, which can be divided into distinct homogenous sets. The algorithm will randomly pick a data point from variable sets (features). The data point is substituted in the set for further selection. Dataset DT is divided into two subsets using average based partitioning rules:
Each child is considered separately, i.e., and as the root node; as in (4), generate and , while gives and . This partitioning process will continue until the termination rule is reached. To ensure that the dataset is not over partitioned, we proposed a maximum tree height stopping technique, where terminates the algorithm from infinite. The tree halts growing when ; in the root node, the tree height is H = 0 and H1 = 1 for and .
After the dataset has been divided into smaller subsets, the decision tree classifier is utilized to model each partition independently. As a result, decision tree classification is characterized by a high degree of robustness and interpretability. In addition, the decision tree utilizes Gini impurity to determine the likelihood of a wrongly classified variable when randomly selected.
is the probability of an object being classified into a particular class, and we now have a forest of trees all fittedwith the decision tree algorithm.
3.4. Feature Selection Using Enhanced Genetic Algorithm (EGA)
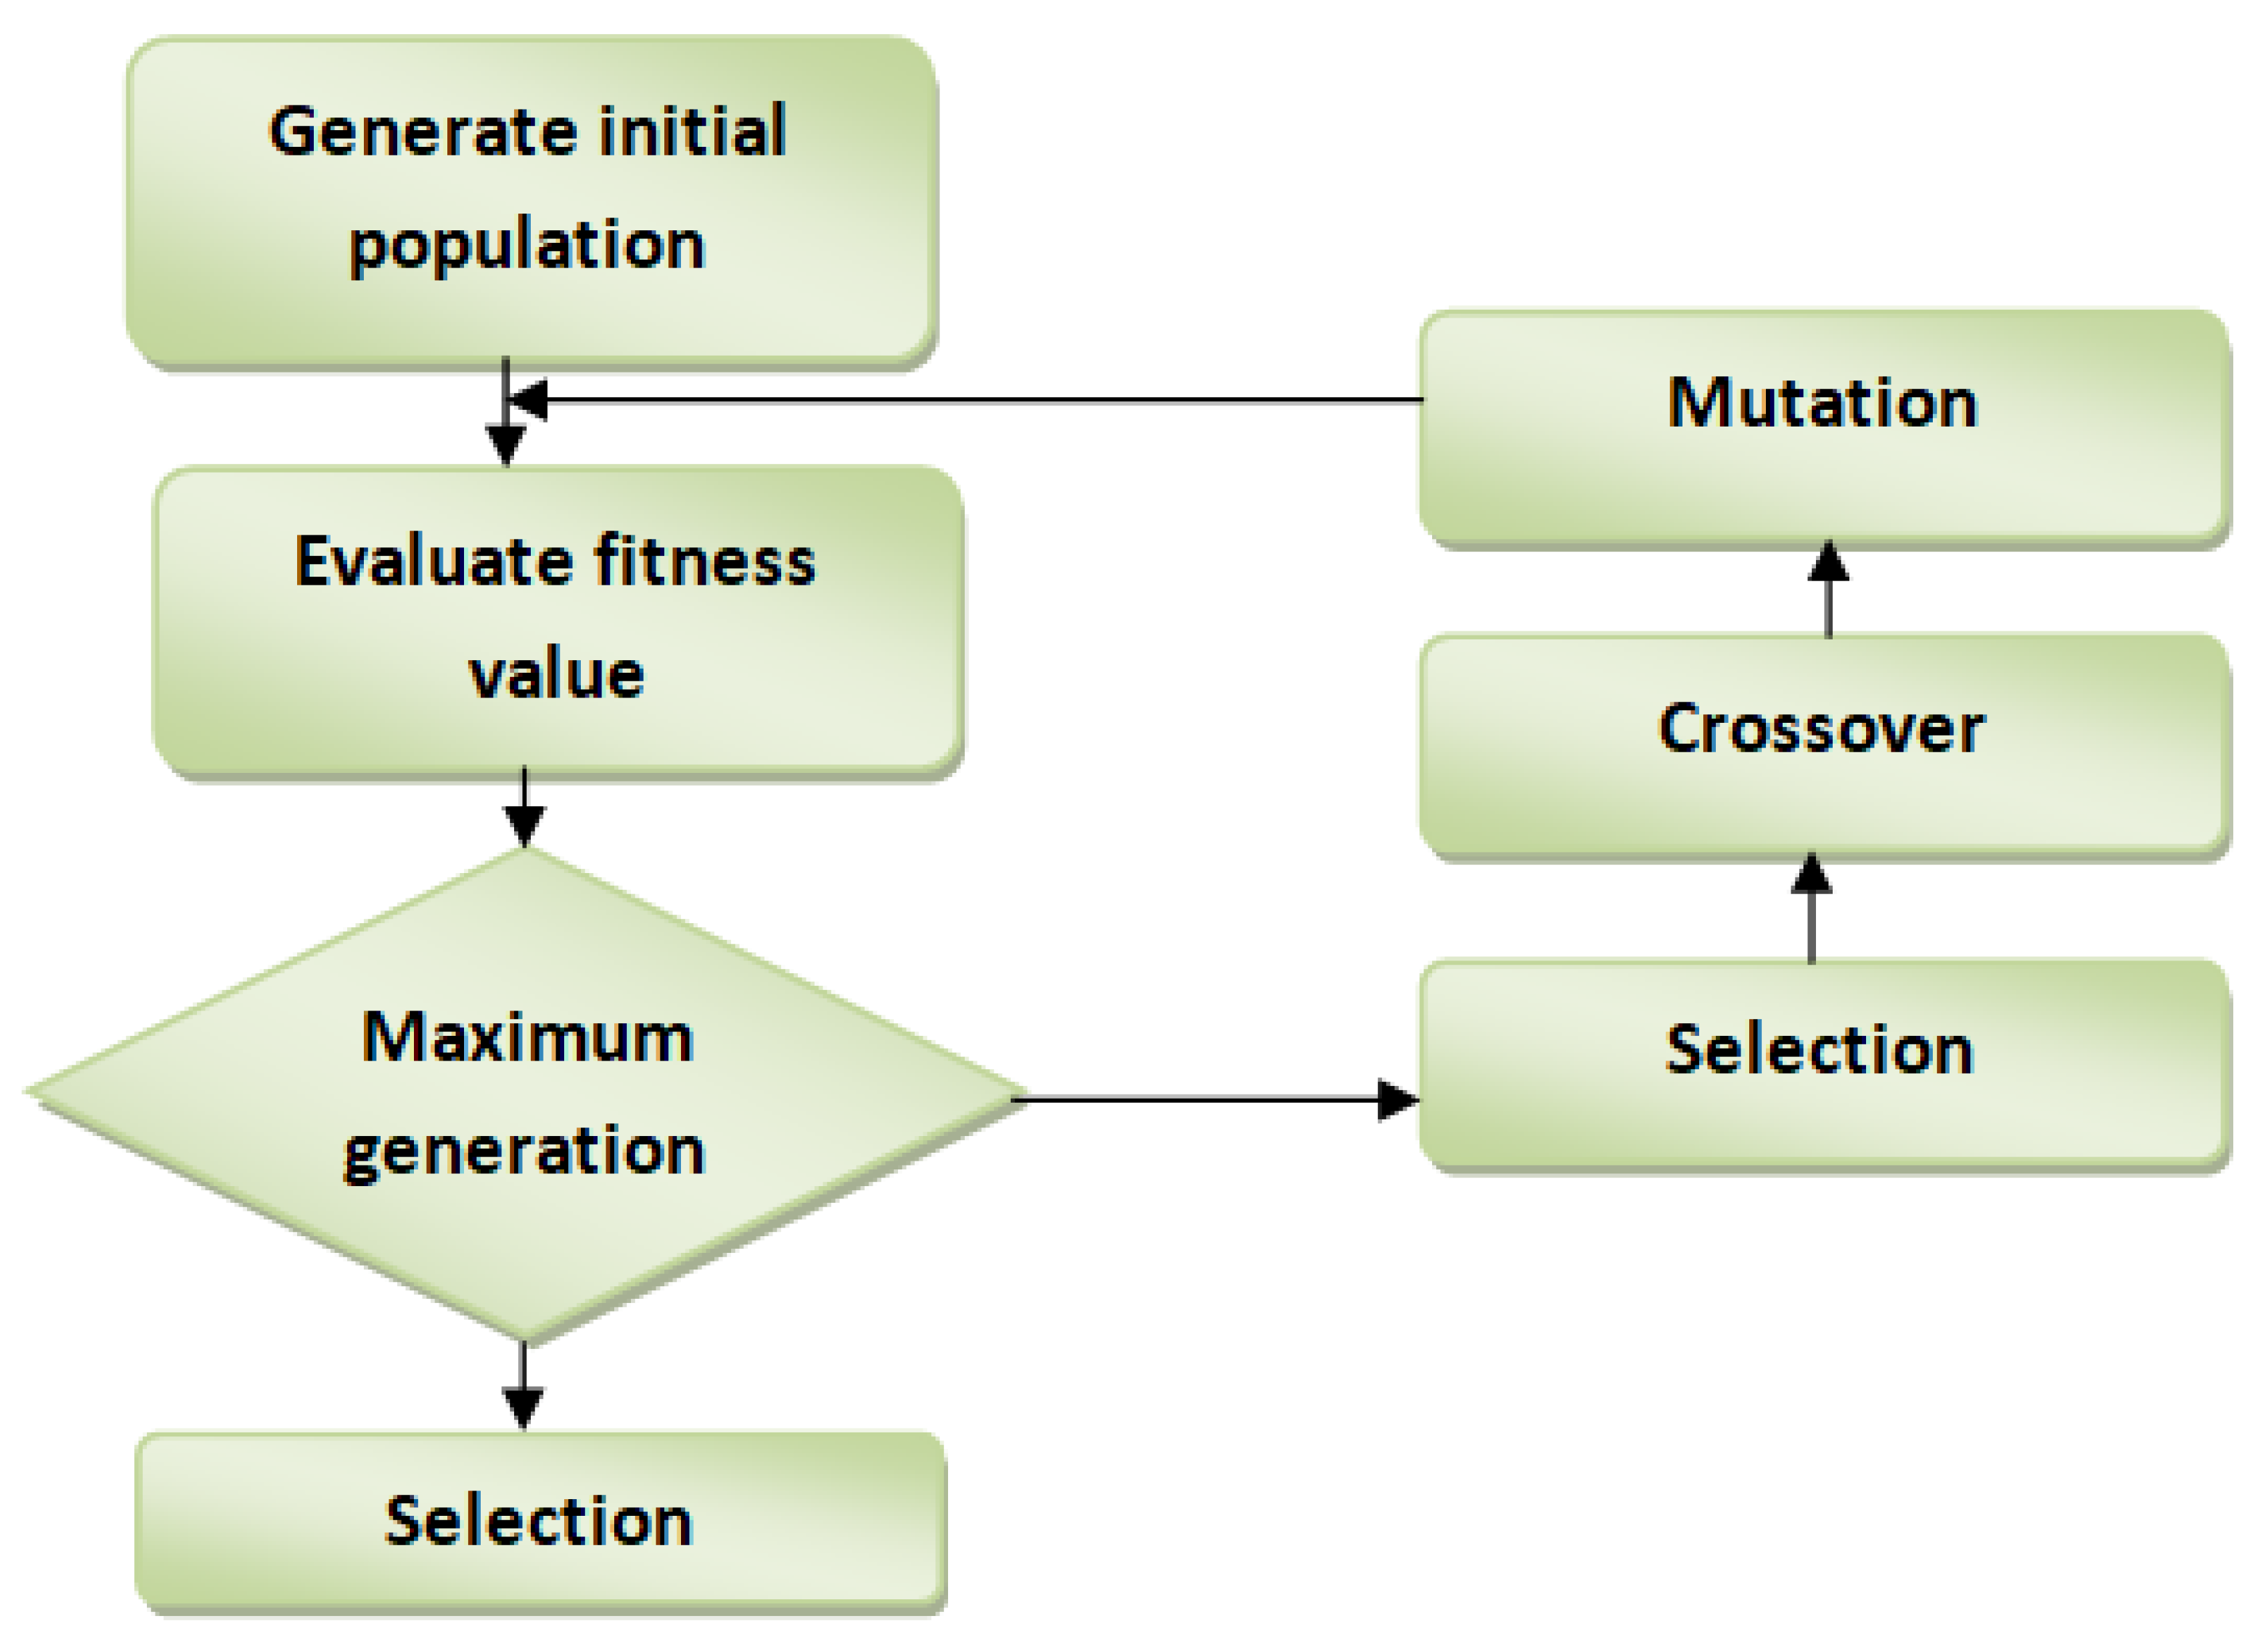
GA imitates the natural selection process in obtaining the optimal feature set in a given dataset. It can search for the solution in an immense search space, and its fantastic performance in the optimization problem is due to its success in the feature selection technique. GA is well known to have a premature convergence flaw. Simple traditional GA starts with a diverse population after a small number of generations converged to a certain point where each chromosome will contain a similar solution [
22].
Figure 2 displays the workflow of the GA feature selection technique. Premature convergence is the biggest challenge in feature selection, primarily when implemented using simple GA. The will hamper the algorithm from looking for a better solution in each subsequent generation. In this study, EGA was improved in crossover operator by:
EGA is deployed as a feature subset optimizer, therefore increasing the performance of the machine learning classifiers.
EGA Procedure
Chromosome Encoding: The binary encoding of chromosomes is widely adapted. In our study, the chromosome is a bit string with the value 0 and value 1. Value 1 indicates the feature is included, while 0 means the feature is not included in the feature set with the length equal to the total number of features.
Population Initialization: A whole number from 0 and 1 is randomly populated to each chromosome with a length equal to the total number of features in the dataset.
Fitness Function: In the current population, each chromosome fitness is computed as follows:
where F represents active or selected dataset features, and BF is the balancing factor between the features subset size and machine learning classification accuracy. Acc (F) is the measured accuracy score of the ML algorithm on the already selected feature subset.
Selection: Two parents’ chromosomes selection is based on the ranking selection approach. This will ensure that chromosomes with superior fitness will not be lost in the forthcoming generation; this will give more opportunity to the supreme chromosome to mate in the pool to generate better offspring.
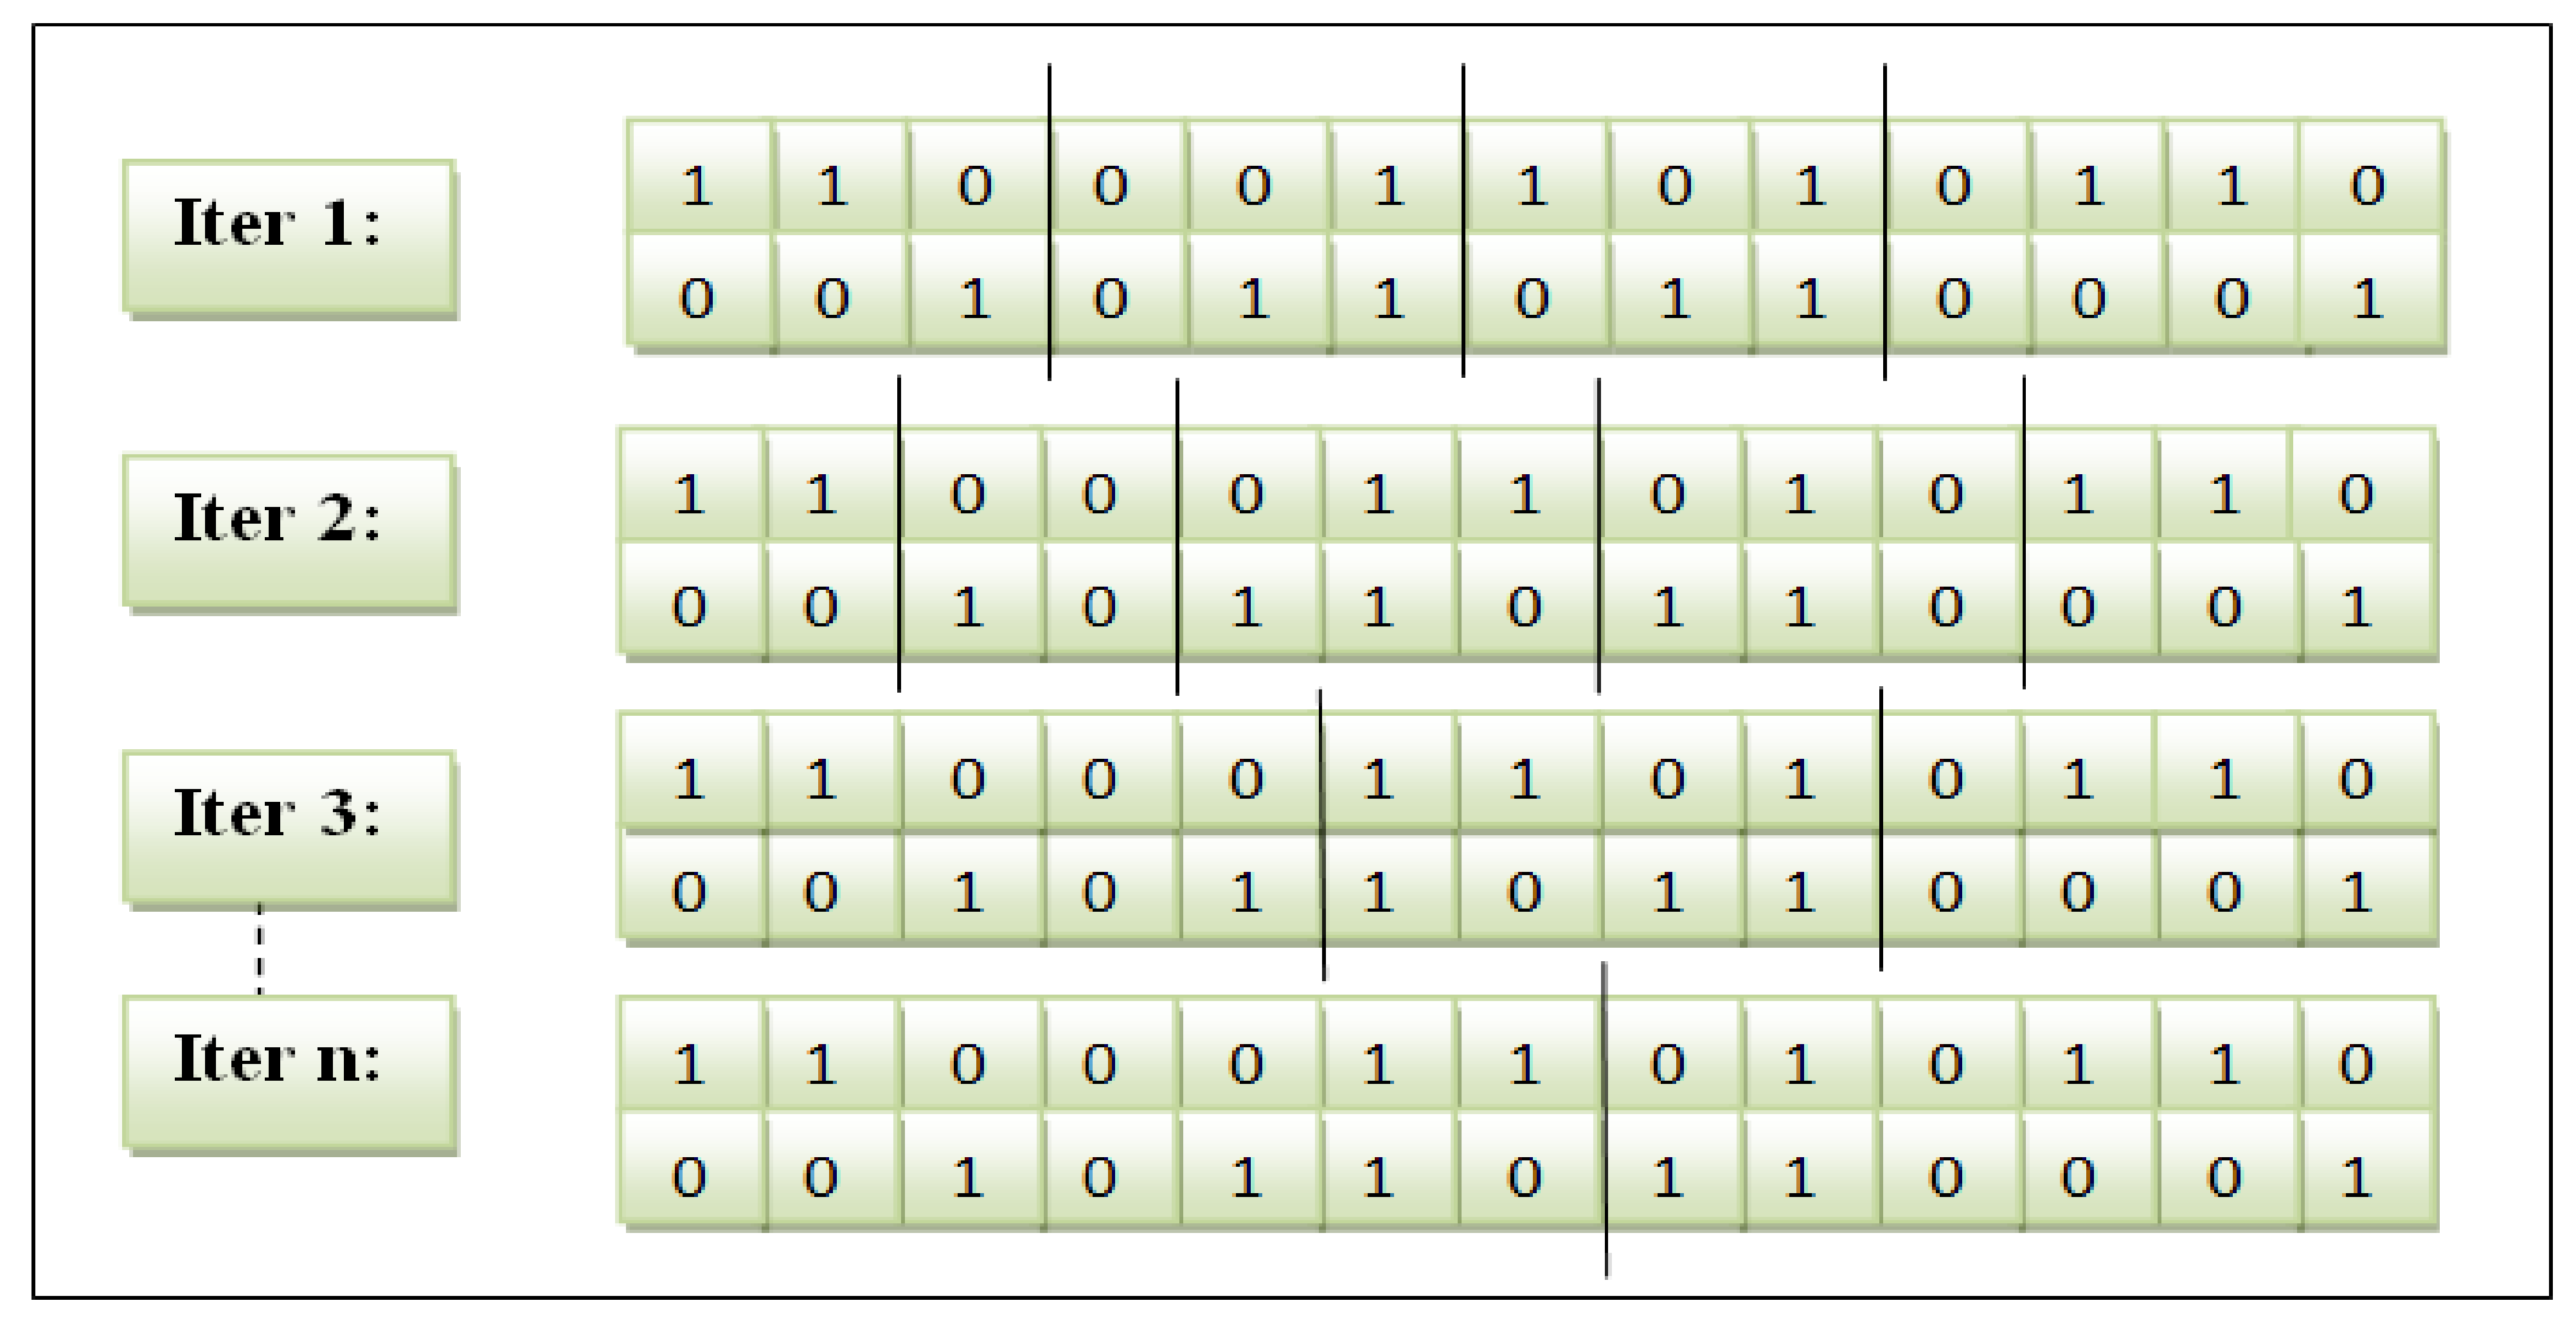
Crossover: The genetic algorithm is enhanced on this operator as follows:
The crossover point was improved by adjusting a placeholder slice point for the genes to be interchanged when generating offspring.
The crossover operator is managed and controlled by a collective feature occurrence score to decide on swapping the selected genes.
The feature subset showed by a particular cut point was calculated to obtain the cumulative frequency score. This procedure is similar to other feature subsets. Afterwards, the subset of both parents was compared. The feature subset with a more excellent score is stored as child1. The different feature subset is accumulated as child2. The variable-slicing multi-point crossover is illustrated in
Figure 3.
Mutation: The offspring undergo a mutation process using mutation probability such as bit flipping.
Population Update: When a certain number of chromosomes have been reached in the population, a new population will be generated and passed to the next generation.
GA Parameters: Population size—300, Number of generation—10, Crossover operator—2-point crossover, Crossover probability—0.6, Mutation operator—bit flip, Mutation probability—0.333, Selection—Roulette wheel.
3.5. Enhanced Ensemble Algorithm
To compute a homogenous ensemble from multiple base decision tree models classifiers, first, we identified and retained the best-performing base classifiers and removed the worst-performing base classifiers. Then, a homogenous accurateness weighted aging classifier was then utilized to compute ensemble from only the best-performing decision tree models.
Let
indicate the occurrence of the correct prediction of classifier
and let
denote the total number of iterations that the formula has been used for in the ensemble. The classifier’s weight is denoted by
and is represented as:
where
represents the mean accurateness of the classifiers in the ensemble technique. The final prediction of the homogeneous ensemble technique
is obtained as:
The proposed ensemble technique functions by assigning weights to the numerous classifier algorithms, depending on the classifier algorithm accuracy and time spent in the ensemble. If the classifier algorithm’s weight drops below a determined threshold, the classifier algorithm is removed from the ensemble. By utilizing accuracy as the optimization criterion, this ensures that the ensemble technique attains the optimal results.
3.6. Model Validation
There are two main validation techniques to validate the machine learning model performance: the hold-out technique and the K-fold cross-validation technique. Each method’s choice primarily depends on the magnitude of the dataset and each classification problem’s goal. The hold-out technique splits data into two: that is, training data and testing data. The K-fold cross-validation technique is the technique that has been applied in this study; this is a preferred and widely applied validation technique in many other studies. In this technique, the data are split into K equivalent size of folds. K-1 groups are used for the model’s training, while the rest is used for the classifier. This procedure will be iterated until each fold of 10 folds has been used as a testing set and the same case as to each k. The accuracy of the classifier is computed [
23]. The final evaluation is computed based on the accuracy mean. Our study applied k = 10, representing 90% of the training data and 10% used for testing. This validation method has the following merits:
4. Experimental Result
4.1. Experimental Setup
This section explains the experimental results obtained after evaluating our proposed enhanced genetic algorithm for optimal feature selection and improved homogenous ensemble learning for classification in detail. The experiments were conducted on a 3.3 GHz Intel dual-core i3 processor with 8 GB of RAM running the Windows 10 operating system to evaluate the proposed scheme’s performance. A Jupyer notebook (3.7.6) was used for implementation, and Python Programming language (3.8) was used to analyze the dataset and classify T2DM. Various libraries, such as genetic algorithm, numpy, pandas, matplotlib, and scikit-learn, were used to perform different tasks. The simulation was performed to evaluate our proposed scheme against other ensemble techniques such as XGBoost, Gradient boost and CatBoost.
4.2. Performance Evaluation Metrics
This section discusses the performance evaluation of the improved proposed homogenous ensemble technique for effectiveness and efficiency in the early diagnosis and prediction of T2DM. The performance evaluation of any machine learning classifiers is measured in terms of accuracy metrics; however, relying on only accuracy metrics could be misleading from time to time. Therefore, we used other metrics, such as precision, recall, F1-score, and area under the curve (AUC), and a 10-fold cross-validation technique to evaluate our proposed binary classification model’s performance.
The efficiency of the machine learning classifier algorithms is evaluated using parameters that are obtained from the confusion matrix, which is True Positive (TP), which means T2DM is detected as T2DM, True Negative (TP), which means Normal predicted as Normal, False Positive (FP) which means Normal is predicted as T2DM, and finally False Negative (FN), which means T2DM predicted as Normal.
Accuracy is defined as the metrics determining the number of correctly classified classes from the total samples in the testing dataset. The accuracy metric is calculated as follows:
Precision is the total number of correct positive results obtained divided by the total number of positive results predicted by the classifier algorithm. It is calculated as follows:
Recall: The total number of correct positive results is obtained divided by the total number of all relevant samples. It is calculated as follows:
F1-Score: It is used to evaluate a test’s accuracy. The F1-score is the combination Mean between Precision and Recall metrics. The range for the F1-score is [0, 1]. It tells you how accurate and robust your classifier is. It is calculated as follows:
AUC (Area Under Curve) is the performance metrics founded on the varying threshold values for binary classification problems. The AUC metric shows the model’s ability to distinguish the binary classes. The higher the AUC, the better the model. It is calculated by plotting the TPR (True Positive Rate), i.e., sensitivity or recall vs. FPR (False Positive Rate), i.e., specificity, at various threshold values.
4.3. GA Convergence Properties
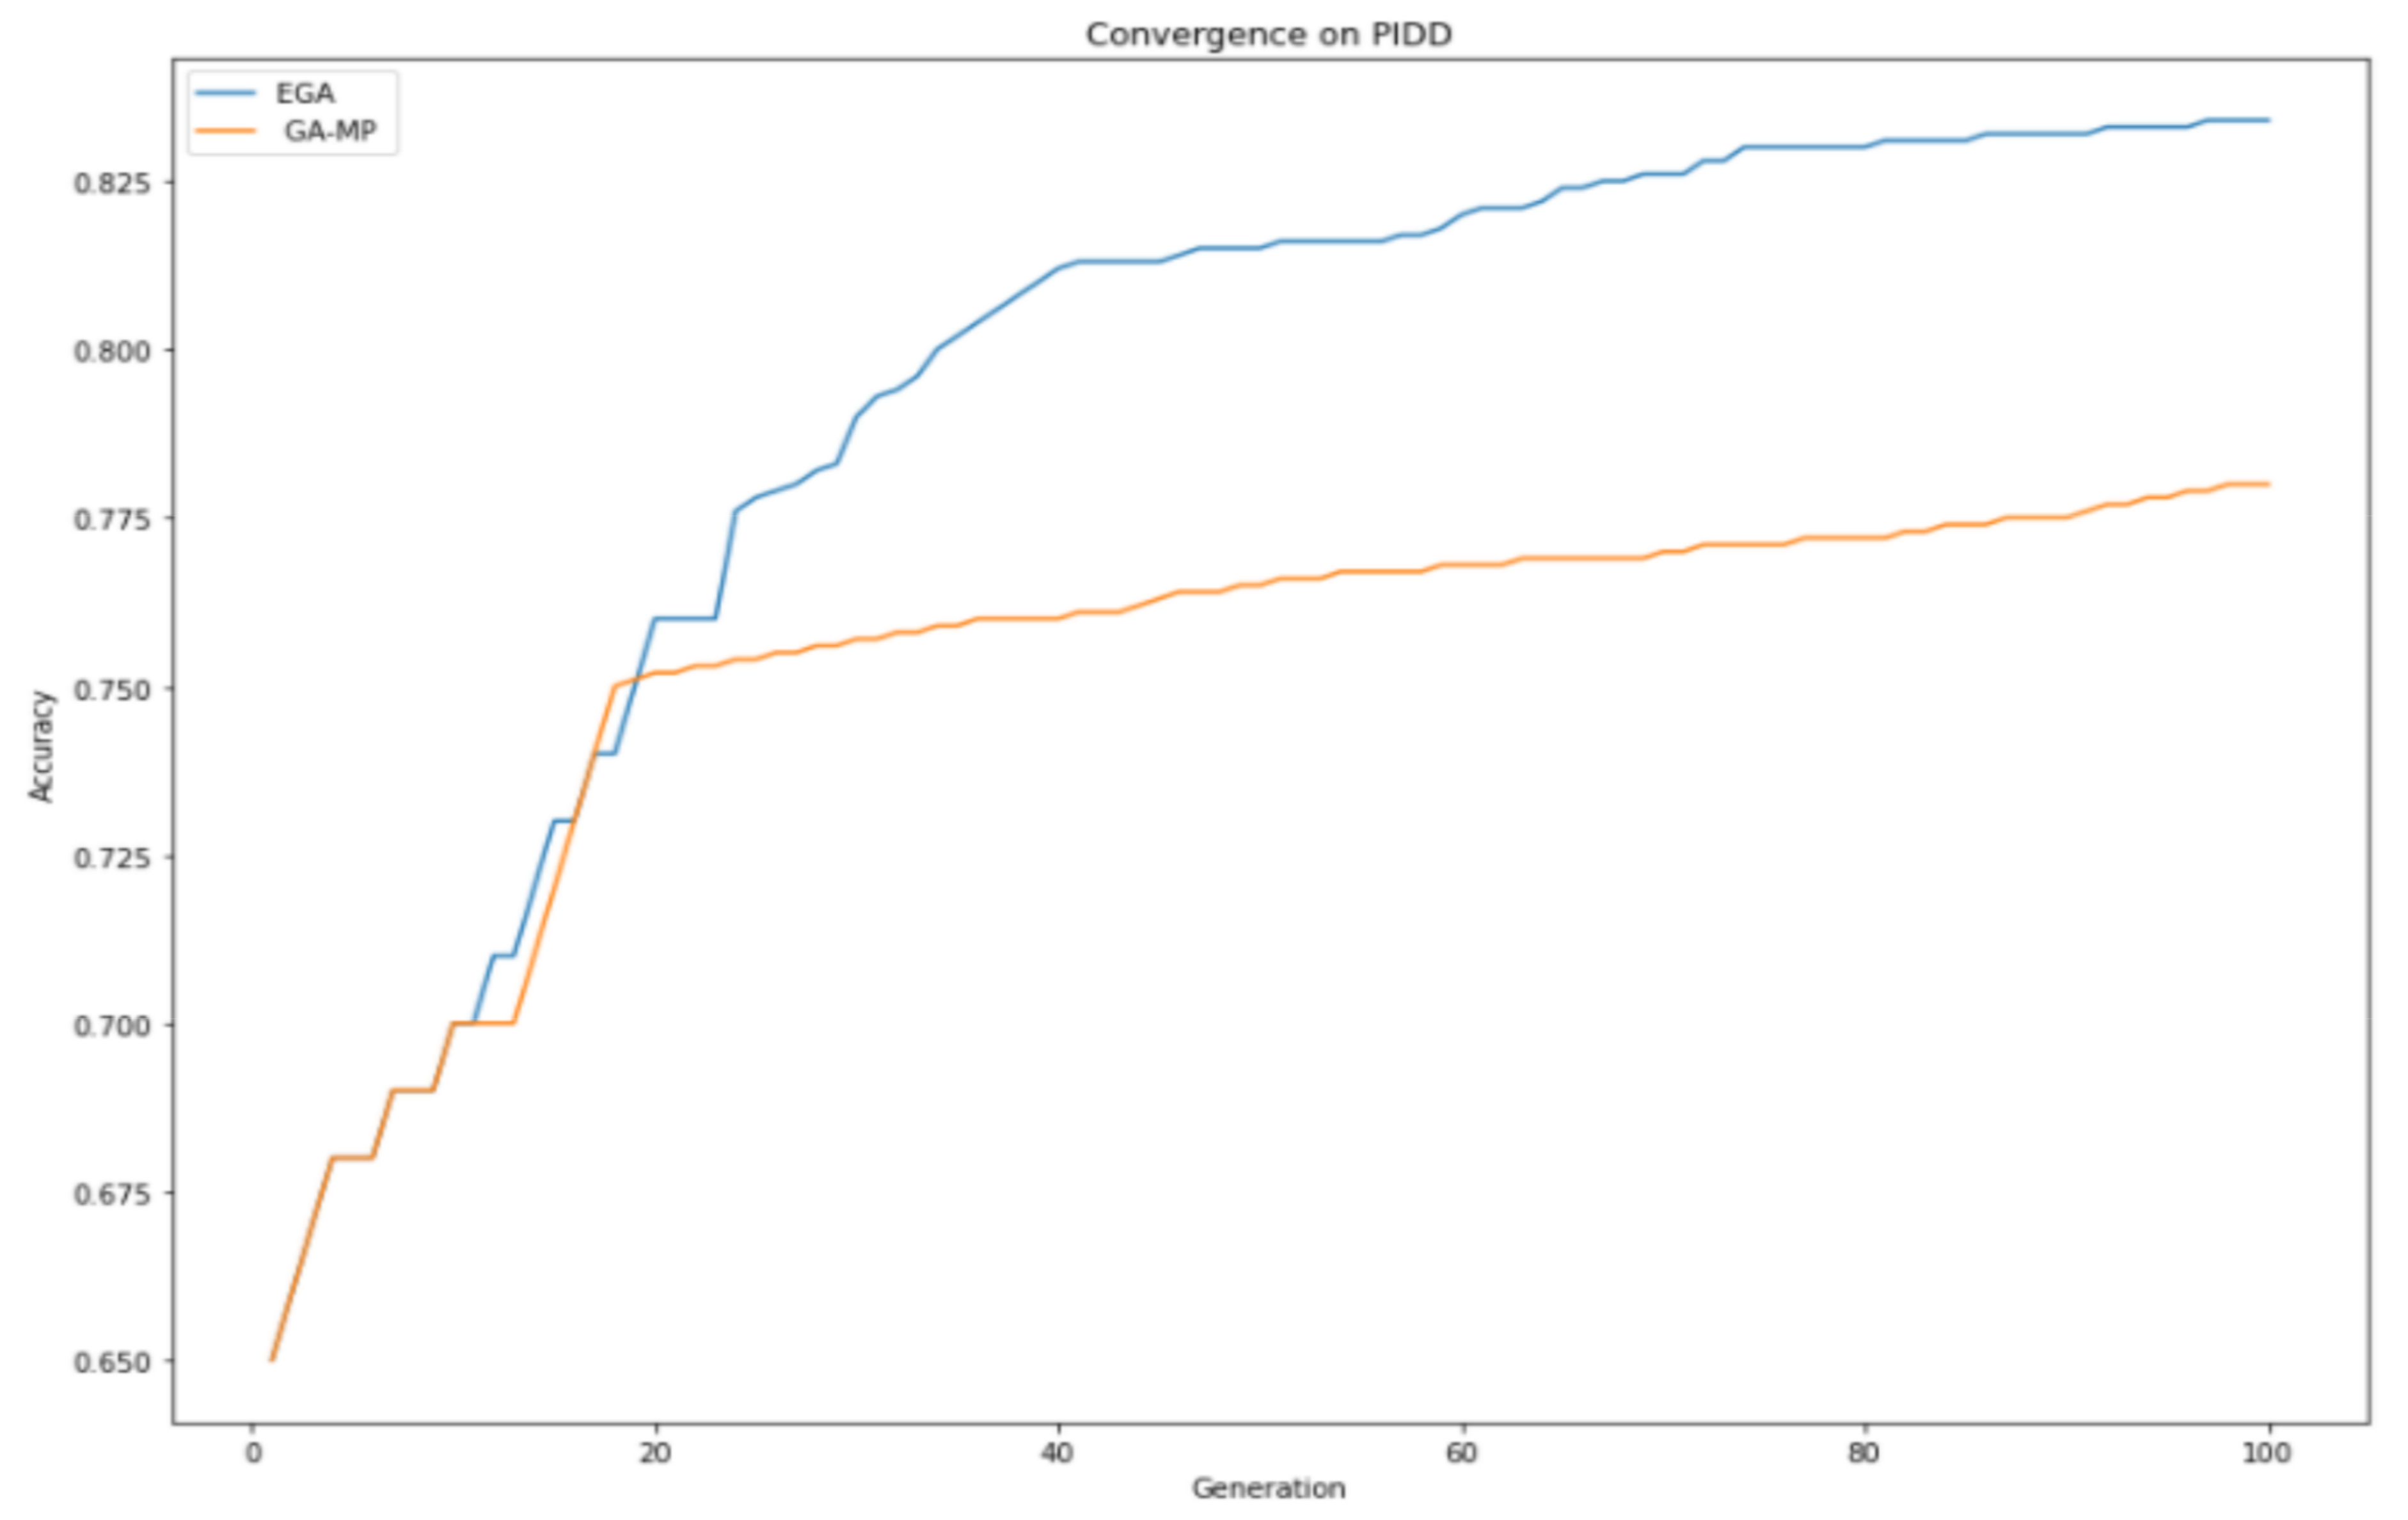
This section gives a detailed analysis of EGA and GAMP convergence properties given the same GA parameter settings, as shown in
Table 2. In
Figure 4, it can be observed that the proposed enhanced genetic algorithm made a consistent improvement over GAMP, especially after the 40th generation. GA-MP tried to compete with EGA on several generations, and after reaching the 20th generation, it started experiencing the exhibition. As a result of the exhibition, loss of diversity was encountered, which eventually led to not exploring the global search space; therefore, they cannot produce offspring better than their parents, resulting in an early convergence.
EGA produced consistent improvement throughput; therefore, it was able to make better offspring, which are passed to the succeeding generation, and it explored the search space better. EGA achieved a better convergence property than standard GA feature selection, thus choosing the most optimal features within a dataset, which improves classification performance.
Table 3 displays selected features using EGA and GAMP techniques where EGA picked the five most optimal features, while GA-MP chose the six features.
4.4. Classification Results
The primary purpose of this study is to present an effective and efficient scheme for the early detection and prediction of T2DM using the machine learning technique. To validate our proposed enhanced homogenous ensemble scheme effectiveness and efficiency, a comparative study was conducted with other well-known ensemble techniques such as XGBoost, Gradient Boost and CatBoost.
From
Table 4, it can be observed that our enhanced homogenous ensemble classifier outperformed other conventional ensemble techniques, with an accuracy of 94.47%, Precision of 94%, Recall of 94% and F1-score of 95%, while Gradient Boost classifier registered the lowest classification accuracy. The high performance was achieved due to the application of the accuracy ranking technique, which eliminates the least performing base classifiers, hence improving classification performance.
Table 5 indicates that the performance of the classifier algorithms has been improved when the feature selection techniques have been applied as compared to when using all features provided by the dataset. EGA found an optimal features subset that recorded the highest classification accuracy compared to GA-MP; this is because EGA has improved convergence properties, which will maintain population diversity, proving the ability to find a better solution in search space and end up obtaining the most optimal feature selection.
Our proposed scheme, which combines the improved homogenous ensemble technique and improved genetic algorithm feature selection, outperformed other well-known classification algorithms with an Accuracy of 98.75%, Precision of 98%, Recall of 98% and F1-score of 99%.
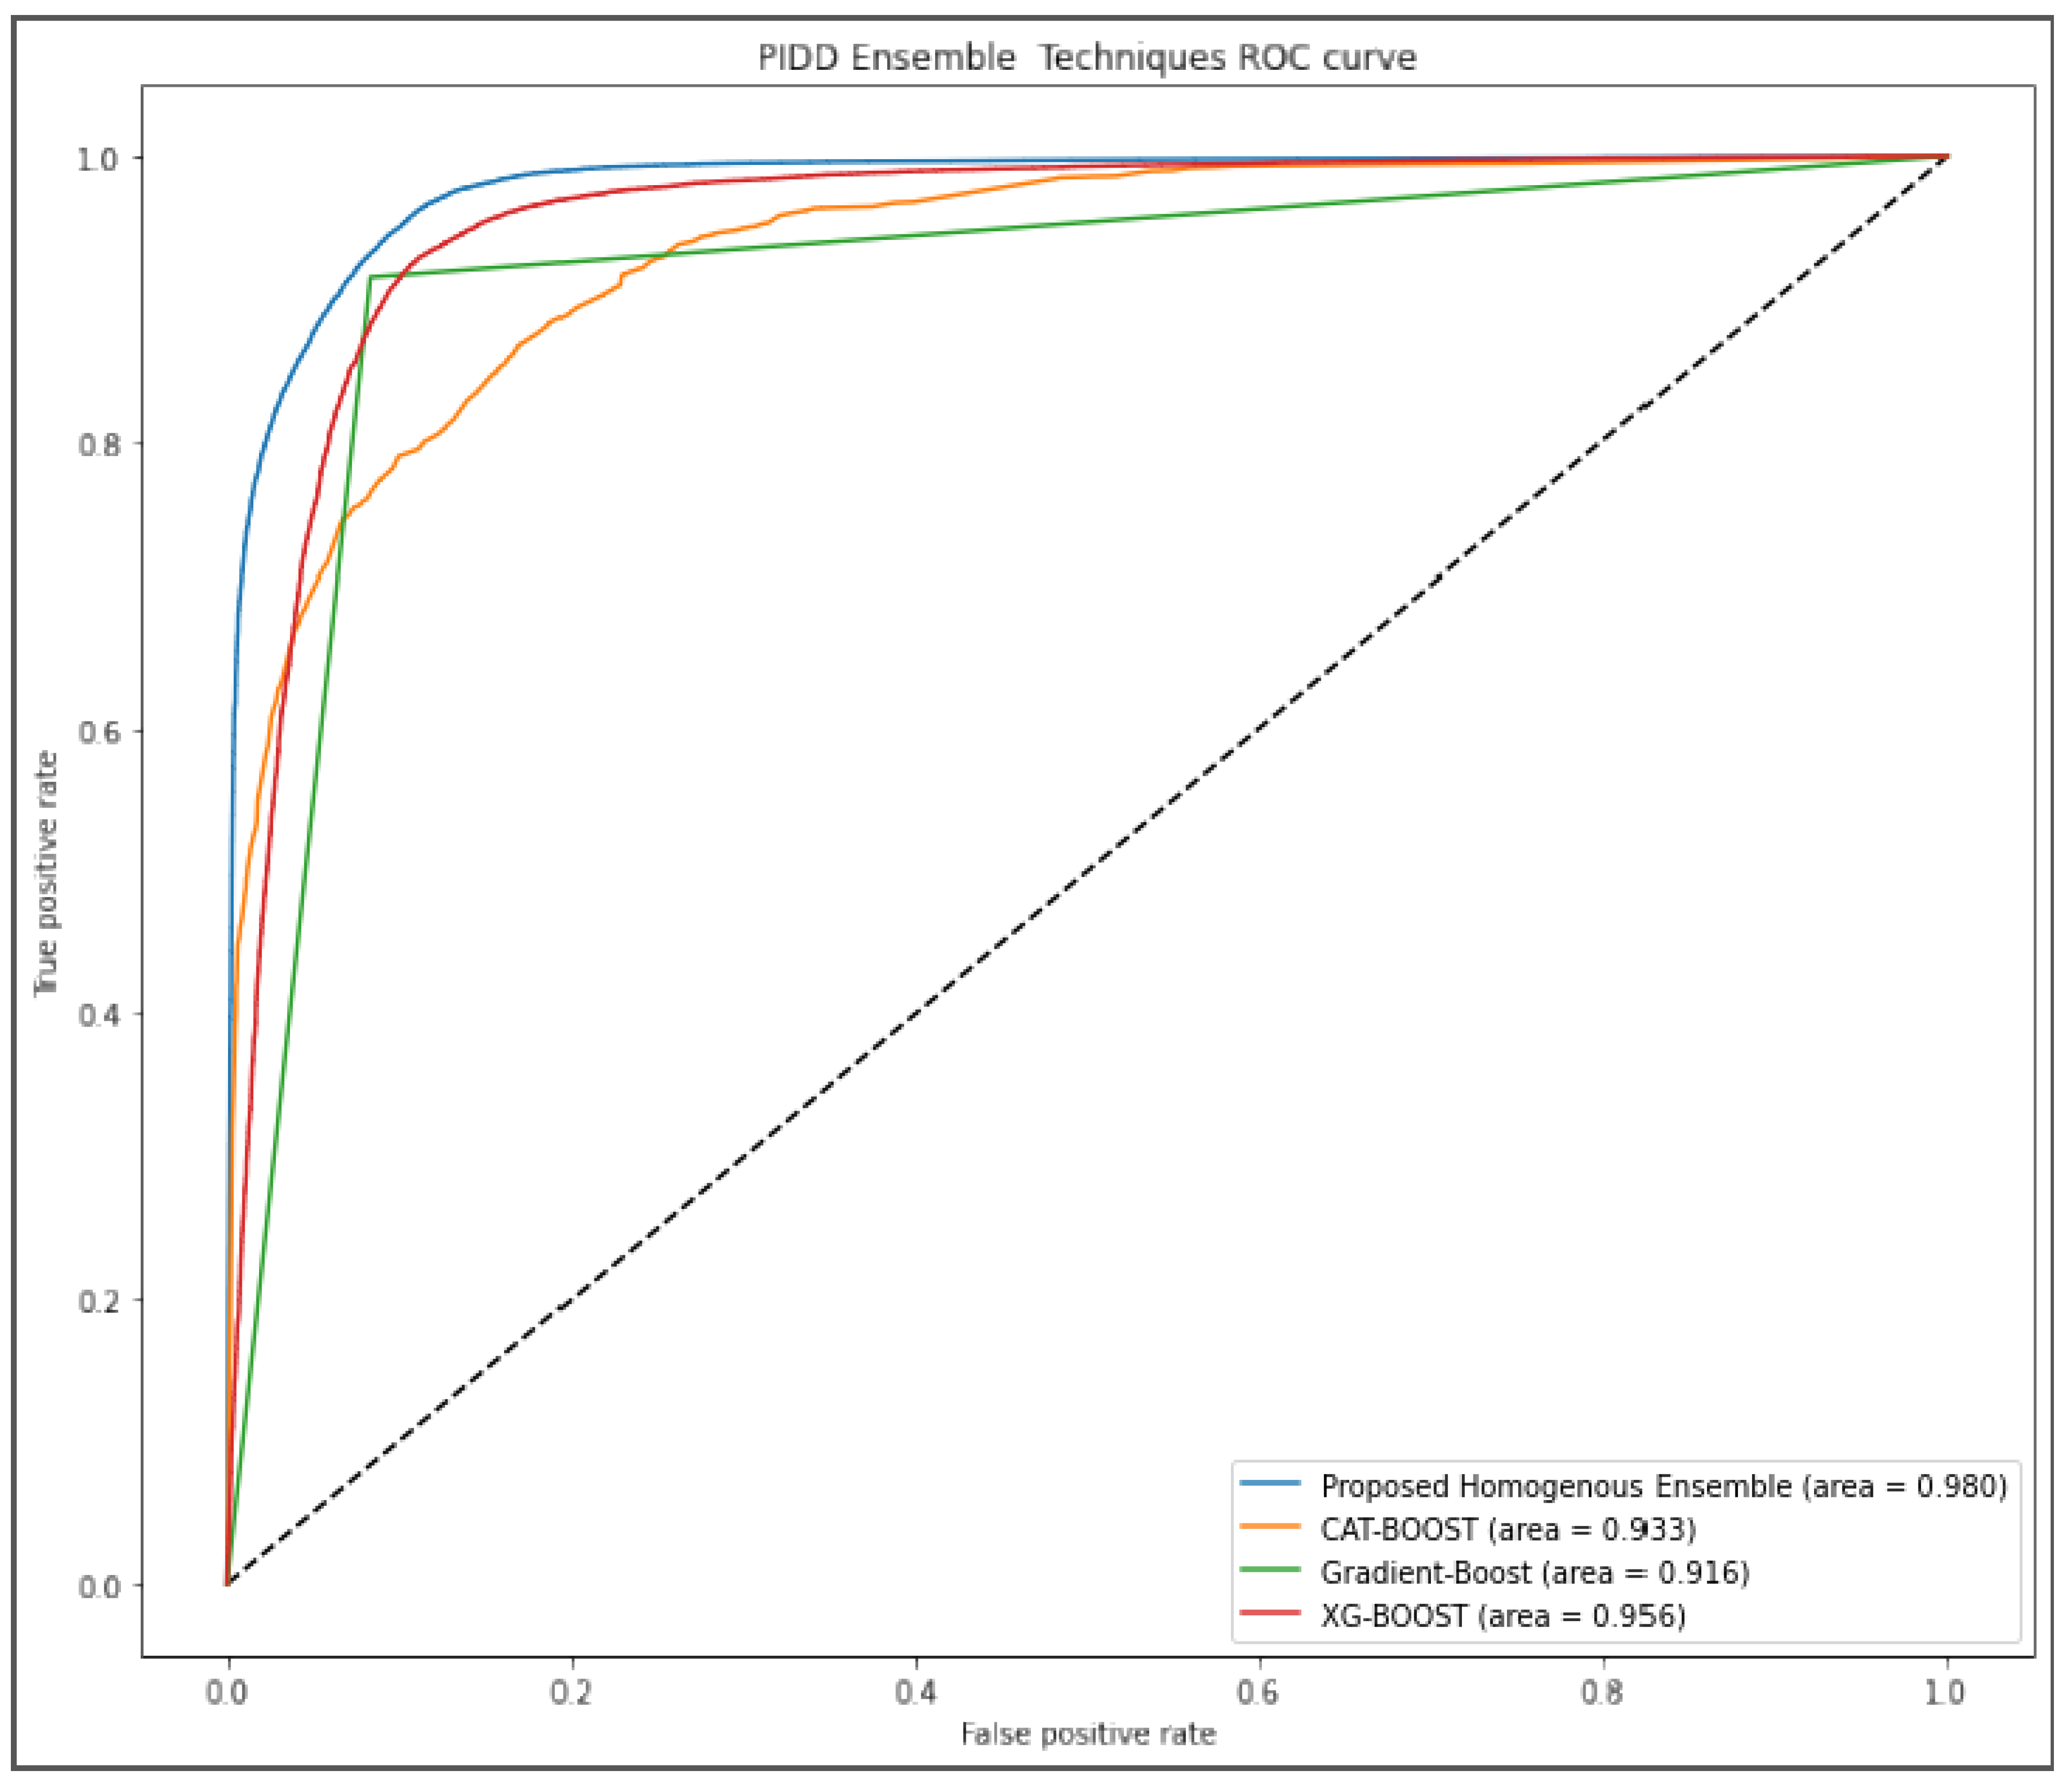
Figure 5 further evaluated the performance of our proposed algorithm using AUROC curve. Our approach outperformed other algorithms by scoring 98% while gradient boost was the last ranked algorithm with 91.6%.
A Comparative Study with Other Recently Published Studies
We carried out a comparative study between our proposed scheme and some recently published related studies. The experimental results indicate that our proposed scheme outperformed other well-known ensemble techniques. A comparative study was conducted with recently published studies that utilized the PIDD dataset to demonstrate our proposed scheme further.
Table 6 displays the comparison; as it can be observed, our proposed scheme technique outperformed other recently published studies.
The experimental results have demonstrated that our proposed scheme has significantly improved the classification performance.
The proposed scheme is a two-step process:
Enhanced genetic algorithm optimal feature selection, with a better convergence characteristic which can maintain population diversity, is the key to its ability to find the better solution in the search spaces, therefore selecting the most optimal features in a dataset.
Enhanced homogenous ensemble technique is achieved by randomly portioning dataset into smaller subsets using the average based splitting technique; the subsets are modeled by decision tree classifiers individually.
The homogenous ensemble is generated using decision tree models as base classifiers. We applied the accuracy ranking technique to expel poor ranking classifiers and retain outstanding performing classifiers. These two novel techniques boosted our proposed scheme to achieve the best results as compared to other studies.
The majority of the studies represented in
Table 6 did not consider the feature selection approach, and few studies considered the feature selection technique. Their studies did not offer the best classification results because their proposed technique is incapable of selecting the most optimal features within the dataset. The EGA feature selection approach is the reason behind the best classification performance observed by our proposed approach.
Most of the feature selection approaches suffer from premature convergence and cannot select the most optimal features. Our proposed technique involves enhancing genetic algorithm feature selection using two steps: setting a variable slice point on the size of the gene to be interchanged for every offspring generation and applying feature frequency scores in deciding the interchanging of genes. Our experimental results have proven that it is the most efficient in selecting the most optimal features, therefore outperforming other proposed techniques.
4.5. Discussion on the Results
The improved genetic algorithm feature selection with enhanced convergence properties gave an efficient optimal feature subset compared with the standard genetic algorithm. An enhanced homogenous ensemble technique was established to predict T2DM patients accurately. The approach involves randomly subdividing the dataset into smaller subsets using the average-based splitting technique. The smaller subsets are then modeled individually using decision tree classifiers. Homogenous ensemble classifiers then developed from different decision tree models; by applying the accuracy ranking technique, we retained the excellent performing base classifiers and eliminated the least-performing base classifiers. Our experimental results and analysis using the Pima Indian Diabetes Dataset (PIDD) attained an Accuracy of 97.5%, Precision of 98%, Recall of 97%, and F1-score of 97%. In addition, our study also revealed that Glucose, Insulin, BMI, Diabetes Pedigree Function and Age are the leading indicators ofT2DM.
The results show that T2DM high risks can be predicted effectively and efficiently using our proposed scheme. Therefore, our technique can be applied in real diabetes diagnostic centers for the clinical decision-making process.
5. Conclusions
This study proposes a novel method of predicting T2DM involving a two-stage process: enhanced genetic algorithm feature selection (EGA) and enhanced homogenous ensemble classification technique.
The EGA feature selection technique was achieved to attain the most relevant features and discard the redundant features. Our experimental results and analysis introduced the effectiveness of EGA in dimensionality reduction, therefore raising classification performances compared to the normal standard GA (GA-MP) algorithm; this was attributed to the capacity of EGA to sustainpopulationdiversitywhichisthekeytoitsabilityinexploringbettersolutionsinthesearch. Meanwhile, the enhanced homogenous ensemble classifier was able to improve classifier performance due to its ability to eliminate the worse-performing classifiers.
Future Work
It is crucial to bring in huge real hospital data for the continuous training and optimization of our proposed scheme. In addition, it is also necessary to validate our proposed scheme using other chronic medical condition datasets.


