1. Introduction
Underground mining operations inevitably generate air pollution caused by harmful gases and dust. This issue is especially prevalent in coal mines due to the intense release of explosive methane from the coal mass [
1,
2], as well as the accumulation of large amounts of flammable coal dust in mine excavations [
3,
4], which may cause occupational diseases in mine workers [
5,
6]. As a result, there are many published studies devoted to the issues of reducing gas release into coal mine excavations [
7,
8,
9] and reducing coal dust concentrations [
4,
10,
11].
The need to reduce harmful impurities in the atmosphere of other types of mines is equally important—this issue is particularly relevant in potash mines, which are the subject of the present study. Potash deposits are sedimentary, and the excavation of these deposits is complicated by the extensive release of fine dust particles [
12,
13], in addition to the release of natural gases (i.e., methane and hydrogen sulfide) contained in commercial seams and surrounding rock layers in some instances [
14,
15].
Dust represents the principal hazard factor in dead-end drifts of potash mines. Due to the significant volumes of dust released (up to 2000 mg/m
3), dilution to the maximum allowable concentration (5 mg/m
3) is not possible. Thus, alternative auxiliary ventilation systems are required for dead-end drifts. In particular, exhaust ventilation systems were analyzed in the context of potash mines in studies [
16,
17,
18]. These exhaust systems are not currently used in the Russian Federation for ventilating dead-end mine excavations, and the currently permitted auxiliary ventilation systems are forced and combined systems (subject to various conditions described in Safety Regulations in Russia). This approach is logical given that forced and mixed ventilation systems provide higher air velocities at the dead-end face, where most of the impurities are released [
8,
19]. However, in the conditions of potash mines, exhaust systems, as shown in [
18], can much more effectively deal with the atmospheric dust content in dead-end drifts than forced and combined systems. Forced and mixed ventilation systems lead to the intensive mixing of flows and the dilution of harmful substances near the dead-end face [
20]; however, exhaust ventilation systems do not produce this effect. In this case, convective mass transfer along the dead-end drift prevails over the mixing of the flows in one or more vortices near the dead-end face; thus, the impurities can be shifted to a small zone near the dead-end face. This approach is only permissible if the accumulation of explosive gases in the area does not exceed the corresponding limiting concentrations.
Conclusions concerning the efficiency and safety of the exhaust system of ventilation can be made based on an analysis of both dust dilution and gas dynamics. This analysis is crucial even given that the intensity of gas release in potash mine excavations is much lower than that in coal mine excavations, with no gas released in some instances. Analyzing the spread of gas in potash mine excavations is thus critical from the perspective of designing safe and effective ventilation systems for these mines. Accordingly, the present study is focused on understanding gas dynamics and aims to determine the patterns of methane distribution in a dead-end drift when using an exhaust ventilation system.
2. Methodology
In this paper, we analyze the dynamics of methane–air mixtures in a dead-end drift using a 3D numerical simulation of steady flow. The methodology of 3D numerical simulations of gas–air mixtures has been extensively researched, with many papers having published the results of 3D calculations of multicomponent gas flows considering both forced and mixed ventilation systems in dead-end excavations [
4,
21,
22,
23]. An exception is the study [
24], where a dust-air mixture is numerically simulated using exhaust ventilation. Dust is modeled as a continuous phase. Many studies also consider the application of CFD methods to analyze the DPM dynamics in blind excavations [
20,
25], the explosions of accumulated methane [
26,
27], and the dynamics of non-explosive gas components in excavations [
28]. This methodology can be applied to the case of the exhaust ventilation systems that we consider in this study. At the same time, we introduce several new features to define two boundary zones where methane is released and where air leaves the computational area. This will be discussed further.
In addition to 3D numerical modeling, 1D approaches are also widely used in the literature to analyze the dynamics of methane–air mixtures in mine excavations for both forced and mixed ventilation systems [
29,
30]. This approach has been demonstrated to be highly effective in analyzing gas pressure and calculating smoke propagation in long systems of mine excavations in emergencies. However, for the scenario studied in this paper, the 1D approach is too much of an idealization of real physics as it does not consider the vertical stratification of methane–air mixtures in dead-end drifts.
The geometric model of the atmosphere of a dead-end drift is represented by a channel with an arched profile of length
L, height
h, and width
b (
Figure 1). The right side of the domain is the boundary through which the fresh air flow enters the drift. The air then passes along the whole drift and enters the end of the ventilation duct located near the drift bottom. This corresponds to the case of an exhaust ventilation system. The movement of air within the ventilation duct itself is not considered in this analysis. The walls of the dead-end drift and the surface of the ventilation pipeline are solid, impenetrable walls on which a zero-velocity condition is set.
The ventilation duct is located at distances
a1,
a2, and
a3 from the dead end, the drift bottom, and the left-hand boundary of the drift, respectively (
Figure 1). Distance
a2 is quite small compared to the excavation height. The location of the duct end in the lowermost part of the drift corresponds to the most pessimistic scenario in terms of ventilation efficiency when the released harmful impurities are lighter than air.
At the domain inlet, a uniform distribution of the air velocity V0 is set. This velocity is provided by an operating fan connected to the ventilation duct. The fan is considered implicitly. Near the dead-end face, a methane source is set. The source is distributed over a small volume, i.e., a vertical layer of thickness δ1 = 1 m. The source has a constant emission rate equal to Q. Due to the movement of air flows in a dead-end drift, the released methane is transferred from its original area of release to other parts of the domain and becomes diluted by the air. Given the chosen direction of air movement, the released methane is transferred by airflow to the end of the ventilation duct and is then removed from the drift via the duct.
In reality, methane is released from the walls of the dead-end drift, as well as from the pieces of rock obtained from mining operations, which are collected in a transfer bin and transported along the drift to its mouth using a self-propelled car [
16]. In potash mines, the maximum methane release occurs during the destruction and grinding of ore by a combine in a small area near the dead-end face [
12]. Therefore, in the analyzed model, we assume that methane is released in a small area of the domain rather than at its boundary. Given the lack of information about the distribution of actual methane release locations in dead-end drifts, we introduce the assumption of a uniformly distributed gas source in a considered small volume near the dead-end face. In this situation, it is important to correctly specify the total methane release rate. It is also important to note that we do not consider fast processes of methane release, for example, methane bursts due to the presence of its local accumulations in a heterogeneous rock mass. The release of methane occurs in our model slowly with a constant intensity.
An important aspect of the simulation is that methane is around two times lighter than air. Due to the influence of a downward-pointing gravity field, the methane will tend to rise above the air. Turbulent diffusion will then contribute to the gradual mixing of these layers and leveling of the density field. In addition, due to the overall airflow in the drift, the methane accumulation will tend to shift to the left boundary of the domain.
We assume that the movement patterns of the methane–air mixture are determined by the ratio of the three main mass transfer mechanisms: (i) forced convection, characterized by the velocity V0, (ii) buoyancy force, characterized by the density difference (and, in turn, determined by the methane emission rate q), and (iii) turbulent diffusion, characterized by the diffusivity coefficient Dt. Accordingly, these three mechanisms were included in our mathematical model of the stationary flow of methane–air mixtures in a dead-end drift.
The continuity, momentum, and energy equations are presented below:
where
is the velocity vector (m/s),
is the hydrostatic pressure (Pa),
is the density of pure air not containing methane (kg/m
3),
is the molecular viscosity (m
2/s),
is the turbulent viscosity (m
2/s),
is the gravity vector (m/s
2),
is the actual density of the methane–air mixture (kg/m
3),
is the volumetric concentration of the methane (m
3/m
3),
is the coefficient of molecular diffusion (m
2/s),
is the coefficient of turbulent diffusion (m
2/s), and
is the distributed gas source near the dead-end face, given by:
where
is the total methane emission rate (m
3/s),
,
, and
are the thickness, height, and width, respectively, of the layer from which the methane is released (m), and
is the Heaviside function.
As methane and air are considered to be mixed at the molecular level, they are assumed to have a single velocity at each point within the domain. This makes it possible to use a homogeneous mixture model of multiphase flows without considering the phase transition boundary. Such models are widely used for problems related to gas transport in the atmosphere of mine excavations [
4]. However, researchers also often separately analyze several gaseous fractions in the air, i.e., oxygen, nitrogen, water vapor, and methane [
21,
31]. This approach is appropriate in scenarios where the decrease in oxygen concentration must be analyzed separately or when issues are being investigated relating to reducing the dust content of mine excavations through water spraying. However, in the context of the present study, separating the air into gaseous fractions is impractical, thus we use a homogeneous mixture model.
The turbulence model SST k-omega [
32] is used to determine the turbulent kinematic viscosity
. In this case,
is calculated by the formula:
where
is the turbulent kinetic energy (m
2/s
2),
is the specific dissipation of the turbulent kinetic energy (1/s),
is the second blending function,
is the strain rate tensor (1/s), and
= 0.31 is the model parameter.
The transfer equations for the turbulent flow characteristics (
and
) are presented below:
The closure coefficients and auxiliary relations are as follows:
where
is the distance from the field point to the nearest wall (m) and
is the first blending function.
The turbulent diffusion coefficient
is determined based on the turbulent viscosity
by the formula:
where
= 0.7 is the turbulent Schmidt number. The value of 0.7 is most commonly used in calculations of turbulent air flows [
33].
Comparative analyses of various turbulence models in the problems of gas transport in mine excavations were performed by [
21,
34,
35], who concluded that it is generally preferable to use the standard k-epsilon model. In these studies, comparisons were made between models such as Spalart–Allmaras, Standard (Wilcox) k-omega, k-epsilon, LES, Transition SST, realizable k-epsilon, and RNG k-epsilon. None of these studies included the low Reynolds SST k-omega model in their comparative analysis, which combines the advantages of the k-epsilon and k-omega models. In this paper, the k-omega SST model was chosen due to its improved convergence over a wide range of model input parameters compared to the k-epsilon models.
The following boundary conditions were set at the inlet: constant air velocity V0, zero gas concentration, turbulence intensity of 5%, and a turbulent viscosity ratio equal to 10. At the outlet boundary, zero static pressure and zero diffusion flux were set (i.e., outflow boundary conditions). A no-slip condition was set on the walls.
To numerically solve the system of equations, we used the SIMPLE algorithm with first-order accuracy with respect to all the required variables [
36]. The calculations were performed in the ANSYS Fluent 2021 R2 software. The problem’s stationary solution was searched iteratively, and the criterion for stopping the iterative procedure was that the relative residuals of all required parameters were less than 10
−5. Additionally, the solution’s independence from the mesh was analyzed.
Figure 2 shows the dependence of the dimensionless maximum methane concentration on the symmetry plane
on the number of mesh cells. Here,
is the dimensional maximum concentration for the current mesh and
is the dimensional maximum concentration for the best mesh (804,563 cells). In this analysis, the case involving the maximum methane release intensity of 0.024 m
3/s and air velocity of 0.2 m/s in the dead-end drift is considered.
For the calculations, a mesh with 401,907 cells was adopted (see
Figure 3). In the inner part, tetrahedral cells were used, with an external boundary layer of prismatic cells. Near the end of the ventilation duct, a higher mesh density is used to correctly reflect the high velocity and pressure gradients of the airflow. Due to the presence of spatial symmetry, only half of the dead-end drift is considered. However, this leads to the fact that a restriction is imposed on the geometric parameter
a3. It should be equal to half of the drift width minus the radius of the duct.
It is important to note how the ventilation duct is defined in the model. As can be seen from
Figure 3, we explicitly model a part of the air space inside the ventilation duct in order to provide a uniform velocity field at the exit from the computational domain, which improves solution convergence. In addition to this, such a setting of the exit from the computational domain makes it possible to maintain the boundary layer on all solid impermeable walls.
3. Results and Discussion
All of the simulation results were obtained for the following geometric parameters: L = 30 m, h = 3 m, a1 = 2 m, a2 = 0.8 m, and a3 = 1.7 m. The diameter of the ventilation duct is 0.6 m. The cross-sectional area of the dead-end drift (before excluding half of the domain from the calculation due to symmetry) is 15.2 m2. The densities of air and methane are 1.225 kg/m3 and 0.667 kg/m3, respectively, and their kinematic viscosities are 14.5 mm2/s and 16.3 mm2/s, respectively. The methane emission rate is the problem’s main variable parameter. The range of methane emission rates was taken based on data from mines of the Verkhnekamskoye potash salt deposit, plus a certain margin. The measured volume concentrations of methane at the outlet of the dead-end excavations of the BKPRU-4 potash mine ranged from 0.0015 to 0.006 m3/m3 (or from 0.15 to 0.45%). Given that the average air flow in dead-end excavations is 1.5–5 m3/s, we can estimate the methane emission rate, which varies in the range of 0.0003 to 0.003 m3/s. In this study, we investigate higher methane emission rates (0.003 to 0.024 m3/s). We selected this value range to consider a more pessimistic scenario and to investigate the airflow patterns in a dead-end drift with a greater gas convection intensity.
Figure 4 shows the calculated distributions of the gas concentration in the middle vertical section of the dead-end drift at various methane emission rates with a constant air velocity of 0.2 m/s at the entrance to the computational domain. The maximum gas concentrations in all cases are observed near the roof of the drift; this area is associated with a lower methane density, and the airflow is directed along the bottom of the drift, where the end of the ventilation duct is located.
Figure 4 also illustrates the velocity vector field within the considered vertical section of the domain. The analyses of the velocities and concentrations show that several convective vortices are formed in the upper part of the drift, where air–methane mixture circulation occurs. One vortex is located between the dead end and the ventilation duct end, while another vortex extends along the top of the drift (only for
Q ≥ 0.009 m
3/s). The latter vortex can be quite long and depends primarily on the methane release rate. The vortices interact and exchange mass with the main airflow moving along the dead-end drift from right to left and entering the ventilation duct.
In addition, we analyzed the distance over which the methane cloud extends along the roof of the drift at various methane emission rates. With an increasing methane emission rate near the face, the range of methane cloud propagation increases indefinitely, and the maximum dimensional concentration values grow. We suggest that the size of the methane cloud is mainly determined by the ratio of air–methane mixture buoyancy forces and dynamic pressure from the external airflow moving along the dead-end drift. The buoyancy force is, in turn, determined by the density difference of the air–methane mixture in the considered system.
Figure 4 shows that the maximum methane concentration in the cloud depends approximately linearly on the methane emission rate. Furthermore, the methane cloud length depends on the methane emission rate and follows a near-linear trend.
It is important to note that the term “methane cloud” is conditional here and does not necessarily mean the formation of an accumulation of high concentrations of methane. We use this term to describe a wedge-shaped area in the upper left part of the domain in which there is a non-zero methane concentration.
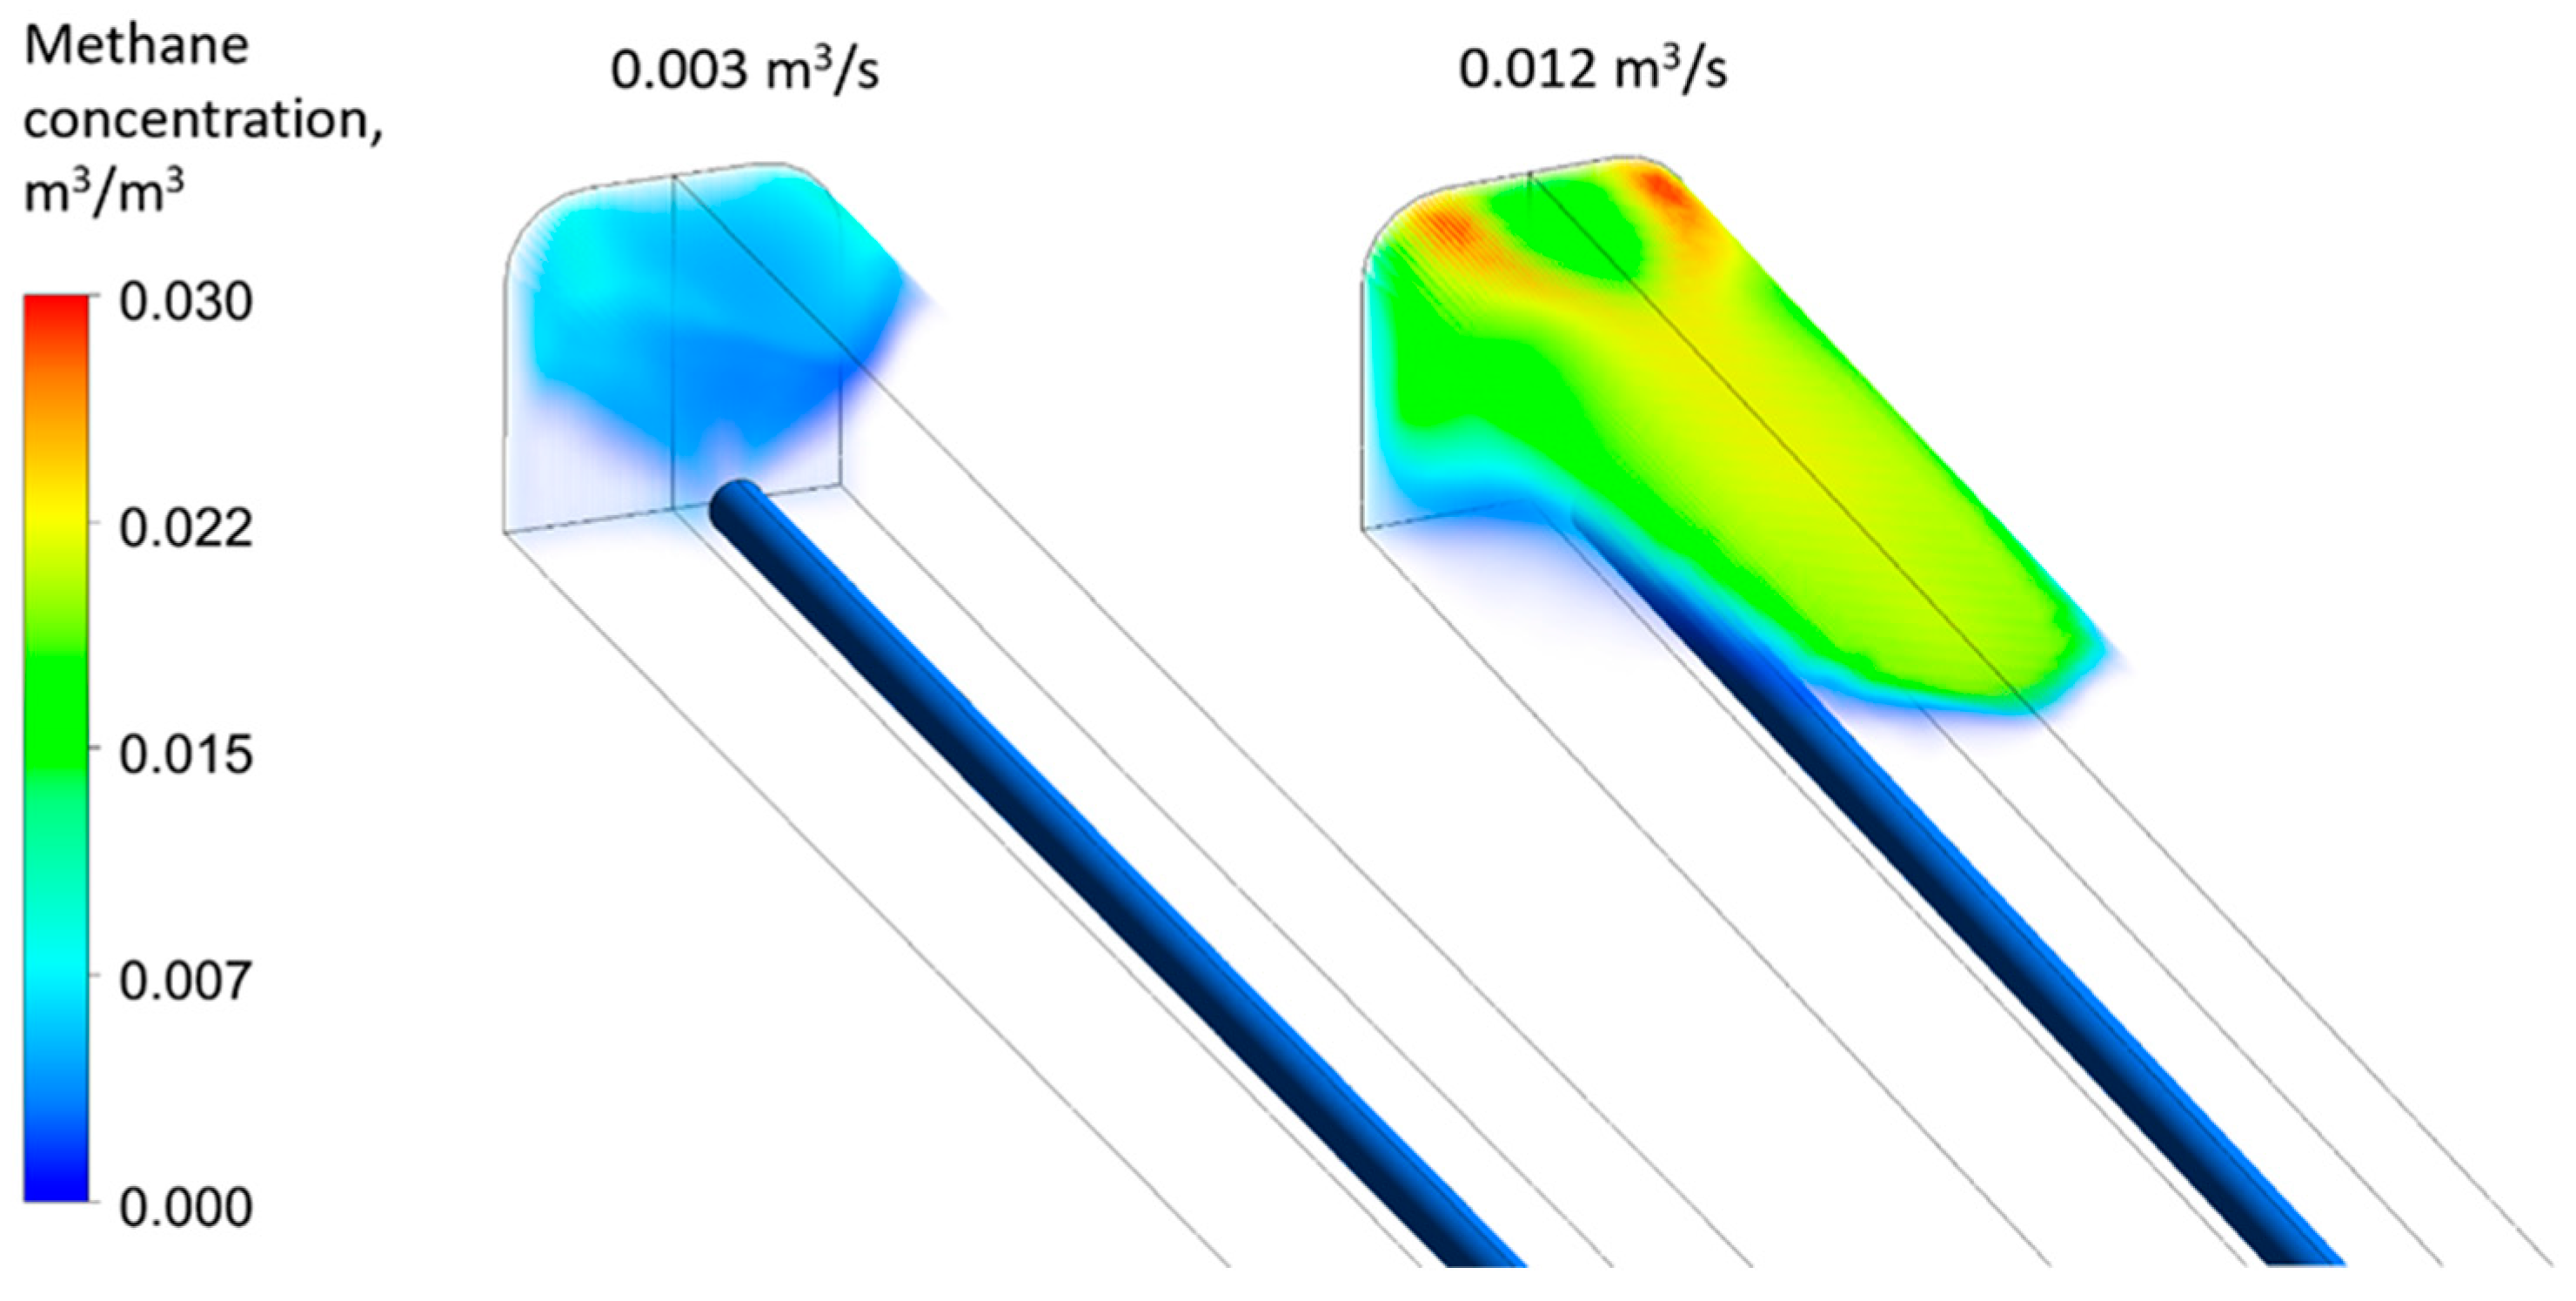
We selected the middle vertical section for further analysis as this area contains the maximum length of the methane cloud, as shown in the methane concentration volume fields in
Figure 5 for two different methane emission rates. Notably, the maximum methane concentrations do not necessarily occur in this cross-section; for example, in the area near the dead end, the maximum methane concentrations occur at the roof of the drift, closer to its side walls. This is due to the characteristics of the studied ventilation system (i.e., in the horizontal section, the ventilation duct is located in the middle of the drift).
The maximum concentrations of methane in
Figure 4 and
Figure 5 were found to be very high (0.03 m
3/m
3). These methane concentrations are very close to the lower explosive limit for methane–air mixtures [
37] and should thus not be allowed in mine excavations, even if the high-concentration region of the methane cloud is localized in a small area near the roof of the excavation. However, it is important to note that the methane emission rates used here (0.003–0.024 m
3/s) are overestimated compared to a realistic emission rate range (0.0003–0.003 m
3/s) to better understand the general patterns of methane movement in dead-end drifts when exhaust ventilation is used.
An aspect of interest is to analyze the length of the methane cloud at the drift’s roof as a function of the methane emission rate and inlet air velocity. The methane cloud length is determined here as the minimal distance
E from the left boundary of the region (dead-end face) in the
X-direction axis along the line
Y = 3.95 m at which the methane concentration is below 10
−5 m
3/m
3. For example,
Figure 6 illustrates how
E is calculated for methane emission rates of 0.003 m
3/s (
E1) and 0.012 m
3/s (
E2).
Figure 7 shows the calculated dependences of the length
E on the inlet air velocity for four different methane emission rates. The colored dots represent the results of individual numerical calculations, and the continuous lines show the corresponding approximated curves using the fitted function:
where
is the mean air velocity at the inlet (m/s) and
is the total rate of methane emission (m
3/s). The function (20) was obtained using the least squares method. It was tested only for the range of parameters considered in this paper, i.e., air velocities from 0.1 to 0.3 m/s and methane emission rates from 0.003 to 0.024 m
3/s.
In general, all the curves exhibit a pronounced non-linear dependence on air velocity and a linear dependence on the methane emission rate. Notably, as the air velocity increases, the length of the methane cloud tends to a constant value greater than zero. In addition, it follows from (20) that the length E of the methane cloud is always greater than 2.8 m within the considered range of the problem parameters. This is true only for the selected distance a1 between the ventilation duct end and the face (2 m)—when the distance decreases, the minimum value of E will also decrease.
For the minimum air velocity (0.1 m/s), the curve at emission rates of 0.012 m3/s and above reach the limiting value, i.e., the right boundary of the domain. In reality, at higher methane emission rates and lower air velocities, the methane cloud will tend to propagate over a much greater distance than the chosen length L of the computational domain (60 m). For this reason, the studied model has certain inherent limitations in terms of the range of possible parameters for ventilating dead-end drifts and methane emission rates.
At low methane emission rates (0.003 m3/s and 0.006 m3/s), the methane cloud cannot propagate sufficiently far along the dead-end drift even at a minimum air velocity of 0.1 m/s. When the air velocity reaches 0.2 m/s, the length of the gas cloud ceases to change significantly with further increases in air velocity. Thus, based on the observed values of methane emissions in the considered potash mines, the most reasonable air velocity value is 0.2 m/s.
The above analysis can be generalized to the case of arbitrary parameters of a dead-end drift, its ventilation system, and the source of gas release. To do so, it is convenient to single out the main dimensionless complexes from the original system of balance Equations (1)–(3), i.e., the Reynolds number:
and the gas Grashof number:
where
is the pure methane density (kg/m
3) and
is the inlet air density (kg/m
3).
The gas Grashof number is introduced so that its value can be used to estimate the methane emission rate, which is characterized by the corresponding dimensional value
. The dimensionless complexes (21) and (22) are introduced for the case when the characteristic length is equal to
, and the characteristic time is equal to
. The length
E of the methane cloud is then conveniently represented in the phase plane of the main dimensionless parameters of the problem, Re and Gr (see
Figure 8). The isolines in
Figure 8 correspond to fixed values of the length
E in the range from 4 to 60 m.
If we specify a certain maximum permissible length of methane cloud (
Emax), it is then possible to approximate the dependence between
Re and
Gr based on the data obtained from the multiparametric numerical simulation. In this case, it is usually more convenient to express the Reynolds number as a function of the Grashof number. Thus, based on the given methane emission rate, it is possible to determine the minimum air velocity that must be provided to prevent the spread of methane beyond the small area near the dead-end face. The approximate dependence has the following form:
This equation can be solved with respect to the Reynolds number:
Another important parameter that affects the length E of methane cloud is the angle of inclination of the drift. The analyzed case corresponds to a horizontal drift, whereas in practice, inclined mine excavations (both downwards and upwards) may occur. In addition, part of the drift space can be occupied by mining equipment (e.g., combines, self-propelled cars), which can also influence the aerodynamic parameter distribution of the methane–air mixture. However, in this gas dynamics study, we aim to constrain airflow behavior in the simplest case, i.e., without mining equipment.
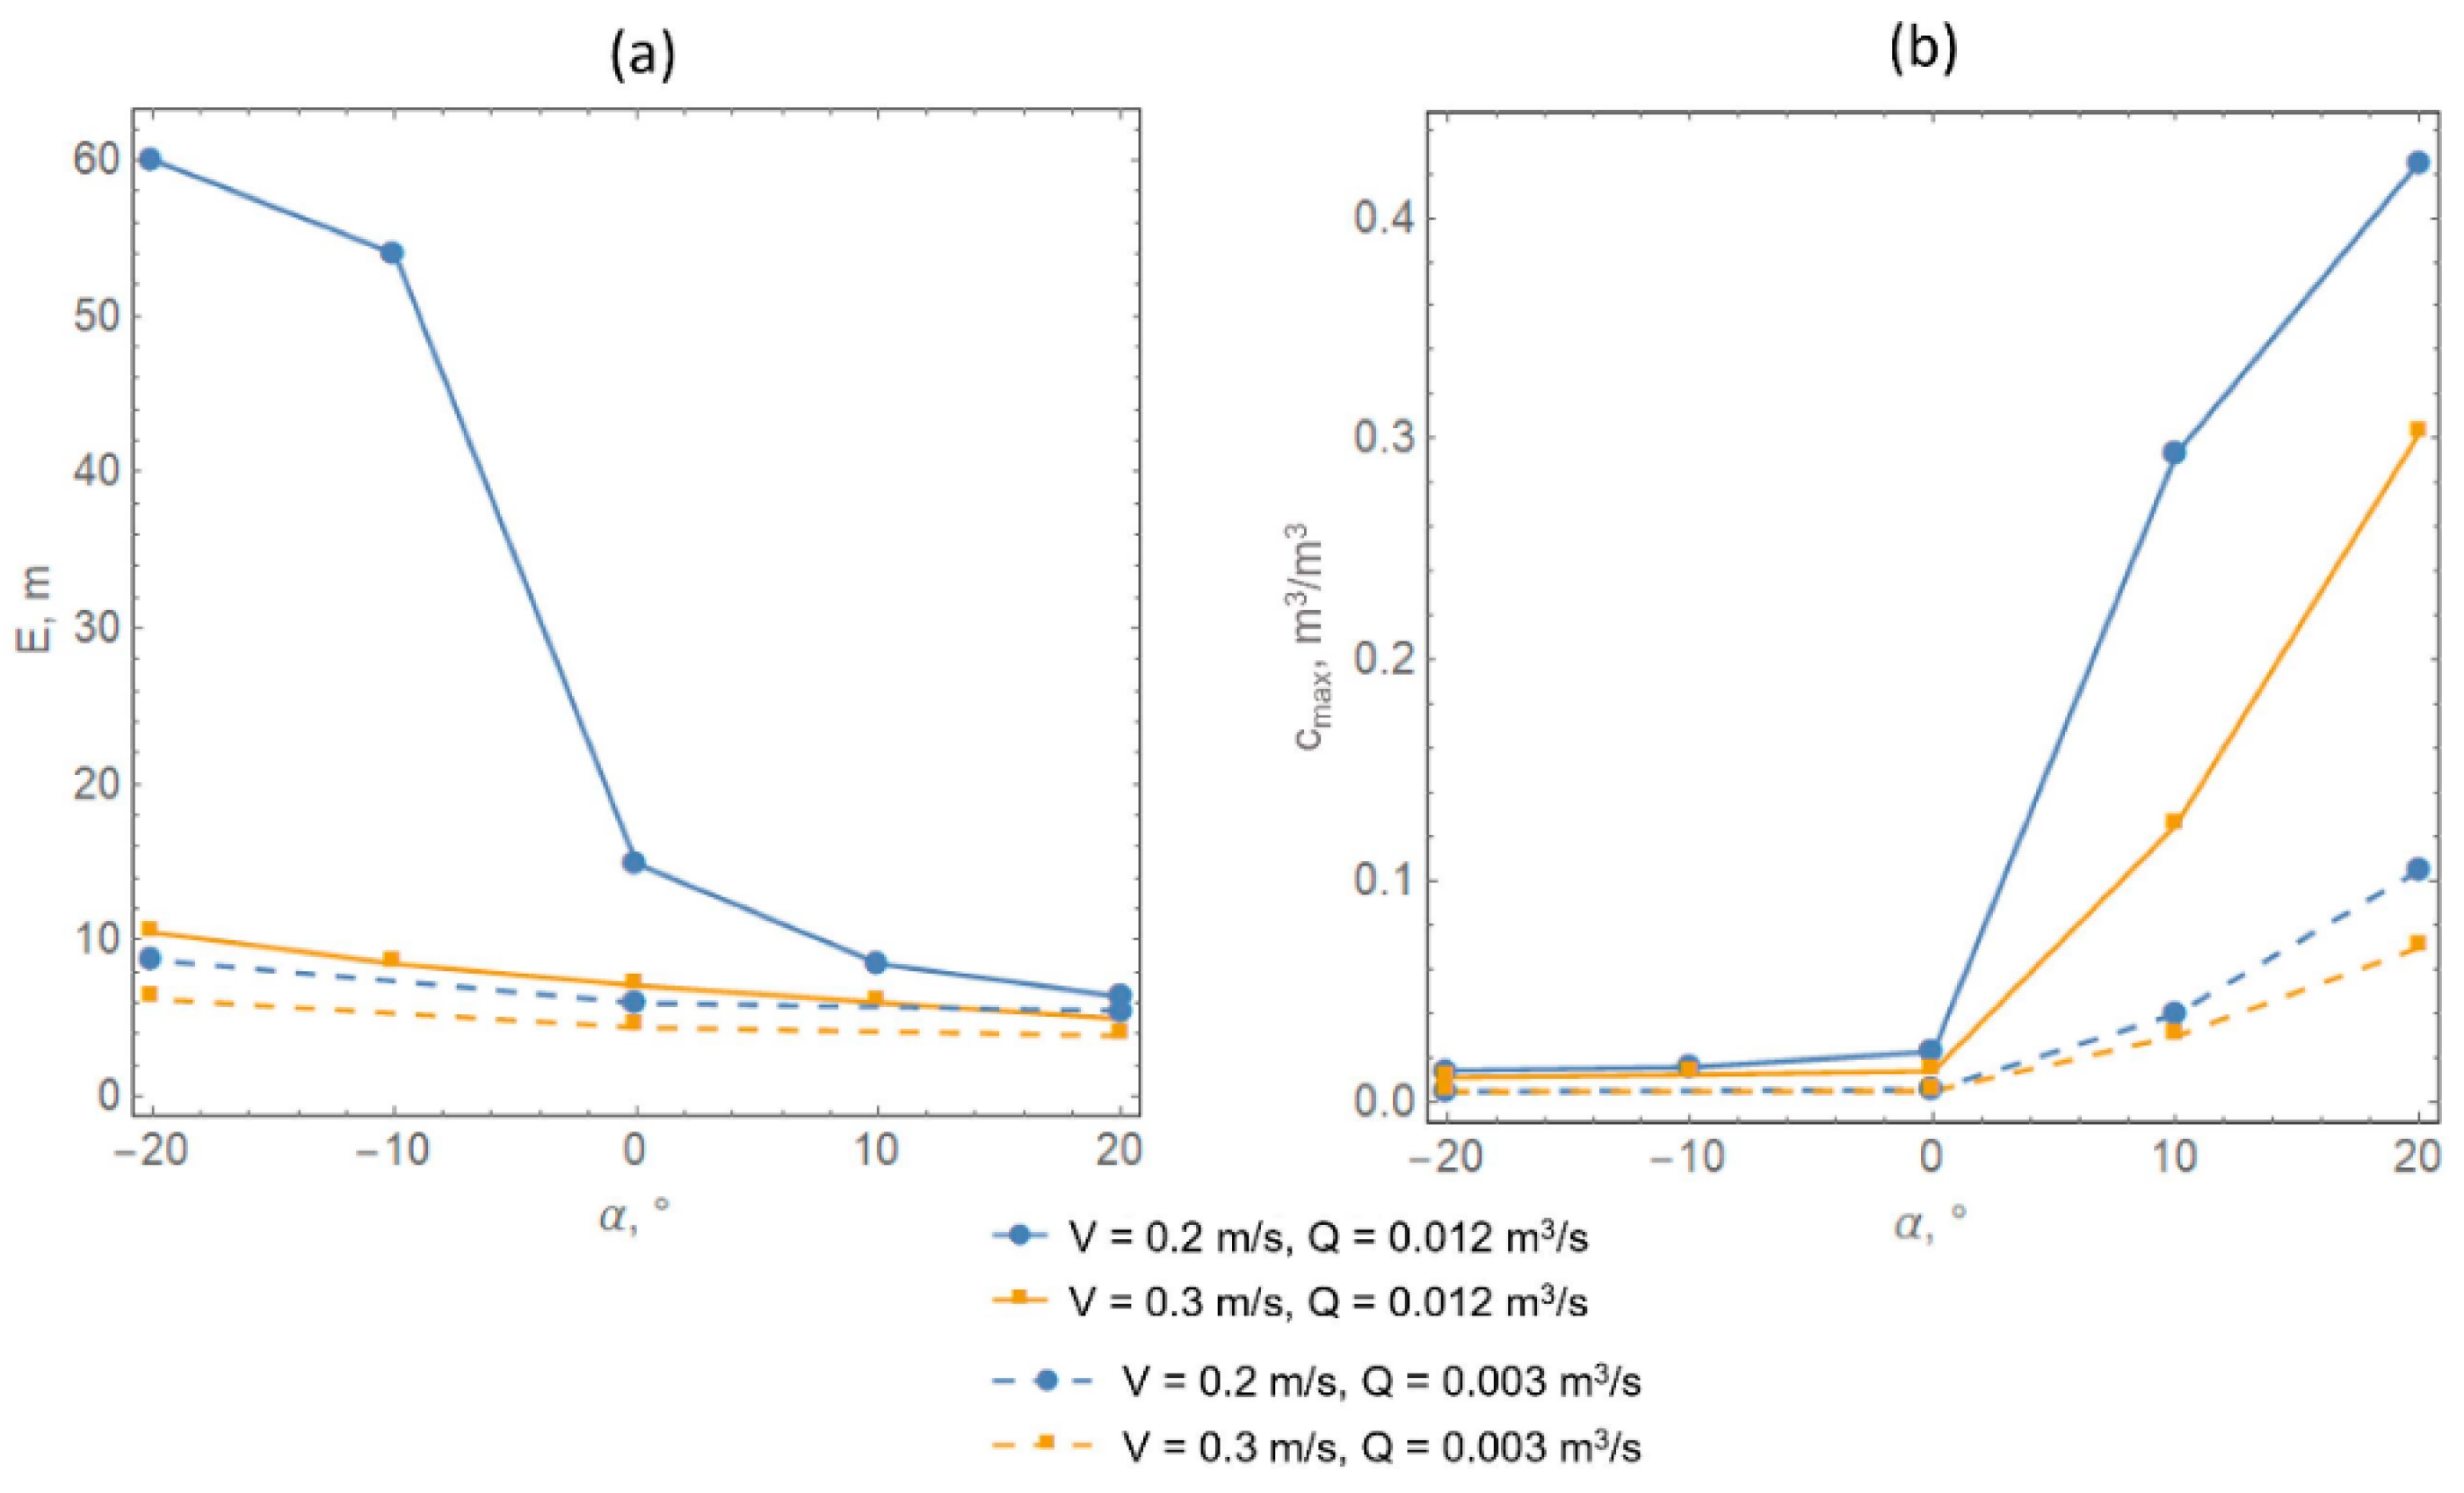
Figure 9a shows the calculated methane cloud lengths as a function of the inclination angle for two air velocities (0.2 and 0.3 m/s) and two methane emission rates (0.003 m
3/s and 0.012 m
3/s). We considered a realistic range of possible dead-end drift inclinations in potash mines plus a certain margin, where negative angles of inclination indicate that the dead-end face is below the drift mouth and positive angles indicate it is above the drift mouth. In general,
Figure 9 shows that the resulting dependence is highly non-linear in all considered parameters. At a high methane emission rate of 0.012 m
3/s, an air velocity of 0.2 m/s can no longer localize the methane cloud near the dead end. At a low methane emission rate of 0.003 m
3/s, no significant changes in the methane cloud length occur at air velocities of either 0.2 m/s or 0.3 m/s. Considering the actual methane emission rates [
38,
39] in the potash mines of the Verkhnekamskoye potash salt deposit, the slope angle is likely to have almost no effect on the length of the methane cloud. However, in other mines, where methane emission rates may be higher, this fact may not be true.
Figure 9b shows that in the case of a positive angle of inclination, although a favorable decrease in the length of the methane cloud occurs, an unfavorable increase in the maximum concentration of methane also takes place. This effect is most pronounced for the maximum considered intensity of 0.012 m
3/s, in which the maximum concentration of methane can exceed 40%. However, even for the intensity of 0.003 m
3/s, a significant increase in the maximum gas concentration occurs, which will exceed the lower explosive limit for methane–air mixtures. This indicates that the exhaust ventilation is unsafe for drifts with a positive angle of inclination for the selected ventilation parameters. The safe use of the exhaust ventilation system in this situation requires careful selection of the position of the end of the ventilation duct, and the use of additional booster fans to intensify the mixing of air flows near the dead end. Another important measure that accompanies the use of exhaust ventilation is the use of sensors for continuous monitoring of gas concentrations.
4. Conclusions
In general, the described study of methane accumulation near the roof of a dead-end drift allows the selection of the exhaust ventilation system’s parameters. These parameters make it possible to control the length of the zone with a non-zero methane concentration near the dead-end face of the drift based on the known (or predicted) parameters of the methane emission rate and the geometric parameters of the drift. This zone with a non-zero concentration of methane is conventionally called a methane cloud.
In this paper, we analyze the formation of a methane cloud at different airflow velocities in a dead-end drift, different methane release intensities in the zone near the drift face, and different drift inclination angles. A practical case of dead-end drift of the Verkhnekamskoye potash deposit is considered, in which methane release is associated with the destruction of potash ore during mining operations.
This study’s main result is that at the observed methane release rates in the mine, an air velocity of 0.2 m/s is sufficient to shift the methane cloud to the dead-end face and the roof of the drift when exhaust ventilation is applied. In this scenario, the maximum local concentrations of methane at the roof of the drift will not exceed 0.6% for zero or negative angles of inclination of the drift (i.e., when the dead-end face is below the mouth of the drift). This indicates that exhaust ventilation is still able to provide good mixing of air flows near the dead end at relatively low methane emission rates (0.003 m3/s and less).
In the case of a positive angle of inclination of the dead-end drift, the use of exhaust ventilation can lead to the local accumulation of high concentrations of methane near the roof of the drift. Therefore, the exhaust ventilation system with the considered parameters is not safe for inclined drifts where the dead-end face is located above the mouth of the drift. The use of exhaust ventilation in this case should be supplemented by optimizing the position of the end of the ventilation duct and intensifying the mixing of air flows near the dead end by means of additional fans of lower power. This is the subject of our further research.
Overall, the obtained results from this study can be applied primarily to the ventilation of non-coal mines, where the intensity of methane release is low or completely absent.


