1. Introduction
Sports activity satisfies a fundamental desire for humans to move their bodies. Additionally, it maintains our physical and mental health by improving physical strength, relieving mental stress, and preventing lifestyle diseases [
1]. However, in order to sustain motivation for these activities, it is important for us to acquire and improve motor skills [
2]. To accelerate the acquisition of these skills, it is necessary to practice for a long time and to learn rules for mastering the skills based on advice from proficient advanced players, such as coaches and trainers. To obtain such rules, it is important to consider which factors are relevant to the advanced movements. Knowing the key factors will enable us to adopt them in our own movements.
The fields of coaching and training have attempted to systematize theories for mastering motor skills in order to find tricks for acquiring them with minimal training [
3,
4]. The theories combine athlete-centered practices with teaching techniques that assume situations in a game [
5]. However, such approaches tend to depend on the abilities of athletes and coaches. Therefore, we need trainers and coaches who are familiar with many examples of how to select methods for different types of athletes. However, it is difficult to convey the rules for learning motor skills to various types of athletes. Additionally, it is also difficult to find a method that matches an athlete’s need [
5]. Thus, methods for coaching and training are indeed dependent on the experience and ideology of coaches and/or trainers.
When we learn a motor skill, knowing key points of the movement will help us by improving our awareness of the important points. Furthermore, understanding such key points will potentially provide a system for coaching and training. Conventional approaches have emphasized the importance of understanding key points by watching videos of advanced athletes and proposing that they be reflected in our own movements [
6]. However, these methods inevitably require special knowledge for motor skills. Therefore, it is impossible to exclude the aspect that depends on the experience of advanced athletes.
In addition, actual sports demand a method for real-time feedback of performance during a game or training [
7,
8]. This is very helpful for athletes when they learn a motor skill because they can remember the intuitive image of the body movement instantly [
9]. For example, we can effectively check the movement with instant feedback by watching videos or by analyzing data from sensory devices. Then, we repeat the routine, which confirms the feedback and corrects the body movement. As described above, for acquiring motor skills, it is urgent to develop a novel method for coaching with immediate feedback based on objectively measured data.
The conventional approaches to real-time motion analysis mentioned above are targeted to the movements of individual athletes. However, we are not able to apply these methods to movements that include external factors, such as in combat sports. In the other words, when a movement is influenced by other factors than the subject’s movement, it is impossible to identify whether the movement is caused by the subject or by the other factors. Therefore, a method has been proposed to find key factors of movements that can be applied to combat sports, called XSM [
10]. This method focuses on the posture immediately before a successful target movement and then identifies the key factors that provide the successful movement. It, therefore, reveals the key factors for successful movements based on a statistical approach. However, it does not identify the successful movement in real-time after the factors of posture are observed.
In this paper, we focus on development of a method for predicting a successful movement in real-time from the posture immediately before the movement, which can be applied to combat sports. If we can know a successful movement from a posture right before the movement, we are able to select the most appropriate motor skill and to identify which defensive postures cause an athlete to lose a match. Furthermore, automatic sensing from video of the factors in the posture will provide an automatic coaching system for combat sports.
According to the background above, this paper focuses on judo as a combat sports and will propose a new method that predicts successful throwing techniques from the Kumite posture immediately before the successful throw, reporting results in real-time. Here, we define the successful throwing technique that results in a winning point (i.e., Waza-ari or Ippon) in a match.
The contributions and new findings of this research are listed as follows.
We have developed a method called RT-XSM (Real-time extraction method for successful movement) for predicting successful throwing techniques from the factors in Kumite posture using logistic regression;
We have found that the RT-XSM predicts throwing techniques in judo regardless of attributes, such as gender differences, which are unrelated to the factors of Kumite posture;
By including the prediction results in several topmost prediction results, we have found a method of improving the prediction accuracy of the RT-XSM for judo throwing;
As a by-product of the improved technique above, we also found a technique for visualizing the factors that initiate similar throwing techniques from a Kumite posture. The visualization will be helpful for training and coaching in judo throwing.
This paper is organized as follows. In the next section, we will describe the background and definitions of this research. In
Section 3, we will propose a novel method for predicting successful throwing techniques from the factors in the Kumite posture in real-time. In
Section 4, we will perform experimental evaluations to show the validity of the proposed method. Finally, we will conclude this paper.
2. Backgrounds and Definitions
2.1. Sports Coaching Methodologies
In modern training in sports, observation of movement has become one of the trend methods. It is an important approach for us to watch videos in order to understand the athlete’s own movement. For example, Ref. [
6] discusses the importance for coaches to feedback a game situation to players by showing videos immediately after the game. Ref. [
11] shows a case study of a coaching method using video and introduces a technique for how to utilize the video in coaching. Ref. [
12] shows that the use of video in physical education is effective for mastering skills and techniques, and learning knowledge, as well as the highest level of practice. Ref. [
13] experimentally demonstrated that video training took the longest time but was the best method in training for golf swing comparing three different ways: video instruction, verbal instruction, and self-guided.
Although the various methods above based on watching video are effective for acquiring motor skills, coaches and trainers need to find key factors of a movement from multiple directions by watching multiple videos in the case when they analyze the movement. They try to find the key factors, such as differences of athletes’ body and environment. Here, we have a problem that the coaches and the trainers cannot completely eliminate their subjective opinions. Therefore, several methods have been proposed to feedback the measured data to a learner, such as skeletal coordinate values from video images and captured data from sensory devices. For example, Ref. [
14] found the difference of the strength between men and women based on 3D coordinate values obtained from a 3D motion capture camera focusing on the arm motion of badminton smash. The authors found that the higher racquet grip velocity is necessary for the faster smash and that the movement of shoulder abduction and elbow extension are the key factors. Ref. [
15] obtained objective data using motion sensors on golf swings to identify the key factors of movement. The authors proposed a quantitative model function to identify the effective components among the local features of the sensors by using PCA (Principal Component Analysis) and LDA (Local Discriminant Analysis) [
16]. The model is applied to the motion data acquired by motion sensors attached to a golf club and the participant’s body. Ref. [
17] observed the transition of the center of gravity on both feet during a golf swing using two force plates. Additionally, the authors revealed the importance of the transition of the center of gravity regarding the front foot. In [
18], the authors automatically evaluated skiing and snowboarding skills using a smartphone motion sensor. They can feedback skill scores to the user by evaluating the skills according to the mathematical models. In [
19], the authors feedback the intensity and the distance of running in real-time with wearable devices. Although injuries and lack of motivation were considered as the reasons why we cannot continue the running habit, this research either improved the performance and the motivation or insisted to reduce the risk of injury.
As described above, these training methods that use objective data from sensory devices are focused on providing quick feedback of hints to the learner. In other words, it is important for coaching to use mechanisms that can provide quick feedback to the learners.
2.2. Training Methods Based on Machine Learnings
In the recent years, machine learning approaches have been applied to motion analysis for a variety of movements. For example, Ref. [
20] applied an artificial neural network (ANN) to the movement data of Parkinson’s disease, in which the body movement is impaired due to abnormalities in the brain. This approach focuses on features selected from a kinematic perspective, such as joint angles and gait velocity. Then, the analysis detects motor abnormalities from healthy people and automatically diagnoses the disease stages. Ref. [
21] proposed a deep learning-based framework for assessing a patient’s performance in rehabilitation exercises. Ref. [
22] proposed an automatic fall detection system that identifies 20 different spontaneous falls and activities of daily life activities by using 6 types of machine learning methods. Thus, several applications have been proposed for supporting healthy life and medical diagnosis for people’s daily movements.
On the other hand, for analyzing multiple athletes’ movements in team sports, it is necessary to consider various technical, tactical, and conditional factors. Ref. [
23] conducts design for training methods and performance analysis for soccer, basketball, and rugby, respectively, by using PCA. Ref. [
24] applies a support vector machine (SVM) called the Hybrid Fuzzy-SVM model (HFSVM) to predict the outcome of basketball games. These analysis of team sports are based on the win–lose results of teams, which provide a macro-perspective for data analysis of sports.
Furthermore, we can find analyzing methods that focus on movement against individual athletes in team sports and also in individual sports. For example, Ref. [
25] classified the jumping ability of soccer and basketball players by using a logistic regression. In addition, Ref. [
26] classified running styles by using a recurrent neural network of a bidirectional long short-term memory. Ref. [
27] automated the measurement of punch speed in shadowboxing by using ANN in the form of a multilayer perceptron. Ref. [
28] proposed a method to analyze the difference of the movements between advanced and novice athletes by using an SVM to obtain movement key and weak points from sensor data.
As described above, it is possible for the advanced research results to classify movements and to predict a win or loss in a game by applying machine learning methods to analyze various individual movements, such as body angles and coordinate values.
2.3. Discussion
According to the research backgrounds above, it is obvious that the methods using videos and sensors are emerging in modern sports coaching. Some of these methods enable us to analyze various types of movements through the machine learning approach. However, the methods focusing on movements have been limited to the analysis of team-based or individual movement itself. Therefore, the methods are not able to analyze the movement that is affected by any external factors, such as the ones seen in combat sports. Furthermore, it is currently not possible to analyze those movements in real-time. In other words, there is no real-time method that can determine an appropriate movement best fit to a situation. Such a method would enable us to provide a novel real-time coaching method based on objective indicators even in the sports that are affected by the external factors.
Here, let us consider an analyzing system that predicts a successful movement from the posture right before a target movement.
Figure 1 shows two approaches for predicting the successful movement. Regarding
Figure 1a, we first input datasets that consist of the postures and its types immediately before a target movement to the analyzer. Then, we can derive key factors of the posture immediately before the successful movement statically through a statistical analysis. In other words, we can know the optimal posture to be taken immediately before a certain movement from the statistical result from the system. This approach can provide a coaching theory based on the results. On the other hand, regarding
Figure 1b, we input the datasets to the analyzer, as well as the former system. However, using the datasets, we train a predictor that infers the successful movement. According to the predictor, we can infer the successful movement from the posture right before a target movement in real-time. Here, let us summarize the differences between the former method and the latter one. The former method is based on a statistical analysis to find the factors related to the successful movements. This allows us to recognize which factors provide a successful movement from the statistical result. The latter one does not show the correlation of the factors against the successful movements. It infers a successful movement from the factors without showing which factor is relevant to the successful movement. Therefore, there are the opposed directions between those two methods. Thus, we can apply both approaches described above to individual sports, as well as combat sports that the athlete is affected by the external factors. However, the latter method can have the ability to infer the successful movement in real-time. Finally, in this paper, we focus on the latter approach because the system will address the problem that the real-time analysis has not been realized.
In this paper, we focus on judo as a sport that includes external factors. Additionally, then, we will propose a method for predicting the successful throwing technique against the Kumite posture just before the movement in real-time. In reference to the former approach, as shown in
Figure 1a, we have already proposed the XSM (extraction method for successful movements) for judo throwing techniques. However, this method has two problems. First, it does not have an availability for the real-time analysis to predict the successful throwing techniques. If we try to predict a successful throwing technique from a Kumite posture just before the throw in real-time based on the results obtained by the XSM, some Kumite postures do not match to any combinations of the candidate factors found from the XSM. Second, the XSM uses the
test. The test is not able to treat a large number of the candidate factors due to the well-known problem regarding the prediction accuracy. It is known as Cochran’s rule [
29], that analyzing a contingency table with many combinations of the candidate factors and the successful movements is not suitable. Thus, in the case of statistical approaches in the XSM, when the more candidate factors are considered, the more combinations of the successful movements are needed. However, to obtain all those combinations, we need to gather a large enough number of video scenes that includes all combinations of the candidate factors. This is not a realistic trial to manage the analysis. Therefore, in order to predict a successful movement from the candidate factors in real-time, we should use a method that is capable of analyzing any combinations of the factors instantly captured from a video scene. To address such prediction, we need to develop a real-time analyzing method that focuses on how to infer the successful movement by applying a machine learning approach. In this paper, we address the real-time prediction method that infers a throwing technique from candidate factors of the Kumite posture just before the throw.
As described above, after the development of the novel method that instantly predicts an appropriate successful throwing technique from a Kumite posture by a machine learning approach, we can implement a novel framework, such as a guide system for real-time coaching and a live commentary system with winning-point timing predictions in sports games. In this paper, we will propose the RT-XSM (Real-time extraction method for successful movement) using a machine learning approach. It predicts instantly the types of throwing techniques that are likely to be successful inferred from the factors of a Kumite posture just before any throw.
3. Method for Predicting Successful Throwing Techniques in Judo
3.1. System Overview
We propose a system that consists of three phases, as shown in
Figure 2. The first one is the preparation phase. We prepare datasets that maintain combinations of a successful movement and factors. The factors are composed from the posture just before the successful movement. The second one is the training phase. We apply the dataset to a machine learning model to generate a trained model that can predict a successful movement. The final one is the inference phase. We input the factors that compose the posture just before the successful movement into the trained model to infer a successful movement.
In the data preparation phase, we pickup characteristics that likely contribute to a successful movement from postures just before the successful movement. Focusing on the characteristics, we collect a combination with the status of those characteristics on the posture and the category of the successful movement from a video scene that includes the successful movement. Here, we define the characteristics of the posture so that they include external factors as well. We call the characteristics the candidate factors. The factors represent status of the body part just before a successful movement. During this phase, we define N candidate factors that are the characteristics of the posture right before a successful movement. The factors are marked as 1 when the status is true and 0 otherwise. Next, we prepare a dataset of the k-th successful movement with the candidate factors. The M is the number of the classified successful movements. Therefore, the j-th dataset regarding is presented by .
Using the dataset S, the training phase will generate a trained model that infers from the combination of . Thus, the model will predict a successful movement from the candidate factors. Here, we create a machine learning model that regresses the probability for each from . For the regression model, we will use a method that regresses the probabilities for all occurrences (i.e., ) and select the occurrence of the highest probability among them.
Finally, the inference phase receives a set of candidate factors collected in real-time and applies it to the model generated by the regression above. Therefore, the model derives the probability for each and outputs the successful movement which achieves the highest probability as calculated by instantly.
3.2. Candidate Factors for Successful Throwing Techniques
Here, let us consider the application of the above system for judo throwing techniques. A successful judo throwing technique is brought by interactions between the thrower (called
Tori) and the throwee (called
Uke). Therefore,
are selected from the characteristics of Tori and Uke at the Kumite posture just before the transition to a throwing technique. On the other hand, the successful movements
are defined based on the classification of the throws that determines the winner of the match. The Kano’s classification classified the throwing techniques based on the initiation point of the throw, and defined four major classifications: hand, hip, foot, and sacrifice techniques. The detailed definitions are described in the rulebook of the International Judo Federation [
30]. Here, we predict throwing techniques from Kumite posture using four throwing technique groups above as
.
Additionally, we choose a total of 49 candidate factors to identify a Kumite posture based on [
31]. Here, we focus on four types of factors: head height, body contact, body position, and arm position. The head height refers the head positions of Tori and Uke. The body contact refers the states of contact between Tori’s and Uke’s bodies. The body position refers the positions and the tilts of Tori’s and Uke’s bodies. The arm position refers the positions of Tri’s and Uke’s arms. The body position and the arm position are further divided into more detailed factors.
The body position is based on the definition of judo posture. We can categorize those into two major types: natural postures (basic natural posture, right natural posture, and left natural posture) and defensive postures (basic defensive posture, right defensive posture, and left defensive posture). These postures are based on the direction which the body is facing and whether the posture is defensive or not. These body postures are defined in [
31] by a single factor that places shoulders and feet in parallel. However, we define them into separate factors because these directions are reflected separately during the movement of the throwing technique. According to the discussion above, we divide the body position into 16 factors totally regarding Tori and Uke, respectively.
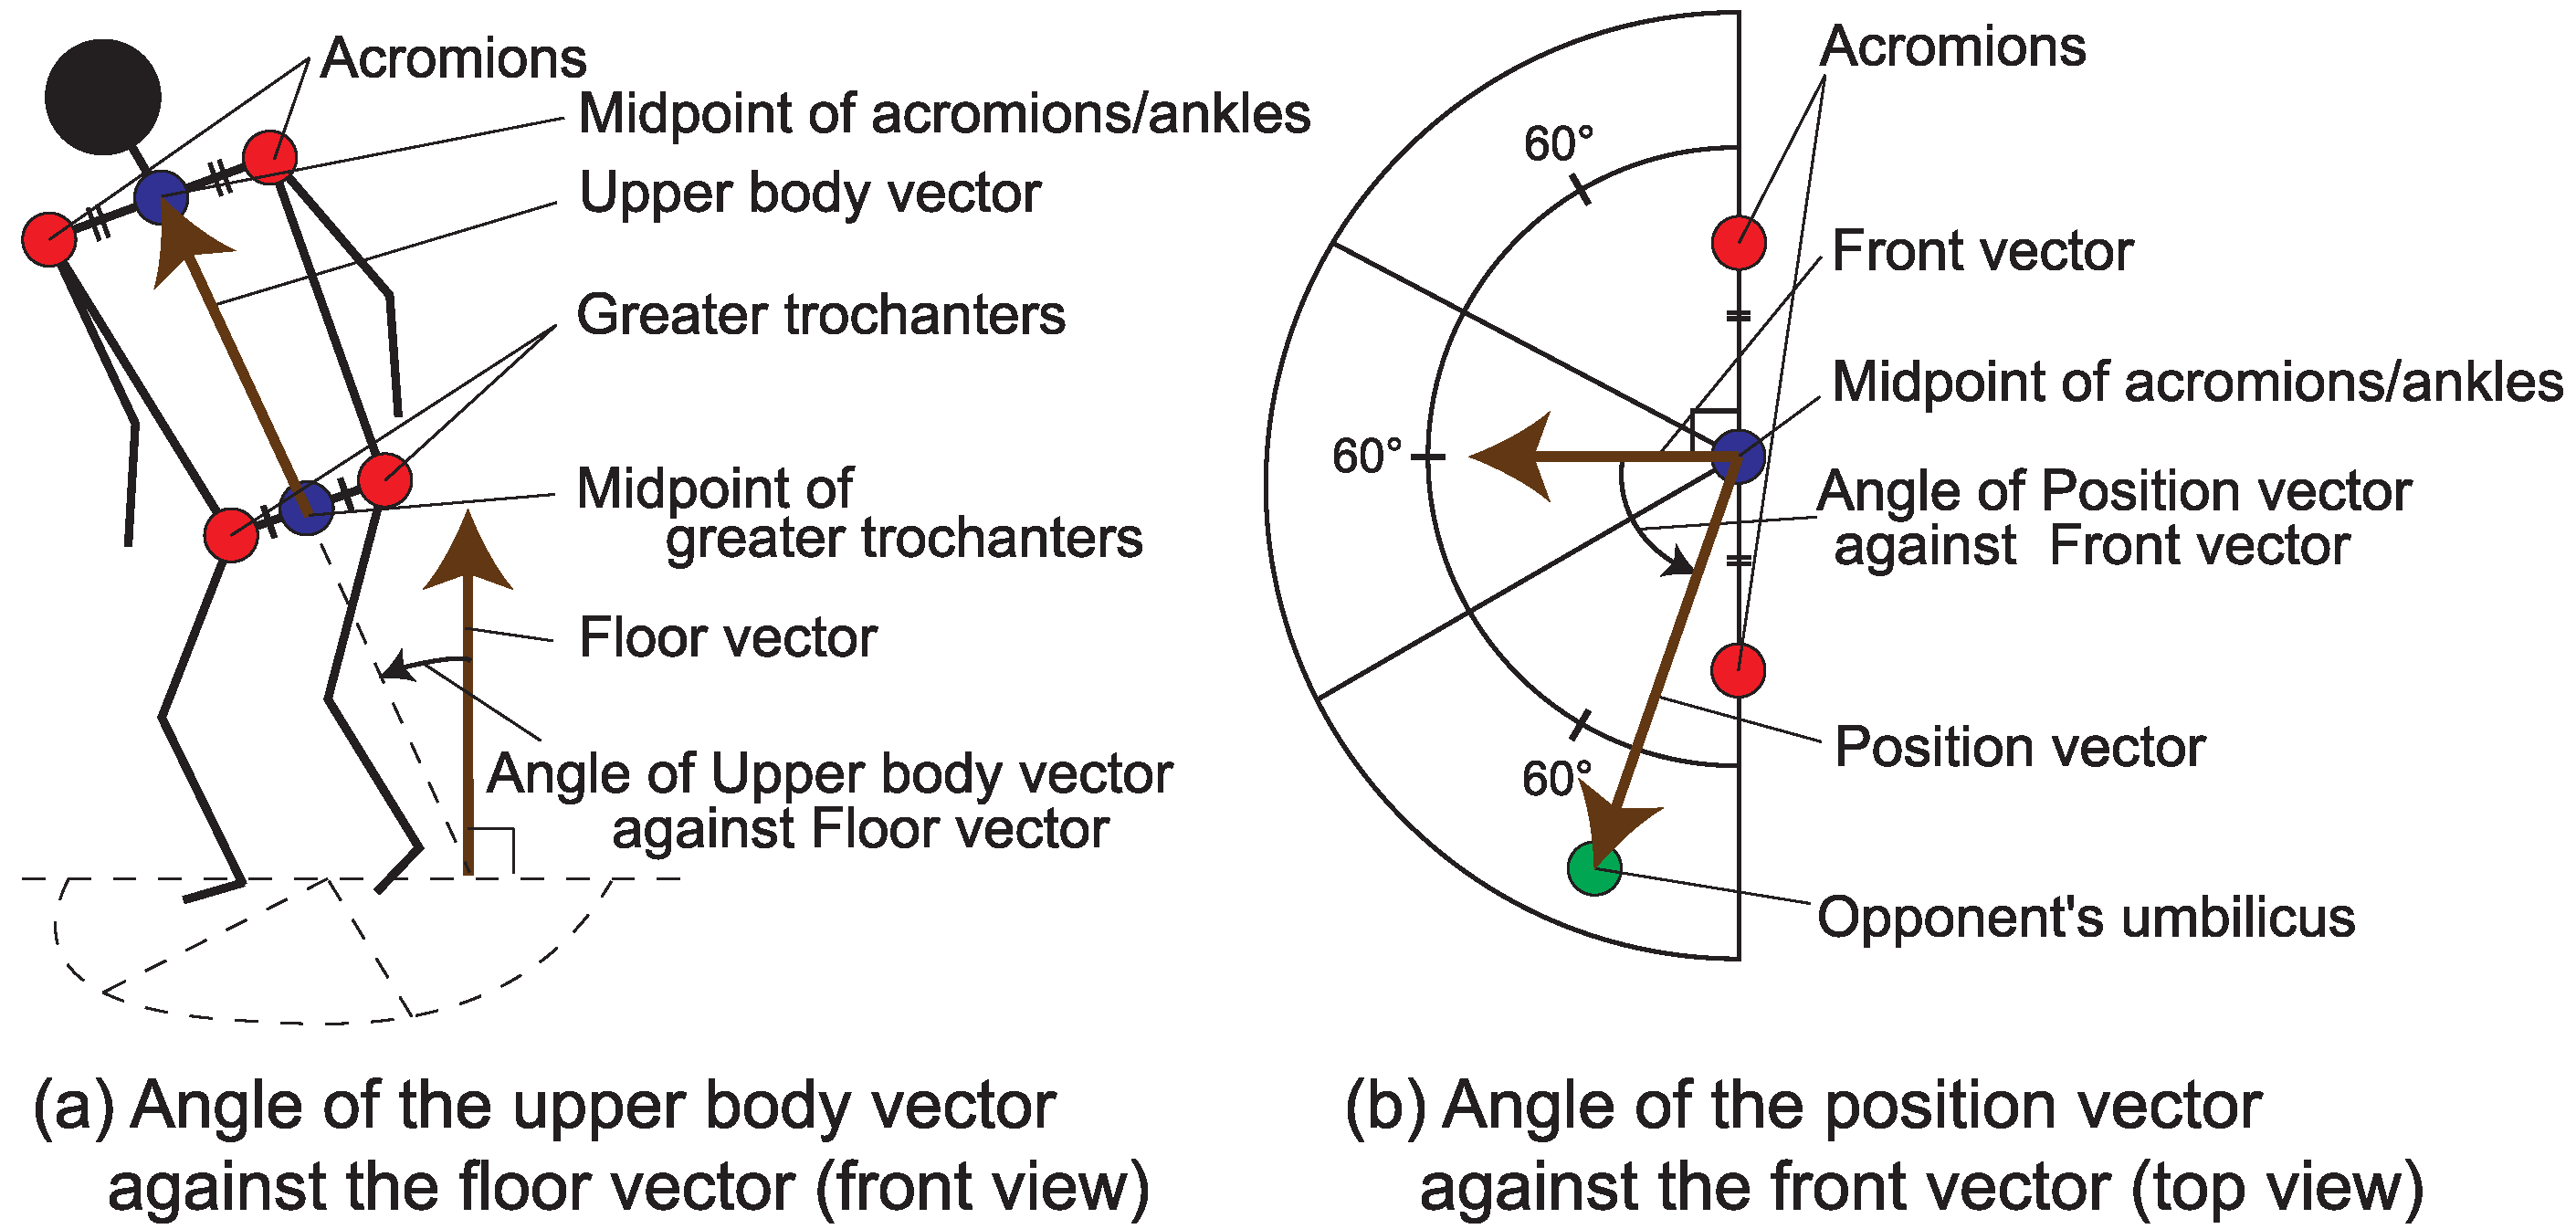
Here, the angle of the upper body determines whether the posture is defensive or not. As shown in
Figure 3a, we consider the upper body vector that is the vector from the midpoint of the greater trochanters to the midpoint of the acromion, and the floor vector that is the vertical upward vector from the floor. We define the angle of the upper body vector against the positive vector as “Natural” if it is less than 45 degrees and “Defensive” otherwise. Regarding the direction of the shoulders and feet, as shown in
Figure 3b, from the top view of
Figure 3a over the head, we consider the front vector that is the vector in the forward direction on the body of the vertical bisector of acromions or ankles, and the position vector that is the vector from the midpoint of acromions or ankles to the position of the opponent’s umbilicus. We define the angle of the position vector against the front vector as “Front” if it is less than 30 degrees to the left or right, “Right” if it is greater than 30 degrees to the right, and “Left” otherwise. Regarding these angles, we use heuristic values from observation of the video scene.
Next, regarding the arm position, by referring to Ref. [
31], we focus on the relationship between the arm action and the arm’s inside/outside relationship. It is related to how easy Tori performs a throwing form. The arm position is defined by eight factors focused on the left or the right arm of Tori or Uke. We consider five possible patterns of the arm actions: “No effect” when Tori and Uke are not gripping anywhere, “Arm” when one player is gripping the opponent’s arm or judo uniform around an arm, “Front” if one player is gripping the opponent’s judo uniform on the front side of the body, “Back” when one player is gripping the opponent’s judo uniform on the back side of the body, and “Reverse” when one player is gripping somewhere on/from the opposite side of the opponent’s body (i.e., one player’s right/left hand grips the right/left half of the opponent’s body). Regarding the arm’s inside/outside relationship, the status of arm is marked as “Inside” when a part of the right/left arm (including the wrist and elbow) is the center side of the opponent’s body and/or below the opponent’s left/right arm, and “Outside” otherwise. According to the definitions above, we categorize and mark the arm position into a set of 28 factors totally regarding the left/right arms of both Tori and Uke, respectively.
According to the definitions above, we extract four main factors of the head height, the body contact, the body position, and the arm position. Additionally, then, we prepare a dataset of 49 candidate factors shown in
Table 1. Thus, using the datasets, we will develop a machine learning method that predicts the successful movement consisting of four groups of throwing techniques categorized into hand, hip, foot, and sacrifice techniques.
3.3. Machine Learning Algorithms Used for Revealing Successful Throws
Now, let us consider a regression to predict the possible throwing technique group from the candidate factors. In the consideration of dealing physical movements, the distribution of the dataset cannot be expected due to its high diversity. Therefore, we use the logistic regression in this study as a distribution-independent regression method.
The logistic regression is one of the linear regressions that expresses the expected probability of occurrence
of an event, as follows:
For the input events , it is linearized by using its coefficient parameters .
Here, the expected probabilities of occurrence
of an event are expressed as follows.
The
are expressed by using the standard sigmoid function
F as follows.
Thus, if we can find the coefficient parameters, we derive the expected probability of an event in the domain applying a sigmoidal function. To find the coefficient parameters, the maximum likelihood estimation is often used by performing the approximation.
In our proposed method, as the input to the logistic regression, we use 49 candidate factors prepared as a sequence of 0 or 1 (i.e., 1 means the factor is taken, 0 otherwise). Then, we estimate the coefficient parameters and calculate the probabilities corresponding to four throwing technique group . Finally, we derive the highest probability of to find the most probable throwing technique group from the candidate factors of the Kumite posture.
As explained above, the RT-XSM creates a prediction model of the logistic regression to predict the most probable throwing group in real-time. The model is trained by the dataset of four throwing groups and 49 candidate factors that are observed from the Kumite posture. Thus, we can implement a real-time prediction system that receives a dataset of the candidate factors newly collected.
4. Experimental Evaluations
4.1. Experimental Setup
Now, we demonstrate the validity of the RT-XSM by showing analysis examples of predicting judo throwing techniques. For datasets of throwing technique scenes, we use videos from the 2019 World Judo Championships, 2018 World Judo Championships, 2019 World Masters, and 2018 World Masters. Those are available from the IJF website. We collected 781 successful scenes of single throwing techniques, but excluded counter and combinational ones.
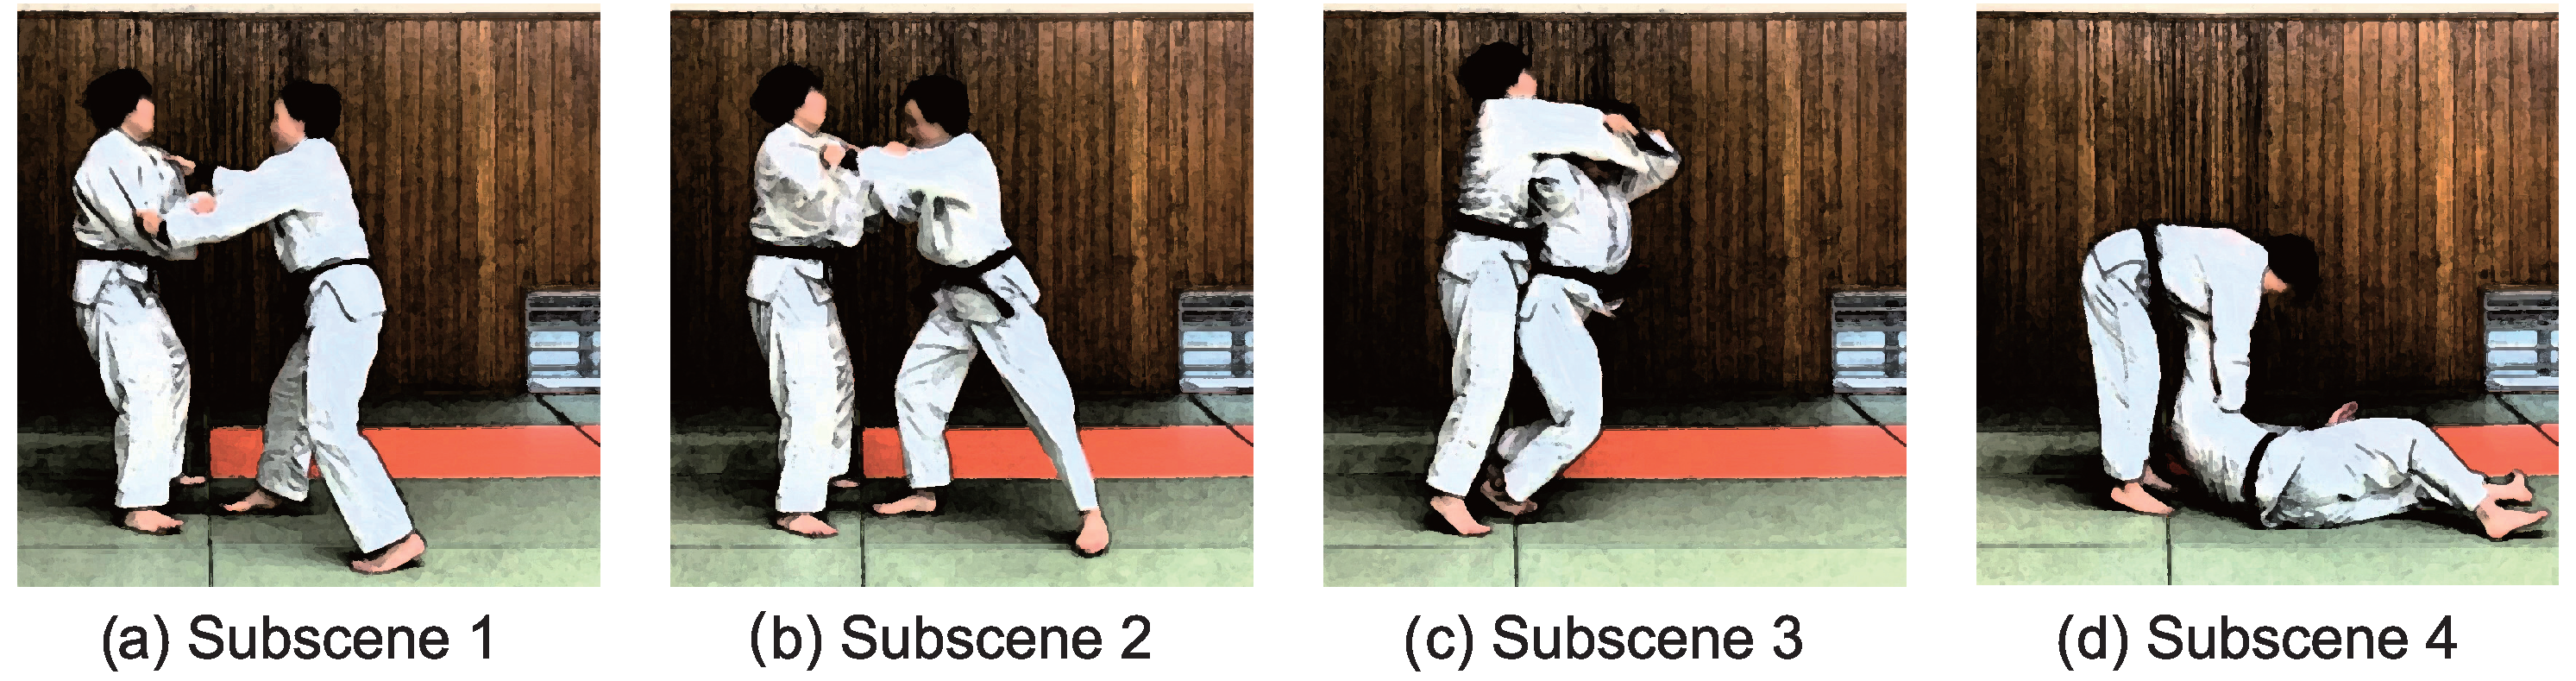
Table 2 shows the percentage of the sorts of scenes. We call this dataset the entire dataset. By checking every scene of single successful throwing techniques that become Waza-ari or Ippon during game match, we have corrected a set of the 49 factors from the Kumite posture. The Kumite posture is defined by the subscene of a video frame right before a leg of the Tori leaves the floor, as shown in
Figure 4a.
In our evaluations, we performed three experiments. First, we discuss the prediction accuracy using all datasets. Next, we discuss the case of splitting the datasets by applying gender attribute. These two evaluations analyze the effects due to unbalanced dataset and attribute information in the dataset. Finally, we try to improve the prediction accuracy of the RT-XSM.
Using the datasets for the training phase of the RT-XSM, we evaluate the prediction accuracy using the leave-one-out cross-validation by calculating the percentage of the actual throwing technique group. Furthermore, to evaluate the overall accuracy of the throwing technique groups, we observe the confusion matrix and its F-value. The overall accuracy is calculated by the average of all categories of the throwing techniques (the average of the diagonal values in the confusion matrix of F-value later shown in the figures). Finally, we discuss the effectiveness of the RT-XSM by using these indicators for three experiments.
During the experimental evaluation, we have implemented the RT-XSM using Python 3.8.5 with the libraries of numpy, pandas, matplotlib, tensorflow, keras, seaborn, and itertools on an Intel silicon MacBook.
4.2. Calculation for Accuracy Evaluation
The leave-one-out cross-validation selects a part of datasets for the evaluation test and uses the others for the training of the model. It checks the matching ratio between the actual throwing technique group (true value) and the predicted throwing technique group (predicted value).
Here, when the training data have a bias, the percentage of the matching ratio might become high. Therefore, we observe the confusion matrix to verify the prediction accuracy for each throwing technique group. The confusion matrix is a table with the predicted throwing technique groups on the horizontal axis and the actual throwing technique group on the vertical one. We count the cells that correspond to the combination of the predicted and the actual values obtained by leave-one-out cross-validation. Thus, the sum of all cells equals to the total number of scenes of the successful throws.
The next step is to calculate the
F-value. For each cell in the confusion matrix, we calculate the precision ratio
P of the sum of cells in a row and the recall ratio
R of the one in a column. The harmonic mean of the precision and the recall ratios is derived as the
F-value. The calculation is as follows;
We calculate this for all cells in the confusion matrix. If the F-value of the diagonal components is high relative to the other cells, we can say that the prediction accuracy is high for the entire throwing technique groups.
4.3. Evaluation for Accuracy to Predict Successful throw
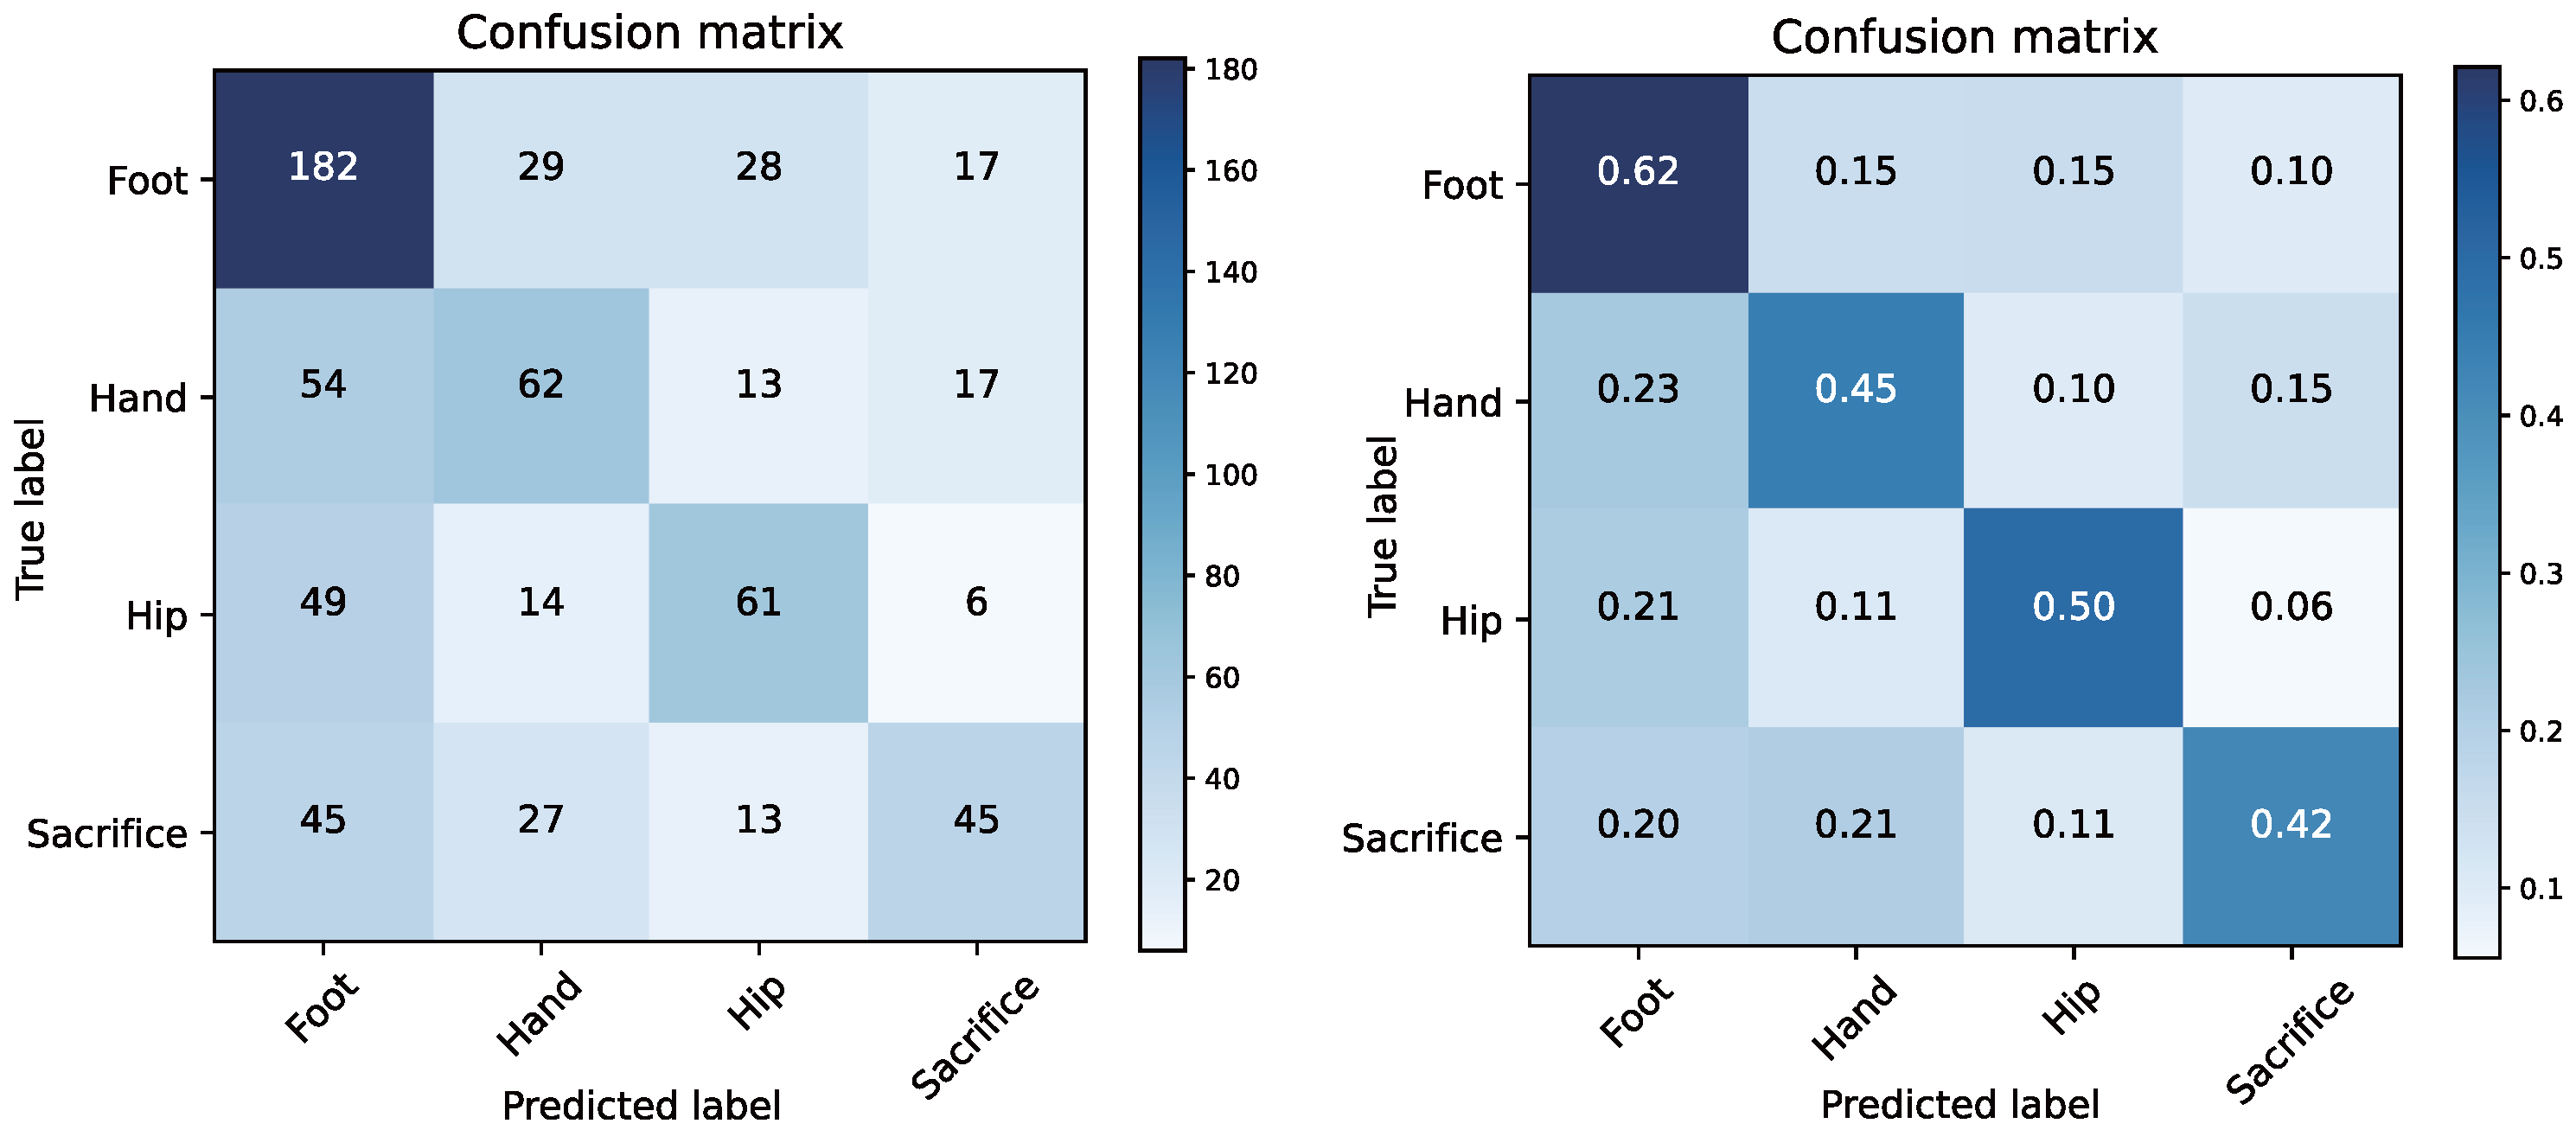
Figure 5 shows the confusion matrices when using the entire dataset. The table on the left shows the table where each cell contains the number of scenes. The one in the right shows
F-values. We confirmed that the overall accuracy rate was 53.5%. This means that the throwing technique groups can be predicted correctly more than once among the twice predictions. Furthermore, the
F-values of the diagonal components in the confusion matrix are higher than the others.
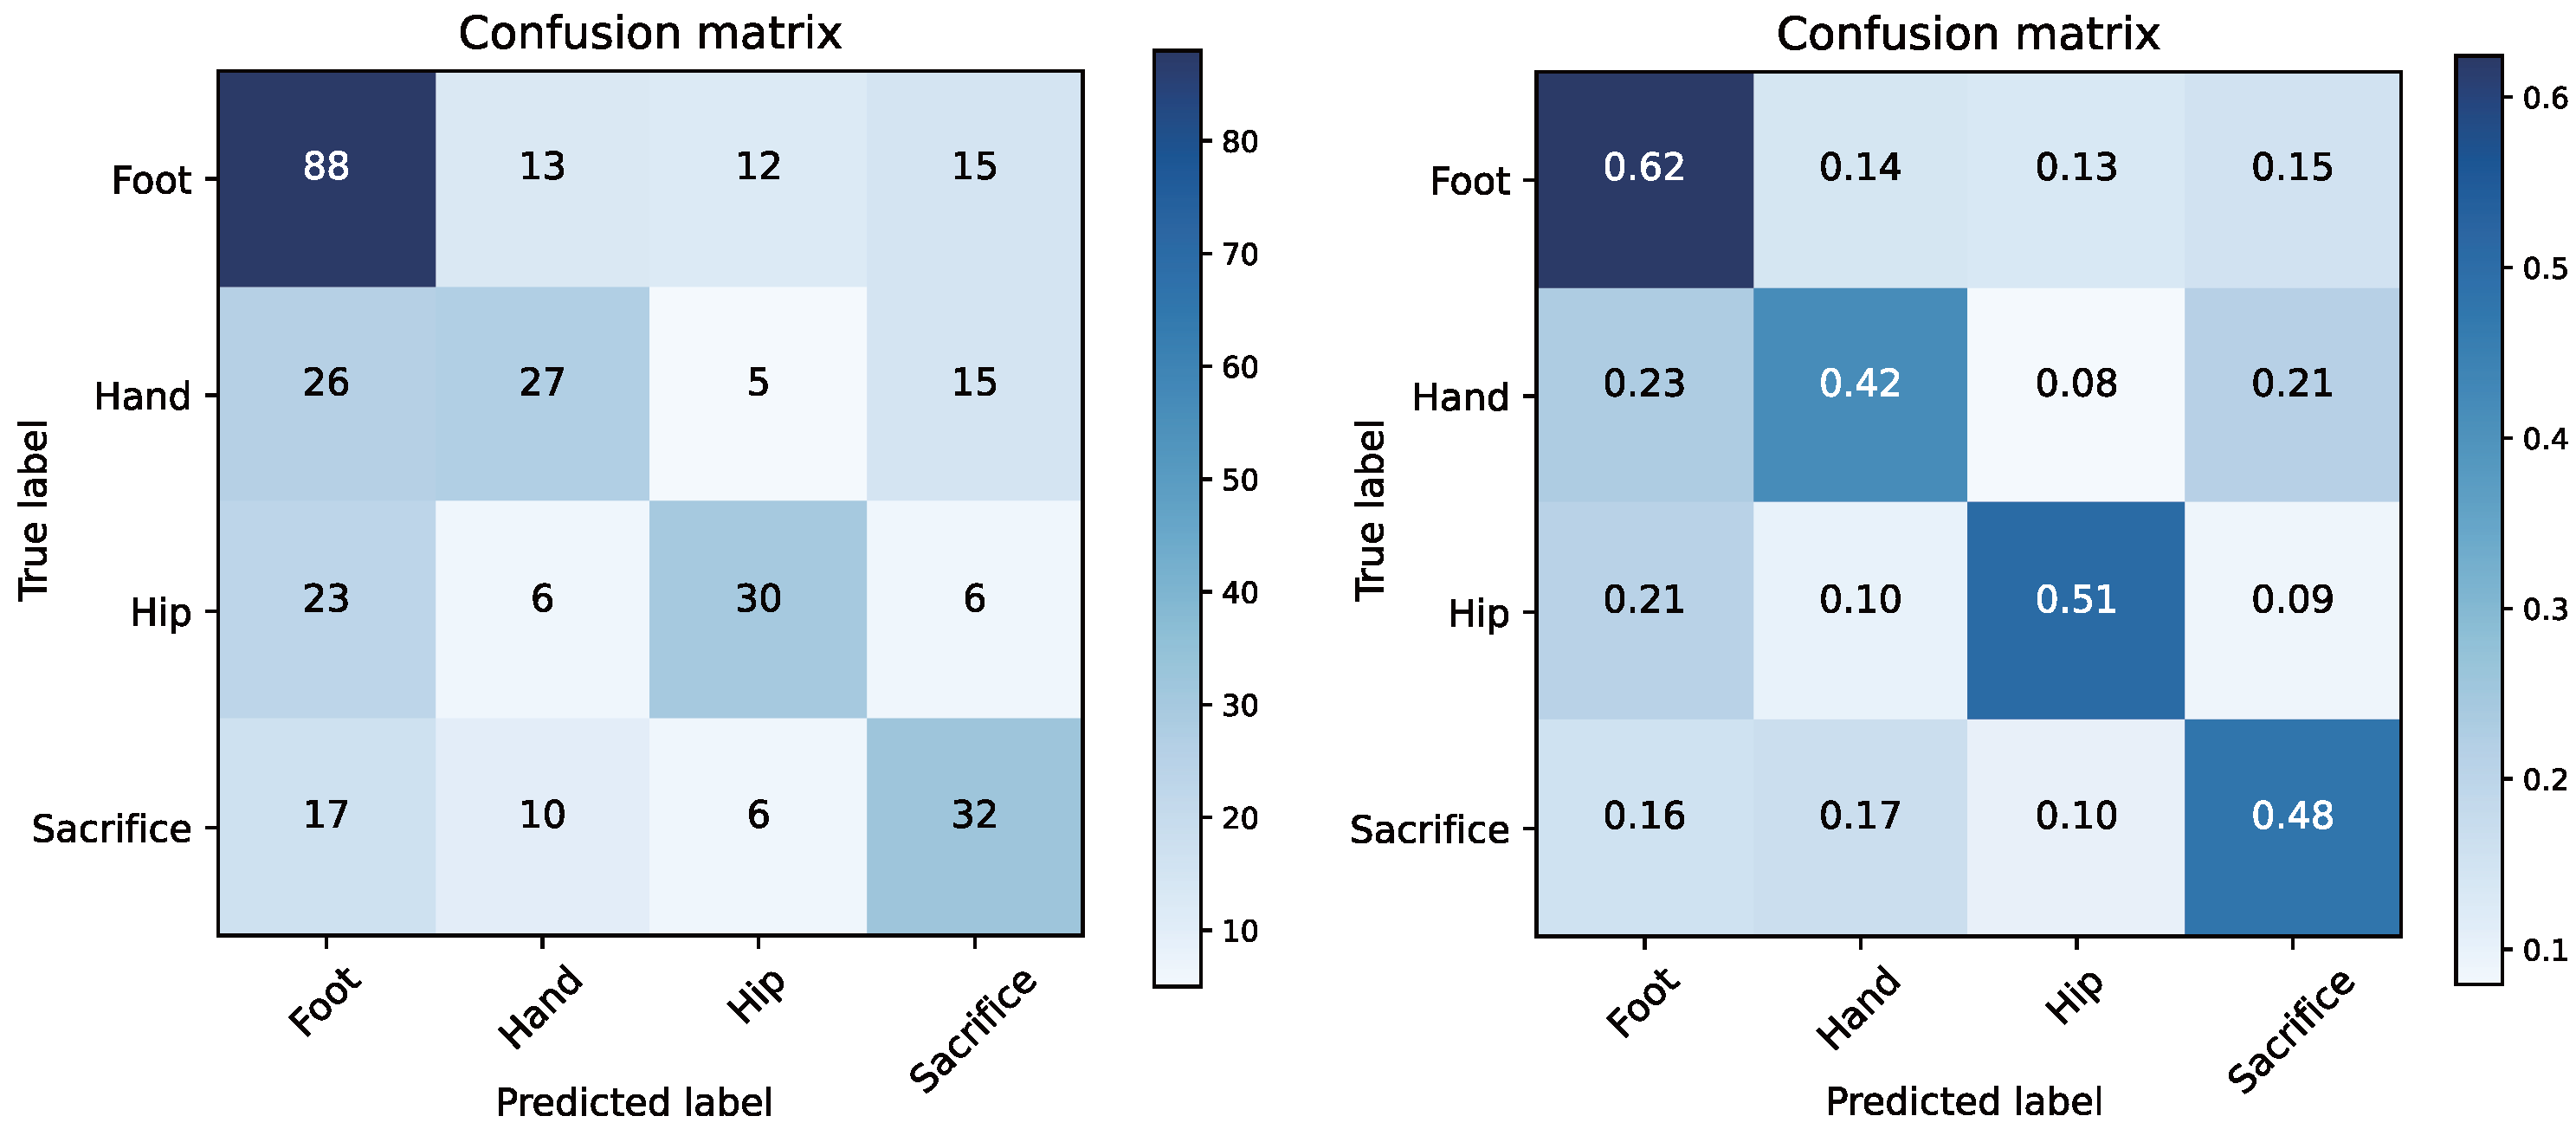
In this evaluation, the number of throwing techniques in each group was biased regarding the attribute of men and women. Therefore, we examined whether the bias affected to the accuracy of the prediction. Therefore, we normalized the entire dataset by balancing the numbers of individual throwing techniques between men and women. We call this dataset the normalized dataset. We have normalized the entire dataset to the smallest numbers of each throw. For example, when the numbers of Seoi-nage in the datasets were 2 for men and 3 for women, we discarded the difference and reduced the number of datasets of women’s to 2. This normalization provides a set of balanced datasets regarding the gender attribute.
Figure 6 shows the confusion matrices of the number of scenes in the left and the
F-values in the right derived from the balanced datasets. The total number of datasets is reduced to 574 scenes by the normalization. Even in this evaluation, the overall accuracy rate also maintains 52.8%. Furthermore, the
F-values in the diagonal components in the confusion matrix achieved also higher than the others. The results are the similar to the case when the entire dataset was used without the normalization.
Next, we examine whether the prediction accuracy differs with respect to attribute. Here, we focus on the gender attribute and examine whether the attribute difference affects to the prediction accuracy. Using the normalized datasets according to the gender attribute in the previous evaluation, we prepared both the datasets of men’s and women’s cases and used those separately for each attribute. We call these datasets the men’s dataset and the women’s one, respectively. Note that each dataset has 287 cases of the throwing techniques.
Figure 7 and
Figure 8 show the confusion matrices of the number of scenes in the left and the
F-values in the right. The overall accuracy rate was 53.5% for the men’s dataset and 49.5% for the women’s dataset, which results the similar prediction ratio to the ones in the evaluations above.
In summary, according to the evaluations above, all analysis have resulted the similar prediction ratios among the case with all datasets, the one with the normalized number of datasets and the one with the datasets separated by attribute. Therefore, we confirmed that the RT-XSM achieves the same prediction accuracy even when datasets include all cases without considering attributes. Thus, we can say that the RT-XSM predicts the successful throwing technique from the Kumite posture either without classifying the datasets by attribute or without modifying the bias of the datasets.
4.4. Improving Prediction Performance
The prediction performance in the evaluations previously shown was not enough to determine the successful throwing technique because we have focused on the topmost predicted result. To improve the prediction accuracy, we have analyzed the prediction results by deriving the accuracy of the prediction results regarding the ranks from the topmost to the last.
Table 3 shows the numbers of the cases when the actual throwing techniques are included when we analyze the accuracy with varying the considering ranks. The rows in the table are the ranks that the actual throwing techniques are included. The second and the third columns are the number and the accuracy rate of predicted results, respectively, that include the actual throwing technique in the corresponding ranks. For example, when we consider the prediction results until the second rank, the prediction ratio becomes 77%.
Here, let us discuss the reason why the prediction ratio is improved much by including the second most predicted result. We focus on the predicted results when we consider the prediction accuracy regarding the topmost and the second ranks.
Table 4 shows the number of predicted results in the first and the second topmost predicted results when the actual throwing technique results in the first rank. Some cells in the table include large numbers of correctly predicted cases between two different categories. Similarly,
Table 5 shows the number of predicted results in the first and the second topmost predicted results when the actual throwing technique results in the second rank. The table also shows relationships among some pairs of the categories. According to these tables, we derived the total numbers of the predicted cases focused on the pairs of the categories; the total of the pair of the foot and the hand categories is 182. The one of the foot and the hip categories is 172. The one of the foot and the sacrifice categories is 109. The one of the hand and the hip categories is 21. The one of the hand and the sacrifice categories is 101. Finally, the one of the hip and the sacrifice categories is 19. Based on the total numbers, we can depict the relationships among the categories of the throwing techniques as shown in
Figure 9. The arrow shows the availability that both throwing techniques would be successful from a Kumite posture. The width of the arrow indicates the height of the availability corresponding to the numbers of the total cases of the pairs of the categories. Regarding the relationships depicted by the arrows, we found that we can have reasonable explanations for all the relationships by considering how to initiate the throwing techniques on both sides of each arrow. Regarding the relationship between the hand and the foot categories, Tori’s body position against Uke is similar in the Kumite posture. Regarding the one between the hand and the sacrifice categories, Tori needs to break posture of Uke (i.e., Kuzushi). Therefore, the factor of head height is similar in the Kumite posture. Regarding the one between the hip and the foot categories, Tori tries to throw Uke by piggybacking Uke on a Tori’s leg or on Tori’s hip. However, the factor of Tori’s body position against Uke is similar in the Kumite posture. Finally, regarding the one between the foot and the sacrifice categories, trunk of Tori’s body against Uke keeps some distance in Kumite posture. This means the factor of the body contact is similar in the Kumite posture.
Due to the similarities presented by the arrows in
Figure 9 above, we can know that the Kano’s category includes ambiguity among the throwing techniques in the aspect of the Kumite posture. We can find the cases during a game match when the offensive player may make a different decision after a throwing technique is initiated. For example, the offensive player can change the decision from Seoi-nage to Uchimata during the throwing phase because the postures of those techniques are compatible during the throws. This can decrease the accuracy of the RT-XSM if we choose the topmost successful movement. Additionally, the actual throwing techniques in the training dataset used for the training phase of our technique are decided by judges and/or staffs in the games. This also has ambiguity for categorizing throwing techniques. Therefore, we should evaluate the predicted results with including some ranks derived from the logistic regression in the RT-XSM to improve the prediction performance.
In judo, it is difficult to eliminate the ambiguity mentioned above. This causes low prediction ratio for the successful throwing techniques from a Kumite posture. However, we have found a method to improve the prediction ratio is by including the several ranks from the topmost predicted results. For example, when we use the most and the second most predicted results, we can know the successful throwing technique is one of the predicted ones that are similar throwing techniques initiated by the Kumite posture used as the input of the RT-XSM. In this case, the accuracy becomes 77%. This will be helpful information to analyze physical performance and weak points of the opponent player in a match game. Moreover, when we derive the relationships among the categories as discussed above, we can know the factors that initiate the similar categories. The relationships are useful hints for trainers and coaches to guide judo players how to initiate throwing techniques. As discussed above, our proposed method, RT-XSM, have performed effective prediction for the successful throwing technique from a Kumite posture considering the topmost predicted results and also have brought a visualization technique for the relationships in the categories that is worthwhile objective information for training and coaching.
5. Conclusions
We focused on the development of a method for predicting a successful movement from the posture just before the movement, especially focusing on predicting a successful throwing technique in judo from the Kumite posture. We proposed the RT-XSM that predicts the successful throwing techniques from the Kumite posture in real-time by applying the logistic regression. The conventional statistical method, XSM, had a problem in the statistical approach that the reliability of the analysis becomes low when the number of candidate factors is large. However, the RT-XSM solved this problem. We evaluated the effectiveness of RT-XSM by using the datasets of the candidate factors collected from the video scenes. Our method achieved the prediction for the possible throwing techniques. We also found that the combination of the datasets and their attributes had no effect to the accuracy. To improve the prediction accuracy, we analyzed the ranking of the possible successful throws. We figured out the possibilities that a Kumite posture can induce multiple throwing techniques. The knowledge which throwing techniques are successful will become useful information for coaching throws and tactical analysis before game matches. Finally, we conclude that the RT-XSM is capable of flexibly predicting successful movements in motor skills affected by external factors, such as an opponent player.
The major limitation of the RT-XSM is that we have not discussed the accuracy of the proposed method regarding some throwing techniques rarely occurred in the judo games. Therefore, the dataset used in our experiment are narrowed down to four categories, rather than by technique name. However, the method needs a training for the logistic regression with large numbers of datasets for all the classes to obtain the higher accuracy. To address this problem, we continue to gather much more dataset used for the analysis. Then, we will report the progress of the accuracy improvement.
In addition, since we can now predict successful movements in real-time, we can eliminate unreasonable movements that do not match to the predicted results. This leads us to avoid injuries. Furthermore, applying the RT-XSM to the datasets from health promoting activities such as walking and jogging, we could apply the method to health care. We will plan to implement such applications in the future.


