2. Related Work
In general, sophisticated compression methods for various application data types exist. However, no method has been tailored for HIFU simulation data. Most of the related papers focus on the compression of data obtained by general ultrasonic imaging.
Three-dimensional ultrasound computed tomography (USCT) data can be reduced with a compression method based on the discrete wavelet transform [
4]. Many techniques have been applied to process one-dimensional (1D) ultrasonic signals, for example, matching pursuit, the 1D discrete cosine transform (DCT), and the Walsh–Hadamard transform (WHT) [
5,
6]. Radio-frequency (RF) signals after analog-to-digital conversion before beamforming are compressed with techniques such as peak gates, trace compression, largest variation (LAVA), and linear predictive coding (LPC), or also with the well-known ZIP, JPEG, or MPEG methods [
7,
8]. Some of the above-mentioned techniques can be applied to HIFU simulation data; however, they are not focused on on-the-fly parallel data compression during large-scale simulations. A relevant overview and comparison of the compression standards for ultrasound imaging can be found in [
9]. Unfortunately, all these standards process the data as 2D slices, leading to unsuitability for parallel on-the-fly processing. Plenty of coding methods have been developed to deal with the compression of audio and speech signals. Lossy compression methods provide higher compression ratios at the cost of fidelity. These methods rely on human psychoacoustic models to reduce the fidelity of less audible sounds. In contrast to this, lossless methods produce a representation of the input signal that decompresses to an exact duplicate of the original signal. However, the compression ratios are around 50–75% of the original size. For the purpose of our comparison, we selected several common audio coding methods, implemented in the FFmpeg framework. These are the Advanced Audio Coding (AAC), AC-3, Opus, adaptive differential pulse-code modulation (ADPCM), Free Lossless Audio Codec (FLAC), Apple Lossless Audio Codec (ALAC), and uncompressed pulse-code modulation (PCM). The individual formats are briefly discussed below in this section. The inquiring reader is referred to [
10] for further details.
As mentioned earlier, the typical size of the ultrasound data to be compressed reaches about 0.5 TiB. Because the existing audio coding methods were not designed for use in extremely memory-limited environments, they consume the signal samples in frames typically containing thousands of samples. In conjunction with the previous point, such large frame sizes make the common audio codecs unusable for compression of the ultrasound data. Another issue to deal with is the sampling rate. Because the human hearing range is commonly given as 20 to 20,000 Hz, the common audio codecs were designed to process signals of comparable rates (e.g., 44.1, 48, 96, or 192 kHz). However, ultrasound signals are acquired (simulated) at a much higher sampling rate. For instance, the rate of our testing signals was 20 MHz. We were therefore forced to slow down the ultrasound data to normally audible frequencies. We chose the sampling rate of 48 kHz, as this was the greatest common denominator of all the examined audio formats. This step did not involve any subsampling signal. It was merely a matter of instructing codecs. Another technical issue was the appropriate audio bit depth selection. We used 16 bits per sample (bps), as this was the common bit depth supported by all the examined codecs.
AAC is an international standard for lossy audio compression. It was designed to be the successor of the ubiquitous MP3 format. Because AAC generally achieves better sound quality than MP3 at the same bit rate, we omitted the MP3 format in our comparison. The compression process can be described as follows. First, a modified discrete cosine transform (MDCT) based filter bank is used to decompose the input signal into multiple resolutions. Afterwards, a psychoacoustic model is used in the quantisation stage in order to minimise the audible distortion. The time-domain prediction can be employed in order to take advantage of correlations between multiple resolutions. The format supports arbitrary bit rates.
Dolby AC-3 (also Dolby Digital, ATSC A/52) is a lossy audio compression standard developed by Dolby Laboratories. The decoder has the ability to reproduce various channel configurations from 1 to 5.1 from the common bitstream. During the compression, the input signal is grouped into blocks of 512 samples. However, depending on the nature of the signal, an appropriate length of the subsequent MDCT-based filter bank is selected. The format supports selected bit rates ranging between 32 and 640 kbit/s.
Opus is an open lossy audio compression standard developed by the Xiph.Org Foundation. It is the successor of the older Vorbis and Speex methods. The codec is composed of a layer based on the linear prediction and a layer based on the MDCT, but both layers can be used at the same time (hybrid mode). Opus supports all bit rates from 6 to 510 kbit/s.
ADPCM is a lossy compression format with a single fixed compression ratio of about 4:1. ADPCM compression works by separating the input signal into blocks and predicting its samples on the basis of the previous sample. The predicted value is then adaptively quantised and encoded to nibbles, giving rise to the 4:1 compression ratio (192 kbit/s for 48 kHz sampling rate). A psychoacoustic model is not used at all.
FLAC is an open lossless audio format now covered by the Xiph.org Foundation. FLAC uses linear prediction followed by coding of the residual (Golomb-Rice coding). For music, it was reported from various benchmarks that FLAC typically reduces the input signal size to 50–75% of the original size.
ALAC is the open lossless audio format by Apple. Similarly to FLAC, ALAC uses linear prediction with Golomb-Rice coding of the residual. Additionally, the achievable compression performance is similar to that of FLAC.
As a reference format, an uncompressed signal was used. Technically, this format is referred to as linear PCM. Because we used 16 bps and a 48 kHz sampling rate, the uncompressed signal resulted in a bit rate of 768 kbit/s.
3. Proposed Method
A typical output of the HIFU simulation contains two basic types of data—3D spatial data, for example, maximum pressure at defined grid points, and 4D spatial–temporal data with time-varying pressure series at defined grid points. Considering the 3D datasets, final simulation values across the whole simulation domain, or at least aggregated values (such as the minimum, maximum, or root mean square), have to be stored in permanent storage. In the case of time-varying 4D datasets, an acoustic pressure, acoustic velocity, and intensity have to be stored across the defined set of locations (sensor mask) [
11,
12].
Our compression method is focused on time-varying signals and is designed for 1D data. Because the shape of the sensor mask can be an arbitrary and sparse set of locations [
12], we decided not to deal with spatial coherence. Moreover, by treating every spatial grid point independently, there was no need for additional communication on the distributed clusters. The goals of the compression method are low memory complexity and high processing speed; negligible data distortion is acceptable. These intentions differentiate our method from other state-of-the-art compression techniques.
During HIFU simulation, the source ultrasound signal is emitted from a transducer into the tissue with which it interacts. Multiple intersecting beams of ultrasound are concentrated on the target (focus point). Some phenomena, such as attenuation, time delay, scattering, or non-linear distortion, may occur during the ultrasound propagation [
13,
14,
15]. The source ultrasound signals are always defined by a known harmonic function of a given frequency, usually a pressure sinusoid of frequency ranging from 0.5 to 1.5 MHz [
15].
We can assume that the time-varying quantities, such as pressure and velocity at every grid point, also have a harmonic character, with only a small amplitude and phase deviations. These quantities are usually amplitude-modulated and can be composed of the fundamental and several harmonic frequencies. The number of harmonics depends on the size of the simulation grid and a factor of non-linearity. Currently, we use up to five or six harmonics for real simulations, which corresponds to the HIFU in thermal mode. However, for histotripsy, as many as 50 harmonics may be needed.
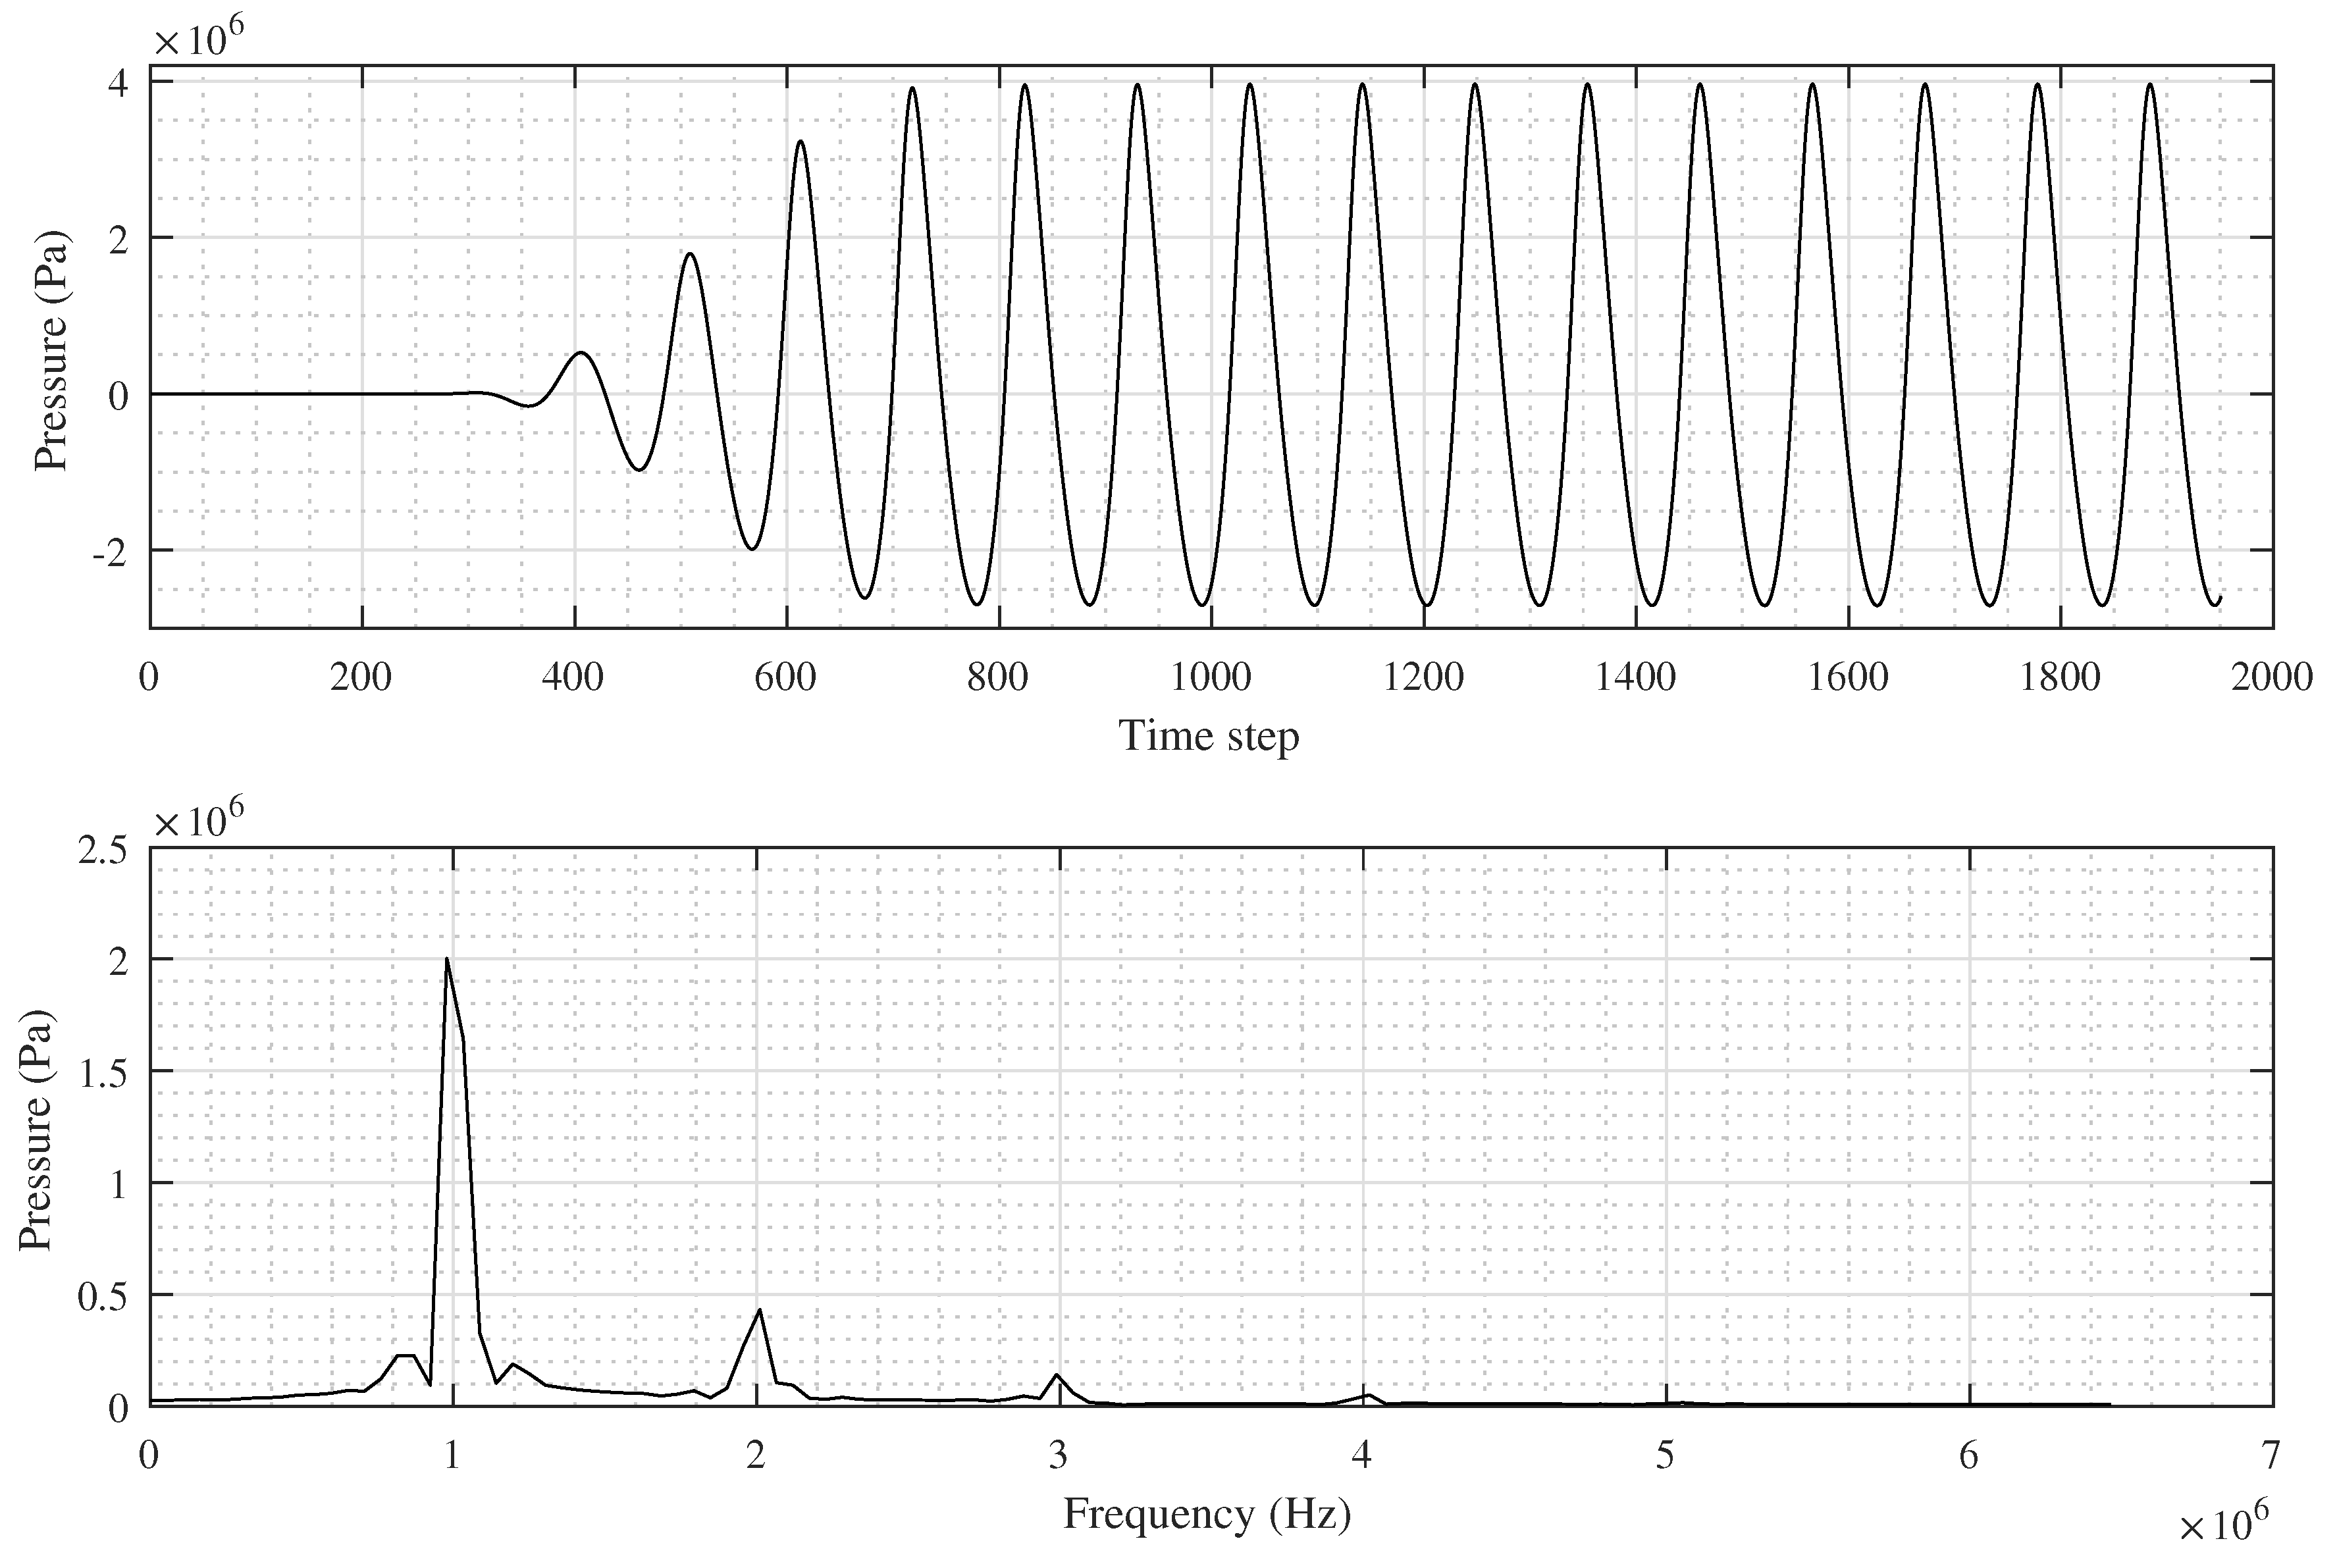
A typical pressure signal recorded at a single grid point is shown in
Figure 1. An output signal (containing, e.g., time-variable acoustic pressure) can be subdivided into three stages according to the amplitude magnitude and its changes. During the first stage, the signal resembles noise with an amplitude close to zero. The length (in samples) of this stage depends on the distance of the grid point from the transducer. The second stage can be characterised by a large increase in amplitude (a leading edge). This transient stage is usually very short, for example, around 5% of the total simulation length. The third stage carries a relatively stable amplitude. This part of the signal is the most important part for the calculating of a heat deposition [
15]. The stable stage usually starts at the moment when all waves emitted from the transducer arrive at the focus point.
The proposed approach is for modelling an output signal, such as the decomposition of a 1D signal (one point in 3D space), as a sum of overlapped exponential bases multiplied by a window function. Each base is defined by its complex coefficients (amplitude and phase). We decided to use complex exponential bases, because such bases can represent fundamental harmonic functions well, including phase changes and higher harmonics, as well as window functions whose sum is constant if they are half-overlapped, because of on-the-fly processing by parts of the signal.
It is important that the input frequency emitted by the transducer is known and that it can be used by the compression algorithm. A complex exponential function with the angular frequency
can be defined for one time step
n as
where
h is the number of the harmonic frequency (wave number), which can be generated by non-linear wave propagation. By multiplying by a shifted window function
w defined as
where
is a window function (e.g., triangular or Hann window) and
d is the half-width of the window, we obtain linearly independent sliding-window basis vectors
with
width, where
a is the basis (frame) index. The half-width
d should be an integer multiple of the input period
, as such a width typically leads to more precise results. The whole reconstructed signal can then be expressed as
where
N is the length of the signal,
I is the number of complex frames
, and
are resulting complex coefficients.
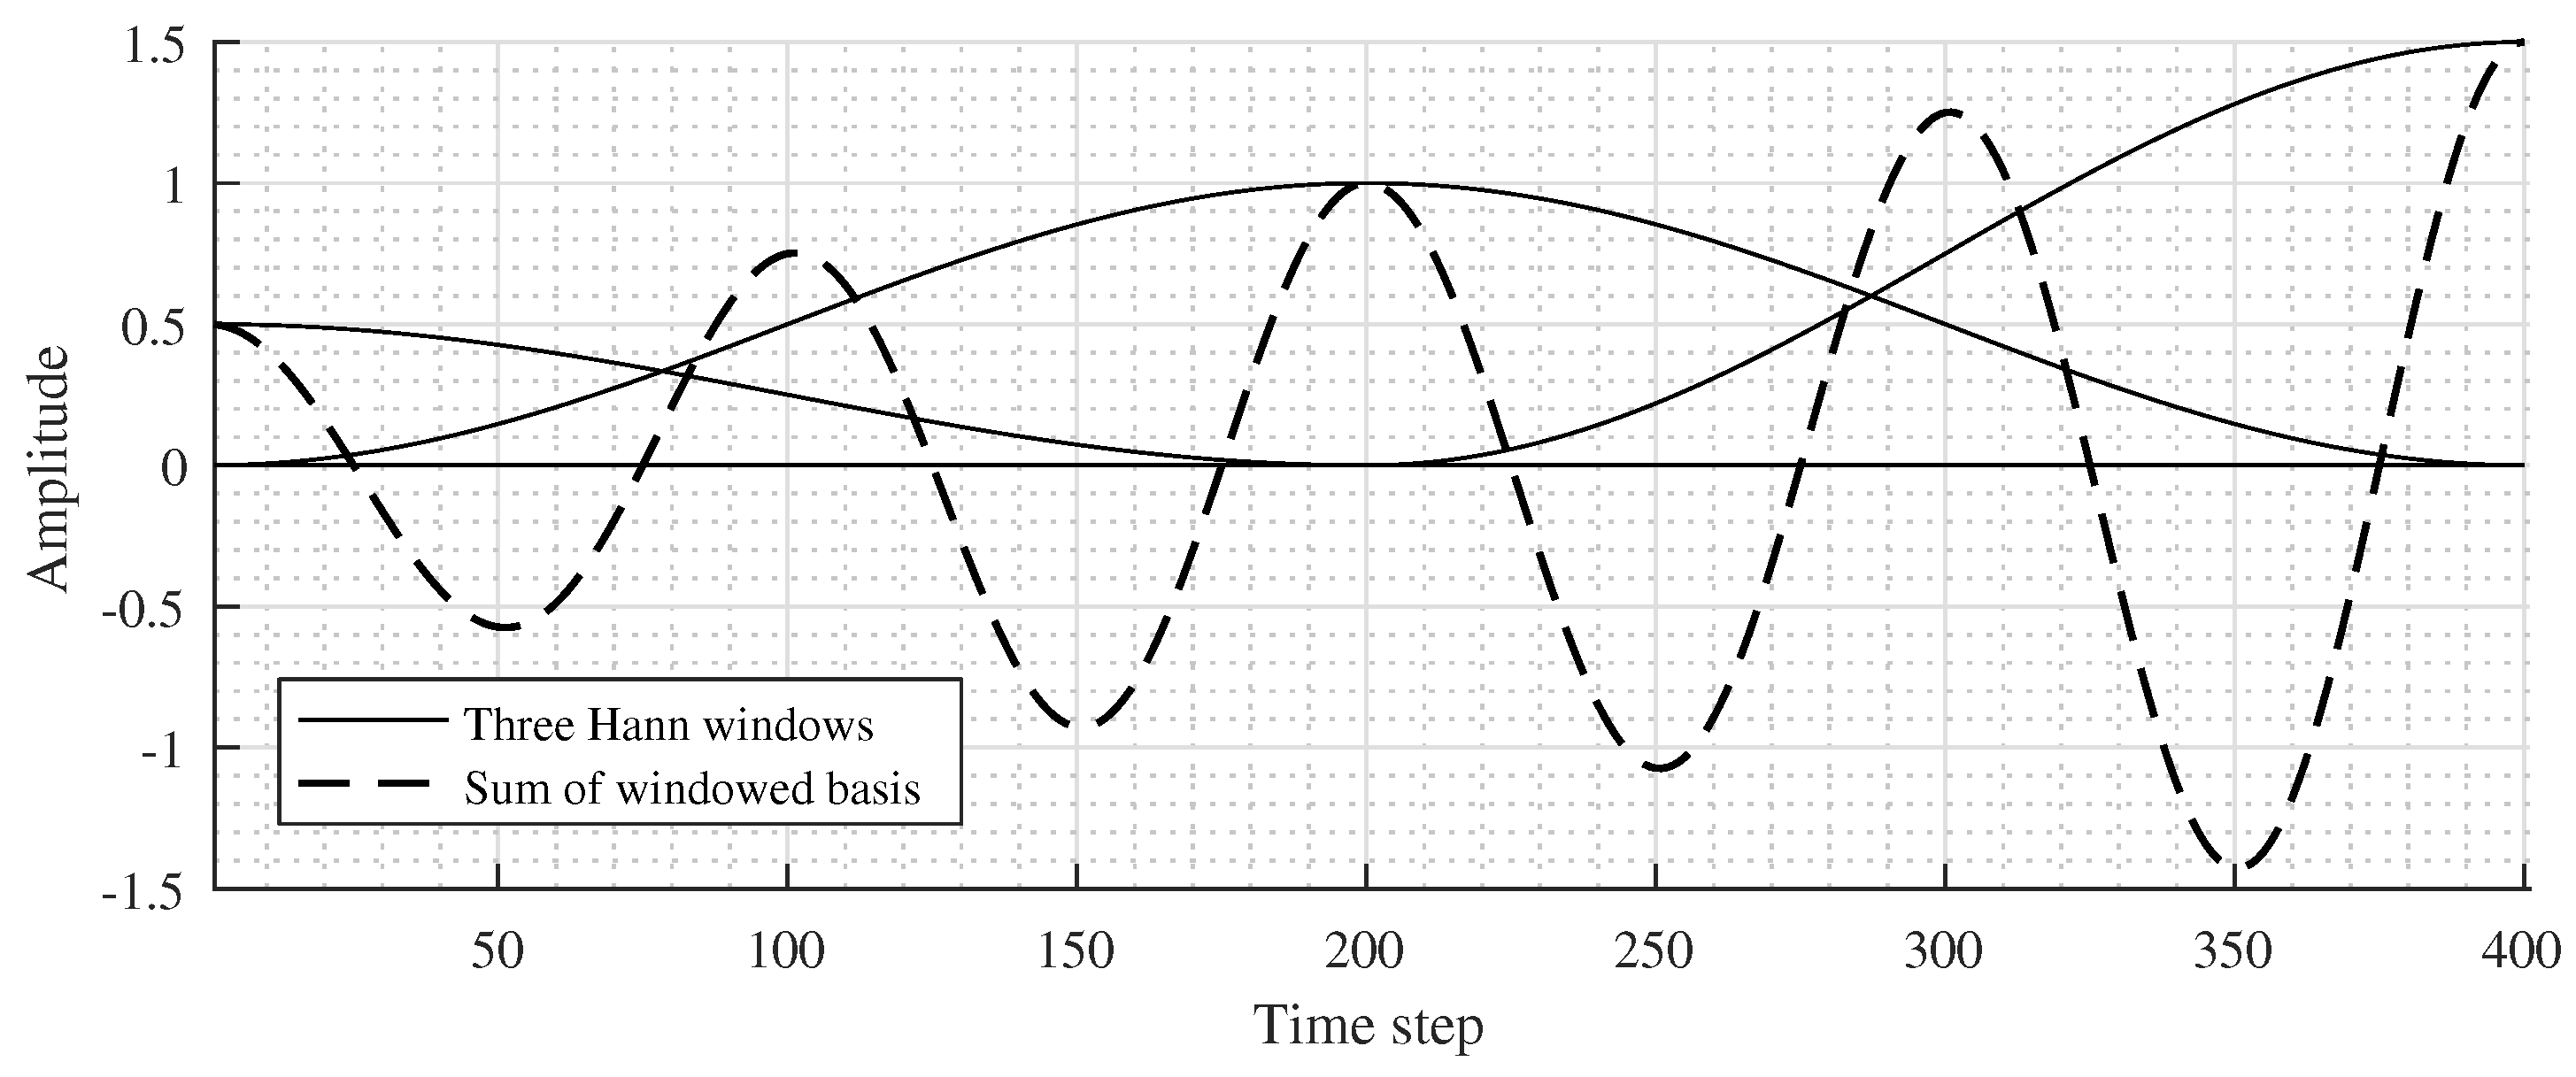
An illustration of three half-overlapped windows and the real-part sum of window functions with
is shown in
Figure 2.
The complex coefficients are computed approximately by correlation (dot product) of the original signal
x and the windowed exponential basis vector for a selected frame
i as
The coefficients for other harmonic frequencies can be computed independently (as they are linearly independent) and are summed in the reconstruction phase. Every point in 3D space can be processed separately and in parallel within both the encoding and decoding phases.
Within the coding phase, two dot products are gradually computed for a single time step (one signal sample) as a result of two overlapped window basis vectors. The number of memory cells
c (single-precision floating-point numbers) required for computing intermediate results in one time step depends on the number of harmonics
H, and it can be evaluated as
as two complex numbers are needed per every harmonic frequency.
Within the decoding phase, the memory requirements remain the same as in the encoding phase. Two complex coefficients are needed for every harmonic frequency; however, the decoded samples are computed independently, which can be useful, for example, for fast data visualisation.
The compression ratio of the method can be expressed as
The ratio is proportional to the width of the overlapping window bases. This signal approximation method yields a very small distortion for the stable parts of the signal where the distortion depends only on the number of considered harmonic frequencies. The distortion is higher in the transient parts of the signal.
5. Experiments and Results
Two sets of experiments were performed. The first set was focused on testing the compression method on 1D signals, and the second set was conducted for large 4D datasets. A triangular window was used as a window function for the proposed compression method for all experiments. The main purposes of the experiments were to determine the peak signal-to-noise ratio (PSNR) with respect to the bit rate and to compare the proposed method with other compression methods, particularly with audio codecs.
For 1D signal compression tests, three different types of signals were selected. We always chose 50 random 1D signals (points within the sensor mask) from the given datasets. The schematic overview of the test signals is shown in
Table 1.
The signals differ mainly in the simulation size, sensor mask size, number of sampled simulation steps, input period, and type of the simulation. The dense sensor mask was always defined within the highly focused HIFU area in which the highest amplitude and most of the harmonics are observed. All signals contain acoustic pressure stored in 32-bit floating-point format. The dataset referred to as Linear is the output of a linear simulation; thus, there are no harmonics. The other datasets comprise the outputs from non-linear simulations, and the number of harmonics depended, among other factors, on the simulation resolution. For a better connection with reality, a realistic simulation that was representative of the clinical situation with heterogeneous tissue used a simulation grid size of 1536 × 1152 × 1152 and contained about six significantly strong harmonics (referred to as Non-linear 6). The same simulation (Non-linear 2) but with a smaller simulation grid size (512 × 384 × 384) contained only two harmonics.
The compression experiments compared the results of the proposed HIFU compression method (HCM) with several audio codecs implemented in the FFmpeg framework (either natively or through an external library), specifically with ADPCM, FLAC, ALAC, AAC, AC-3, Opus, and PCM. The main properties and settings of these codecs, including the proposed method, are shown in
Table 2. The above-listed methods were selected for comparison purposes only. Except for PCM, none of them meet the memory requirements needed for implementation in a parallel distributed environment. Because we target a memory-limited environment, we set the frame size to the minimum size supported by the specific sampling rate, sample format, and codec. We note that as a result of the frame-based system, a delay is introduced after the encoding and decoding processes. This delay is shown in the last column of the referenced table.
Because several audio codecs require the signal to be normalised on the interval, we used the maximal absolute signal value for the normalisation. In some cases, the input signal had to be stored in 16-bit PCM format before the codec could be applied (ADPCM and Opus). This conversion was performed with the use of the maximum 16-bit integer value.
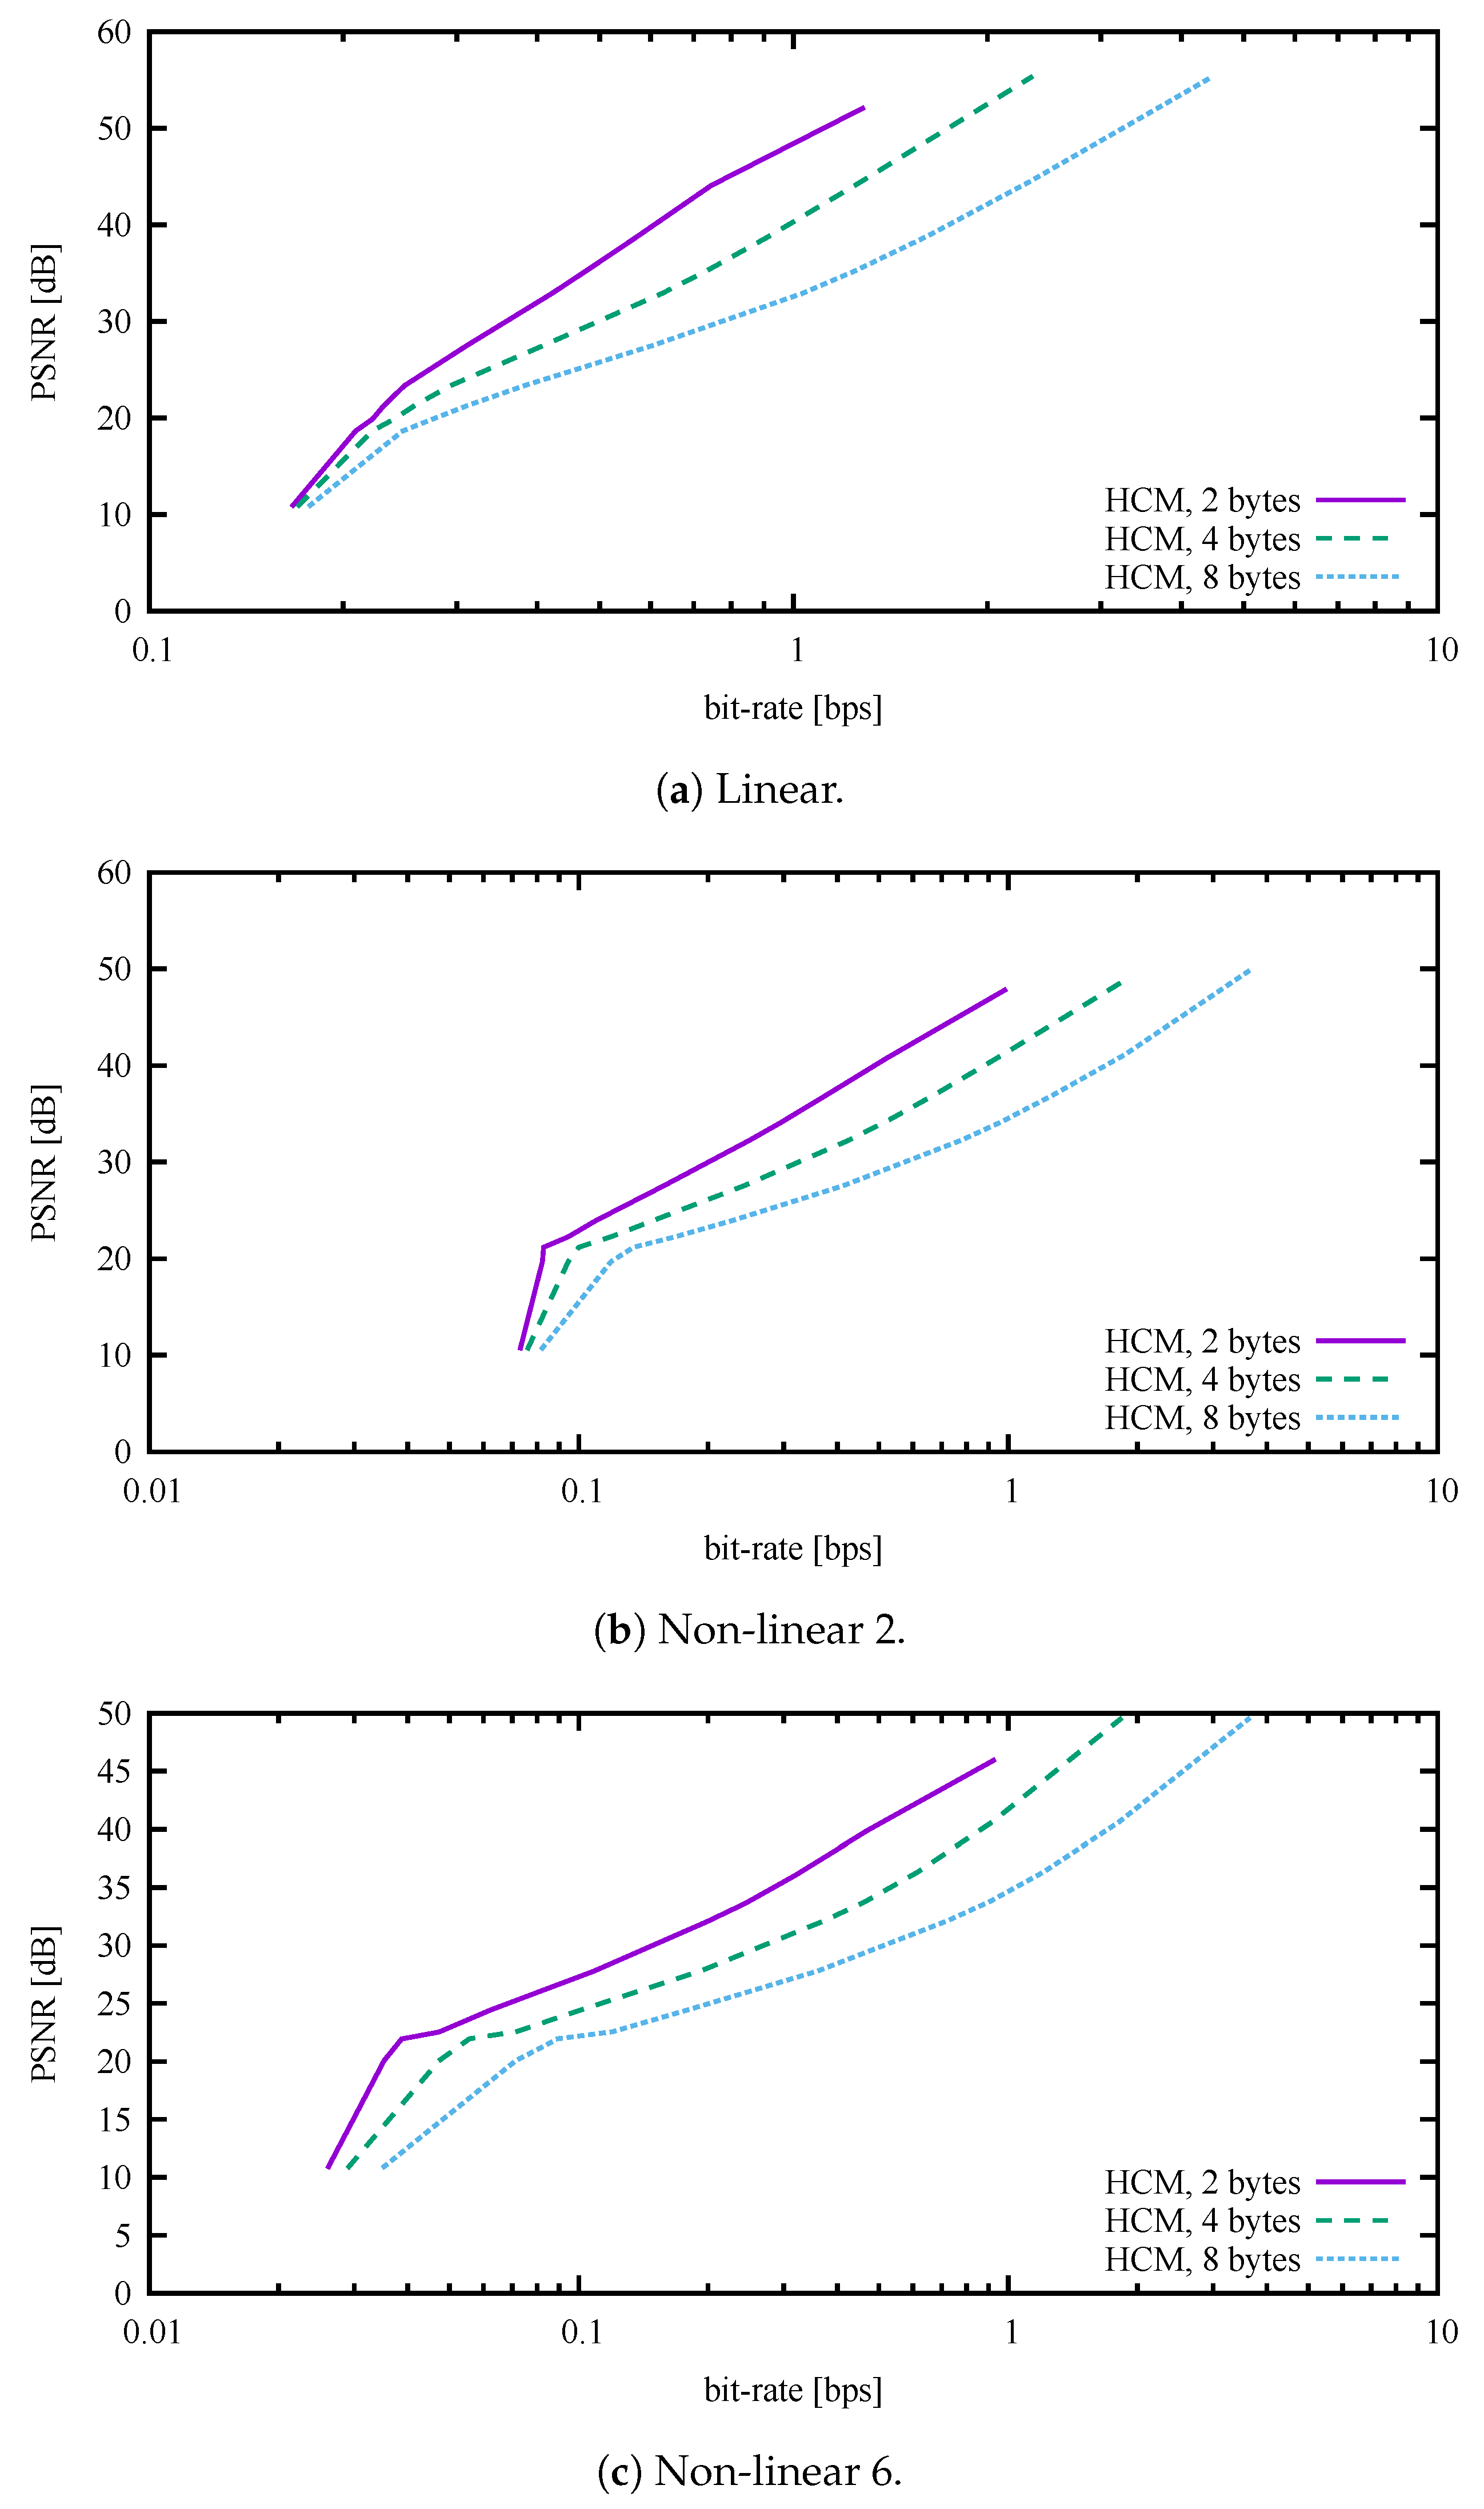
By default, the HCM expects an unknown maximum absolute signal value and therefore uses 32-bit floating-point numbers to store compression coefficients. If the dynamic range of values is known in advance, the method can convert 32-bit floating-point numbers into 16-bit or even 8-bit integers with negligible loss of information (4 or 2 bytes for one complex number). Thus, for normalised signals, another two modifications of the HCM were implemented. As shown in all figures and tables except
Figure 3, Figure 7 and Figure 8, the HCM used 8-bit integers for coefficients and thus 2 bytes for one complex number. For a better understanding, a comparison of three types of HCM coding is shown in
Figure 3.
A dependency of the distortion on the bit rate is shown in
Figure 4 for the datasets Linear, Non-linear 2, and Non-linear 6. The lossless methods are represented by a single point, as they do not have, by their nature, the ability to choose any custom bit rate. Except for the ADPCM, the lossy methods are represented as a curve for which the independent variable is the custom bit rate. Although the ADPCM is a lossy method, it has no ability to choose a bit rate. Thus, in this case, the method is also represented by a single point. Looking more closely at the referenced figure, we can see that the HCM exhibited at least comparable compression performance. More precisely, the PSNR for the Linear case, as shown in
Figure 4a, reached comparable values for all lossy methods except the ADPCM and Opus, which had significantly worse results. The proposed HCM reached the lowest bit rate. At its highest bit rate, the HCM also exhibited the best PSNR, which was about 52 dB. It is possible to obtain better bit rates with the proposed method by setting the multiple of overlap size (MOS) to higher values.
The results for the non-linear simulation signals were slightly different from those for the Linear dataset. In
Figure 4b, the PSNR and bit rate for the Non-linear 2 dataset are shown. We obtained a slightly worse PSNR, approximately 48 dB, for the proposed HCM, and better values for the other methods. We believe this was due to the presence of more harmonics.
In the case of the Non-linear 6 dataset (larger simulation grid size and about six harmonics), the proposed method gave similar results as for the previous cases. ADPCM exhibited comparable PSNR, and it was only slightly worse in terms of bit rate than the proposed HCM. Moreover, the AAC codec achieved a slightly better bit rate, followed by the competitive AC-3. Further details can be seen in
Figure 4c.
Different variations of the HCMs used for the Linear, Non-linear 2, and Non-linear 6 compression datasets can be observed in
Figure 3. Importantly, the PSNR reached comparable-quality values for all cases. It can be noticed that the bit rates converged to a single point in the plot—this was caused by the use of a WAVE file header for storing the compressed data. The WAVE format was used only for testing purposes with the FFmpeg tool.
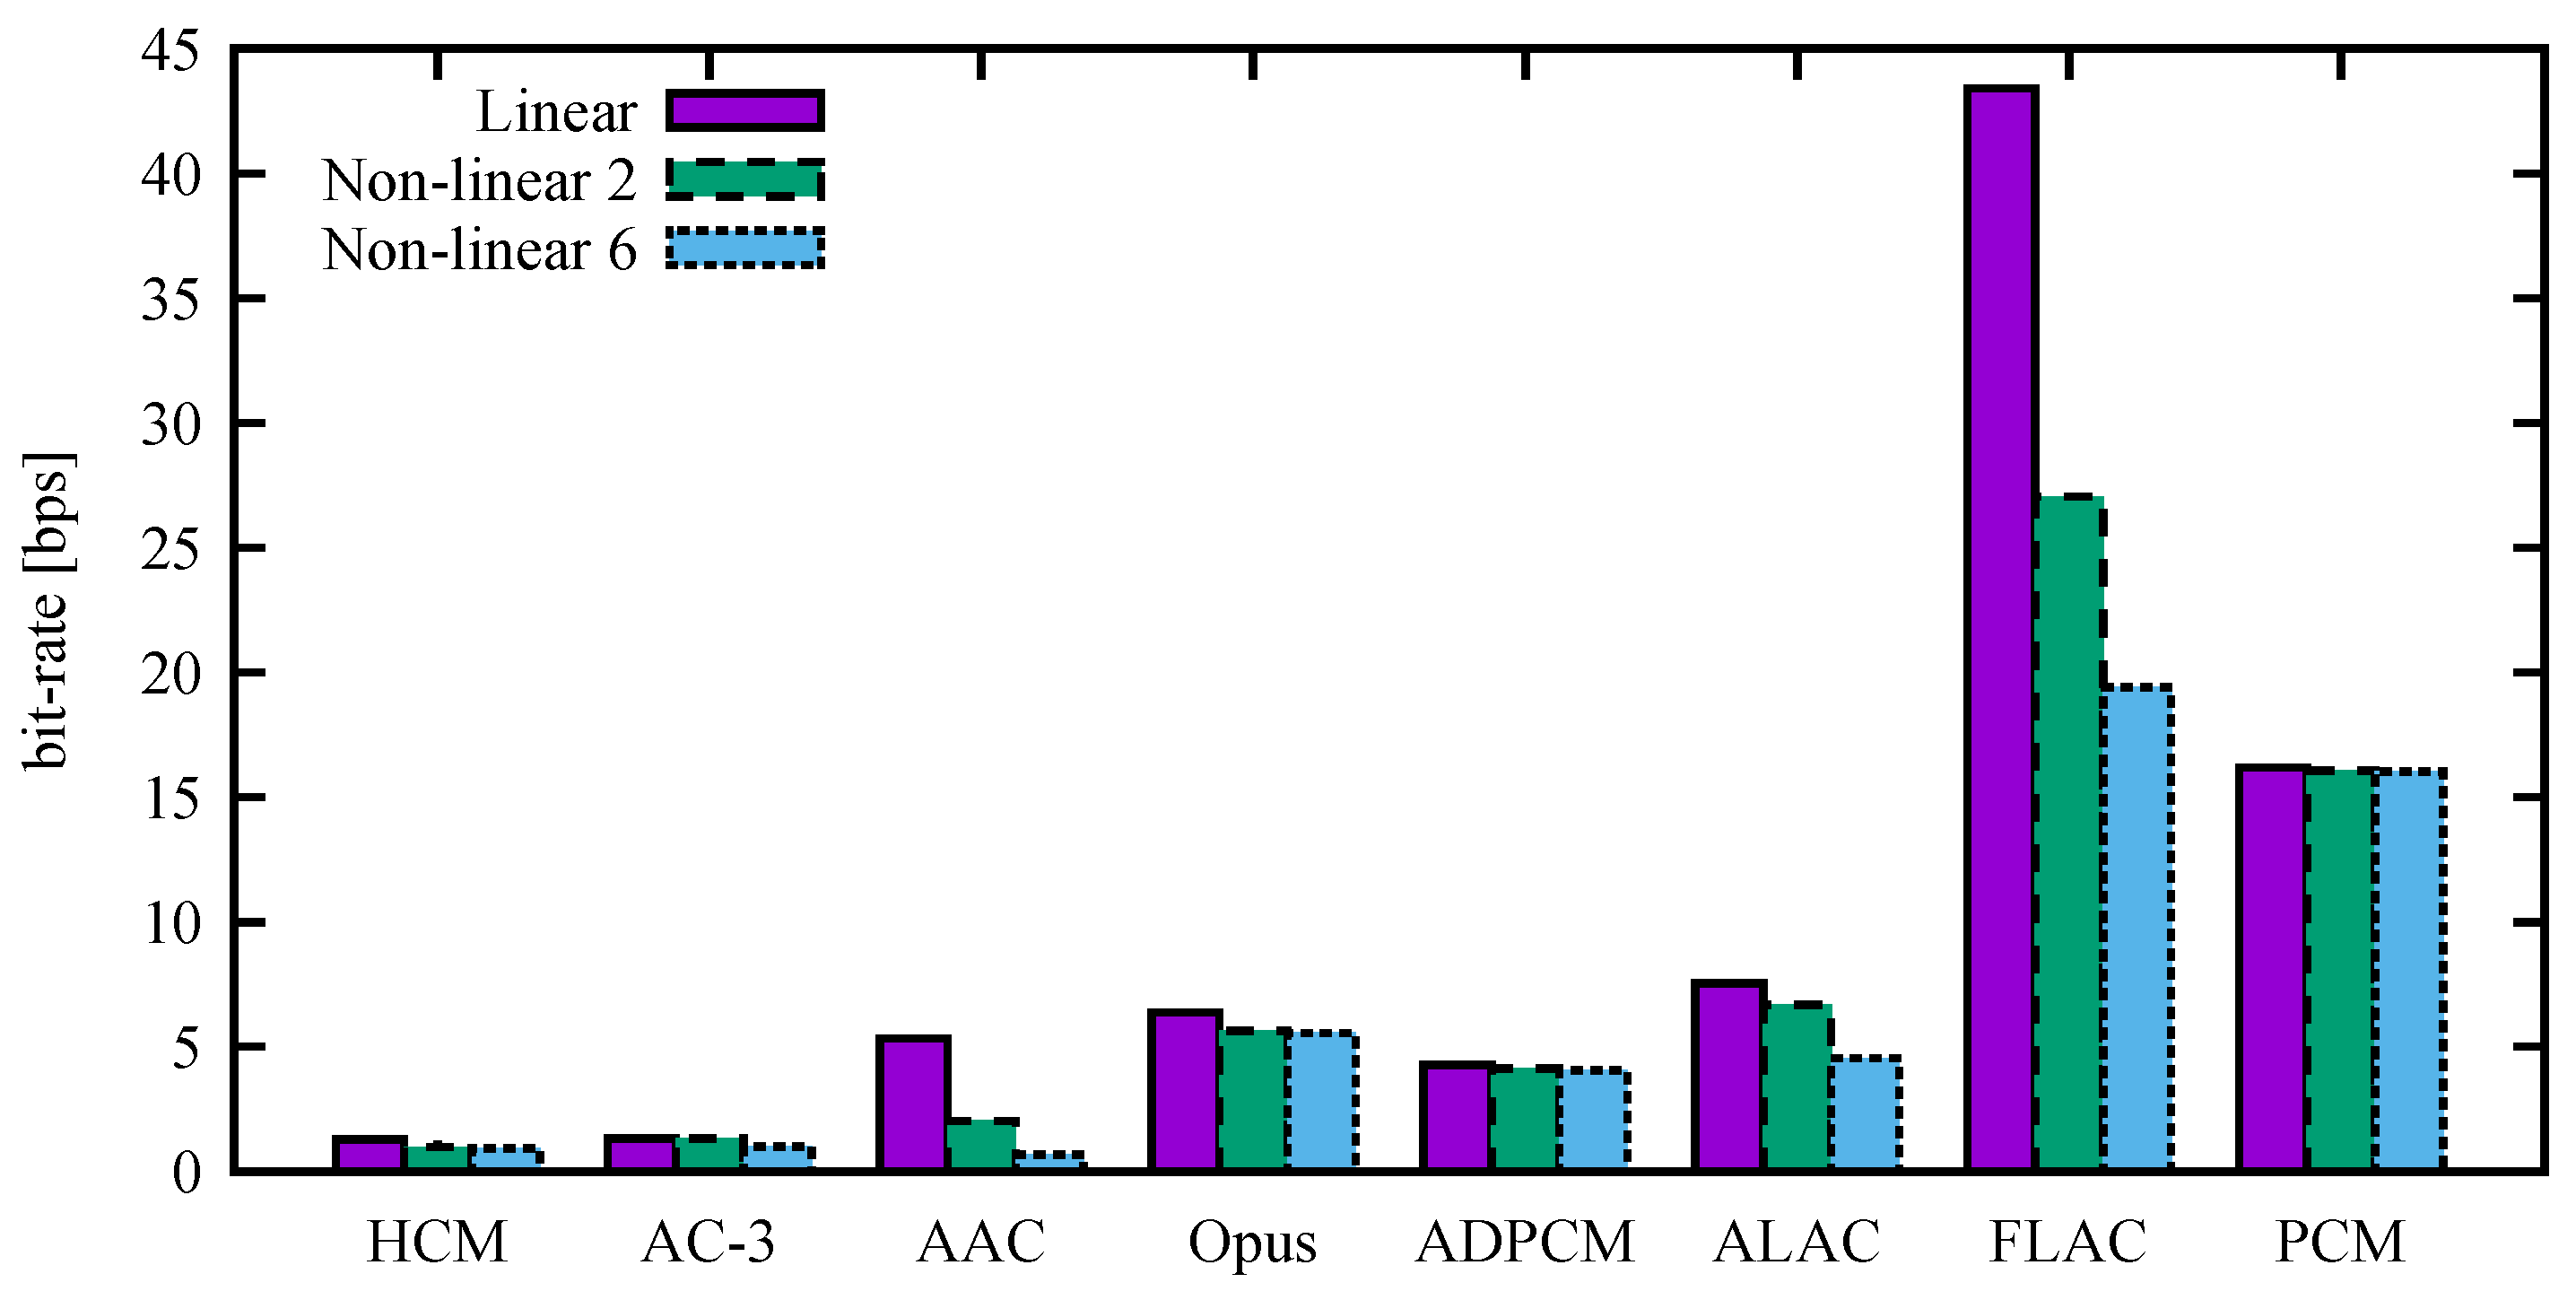
The particular results, including compression ratios, with the PSNRs set as close as possible to 50 dB are listed in
Table 3,
Table 4 and
Table 5. The values correspond to
Figure 5. We note the comparable bit rates of the HCM, AC-3, and AAC.
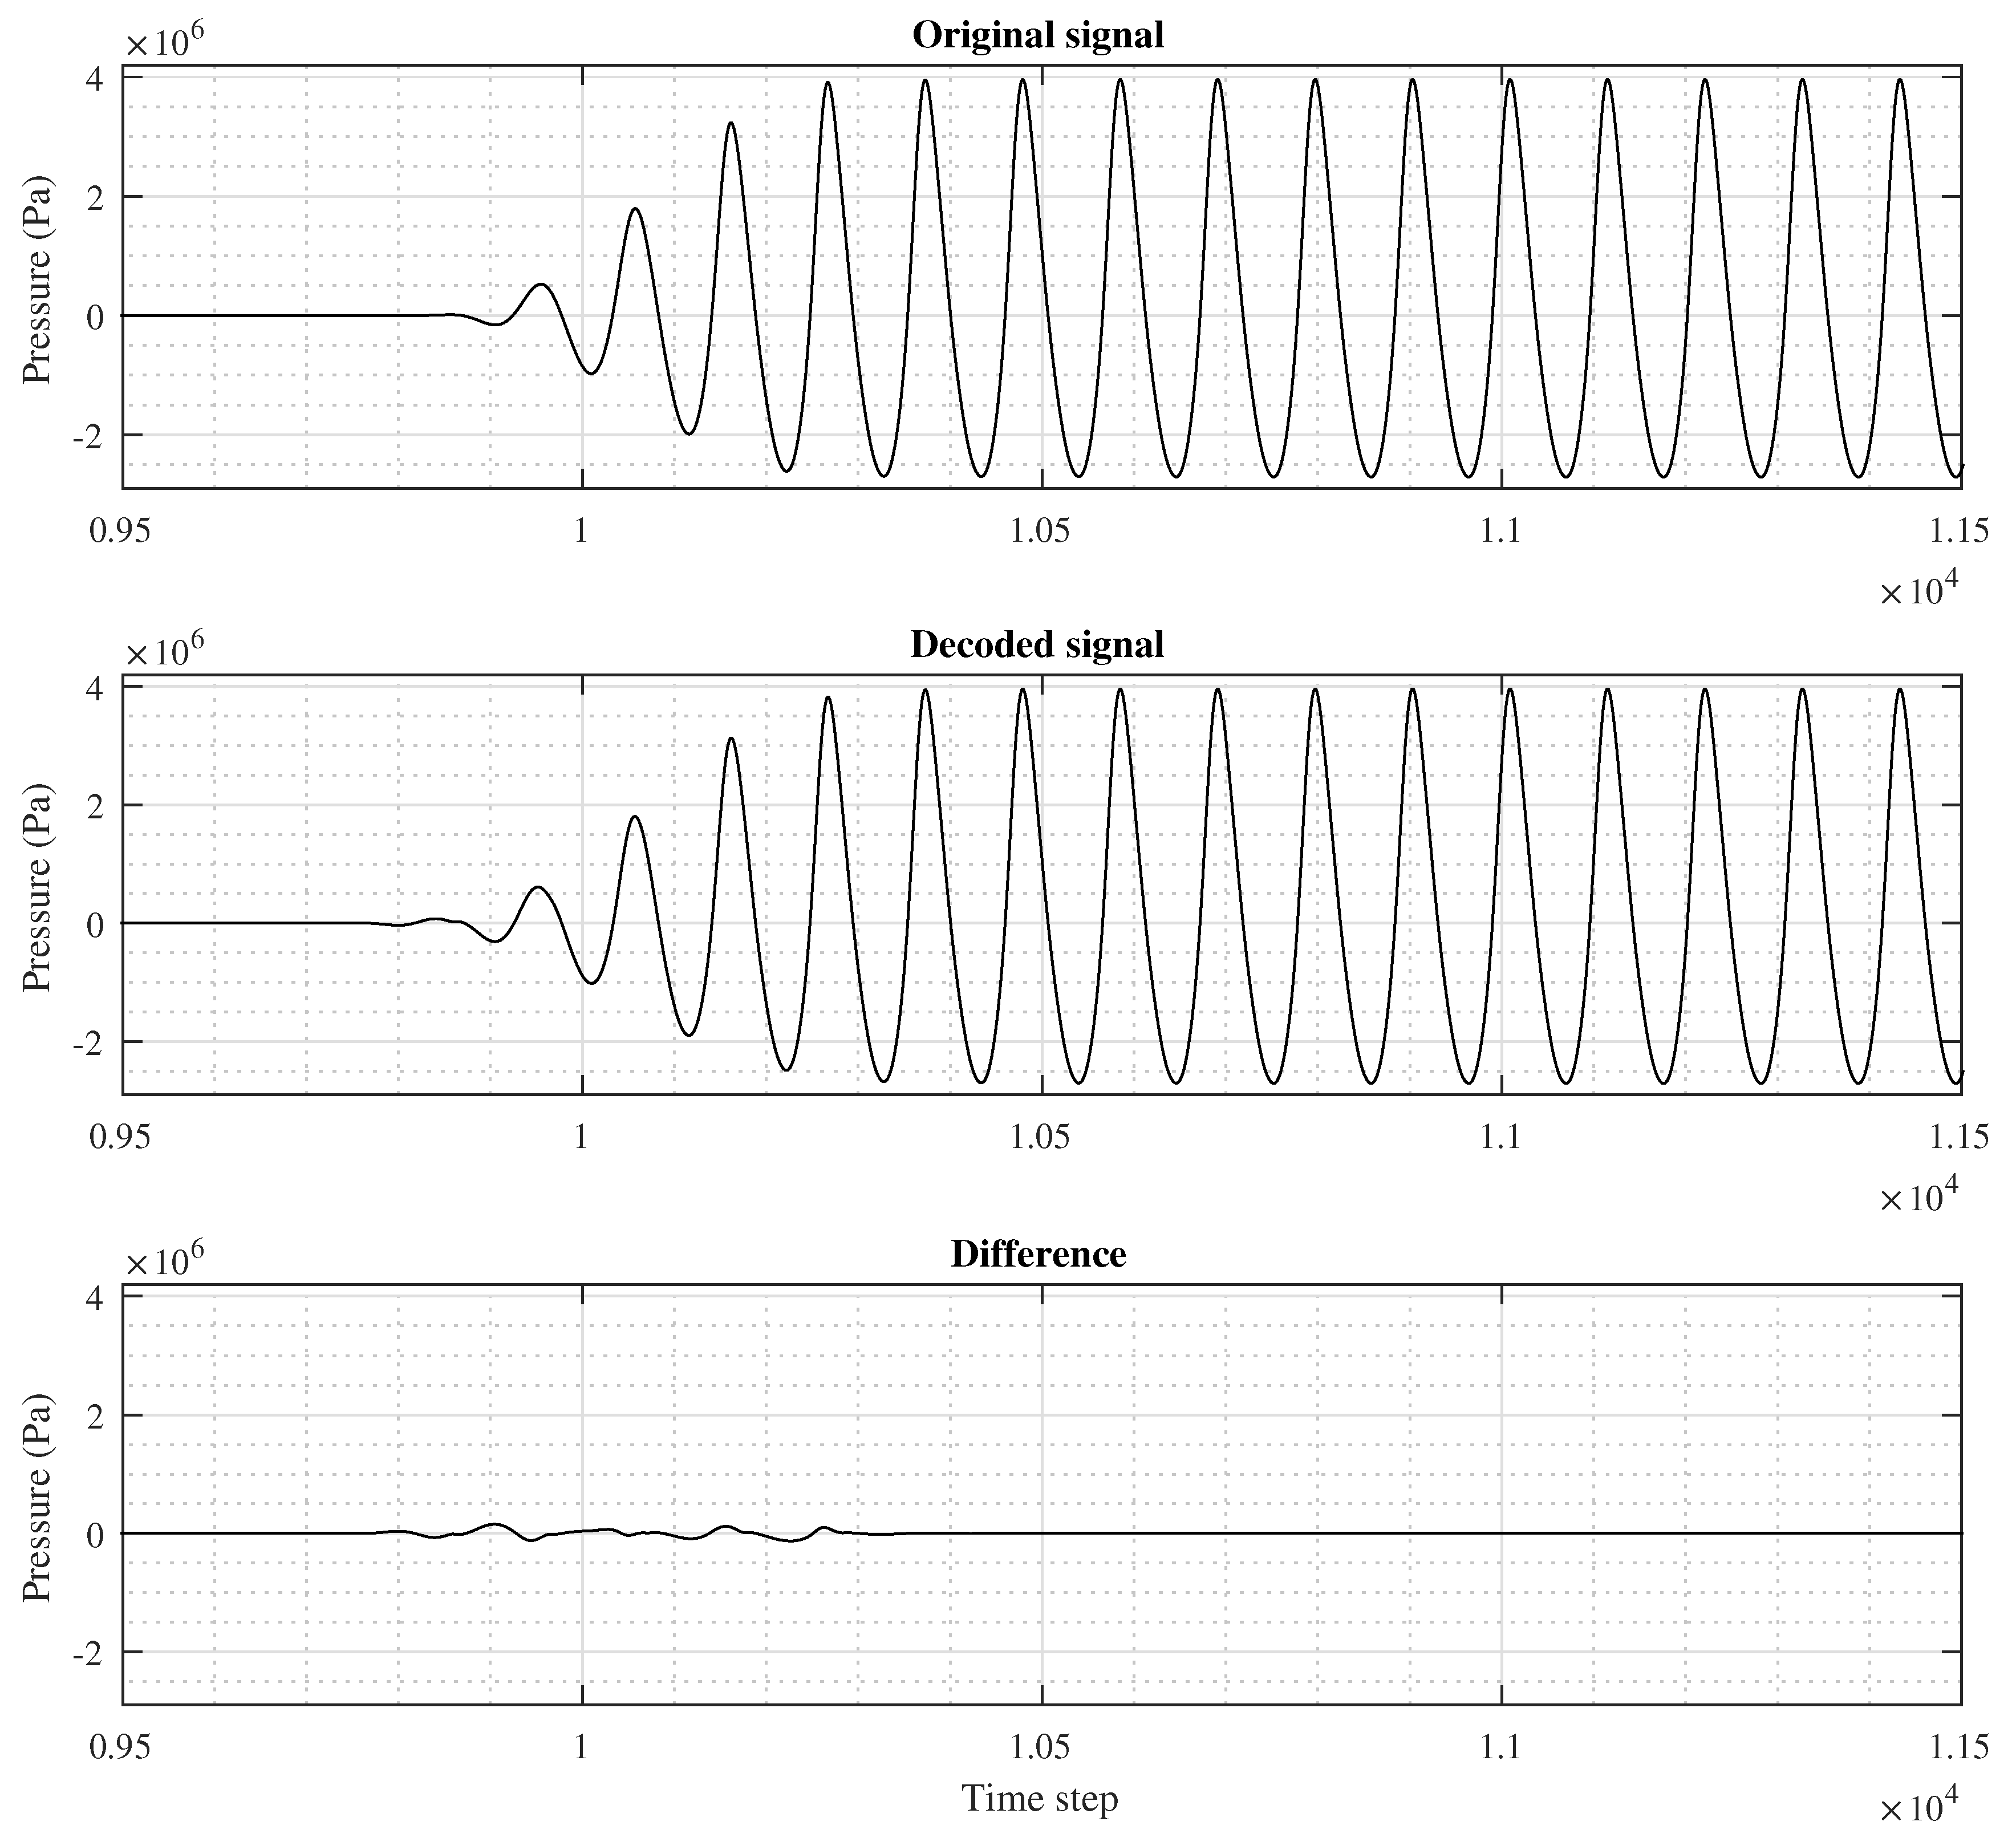
A short segment of a signal in the 1D Non-linear 6 dataset is shown in
Figure 6. The individual sub-figures illustrate the original, HCM-reconstructed, and corresponding difference signals, respectively. All of these correspond to a MOS value set to 1. We note the maximal error in a part with very transient signal values.
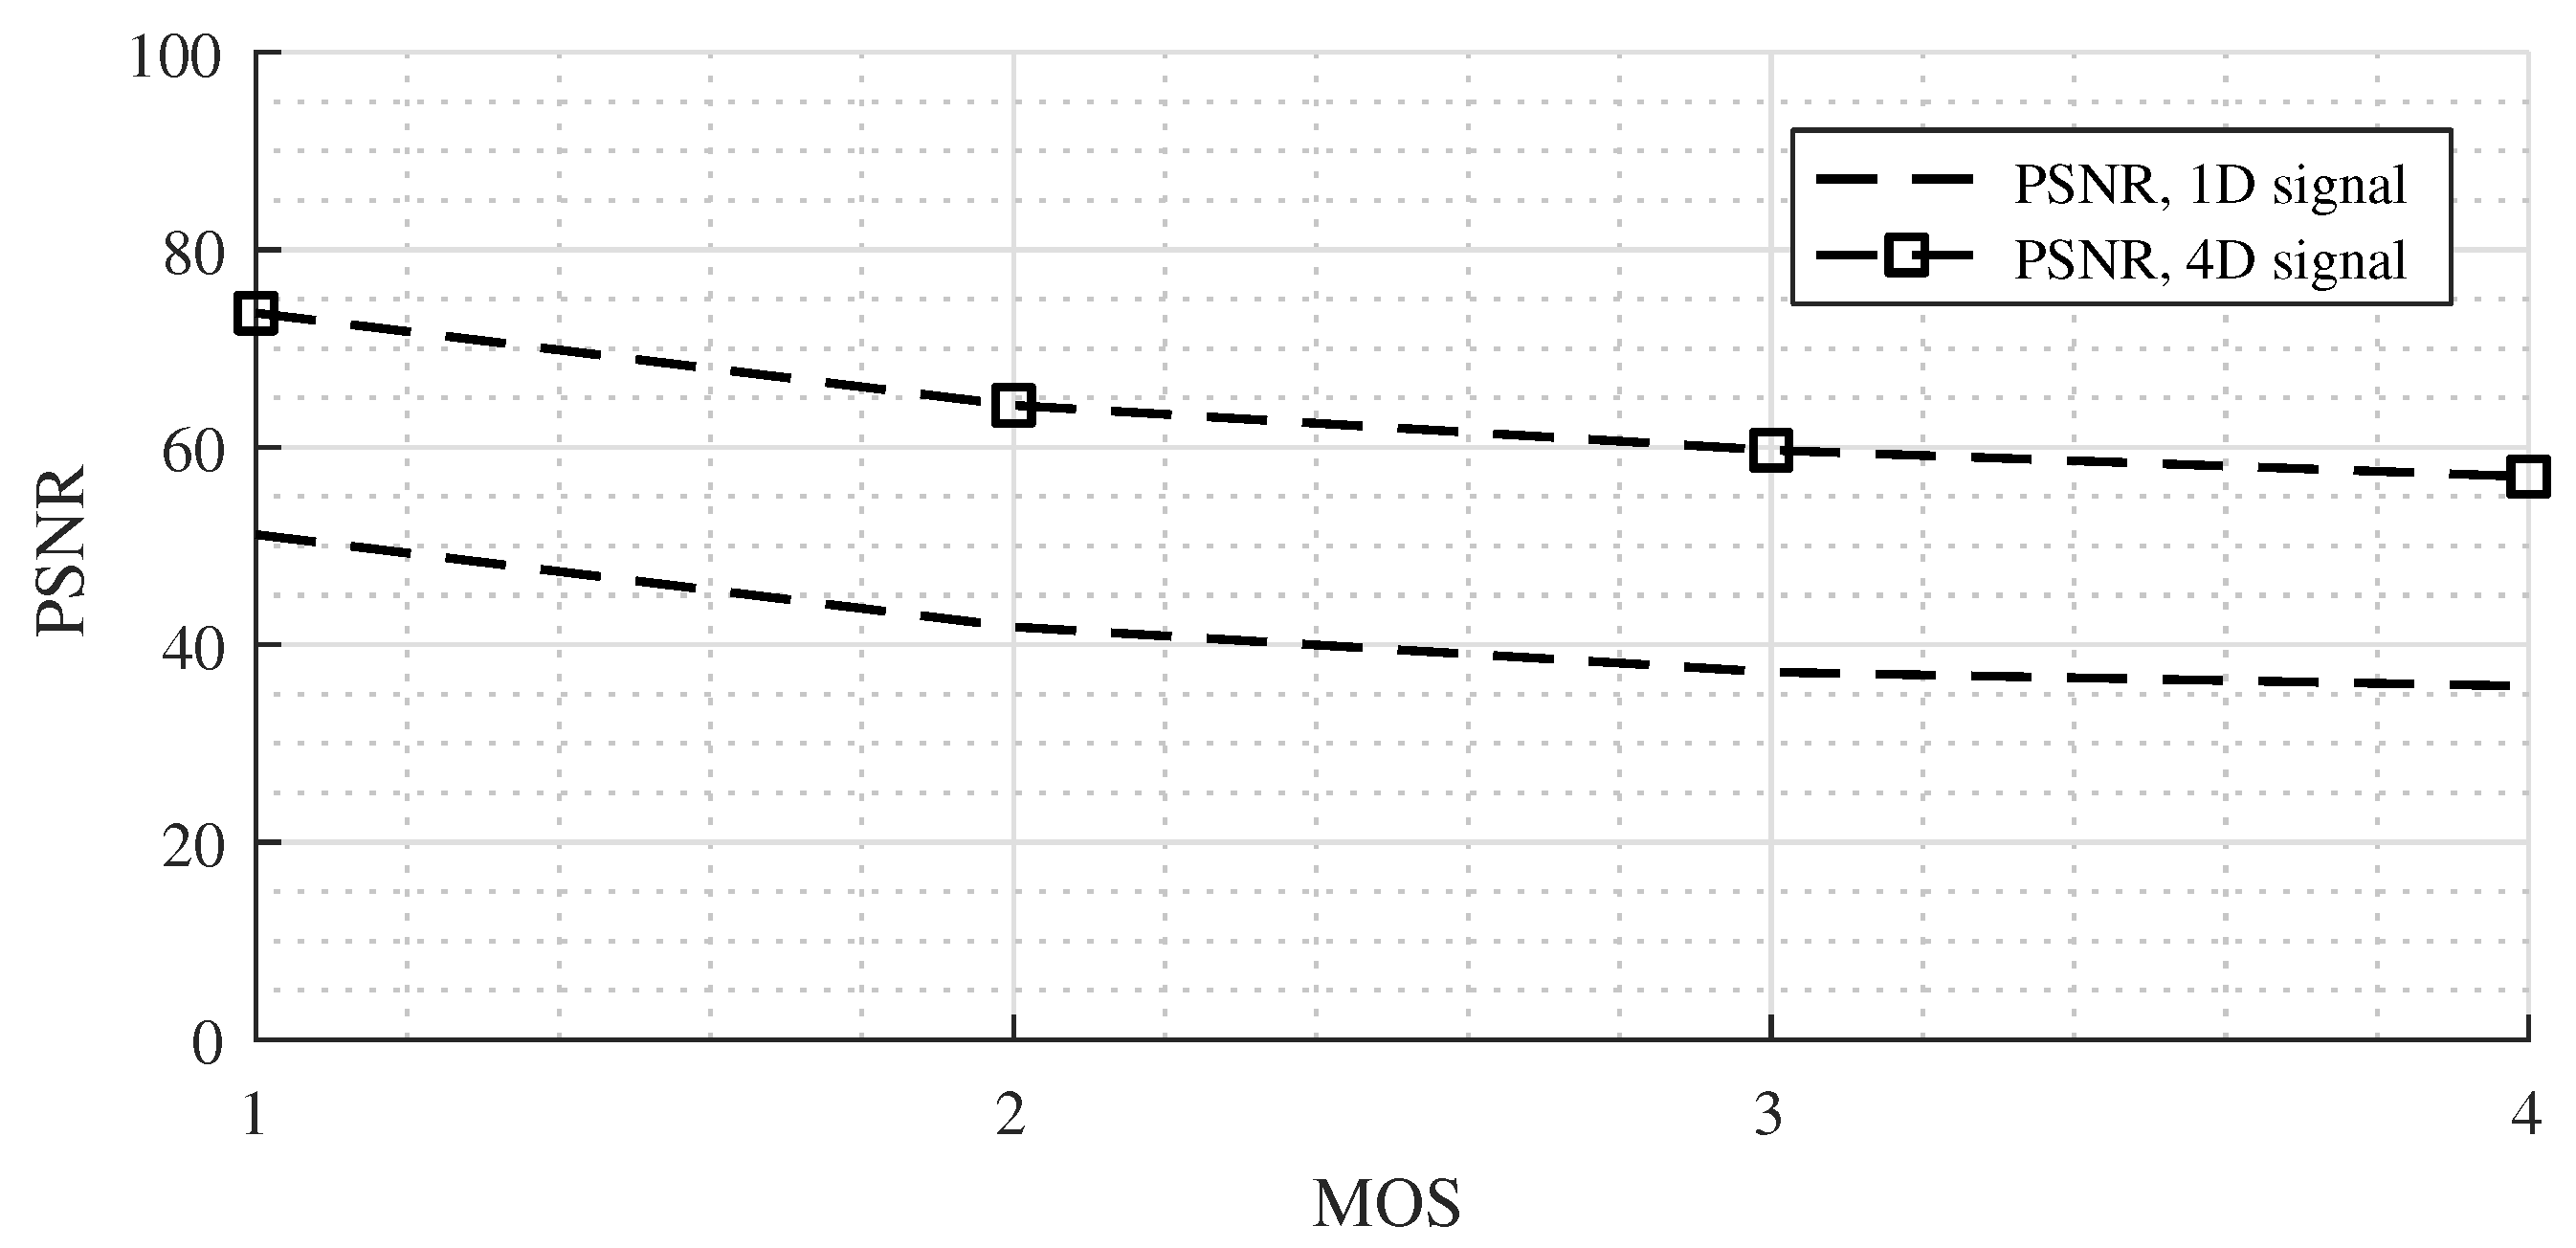
We also conducted compression experiments with two 4D datasets. The tested signals were chosen from Non-linear 2 and Non-linear 6, and all the points stored in the sensor mask were compressed (101 × 101 × 101 × 10,105 points for Non-linear 2 4D signal and 101 × 101 × 101 × 30,604 points for Non-linear 6 4D signal). The proposed compression method was tested with the setting of the MOS to values of 1, 2, 3, and 4.
We obtained interesting results for the Non-linear 2 case (
Figure 7). The PSNR values for the 4D dataset were approximately 20 dB better than for the 1D signals.
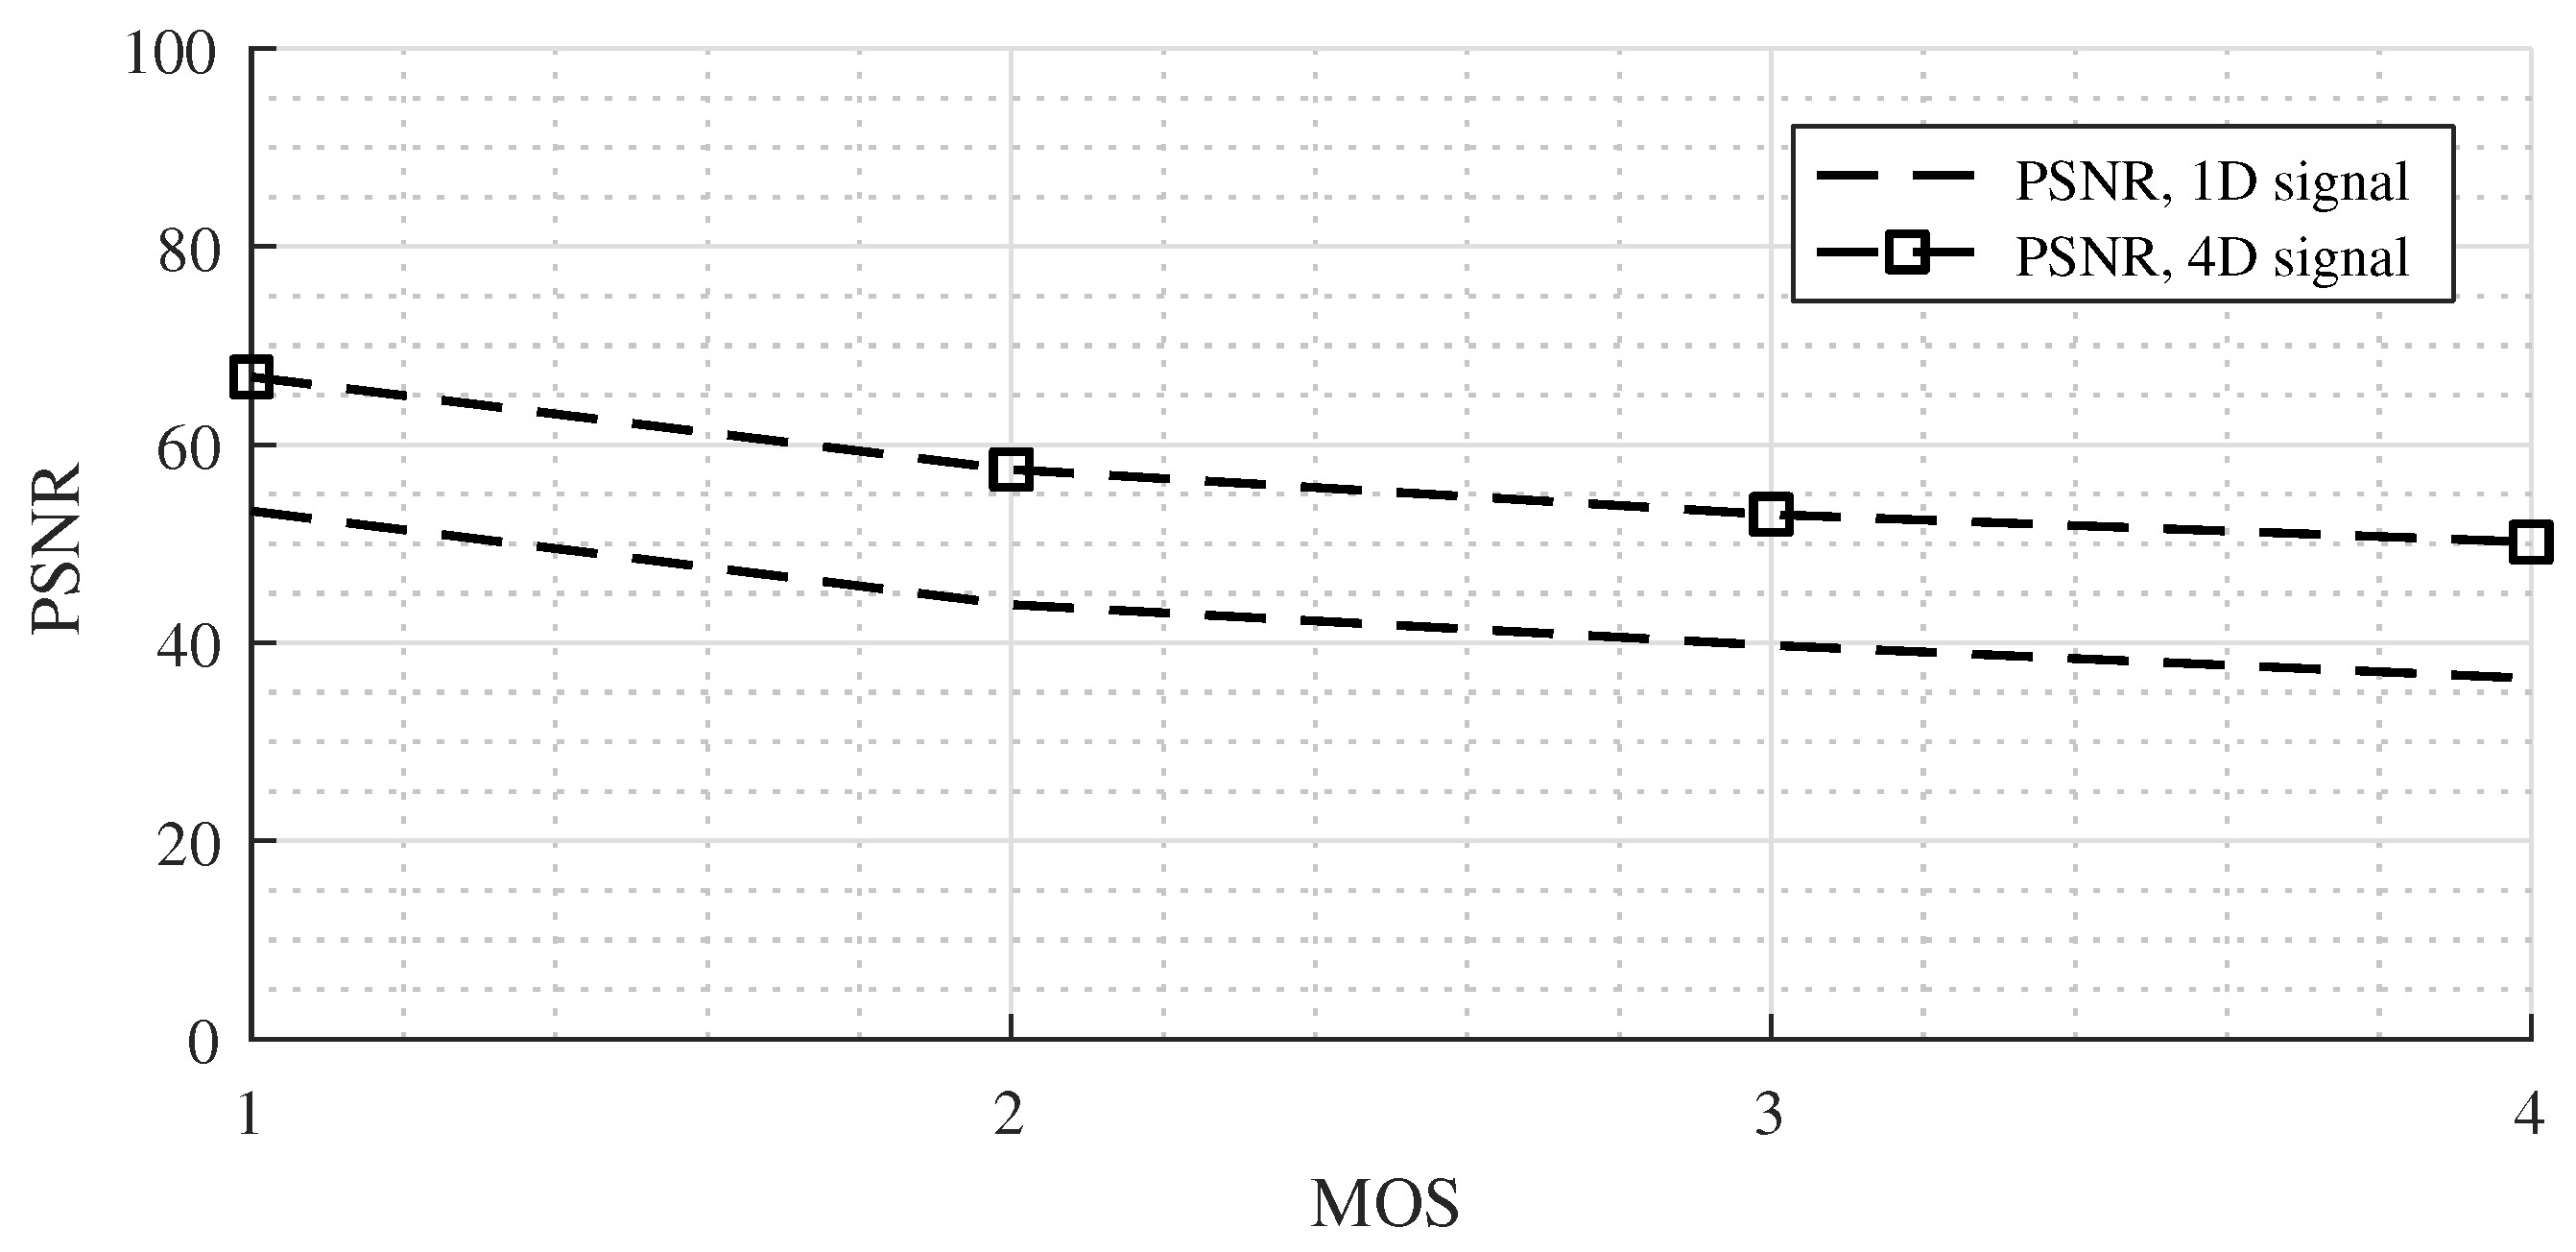
In the case of the Non-linear 6 signal, the results were slightly different (
Figure 8). The PSNR values for the 4D signal were about 13 dB better than for the 1D signal. This phenomenon was likely caused by a 3-fold larger simulation grid size in the Non-linear 6 case but the same size of the sensor mask. We could conduct experiments with a corresponding higher sensor mask size (e.g., 301 × 301 × 301) and expect results similar to those of the Non-linear 2 case, but more than 3 TB of data would be need for the testing dataset, and the time for offline compression would be enormous.
The overall results indicate useful properties of the proposed method. The PSNRs of all the signals had values comparable with those of the state-of-the-art audio codecs. The maximum errors occurred only in short transient parts of the signals. The errors in the stable segments were negligible. We expect better PSNRs with larger sensor masks and smaller MOS values.
In further work, we will attempt to further optimise the basis and window functions so that the errors in transient signal segments will possibly be reduced. We also plan to apply follow-up compression algorithms to further compress the resulting coefficients so that higher compression ratios are achieved.
