Article

Improving Collaborative Filtering-Based Image Recommendation through Use of Eye Gaze Tracking

by
Ernani Viriato Melo
Department of Computer Engineering, Instituto Federal do Triângulo Mineiro, Uberaba 38064-190, Brazil
Information 2018, 9(11), 262; https://doi.org/10.3390/info9110262
Submission received: 15 September 2018 / Revised: 10 October 2018 / Accepted: 19 October 2018 / Published: 23 October 2018
(This article belongs to the Special Issue Modern Recommender Systems: Approaches, Challenges and Applications)

Abstract

:
Due to the overwhelming variety of products and services currently available on electronic commerce sites, the consumer finds it difficult to encounter products of preference. It is common that product preference be influenced by the visual appearance of the image associated with the product. In this context, Recommendation Systems for products that are associated with Images (IRS) become vitally important in aiding consumers to find those products considered as pleasing or useful. In general, these IRS use the Collaborative Filtering technique that is based on the behaviour passed on by users. One of the principal challenges found with this technique is the need for the user to supply information concerning their preference. Therefore, methods for obtaining implicit information are desirable. In this work, the author proposes an investigation to discover to which extent information concerning user visual attention can aid in producing a more precise IRS. This work proposes therefore a new approach, which combines the preferences passed on from the user, by means of ratings and visual attention data. The experimental results show that our approach exceeds that of the state of the art.

1. Introduction

Over recent decades, purchases via e-commerce have become ever more commonplace. In many cases, the search for a product is made through key words. This search can be tedious if the company does not have an efficient Recommendation System (RS). Since the beginning of the 1990’s, many algorithms have been developed to deal with this problem, these make use of the behaviour passed on by the users (clicks, purchases, ratings) in order to produce recommendations [1]. The RS helps individuals to find products and/or services that correspond to their preferences and give support, so that individuals can make decisions in a variety of contexts, such as which products to buy [2], which film to watch [3], which music to listen to [4], which painting to go and see [5]. In this work, the author is interested in the Recommendation System for products that are associated with images (IRS).
In general, irrespective of the type of information that will be recommended (video, image, text or audio), three techniques exist for the development of an RS [6]. Those being, (i) the technique based on content (BC) [7] creates a profile for each product (item) based on its features, along with a profile of interest for each user. The recommendation consists of combining the attributes of each user profile with the attributes from the product profiles. (ii) The technique based on Collaborative Filtering (CF) [8], based on the behavior passed on from the user, which does not require information concerning product content. (iii) The third technique consists of the combination of the techniques BC and CF, which produces the hybrid solution [9].
The CF technique is widely used due to its simplicity and efficiency, especially in large well-known commercial systems, such as Netflix for the film recommendation and Amazon for the product purchase recommendation. With the traditional CF, the ratings are used to compare and identify similar items (known as neighbours); this particular step is considered as being critical to this approach. An important point is that not always are the users disposed to providing ratings, thus undermining the identification of neighbours of similarity and any recommendation that follows. In [6], the authors state that in any RS the number of ratings obtained is generally very small, when compared to the number of necessary ratings for performing an accurate rating prediction. Hence, there is still considerable space for improving the identification of similar neighbours and the quality of the product recommendation, especially those in which the visual aspect of the product is important for defining user opinion.
Images are important when it comes to influencing user choices concerning recommend products. Noteworthy is the fact that many products, such as shoes, clothes, or paintings are acquired by the user based on their visual appearance. In this work-study, it is understood that the manner in which individuals look at a product can be an important information for comparing products in the IRS. The central hypothesis of the author is that similarity between images can be best represented by using visual attention information. In light of this, the author proposes to investigate to what extent information about user visual attention can help to improve the rating prediction and consequently produce more accurate IRS. The objective of this work is the development of a new method based on CF that combines ratings and implicit visual attention information obtained via an eye tracker to represent the past behavior of users, denominated CFAS (Collaborative Filtering recommender system with Attentive Similarity).
This article is organized in the following form. In Section 2, the author presents related work and an overview of the background. In Section 3, a description of the proposal is given. In Section 4, a description of performed experiments is given, along with an analysis of their obtained results. Finally, in Section 5, a presentation is made of the conclusions and a discussion concerning future work.

2. Literature Review

Formally, the RS represents the behaviour passed on by the user via a utility matrix R = { r u i } , where the lines represent the users, the columns represent the products (items) and the cell ( u , i ) contains the rating given by the user u concerning the item i (normally a whole number from 1 to 5 that represent stars), which indicates the user interest u for item i. With this information at hand, the recommendation problem can be interpreted as a problem of predicting ratings of an item set that still has not been rated by a given user, and the items with the highest predicted rating are recommended for this user.
The CF based strategies are divided into two main categories, those being neighbourhood based methods and model based methods. The neighbourhood based methods focus on the relationship between users (user-user approach) or between products (item-item approach), in order to predict the rating of a product i by a user u. The user-user approach searches for other users similar to u and uses their ratings concerning the product i to carry out the prediction, while the item-item approach uses the user ratings u concerning the products that are most similar to product i. The item-item approach became more popular due to greater scalability and accuracy in a variety of situations [10]. The model based methods use a machine-learning algorithm for constructing a recommendation model. The latent factor models are the most popular, with such models as the Singular Value Decomposition (SVD) [10].
The strategy developed in this article is inspired upon one of the most popular methods for ratings prediction—Item KNN + Baseline (IKB) [11]. In the IKB, the central idea is the RS recommends for an active user (to whom one wishes to recommend) the items that are more similar to the items that the user himself liked. The similarity between the items is calculated based on the similarity of the ratings history of several system users. The RS performs the prediction of unknown ratings and recommends the products with the highest rating values predicted for the user. The rating prediction r ^ u i of an item i by a user u is calculated using the weighted average of the ratings from the set of items I ( u , i , k ) , which consists of the k-neighbours closest to the item i that were rated by the user u. The IKB is described in Equation (1).
r ^ u i = b u i + j I ( u , i , k ) , j i ( r u j b u j ) . s i j j I ( u , i , k ) , j i | s i j | ,
where b u i = m + b u + b i is defined as User Item Baseline (UIB) Model. b u and b i indicate the deviations over the ratings global average m of the user u and the item i, respectively.
The similarity s i j between two items i and j is calculated based on past ratings, these can be obtained by some kind of similarity function, such as the Pearson correlation coefficient, cosine similarity, or distance-based similarity, among others. Each item is represented by a dimension vector equal to the number of users. If the application possesses a very large quantity of users, it is interesting to work with a dimensionality reduction, and model the items and users using the factorization of matrices. The similarity between the items in the IKB can be calculated by the inverse of Euclidean distance normalized between latent vectors from the items as described in [12], denominated here as IKB (SVD).
The similarity values possess two important roles. (i) They allow for the selection of trustworthy neighbours, from which ratings are used in the prediction. (ii) They supply the means to weigh the importance of these neighbours in the rating prediction. In [13], the authors introduce a strategy for modifying s i j , denoted as s i j . The strategy, denominated Case Amplification, transforms the similarity value using a parameter p ( s i j = s i j · | s i j | p 1 ), favouring the items with higher similarity.
There are those studies that use functions that add two or more similarities under the intent of combining different properties and behaviour. In [14], the authors define a linear aggregation function for combining two similarities. The first similarity considers a set of films with tags that represent topics and the second similarity considers the ratings concerning the films. In [15], the authors add a measure that considers relationships between concepts represented by the website, and another measure that considers the item ratings. In [16], the authors combine a measure that considers features directed toward user sentiments concerning the items, and a measure that considers ratings. In [17], the combination is between two distinct measures based on ratings. To our knowledge, there do not exist studies that combine visual attention data obtained by means of eye tracking and rating data.
In studies [18,19], the visual attention data (eye fixing and eye movement, known as saccades) are obtained via an eye tracker and these data are used to indicate user preference concerning products. In this article, the author addresses the visual attention in a different manner. Here, visual attention is used to characterize the image and help to calculate the similarity between images. In addition, different to approaches described in [18,19], in the proposed strategy, the user (that receives the recommendation) does not necessarily need an eye tracker, as just a few users with an eye tracker is sufficient to characterize the images.

3. A Proposed Image Recommendation System

An overview of the proposal herein, denominated CFAS (Collaborative Filtering recommender system with Attentive Similarity), is shown in Figure 1. More specifically, CFAS is divided into four main components, the Segmentation Process, the Management of Visual Attention and Ratings (MVAR), the Prediction Process, and the Recommendation Process.

3.1. Segmentation Process

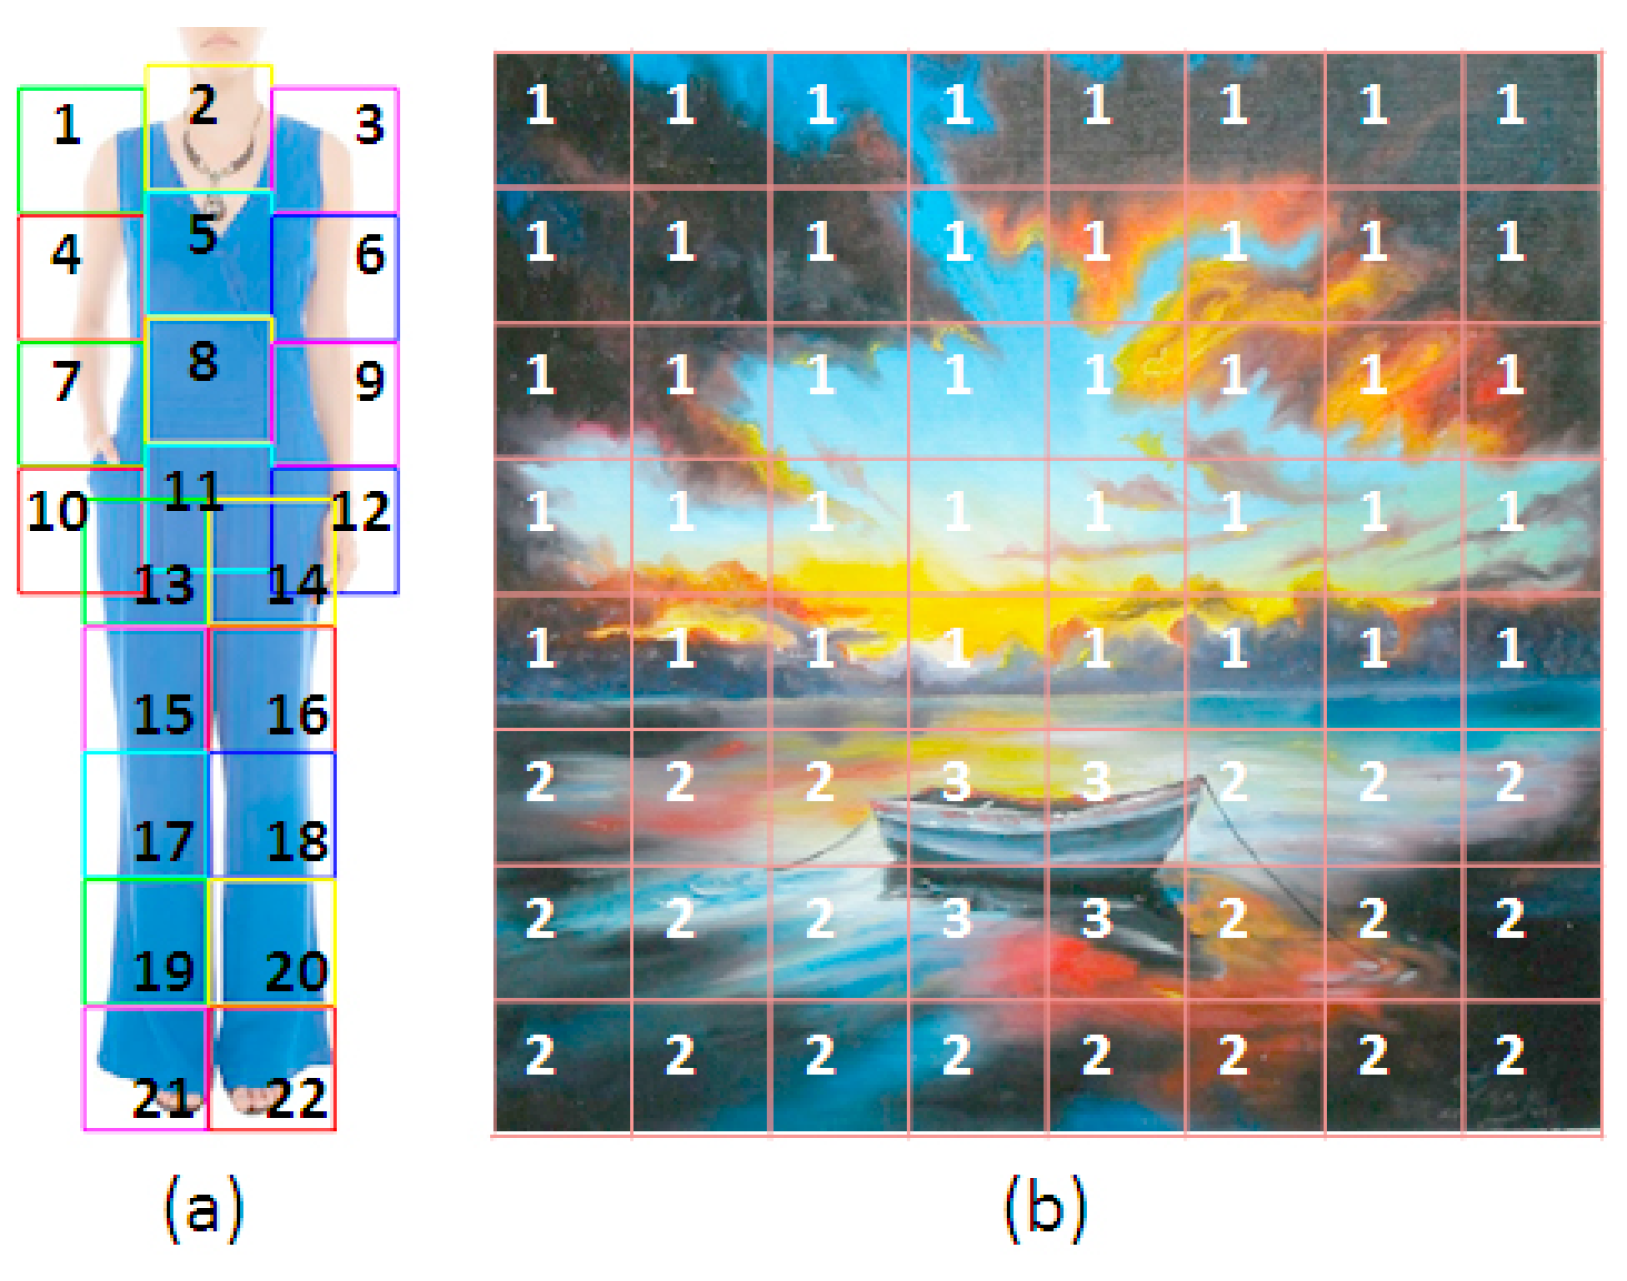
In this process, it is assumed that a collection of images possesses a set of labels that are associated with semantic concepts, denominated set H . The content and the cardinality of H depends on the segmentation method and on the application domain. Each image from the collection is then segmented into parts and each respective part should be labelled in accordance with the set H . Two different examples of segmentation are illustrated in Figure 2. In Figure 2a, the application domain is ”clothing” and the set H represents the parts of the human body, or be it, H = {right shoulder, neck, left shoulder, right knee, left knee,...}. In Figure 2b, the application domain is ”paintings” and the set of labels H represents landscapes, objects, animals, people, buildings, among others.

3.2. Management of Visual Attention and Ratings (MVAR)

This component contains two databases. The first denominated as Ratings database, which stores the utility matrix R . The second denominated the Visual attention database, which stores the fixation and eye movements of the users (information implicitly supplied by the users and updated in real time). The formal representation of visual attention is obtained through the joining of the segmentation process with the collection of fixations and eye movements.
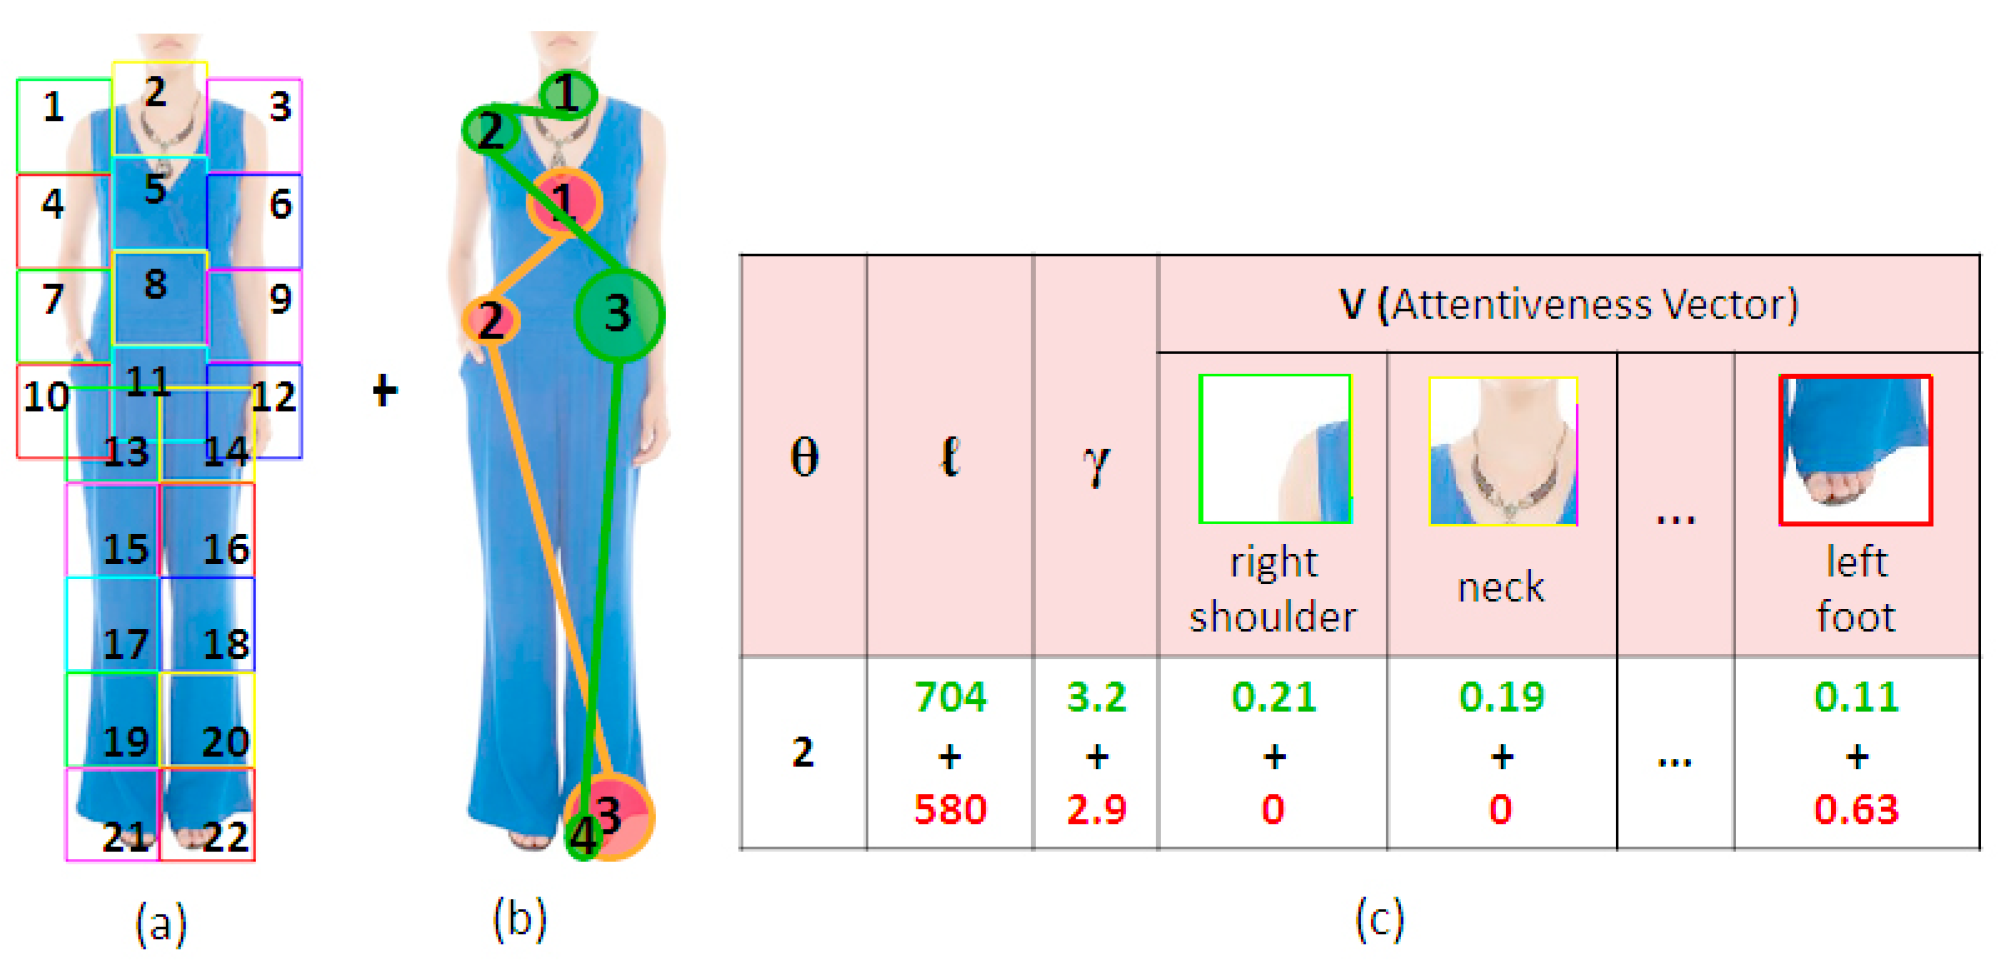
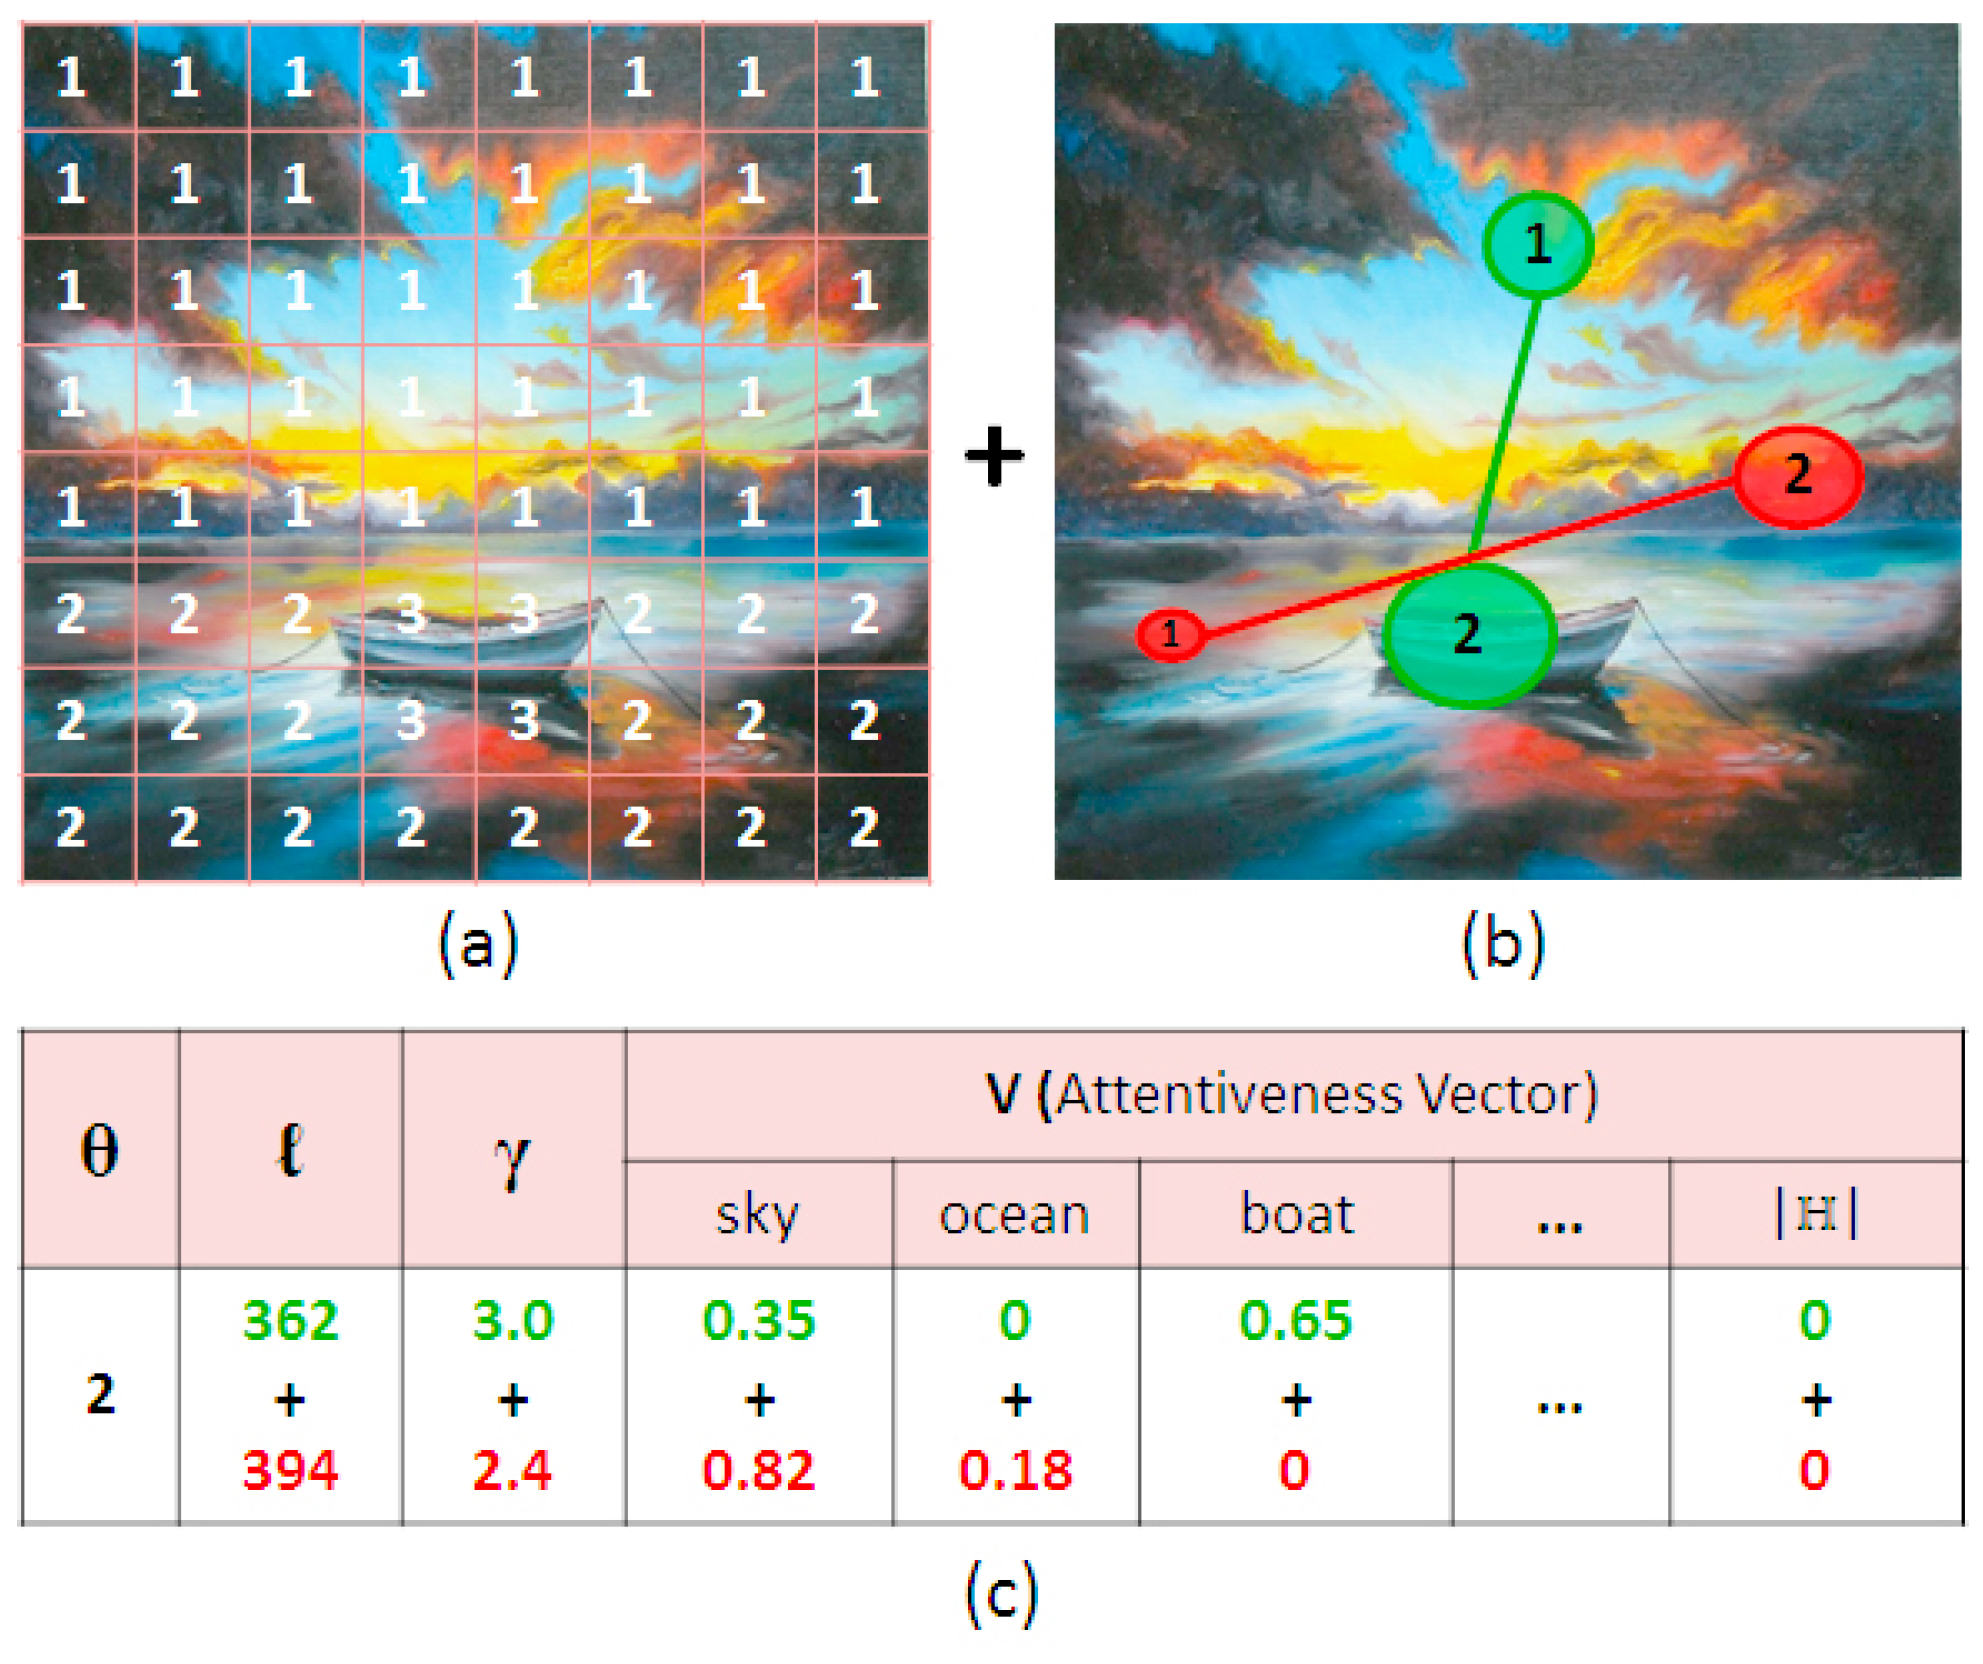
Process for fixation collection and eye movements—When a user browses over items (images) of a system by using a computer with an eye-tracking device, the visual attention data are captured and stored. Each image i is then described through four visual attention attributes: [ θ i , i , γ i , V i ] , where θ i is the number of users that looked at image i. Next, i is the total sum of the route, in number of pixels, of every user that looks at image i. Following on, γ i is the sum of the duration, in seconds, of every fixation over the image i. Finally, V i is an attentiveness vector with a dimension equal to the number of semantic labels ( | H | ). Each position for the attentiveness vector V i is related to a label t of the image i. The values of i , γ i , and each position V i [ t ] of the image i are obtained in accordance with Equations (2), (3), and (4), respectively.
i = u G ( i ) m M ( u , i ) l m ,
γ i = u G ( i ) g G ( u , i ) d g ,
V i [ t ] = u G ( i ) g G ( u , i , t ) d g g G ( u , i ) d g ,
where the set G ( i ) contains the users that looked at the image i. Thus, M ( u , i ) is the set of every saccade of the user u over the image i. Then, l m is the size of the saccade m, and G ( u , i ) is the set of all eye fixation data from the user u over the image i. Following on, G ( u , i , t ) is the set of all eye fixation data of the user u over the semantic label t of the image i. Finally, d g is the duration, in seconds of the fixation g. The representation of the visual attention data of a clothing image visualized by two users is shown in Figure 3 and the visual attention data of a painting image is shown in Figure 4.

3.3. Prediction Process

The prediction process occurs in an offline manner, and has the main objective of predicting unknown ratings in the utility matrix. This process occurs when the user updates their ratings or when a new item is inserted into the database or information concerning visual attention of the item is updated. This process is divided into two main parts, the calculation of similarity and the prediction rating.
The similarity among every item is represented by a similarity matrix S = { s i j } 1 i I , 1 j I , where I is the set of items and the similarity s i j between two items i and j is calculated by combining two similarities, Attentive Similarity ( A S i j ) and Similarity based on Ratings ( R S i j ).
The Attentive Similarity ( A S i j ) between two images i and j is given by an aggregation function defined over the interval f A S : [ 0 , 1 ] 2 [ 0 , 1 ] , which considers two terms. The first term ( s i m ( V i , V j ) ) considers the similarity between two attentive vectors ( V i and V j ) and the second term ( s i m ( i , j ) ) considers the similarity between the saccade sizes ( i and j ), as defined in Equation (5).
A S i , j = f A S s i m ( V i , V j ) , s i m ( i , j )
The attentiveness vectors V i and V j are attentiveness histograms, where each bin represents a semantic label and the value attributed to a label represents to which degree this label is attentive. By dividing these vectors by the number of users that looked at image i and j ( θ i and θ j , respectively), the vectors will be normalized. For calculating the similarity s i m ( V i , V j ) between two vectors one can use a diverse group of functions, such as Euclidean distance, Mahalanobis, and histogram intersection. In the similarity between the attentive vectors s i m ( V i , V j ) , as well as the similarity between saccade sizes s i m ( i , j ) should be at the interval of [0, 1]. The similarity s i m ( i , j ) can be also calculated by using different functions, provided they are normalized. The value of the attentive similarity ( A S i j ) is also at the [0, 1] interval, where 0 means that the images i and j are totally different and 1 means the images i and j are similar from the point of view of visual attention.
Attentive similarity can be compromised if one of the items has few visualizations. Therefore, the author followed defining a strategy that modifies the A S i j value, denoted as A S i j , by using an importance weighting factor, which affords privileges to the similarity values among those items with a greater number of views. Thus, an attentive similarity A S i j is shrunk down to
A S i j = | G ( i , j ) | 1 | G ( i , j ) | 1 + λ a s A S i j
where λ a s is a shrinkage parameter defined by the user, | G ( i , j ) | is the quantity of users that manifest eye fixations over both items i and j. In this case, A S i j is substituted by A S i j in the similarity calculation s i j .
Similarity Based on Ratings ( R S i j )—In the strategy proposed in this paper, the similarity R S i j between two items i and j can be calculated using any one of similarity functions between items based on ratings, such as the Pearson correlation coefficient, cosine similarity, distance-based similarity, or the inverse of the normalized Euclidean distance between two item-factors vectors.
The similarity s i j proposed in this paper between two items i and j is obtained by an aggregation function f s : [ 0 , 1 ] 2 [ 0 , 1 ] , which combines the attentive similarity ( A S i j ) and the similarity based on ratings ( R S i j ), as in Equation (7).
s i , j = f s R S i j , A S i j
After calculating the similarity matrix S , the prediction calculation is performed in the same manner as in the IKB method, described in Equation (1).
The strategy proposed herein provides a partial approach to the cold-start problem, where new items that still have not been rated (but have been viewed by users) can be recommended. For such new items, it is only necessary to consider the attentive similarity ( A S i j ), in the similarity calculation between the items.

3.4. Recommendation Process

The recommendation process takes place online. Given a user, the system loads the predicted ratings for the user and recommends the items with the highest predicted ratings.

4. Methodology of the Experiments

This section presents the important aspects concerning the validation of the CFAS method proposed in Section 3, as well as the results obtained in the stages of the prediction and recommendation process.

4.1. Experimental Setting

4.1.1. Database

In order to validate the proposed methodology, two databases were used, UFU-CLOTHING [20] and UFU-PAINTING [21].
UFU-CLOTHING — the database is composed of 6946 clothing images collected from various Brazilian online shopping websites, 469,071 eye fixations and 73,414 ratings (of 1 to 5 stars) given by 245 users. The images are of human models posing in the same position, in order to facilitate the segmentation stage of the images into parts of the human body. In this article, a segmentation algorithm was developed based on the position of each part of the human body in the image, thus permitting the automatic segmentation of the images. In the interest of efficiency and based on the studies [22,23], the images were segmented into 22 parts of the human body (see Figure 2a), with 12 upper parts of the body, such as neck, right shoulder, left shoulder, etc., and 10 lower parts, such as right knee, left knee, etc.
UFU-PAINTINGS—the database is composed of 605 images of paintings collected from the website pintura.aut.org, 444,780 eye fixations and 38,742 ratings (of 1 to 5 stars) given by 194 users. This database contains various paintings of diverse genres, produced between the XIV and XXI centuries. These can be divided into 9 categories, Animal, Architecture, Art, Abstract, Mythology, Still life, Nudism, Landscape, People, and Religion. In this article, we developed a software that divides the entire image into a grid of 20 × 20 parts of equal size. The user, by use of a mouse, labels each part with a semantic meaning. Through this, it was possible to manually label all the parts of the 605 paintings. The set H , defined in Section 3, is composed of 41 labels of possible semantic meanings.
In both databases, the non-intrusive Tobii x2-60 eye tracker was used for the collecting of visual attentive data (eye movement and eye fixations).

4.1.2. Evaluation Criteria

The evaluation of our approach was performed in accordance with the prediction and recommendation processes. In order to evaluate the prediction process, we adopted a popular metric used to measure the performance of the rating prediction task, Root Mean Squared Error (RMSE).
For the recommendation process, the results are reported in terms of the Average Precision (AP) values and Area Under the ROC Curve (AUC). In our experiments, we consider items rated with 4 or 5 stars as relevant to the user, and items rated with 1, 2, or 3 stars as not relevant.
The experiments were conducted employing the 10-fold-cross-validation method.

4.1.3. Assessing Statistical Significance

In order to show the effectiveness of our proposal, we evaluate the results using statistical tests by using sign test proposed by Demšar [24]. We conducted our evaluation by setting the data as described by Shani and Gunawardana [25], which use the sign test for rating prediction task in a paired setting using the same test set. We computed the per-user RMSE. To compare two methods A and B, we compute the number of users whose average RMSE is lower in A than in B, denoted by m A , and the number of users whose average RMSE is lower in B than in A, denoted by m B . The significance level or p-value is obtained according to Equation (8).
p = ( 0.5 ) n i = m A n n ! i ! ( n i ) ! ,
where n = m A + m B . When the p-value is below some predefined value (typically, 0.05) we will reject the null hypothesis that method A is not truly better than method B with a confidence of ( 1 p ) 100 %.

4.1.4. Comparison Algorithms

In order to demonstrate the efficiency of our methodology, we compared the proposed CFAS method with methods that are well known in the literature, and available to the public through the MyMediaLite framework [26]. The methods are,
  • UserItemBaseline (UIB): This method [11], described in Section 2, uses the global average m plus user and item biases for prediction purposes.
  • UserKNN + Baseline (UKB): This method [11] predicts an unknown rating as a weighted average of the ratings of neighbouring users, while adjusting for user and item biases effects.
  • ItemKNN+Baseline (IKB): This method [11], described in Section 2, predicts an unknown rating, taken as a weighted average of the ratings of neighboring items, while adjusting for user and item biases effects.
  • SVD: This is the traditional matrix factorization model [11].
  • SVD + Baseline (SB): This is the matrix factorization model with user and item biases. This model [27], also called Biased MF, is widely used as a baseline in recommender systems.
  • IKB (SVD): This method [12], described in Section 2, uses features (latent factors) for the similarity between items. We built this method upon MyMediaLite framework.
The CFAS method proposed in this article was also built using recourses from the MyMediaLite framework.

4.1.5. Parameter Setting

The parameters for the compared methods were configured with values indicated in the literature, which correlate as being the most adequate, or be it, the MyMediaLite configuration was adopted by default. To configure the parameters that only make up the part of the proposed method established in this paper, a number of different experiments were performed, and in accordance with the obtained results, the following was adopted:
  • (i) We chose the intersection for calculating the similarity among attentive vectors and similarity between saccade sizes, as in Equations (9) and (10), where n = | V i | = | V j | = | H | is the number of semantic labels and t = 1 | H | ( V i [ t ] θ i ) = 1 ;
    s i m ( V i , V j ) = t = 1 n m i n V i [ t ] θ i , V j [ t ] θ j
    s i m ( i , j ) = m i n i θ i , j θ j m a x i θ i , j θ j
  • (ii) We chose a linear aggregation function (Equation (11)) for calculating attentive similarity, using σ = 0.8 for the database UFU-CLOTHING and σ = 0.9 for database UFU-PAINTINGS (the size of the saccades is not relevant information for the painting domain);
    A S i , j = σ s i m ( V i , V j ) + ( 1 σ ) s i m ( i , j )
  • (iii) We adopted the shrinkage parameter λ a s = 25 from Equation (6);
  • (iv) A linear aggregation function was also chosen, in accordance with Equation (12), for calculating the combined similarity s i j , using β = 0.75 . The similarity was adjusted with the Case Amplification parameter, which adopted the value of 4 for the methods UKB, IKB, and CFAS and the value of 2 for the methods based on latent factors IKB (SVD) and CFAS (SVD).
    s i , j = β · ( R S i j ) + ( 1 β ) · ( A S i j )
The parameters with the highest impact on the results will be discussed in Section 4.

4.2. Experimental Results and Analysis

In this subsection, we run several experiments in order to analyze the performance of the use of visual attention for the rating prediction and recommendation processes.

4.2.1. Rating Prediction

The parameters with the highest impact on the results are, the number of closest neighbours k, and the similarity measure based on ratings for the methods based on neighbourhood, and the number of latent factors for the methods based on matrix factorization models. To reach a just comparison, these parameters were used to conduct the search for the best result of each method.
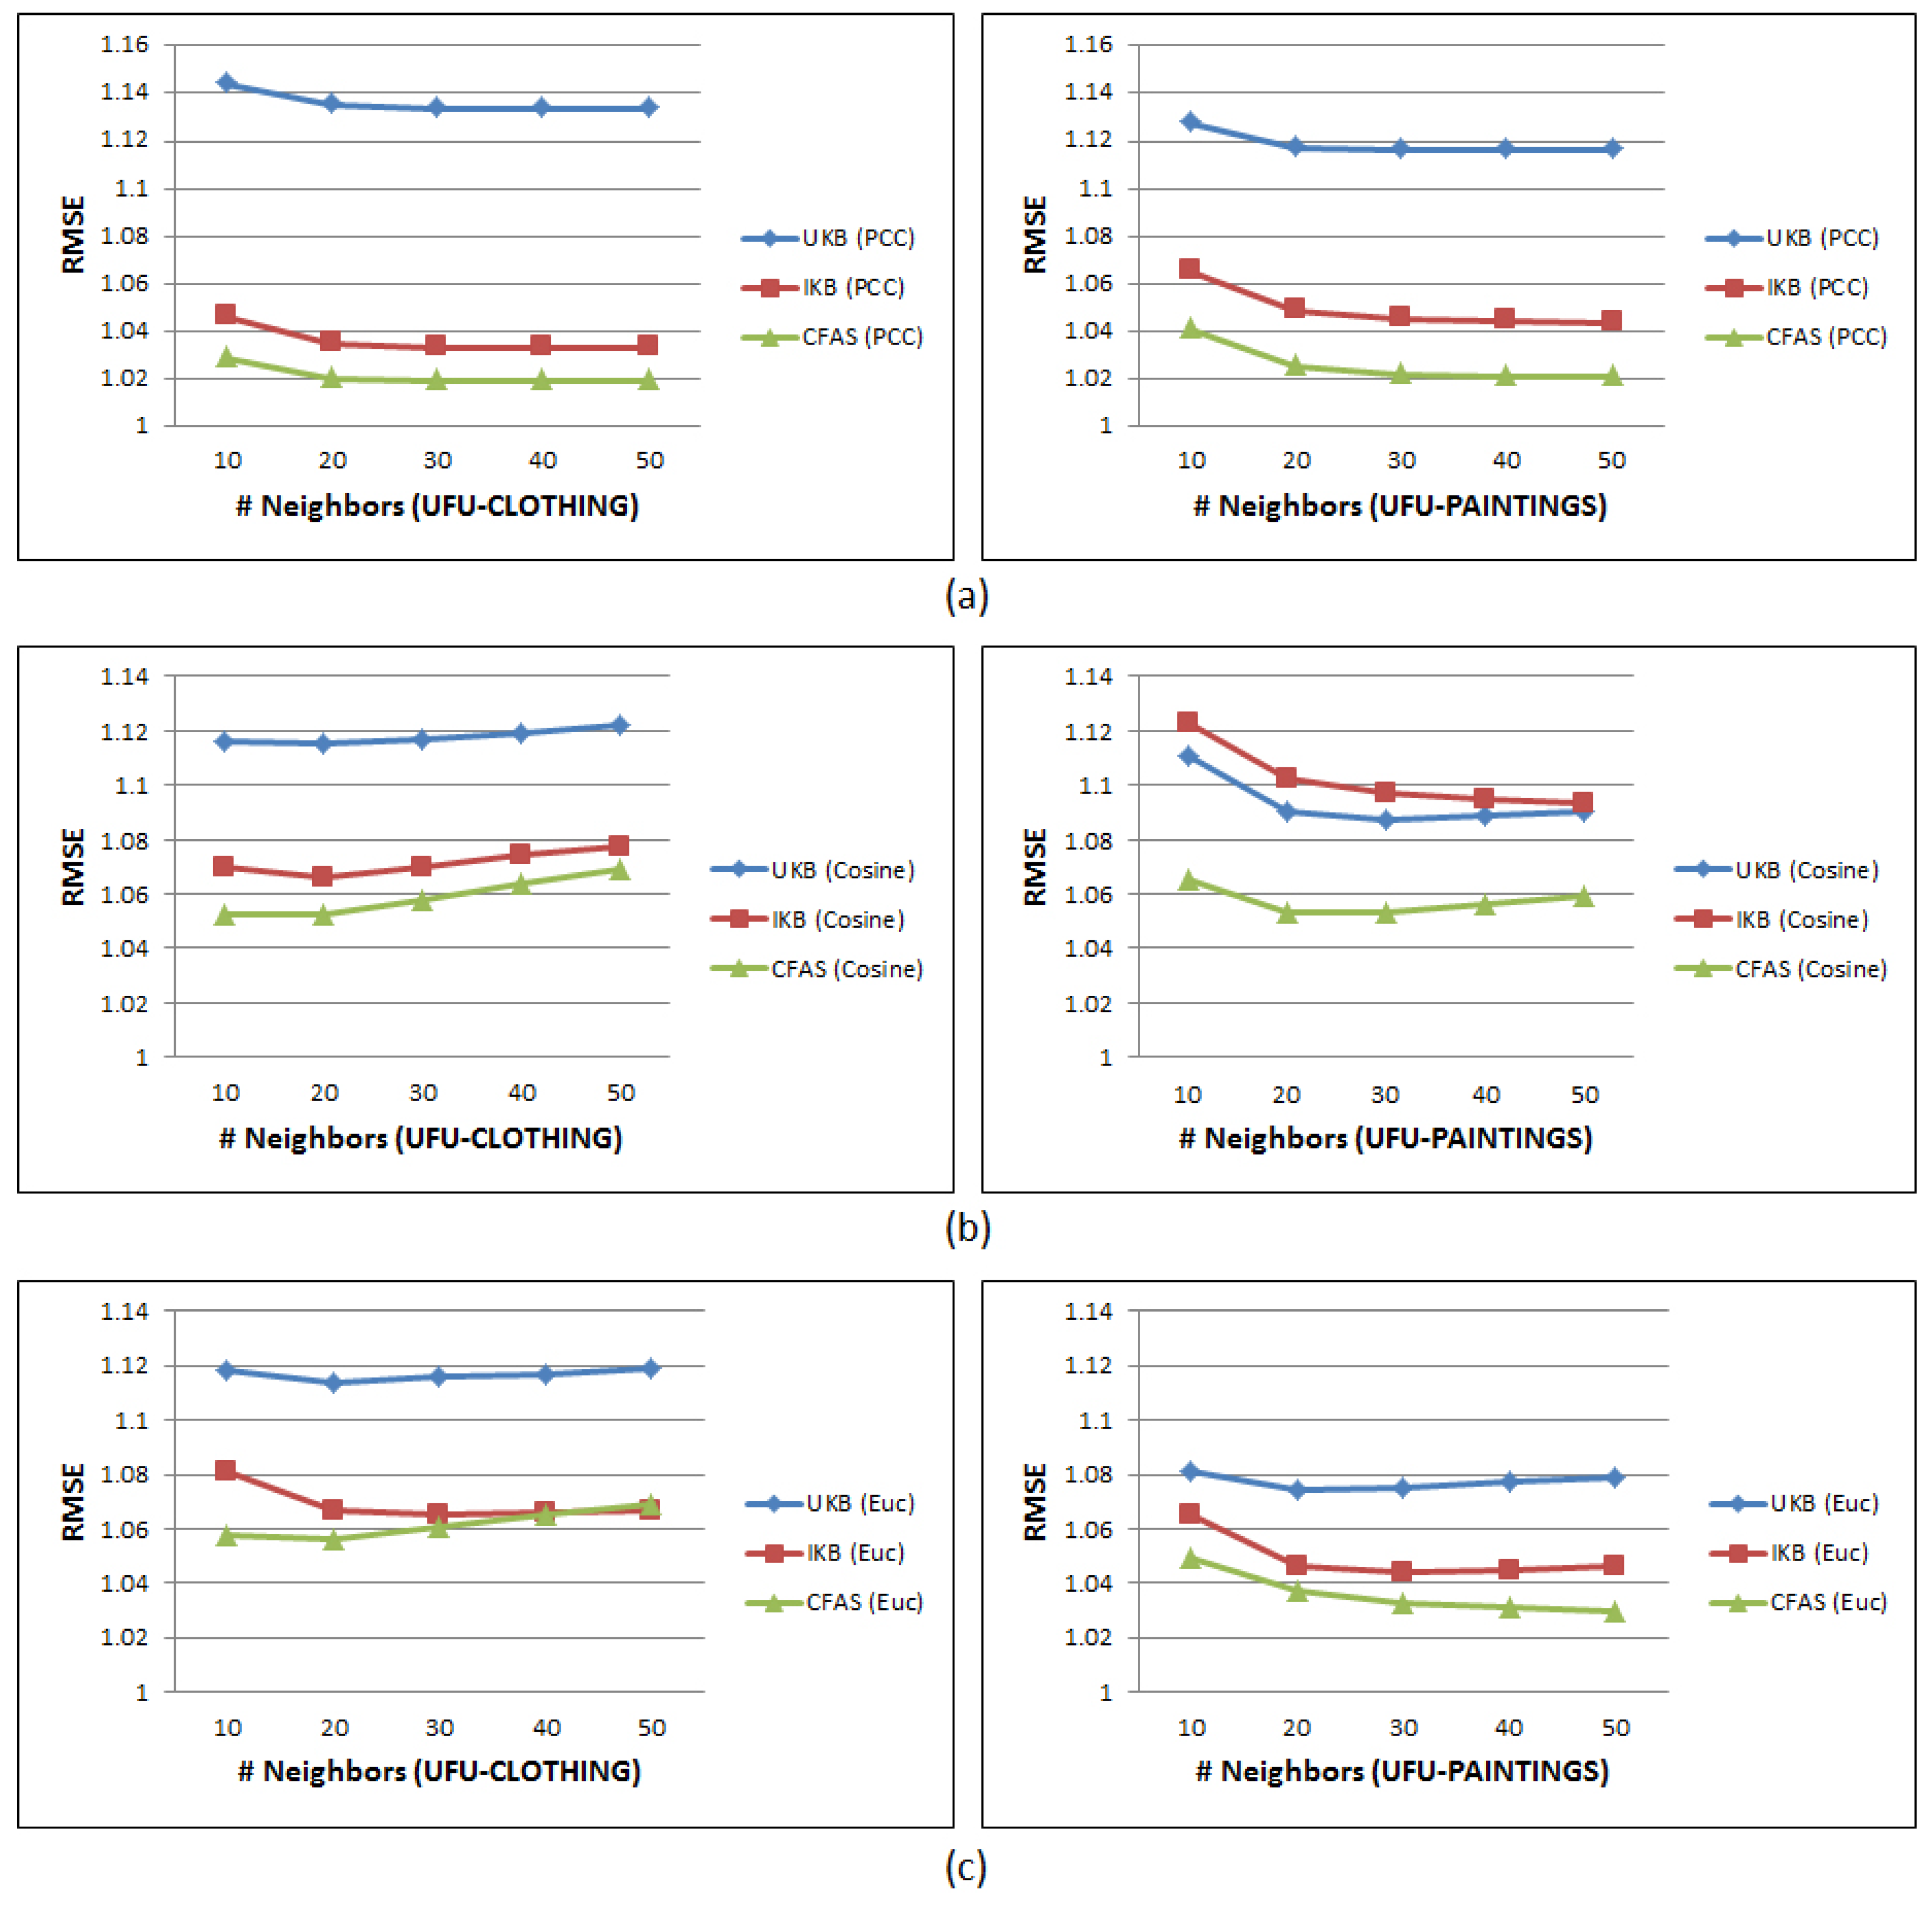
  • Methods that use the neighbourhood parameter: The methods UKB, IKB, and CFAS use the neighbourhood parameter. The experiments are executed with a varying number of closest neighbours (k) of 10 to 50 and then the RMSE is computed for each method. These tests are conducted using three similarity measures based on ratings, Pearson Correlation Coefficient (PCC), cosine, and the inverted Euclidean distance (Euc). Figure 5 illustrates the obtained results in terms of RMSE in the database UFU-CLOTHING and UFU-PAINTINGS. It was noted that the similarity measure with the best results was the PCC and that the proposed method CFAS was superior in every case, with gains in relation to the UKB of 7.6% to 10%, and in relation to the IKB from 1.4% to 2.3%.
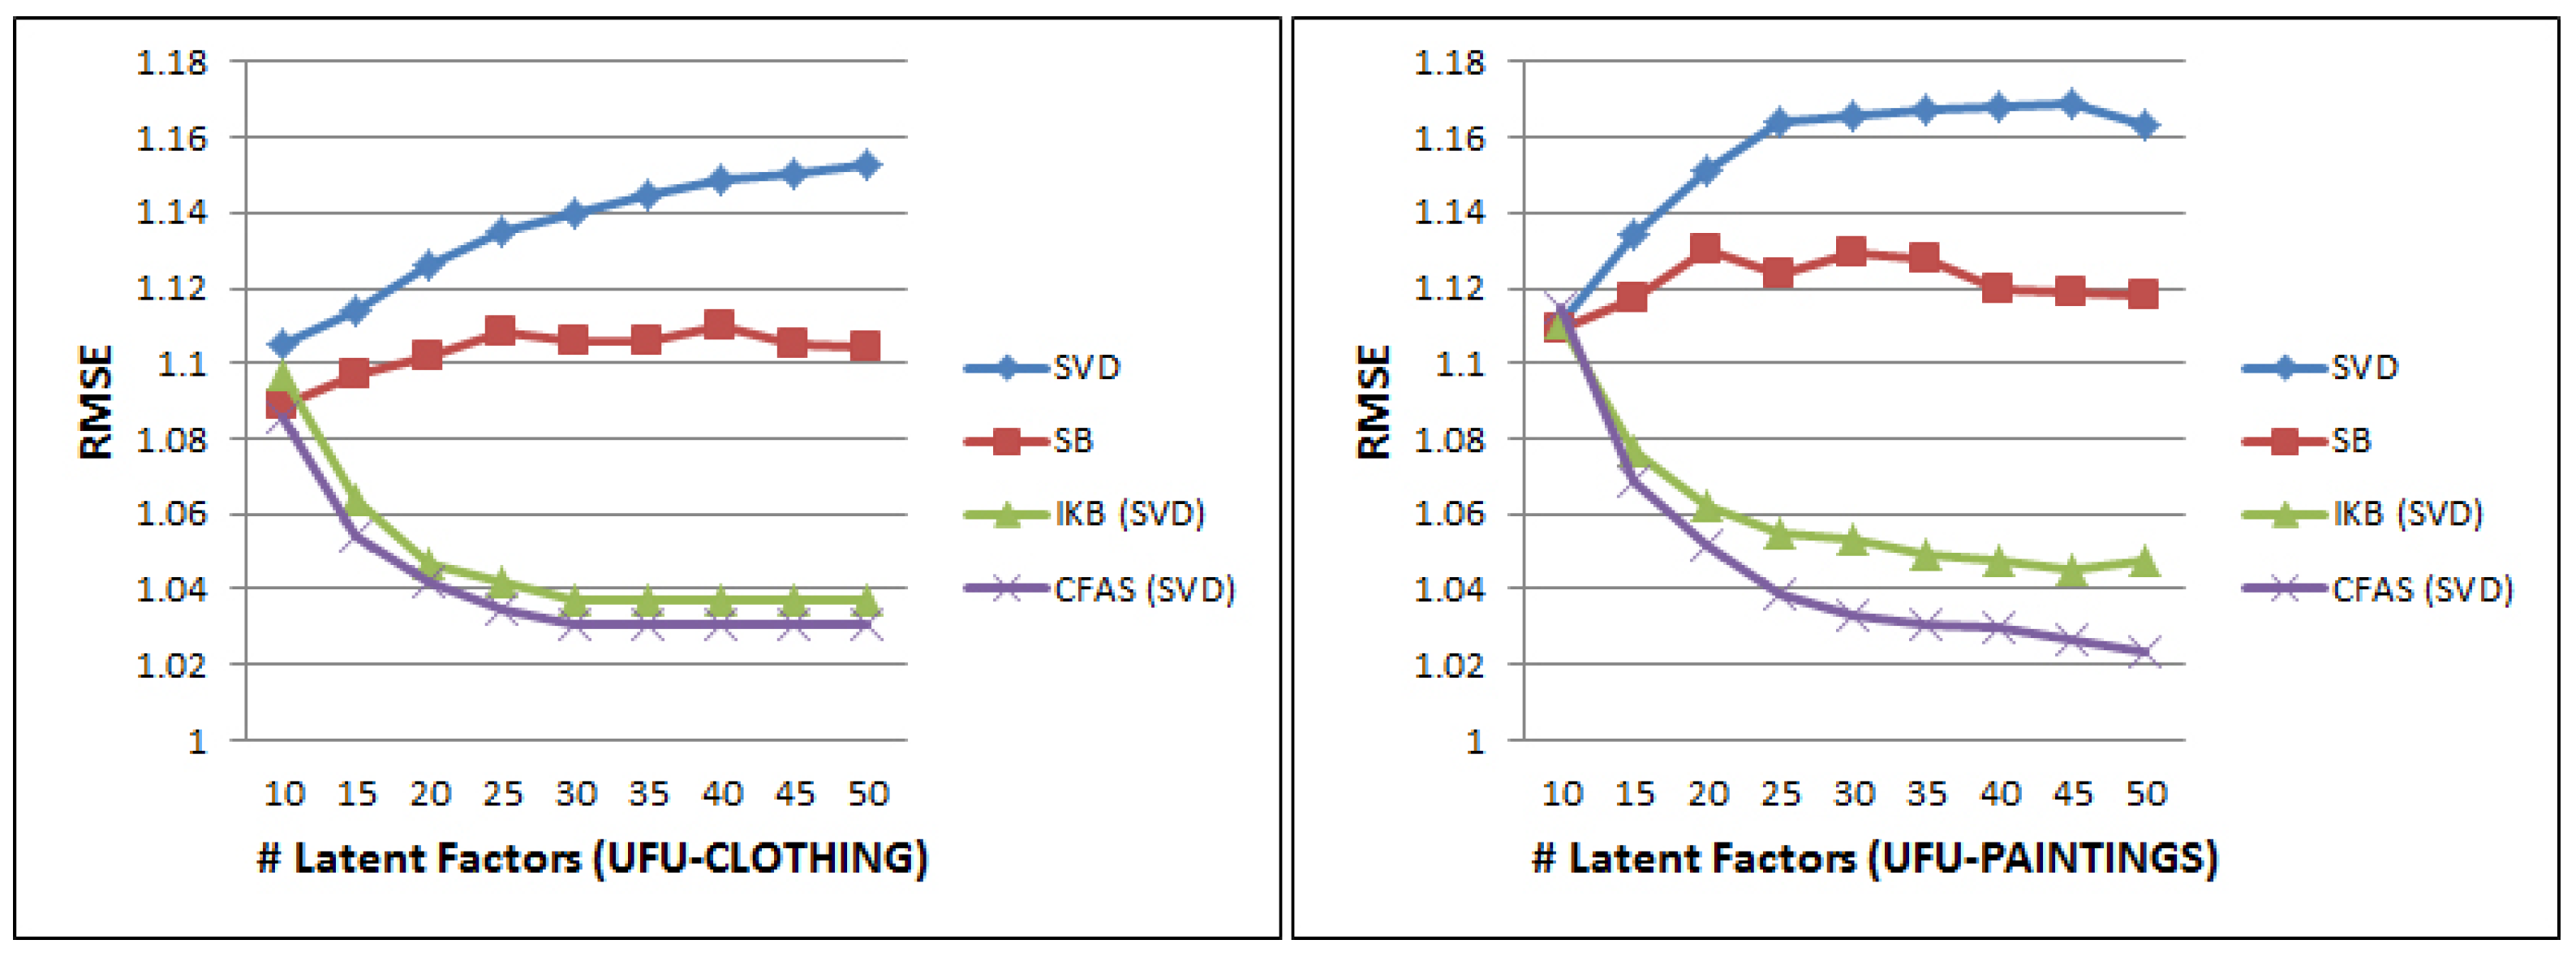
  • Methods that use the parameter of latent factors: The CFAS method can combine the similarity between latent factors with attentive similarity, thus denoted CFAS (SVD). The experiments were performed varying the number of latent factors between 10 and 50 for the methods of SVD, SB, IKB (SVD), and CFAS (SVD). Figure 6 shows that the proposed method of CFAS (SVD) was superior in every case, in terms of the RMSE. The gain in relation to the SVD was of 6.7% to 7.9%, in relation to the SB was of 5.3% to 6.1%, and in relation to the IKB (SVD) it was of 1% to 2%.
Table 1 summarizes the best results in terms of RMSE for all methods.
Although small, the gain made by the proposed method is very significant in recommendation systems. The superiority of CFAS was confirmed by calculating the statistical significant differences among the approaches with a sign test. The CFAS method reached a p-value lower than 0.05, when compared to the comparative methods.
The problem of new items is a big challenge to recommendation systems, especially when these are based on CF. If a new item i (without ratings) occurs in a CF method based on neighbourhood, it is not possible to calculate the similarity between item i and all other items. In addition, if the new item i occurs in a CF method based on latent factors, the new item will not have a latent factor vector. Consequently, it is not possible to calculate the rating prediction over the new item i. However, if the item i has already been viewed by users, it is possible to calculate the attentive similarity between the item i and all other items, and thus predict the rating over the item i using the CFAS method.
To evaluate this strategy, 100 items were randomly selected, which were previously viewed by users for the test set with the ratings removed from these items. The CFAS method obtained an RMSE = 1.159 (UFU-CLOTHING) and RMSE = 1.172 (UFU-PAINTINGS). However, the method UIB reduced to only user bias obtained a far inferior result, with RMSE = 1.212 (UFU-CLOTHING) and RMSE = 1.207 (UFU-PAINTINGS).

4.2.2. Recommendation Process

In the recommendation task Top-N, the SR recommends to the user the first N of items most relevant to him/her. Table 2 presents the AP measure for TOP-5 and the AUC measure obtained by the methods. The parameters used were the same as for the experiments shown on Table 1. Note that in all cases, the CFAS obtained better results when compared to the other methods.

5. Conclusions

In this article, the author presents a new manner to describe the content of the image in accordance with the visual attention of the users. Proposed herein is a new measure that calculates the attentive similarity between two items, a new method (CFAS) based on item-item similarity that combines attentive similarity with similarity based on ratings or on latent factors. The experiments were conducted using a clothing database and a painting database constructed at the author’s research laboratory. The visual attention on the clothes and paintings is related to the user’s taste. The analysis of the results showed that CFAS was superior to all other state of the art competitive methods for visually important products. The CFAS also reduces the cold-start item problem that predicts the rating of items not yet rated, but already viewed. Nevertheless, the approach presented herein is strongly dependent on the segmentation of images according to the application and the use of eye tracker devices, which are currently very expensive. It is hoped that in the near future desktop computers and mobile devices will have embedded eye trackers.

Conflicts of Interest

The author declare that they have no conflicts of interest.

References

  1. Goldberg, D.; Nichols, D.; Oki, B.M.; Terry, D. Using collaborative filtering to weave an information tapestry. Commun. ACM 1992, 35, 61–70. [Google Scholar] [CrossRef]
  2. Zhang, X.; Wang, H. Study on recommender systems for business-to-business electronic commerce. Commun. IIMA 2015, 5, 8. [Google Scholar]
  3. Qin, S.; Menezes, R.; Silaghi, M. A recommender system for youtube based on its network of reviewers. In Proceedings of the 2010 IEEE Second International Conference on Social Computing, Minneapolis, MN, USA, 20–22 August 2010; pp. 323–328. [Google Scholar]
  4. Wang, M.; Kawamura, T.; Sei, Y.; Nakagawa, H.; Tahara, Y.; Ohsuga, A. Context-aware music recommendation with serendipity using semantic relations. In Semantic Technology; Springer: Berlin/ Heidelberg, Germany, 2014. [Google Scholar]
  5. Albanese, M.; d’Acierno, A.; Moscato, V.; Persia, F.; Picariello, A. A multimedia recommender system. ACM Trans. Int. Technol. 2013, 13, 3. [Google Scholar] [CrossRef]
  6. Adomavicius, G.; Tuzhilin, A. Toward the next generation of recommender systems: A survey of the state-of-the-art and possible extensions. IEEE Trans. Knowl. Data Eng. 2005, 17, 734–749. [Google Scholar] [CrossRef]
  7. Lops, P.; De Gemmis, M.; Semeraro, G. Content-based recommender systems: State of the art and trends. In Recommender Systems Handbook; Springer: Berlin/Heidelberg, Germany, 2011. [Google Scholar]
  8. Ge, Y.; Xiong, H.; Tuzhilin, A.; Liu, Q. Collaborative filtering with collective training. In Proceedings of the Fifth ACM Conference on Recommender Systems, Chicago, IL, USA, 23–27 October 2011; pp. 281–284. [Google Scholar]
  9. Burke, R. Hybrid web recommender systems. In The Adaptive Web; Springer: Berlin/Heidelberg, Germany, 2007; pp. 377–408. [Google Scholar]
  10. Koren, Y.; Bell, R. Advances in collaborative filtering. In Recommender Systems Handbook; Springer: Berlin/Heidelberg, Germany, 2015; pp. 77–118. [Google Scholar]
  11. Koren, Y. Factor in the neighbors: Scalable and accurate collaborative filtering. ACM Trans. Knowl. Discov. Data 2010, 4, 1. [Google Scholar] [CrossRef]
  12. Jahrer, M.; Töscher, A. Collaborative Filtering Ensemble. In Proceedings of the 2011 International Conference on KDD Cup, San Diego, CA, USA, 21–24 August 2011; pp. 61–74. [Google Scholar]
  13. Breese, J.S.; Heckerman, D.; Kadie, C. Empirical analysis of predictive algorithms for collaborative filtering. In Proceedings of the Fourteenth Conference on Uncertainty in Artificial Intelligence, Madison, WI, USA, 24–26 July 1998; pp. 43–52. [Google Scholar]
  14. Stanescu, A.; Nagar, S.; Caragea, D. A hybrid recommender system: User profiling from keywords and ratings. In Proceedings of the 2013 IEEE/WIC/ACM International Joint Conferences on Web Intelligence (WI) and Intelligent Agent Technologies (IAT), Atlanta, GA, USA, 17–20 November 2013; pp. 73–80. [Google Scholar]
  15. Mobasher, B.; Jin, X.; Zhou, Y. Semantically enhanced collaborative filtering on the web. In Web Mining: From Web to Semantic Web; Springer: Berlin/Heidelberg, Germany, 2004; pp. 57–76. [Google Scholar]
  16. Dong, R.; O’Mahony, M.P.; Schaal, M.; McCarthy, K.; Smyth, B. Combining similarity and sentiment in opinion mining for product recommendation. J. Intell. Inf. Syst. 2015, 49, 1–28. [Google Scholar] [CrossRef]
  17. Li, Q.; Kim, B.M. An approach for combining content-based and collaborative filters. In Proceedings of the Sixth International Workshop on Information Retrieval with Asian Languages, Sappro, Japan, 7 July 2003; pp. 17–24. [Google Scholar]
  18. Jung, J.; Matsuba, Y.; Mallipeddi, R.; Funaya, H.; Ikeda, K.; Lee, M. Evolutionary programming based recommendation system for online shopping. In Proceedings of the Signal and Information Processing Association Annual Summit and Conference (APSIPA), Kaohsiung, Taiwan, 29 October–1 November 2013; pp. 1–4. [Google Scholar]
  19. Xu, S.; Jiang, H.; Lau, F. Personalized online document, image and video recommendation via commodity eye-tracking. In Proceedings of the 2008 ACM Conference on Recommender System, Lausanne, Switzerland, 23–25 October 2008; pp. 83–90. [Google Scholar]
  20. Melo, E.V.; Nogueira, E.A.; Guliato, D. Content-based filtering enhanced by human visual attention applied to clothing recommendation. In Proceedings of the 2015 IEEE 27th International Conference on Tools with Artificial Intelligence (ICTAI), Vietri sul Mare, Italy, 9–11 November 2015; pp. 644–651. [Google Scholar]
  21. Felício, C.Z.; de Almeida, C.M.M.; Alves, G.; Pereira, F.S.F.; Paixão, K.V.R.; de Amo, S. Visual perception similarities to improve the quality of user cold start recommendations. In Proceedings of the 29th Canadian Conference on Artificial Intelligence, Victoria, BC, Canada, 31 May–3 June 2016; pp. 96–101. [Google Scholar]
  22. Liu, S.; Song, Z.; Liu, G.; Xu, C.; Lu, H.; Yan, S. Street-to-shop: Cross-scenario clothing retrieval via parts alignment and auxiliary set. In Proceedings of the 2012 IEEE Conference on Computer Vision and Pattern Recognition, Providence, RI, USA, 16–21 June 2012; pp. 3330–3337. [Google Scholar]
  23. Fu, J.; Wang, J.; Li, Z.; Xu, M.; Lu, H. Efficient clothing retrieval with semantic-preserving visual phrases. In Computer Vision—ACCV 2012; Springer: Berlin/Heidelberg, Germany, 2013; pp. 420–431. [Google Scholar]
  24. Demšar, J. Statistical comparisons of classifiers over multiple data sets. J. Mach. Learn. Res. 2006, 7, 1–30. [Google Scholar]
  25. Shani, G.; Gunawardana, A. Tutorial on application-oriented evaluation of recommendation systems. AI Commun. 2013, 26, 225–236. [Google Scholar]
  26. Gantner, Z.; Rendle, S.; Freudenthaler, C.; Schmidt-Thieme, L. MyMediaLite: A free recommender system library. In Proceedings of the Fifth ACM Conference on Recommender Systems, Chicago, IL, USA, 23–27 October 2011; pp. 305–308. [Google Scholar]
  27. Menon, A.K.; Elkan, C. A log-linear model with latent features for dyadic prediction. In Proceedings of the 2010 IEEE International Conference on Data Mining, Sydney, Australia, 13–17 December 2010; pp. 364–373. [Google Scholar]
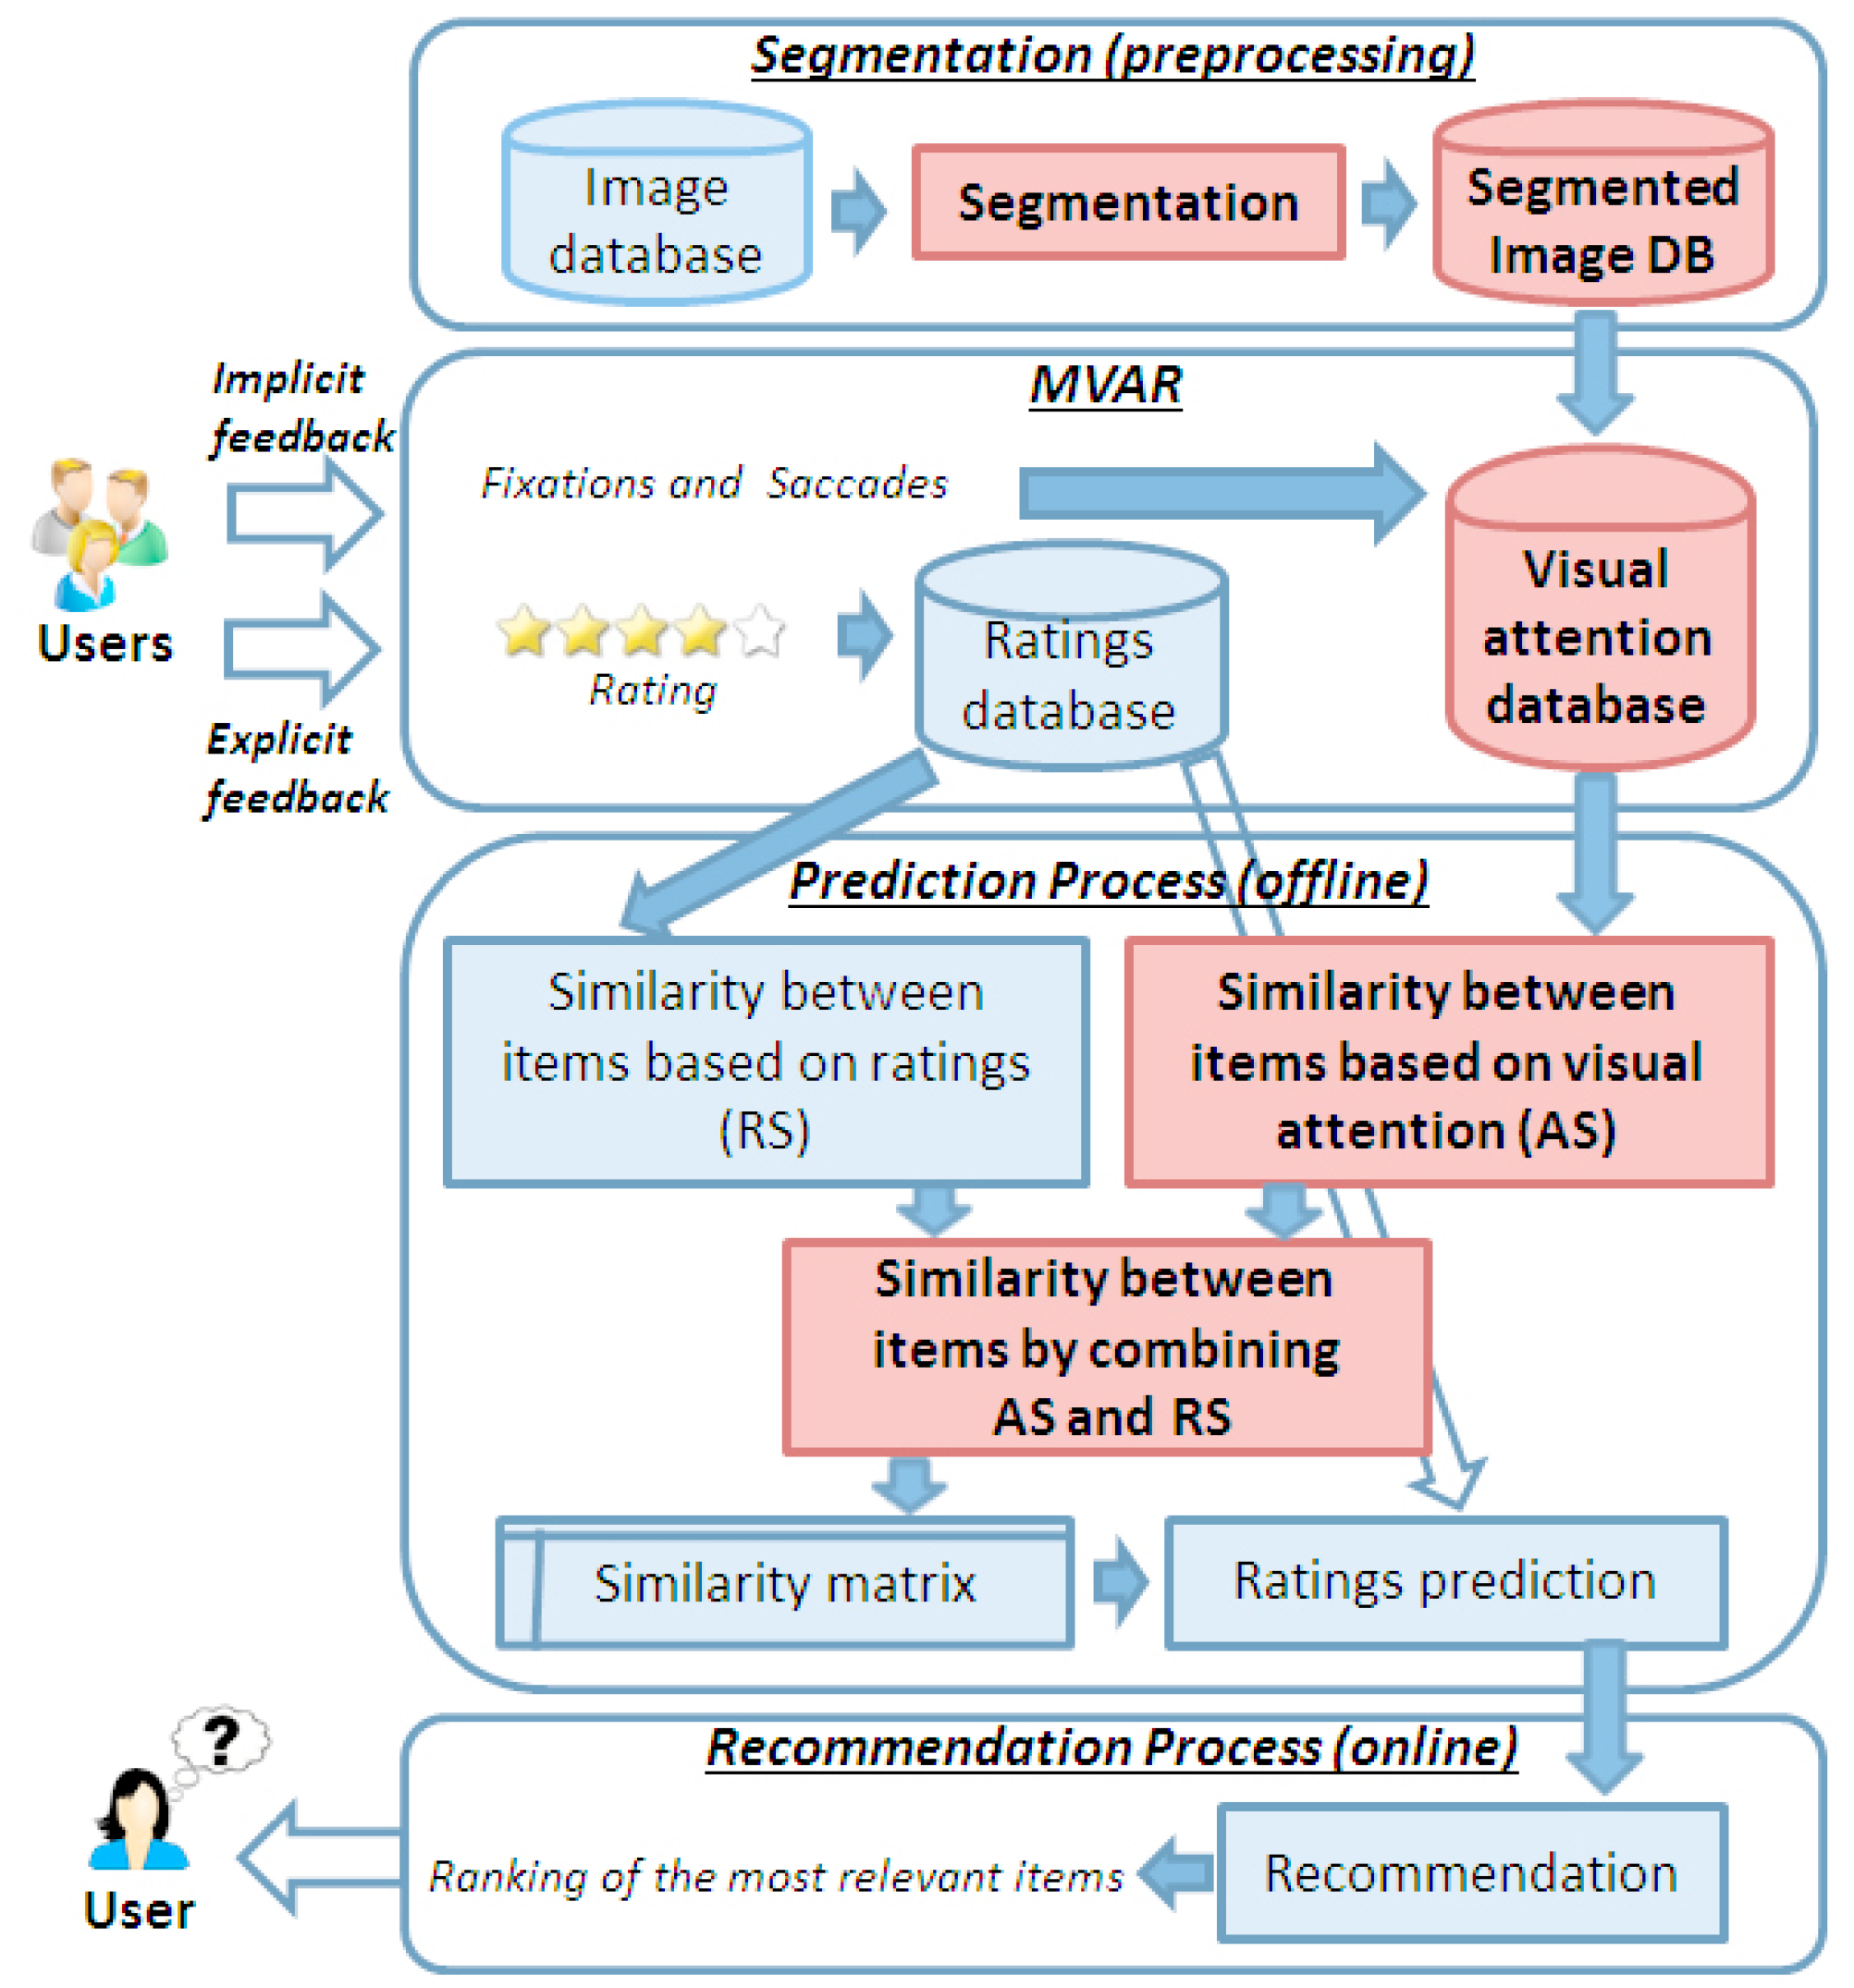
Figure 1. Architecture of the proposed Collaborative Filtering recommender system with Attentive Similarity (CFAS) method. The red rectangles represent the main contribution of this work.
Information 09 00262 g001
Figure 2. The images are segmented and labelled in accordance with the set H . In example (a), the segmentation is performed using a grid, which divides the individual into parts of the human body and each part is labelled with the respective semantic concept. In the second example (b), the segmentation is obtained by dividing the whole image into a regular grid, where each cell of the grid is labelled with a semantic concept related to the painting (1 represents sky, 2 represents ocean, and 3 represents a boat).
Information 09 00262 g002
Figure 3. Representation of the visual attention data of a clothing image viewed by two users. Represented in (a) is a segmented image. In (b) two users (green and red) view the image. Each circle represents an eye fixation and the radius of the circle represents the duration of the fixation. The lines between the circles represent the eye movements (saccades). A representation of the visual attention data is made in (c). The user represented by the colour green moved over 704 pixels of the image during 3.2 s and looked for 21% of the time toward the right shoulder, 19% of the time at the neck, and 11% of the time at the left foot. The user represented in red moved over 580 pixels of the image during 2.9 s and looked 63% of the time at the left foot.
Information 09 00262 g003
Figure 4. Representation of the visual attention data of an image viewed by two users. Represented in (a) is a segmented image. In (b) two users (green and red) view the image. (c) The visual attention data. The user represented by the colour green moved over 362 pixels of the image during 3 s and looked for 35% of the time toward the sky and 65% of the time at the boat. The user represented in red moved over 394 pixels of the image during 2.4 s and looked 82% of the time toward the sky and 18% of the time in the direction of the ocean.
Information 09 00262 g004
Figure 5. Evaluation of the best number of closest neighbours for the methods user KNN + baseline (UKB), item KNN + baseline (IKB), and CFAS in terms of root mean squared error (RMSE). Analysed similarity measures: (a) Pearson Correlation Coefficient (PCC), (b) Cosine, and (c) Euclidean distance (Euc).
Information 09 00262 g005
Figure 6. Evaluation of the best number of latent factors for the methods SVD, SVD + baseline (SB), IKB (SVD), and CFAS (SVD).
Information 09 00262 g006
Table 1. Comparison in terms of root mean squared error (RMSE) of the best results obtained by the methods.
MethodsUFU-CLOTHINGUFU-PAINTINGS
RMSEParametersRMSEParameters
1. UIB1.114 1.100
2. UKB1.114 1.074
3. IKB (PCC)1.033N:301.044N:40
4. SVD1.105L.F.:101.111L.F.:10
5. SB1.089L.F.:101.109L.F.:10
6. IKB(SVD)1.037N:30; L.F.:301.045N:40; L.F.:45
7. CFAS (PCC)1.019N:301.021N:30
8. CFAS (SVD)1.031N:30; L.F.:301.023N:40; L.F.:50
Legend of the parameters: N: Number of closest neighbours; L.F.: Number of latent factors..
Table 2. Evaluation of the recommendation process in terms of average precision (AP) and area under the ROC curve (AUC).
MethodsUFU-CLOTHINGUFU-PAINTINGS
AP@5AUCAP@5AUC
1. UIB0.5600.6950.6010.701
2. UKB0.5680.7040.6130.716
3. IKB (PCC)0.6270.7430.6310.736
4. SVD0.5890.7180.6110.709
5. SB0.5980.7240.6100.715
6. IKB (SVD)0.6280.7460.6300.739
7. CFAS (PCC)0.6440.7570.6510.760
8. CFAS (SVD)0.6330.7510.6440.754