Article

Planning of Vehicle Routing with Backup Provisioning Using Wireless Sensor Technologies

1
Center of Electronics, Optoelectronics and Telecommunications (CEOT), Faculty of Sciences and Technology (FCT), University of Algarve, 8005-139 Faro, Portugal
2
Center of Electronics, Optoelectronics and Telecommunications (CEOT), Institute of Engineering (ISE), University of Algarve, 8005-139 Faro, Portugal
*
Author to whom correspondence should be addressed.
Information 2017, 8(3), 94; https://doi.org/10.3390/info8030094
Submission received: 8 July 2017 / Revised: 27 July 2017 / Accepted: 28 July 2017 / Published: 2 August 2017
(This article belongs to the Special Issue Intelligent Transportation Systems)

Abstract

:
Wireless sensor technologies can be used by intelligent transportation systems to provide innovative services that lead to improvements in road safety and congestion, increasing end-user satisfaction. In this article, we address vehicle routing with backup provisioning, where the possibility of reacting to overloading/overcrowding of vehicles at certain stops is considered. This is based on the availability of vehicle load information, which can be captured using wireless sensor technologies. After discussing the infrastructure and monitoring tool, the problem is mathematically formalized, and a heuristic algorithm using local search procedures is proposed. Results show that planning routes with backup provisioning can allow fast response to overcrowding while reducing costs. Therefore, sustainable urban mobility, with efficient use of resources, can be provided while increasing the quality of service perceived by users.

1. Introduction

With today’s technologies, demographic changes leading people to larger cities and the permanent concern with our natural resources, such as energy, it is inevitable that we seek for ways to improve our cities. In fact, many governments are looking for ways to transform their cities into smart cities. The goal for most smart cities is to manage and probe their infrastructures and resources efficiently for environmental sustainability and better urbanization development, among others [1].
Sensors are a key issue in intelligent environments, and currently, we are faced with smaller, less expensive and low-power sensors, which can be deployed in many places. These sensors have limited processing power, storage and battery, low bandwidth and short range. However, the possibility of organizing these sensors into networks, along with the Internet, brought application opportunities like environment monitoring, battle field surveillance, etc. [1,2].
In the context of urban infrastructure improvements, the integration of sensors with planning/management/operation tools becomes essential. Planning tools based on merged information about human behavior are required to aid the allocation of resources (e.g., water, roads, transportation, sewage, among others). Management tools are used for coordination when planning for interventions (such as building and maintaining roads, cables and power lines). Operation can be executed depending on the demand and/or based on historical usage (e.g., power supply during Christmas holidays).
Transportation networks comprise another area where the just mentioned tools can be useful. Each day, we concern ourselves with being efficient with our resources and increasingly look for ways to improve productivity. One main concern is the time spent each day in transportation networks. Its reduction is essential for citizens to be more productive, and decisions, necessary for efficiency improvement, mainly depend on the timely provision of information and monitoring tools. For this purpose, intelligent transportation systems (ITS) are now under strong research. These systems are endowed with communication capabilities for data transmission between vehicles (V2V) and between vehicles and roadside access points (V2R), also called road side units (RSUs), and are seen as key technologies for road safety improvement, congestion avoidance using optimal routing and scheduling and for the improvement of quality of service experienced by users (both drivers and customers) [3]. V2R communication can be used for data transfer between a mobile vehicle and a sink node, at the other side of the RSU, or to improve communication between mobile vehicles in vehicular ad hoc networks (VANETs) [4,5].
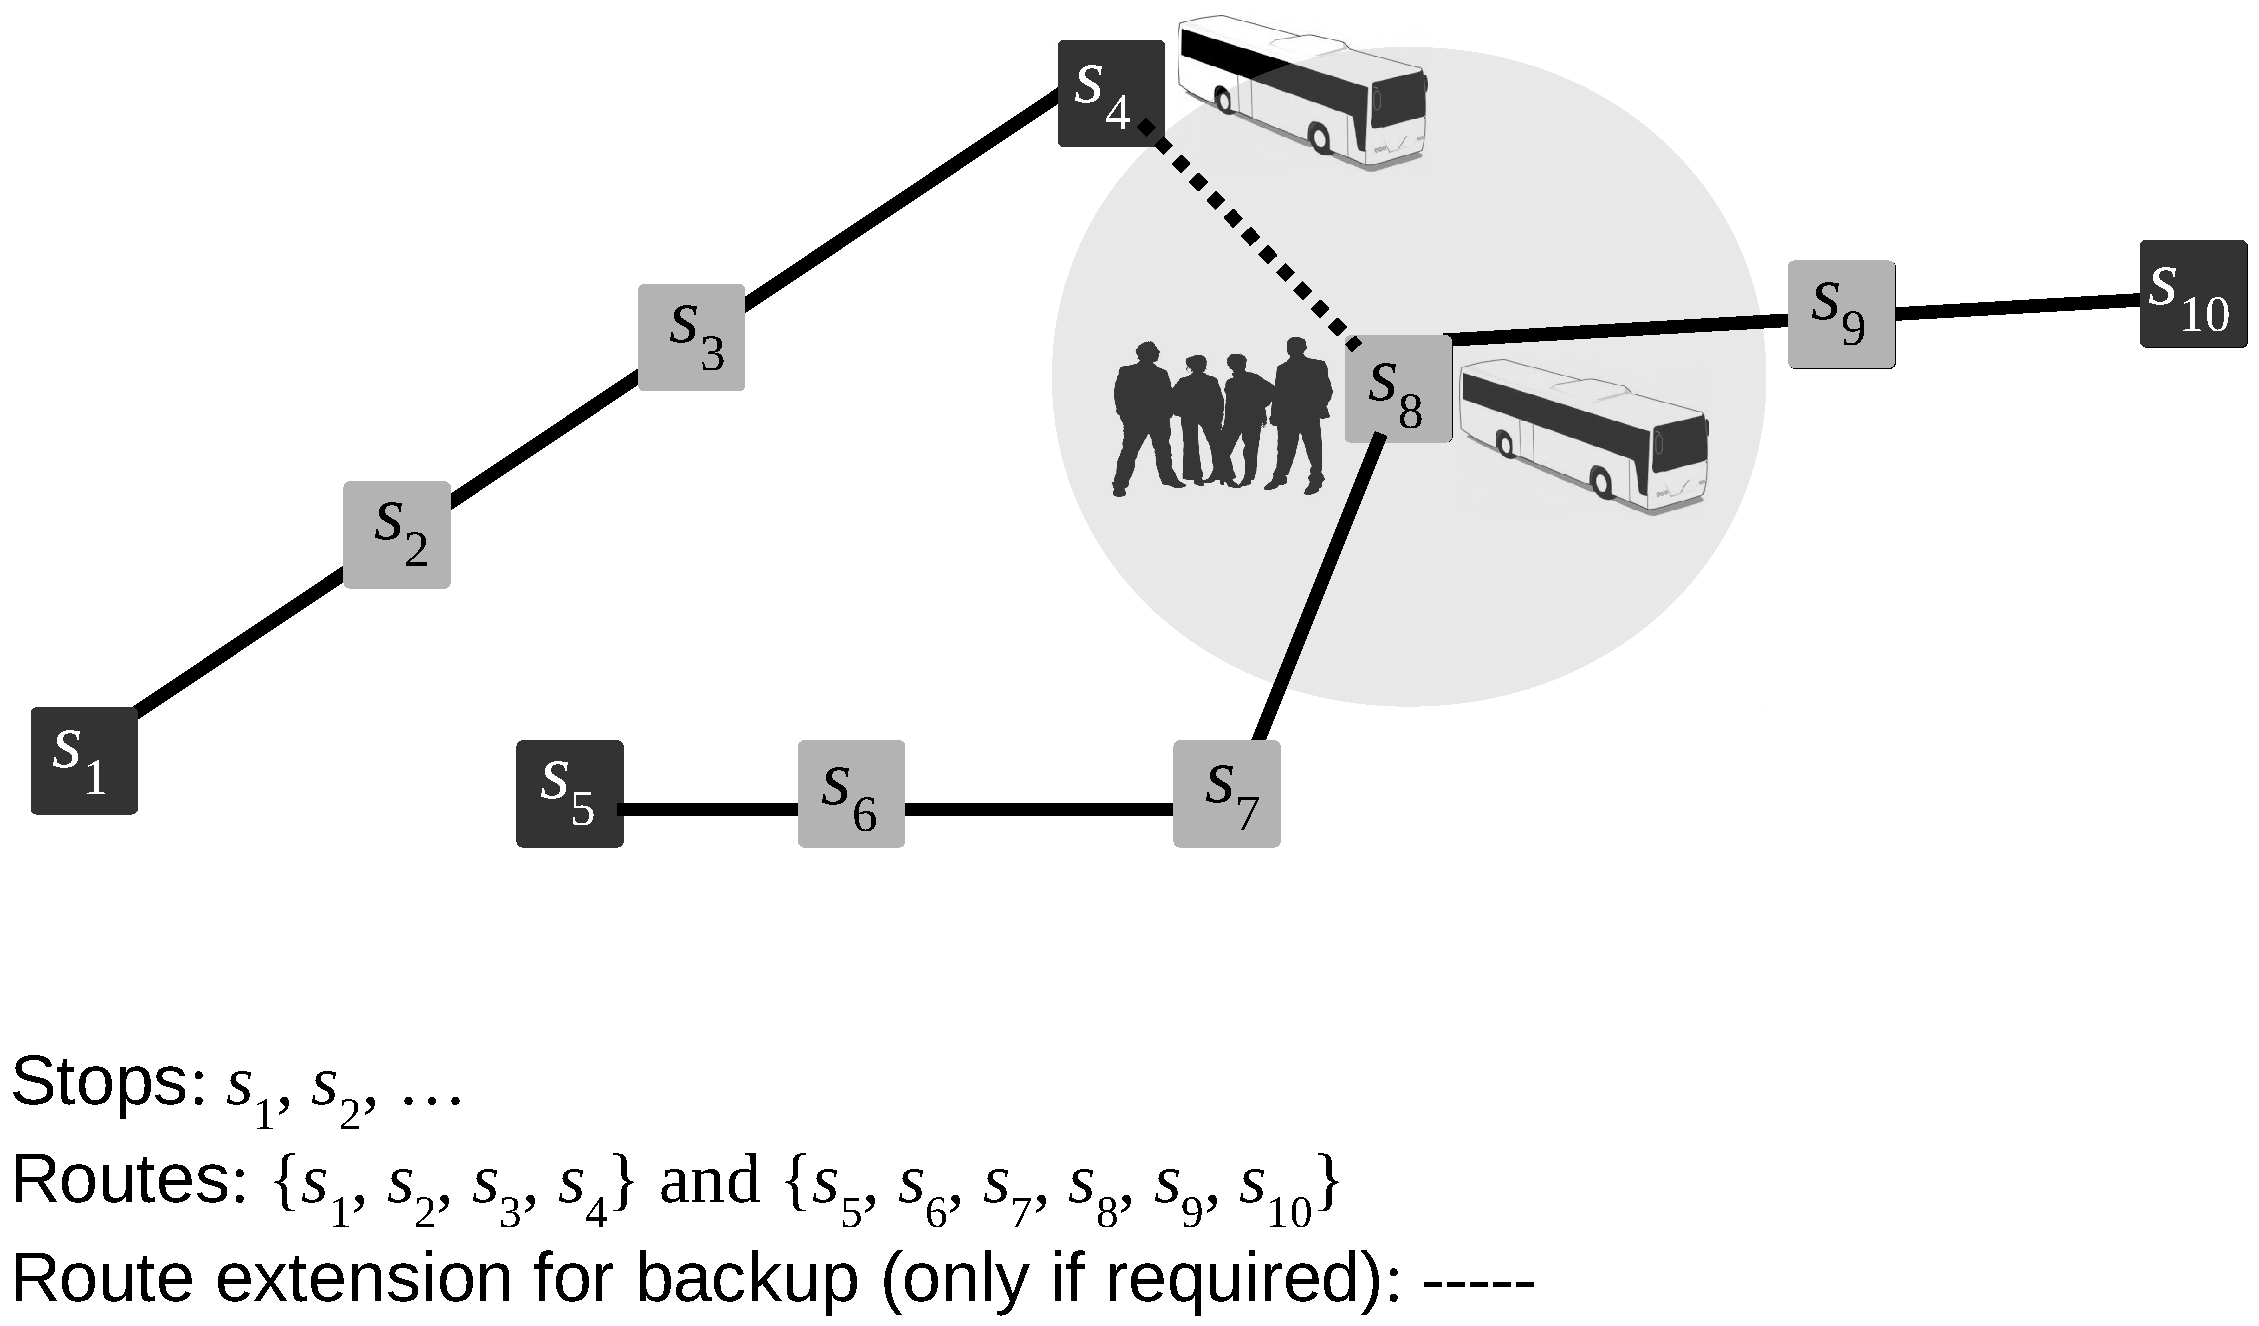
Transportation networks can be enhanced with sensor devices and can start providing smart vehicle routing solutions. In this article, we look into ways of improving transportation networks by planning vehicle routes that include the possibility of reacting to overloading/overcrowding of vehicles at critical stops. This vehicle routing with backup provisioning paradigm is based on the availability of vehicle load information, which can be captured using wireless sensor technologies, as illustrated in Figure 1. It is assumed that vehicles incorporate two passive infrared sensors (PIRs) at each entrance/exit, to sense movement and determine direction, and are able to send such information to a collector node that sends data to a monitoring platform. Such vehicle load information is used to plan routes in such a way that backup can be provided to critical stops, in the case of overcrowding. More specifically, the idea is that a vehicle finishing its journey in the neighborhood of an overcrowded stop could be instructed to pick up the remaining customers, of that overcrowded stop. This, however, requires routes to be planned having this goal in mind. This is illustrated in Figure 2 where two routes r 1 = { s 1 , s 2 , s 3 , s 4 } and r 2 = { s 5 , s 6 , s 7 , s 8 , s 9 , s 10 } are shown. Stop s 8 is considered a critical one that occasionally gets overcrowded, and therefore, routes have been planned so that there is a vehicle finishing its route near, being able to get quickly to s 8 and pick up more customers. That is, instead of finishing its course at stop s 4 , the vehicle of route r 1 could pick up the remaining customers in s 8 , performing the { s 8 , s 9 , s 10 } portion of r 2 . Time for backup to arrive should not exceed a certain time threshold. For clarity:
  • Critical stops are stops where there is a high probability of overcrowding occurrences. Based on the load information collected and stored at the monitoring platform, a manager may classify a stop as critical or not. Such an evaluation may change after some months. That is, planned routes remain unchanged for a long period until the manager decides to re-plan them, which should happen if stops considered to be critical have changed.
  • Backup is provided only if necessary. That is, the fact that vehicle loads change along the day is naturally addressed since backup is activated only in the case of overcrowding. Otherwise, backup is not provided.
  • Schedules are not included in route planning because the problem would become too complex to solve, requiring much extra information (e.g., number of vehicles, drivers and their availability, company serving period, etc.). However, schedules can be easily applied after route planning. The only requirement is that the expected time of arrival of vehicle v 1 , to its final destination, must be approximately equal to the arrival of vehicle v 2 , to the critical stop, for v 1 to be able to provide backup to v 2 (multiple similar schedules throughout the day can be defined). If v 2 is overcrowded, v 1 can go to the critical station because it has finished its route. If no overcrowding is detected, then backup is not required, although routes were prepared for that purpose.
This vehicle routing with backup provisioning paradigm allows sustainable urban mobility with efficient use of resources, since an agile and adaptable fleet with not so large fleet elements and fewer schedules per day can be adopted, while improving the quality of service experienced by users. This is a new paradigm in transportation networks and has been recently proposed by us in [6]. Here, we extend such work as follows: (i) a mathematical formalization of the vehicle routing with the backup provisioning problem is provided; this allows for a better understanding of the problem, giving us clues on how to improve the heuristic approach; (ii) local search procedures are proposed to improve the performance of the heuristic discussed in [6], which uses a greedy strategy when searching for the best solution, possibly getting local optimal solutions (local search procedures intend to overcome this issue); (iii) a monitoring tool, to which data collected from vehicles is forwarded, is presented together with the infrastructure for data collection; this monitoring tool allows relevant data for route computation to be available while serving as a visualization platform.
The remainder of the article is organized as follows. Section 2 presents the state of the art on vehicle route planning and wireless sensor applications. Section 3 discusses the assumed wireless sensor infrastructure and monitoring tool. The problem is discussed in Section 4, and a mathematical formalization is presented. The heuristic algorithm and local search procedures are then presented in Section 5. The results are discussed in Section 6 and Section 7, that latter of which finishes the article with some conclusions.

2. State of the Art

Over the last 50 years, the efficient transportation of goods/persons has been studied, and many papers have been written on variants of these optimization problems. The most well known are the vehicle routing problem (VRP) and the dial-a-ride problem (DARP). In the classical VRP, the concern is to find a set of optimal routes for a fleet of vehicles, based at the depot, to satisfy the demand of geographically-dispersed customers at the minimum total traveling cost, while satisfying vehicle capacities. Many variants of the stated problem exist: time windows, pick up and delivery customers, different vehicles, multiple depots, and so on [7]. In DARP, the goal is to design vehicle routes and schedules for users specifying pick-up and drop-off requests between origins and destinations. A set of minimum cost vehicle routes, capable of accommodating as many users as possible under a set of constraints, will be the output [8].
More recently, a variant of the classical VRP, called the open vehicle routing problem (OVRP), attracted the attention of practitioners and researchers. In this case, vehicles are not required to return to the depot after serving the last customer on a route [9]. This usually arises in real-world problems, like the planning of train services or bus routes (see [10]), or when industries do not own a vehicle fleet or their private fleet is inadequate to fully satisfy customer demand, and distribution services (or part of them) are either entrusted to external contractors or assigned to a hired vehicle fleet. In these cases, vehicles are not required to return to the central depot after their deliveries have been satisfied. The main difference between VRP and OVRP is that in VRP, the routes are Hamiltonian cycles, and in the OVRP, the routes are Hamiltonian paths originated at the depot and ending at one of the customers, so the shortest Hamiltonian path problem with a fixed source node has to be solved for each vehicle in the OVRP. The traveling salesperson problem, known to be NP-hard, consists of finding the Hamiltonian cycle with the lowest cost. This, together with the fact that the Hamiltonian cycle problem (HCP) is NP-hard and can be reduced to the Hamiltonian path problem (HPP) [11], allows us to conclude that the shortest HPP is NP-hard. Consequently, the OVRP is also an NP-hard problem, justifying the development of heuristics and meta-heuristics (see [12], where a new swarm intelligence approach is proposed). The vehicle routing with backup provisioning, under discussion here, can be seen as a variant of the OVRP applied to the transportation of persons, considering multiple depots and having the possibility of backup provision to certain critical stops. Therefore, the vehicle routing with backup provisioning is NP-hard.
Wireless sensors have been used for monitoring and tracking in several areas. With regard to their use in smart cities, these can be used to improve traffic control in large cities [13,14], collect information of passenger volume [15], provide optimal routes in real time [16], to reduce greenhouse gas (GHG) emissions [17], in rescue scenarios after a disaster [18] and even to aid the blind [19]. In [15], the system used for data gathering is discussed, but no further planning using such information is done. Our work on vehicle routing with backup provisioning goes further and uses the gathered data for vehicle route planning. The problem addressed in [16] is different from ours and can be considered more like a dynamic vehicle routing problem (DVRP), which has a wide range of real-world applications, as stated in [20]. In DVRP, real-time communication between vehicles and planners is required, and adjustments of the optimized routes can be performed during the execution process. This kind of problem, however, is not adequate when stops must be previously defined, which is the case that we are studying. The problem addressed in [17] falls into the category of green vehicle routing problems (GVRP), and the objective is to find routes while minimizing GHG emissions. In rescue scenarios, considered in [18], the demand-related information is quite limited in the initial rescue period and is intuitively unpredictable using historical data, and the emergency resources may be insufficient. The problems addressed in [17,18] are, therefore, different from the one considered in this article.
Fleet management applications also exist. In [21], for example, a fleet management system (FMS), using Global System for Mobile (GSM) and General Packet Radio Service (GPRS) was discussed, with the advantage of Global Positioning System (GPS) to track in real time the company fleet. A radio frequency identification (RFID) was one of the techniques used in [22,23] to identify the fleet along with the geographical information system (GIS). Note that our work on vehicle routing with backup provisioning does not require real-time tracking of vehicles since these communicate with the station when stopped.

3. Wireless Sensor Infrastructure and Data Collection

3.1. The Infrastructure

The infrastructure inside vehicles includes a dual PIR implementation at each entrance/exit of the vehicle, as shown in Figure 3. Although a single PIR could be used to count movements, two PIRs are required to avoid counting a person multiple times in situations like walking back or staying in a queue. The role of each PIR is detailed below.
The iSense Security Module is used to capture data inside a vehicle while the Coalesenses Gateway Module is used to forward data to the monitoring tool through the collector node at the station, as shown in Figure 1. That is, a gateway exists per vehicle. The protocol stack implemented at the devices was the IPv6 over Low power Wireless Personal Area Networks (6LoWPAN), allowing for an easier integration of nodes into the Internet and similar management to standard IP-based networks. The gateway is configured to assign IPv6 addresses to all sensor/PIR nodes, and once the nodes receive an IPv6 address, they automatically store the IPv6 address of the gateway allowing them to send their data to the gateway. In order not to assign IP addresses to nodes of nearby vehicles, the IP assignment takes MAC addresses (of nodes inside the same vehicle as the gateway) into consideration. That is, the assignment of IP addresses, done by the gateway, should be restricted to the nodes inside the same vehicle. The area of action of the PIRs was reduced to a narrow beam, more specifically from the default 110 to 20– 30 . This implementation was tested in a single vehicle on our campus, with success. The advantages of the backup provisioning approach need to be verified before installing the equipment in multiple vehicles.
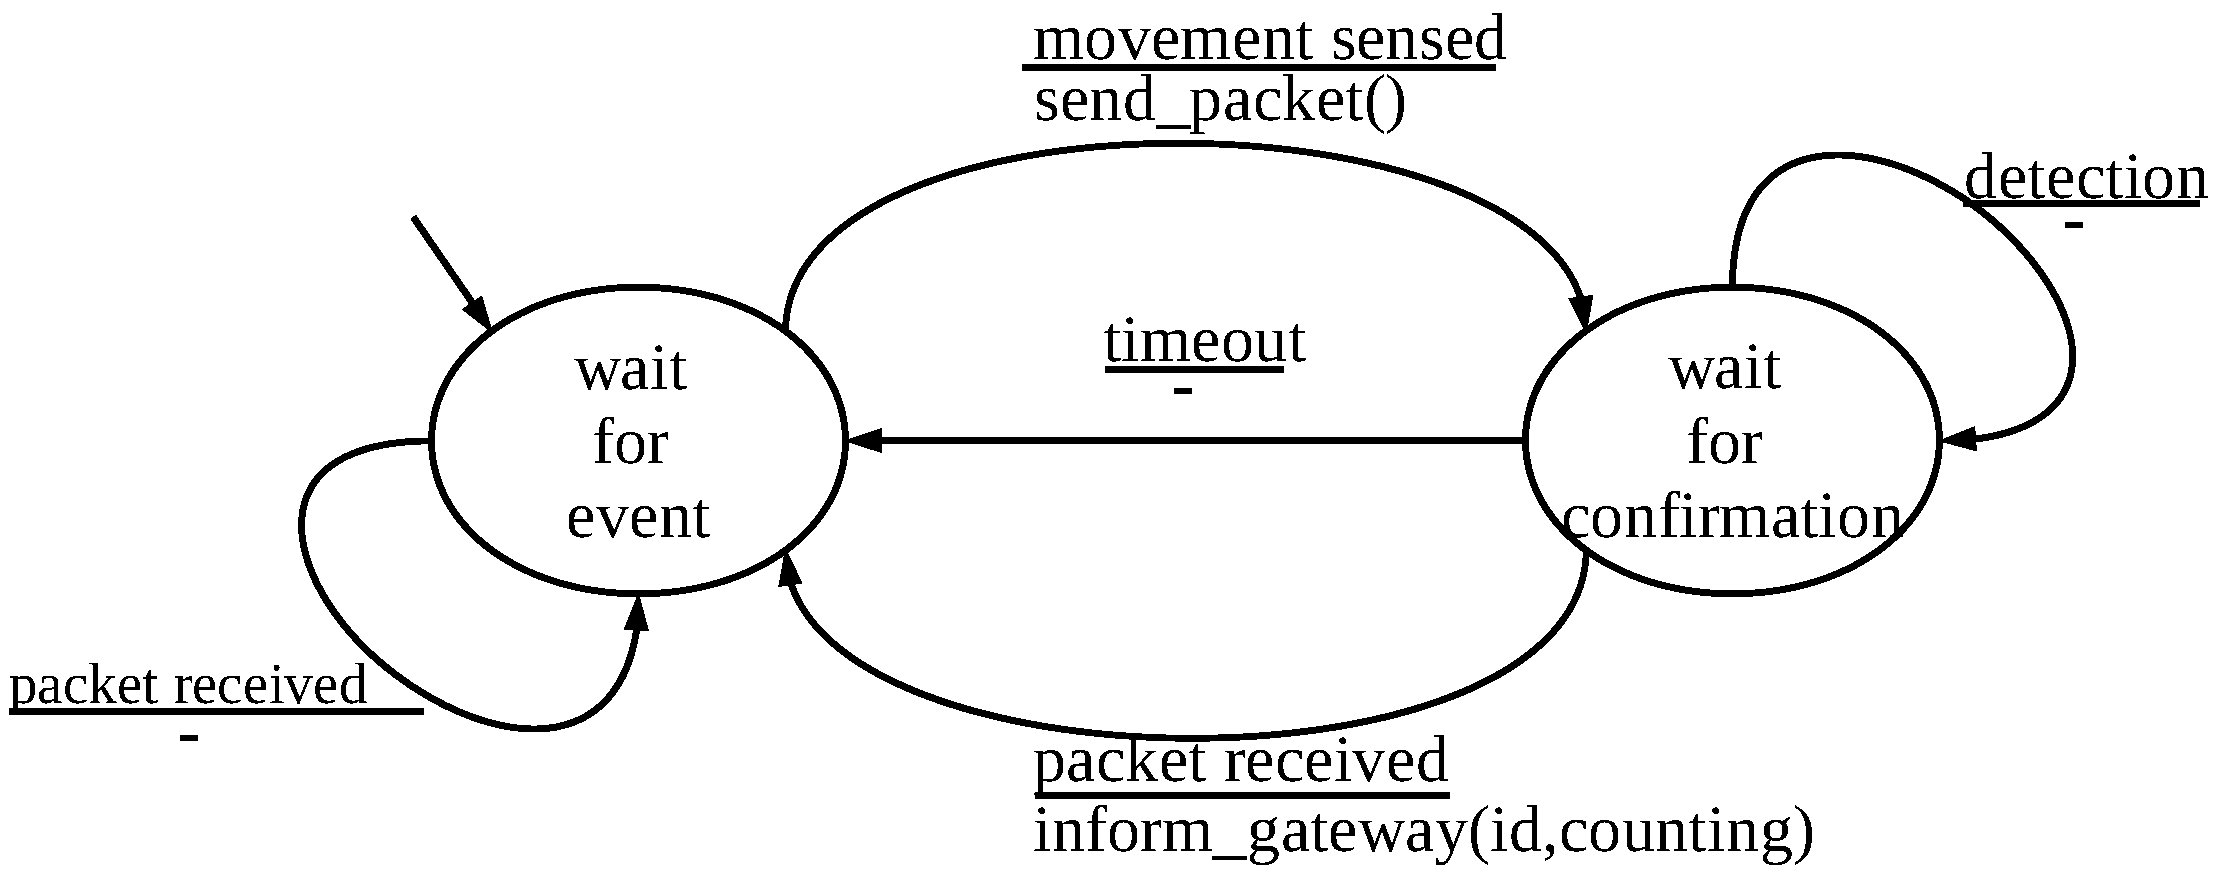
The finite state machine (FSM) diagram of each PIR node is shown in Figure 4. The diagram is the same for both nodes at the entrance or exit. While in the “wait for event” state, node i might sense movement of people, and in this case, a packet is sent to its neighbor j. After sending this packet the node waits for a confirmation from node j. When such confirmation arrives, i j movement information is sent to a collector node for storage, and the node enters the “wait for event” state again. When waiting for confirmation, another detection may occur, and in this case, no action is taken to avoid counting the same person many times. If timeout occurs, meaning that the person probably walked back, also no action is taken, and the node enters the “wait for event” state. While in the “wait for event” state, a node i might receive a packet from its neighbor j (meaning that it has detected movement) asking for a confirmation. Node i remains waiting because a movement must be sensed by i for a packet to be sent to j, which will serve as confirmation to j. Upon receiving such a packet, its neighbor (which is in “wait for confirmation” state) will send a j i movement for storage in the gateway. WiFi communication is used for the gateway to communicate with the collector node.
Regarding the data sent by a PIR node to the gateway inside the bus, they include: (i) PIR identification; (ii) counting. The gateway inside the bus sends the data final results to the collector node at the station only once. This includes: (i) vehicle identification; (ii) total counting.

3.2. The Monitoring Tool

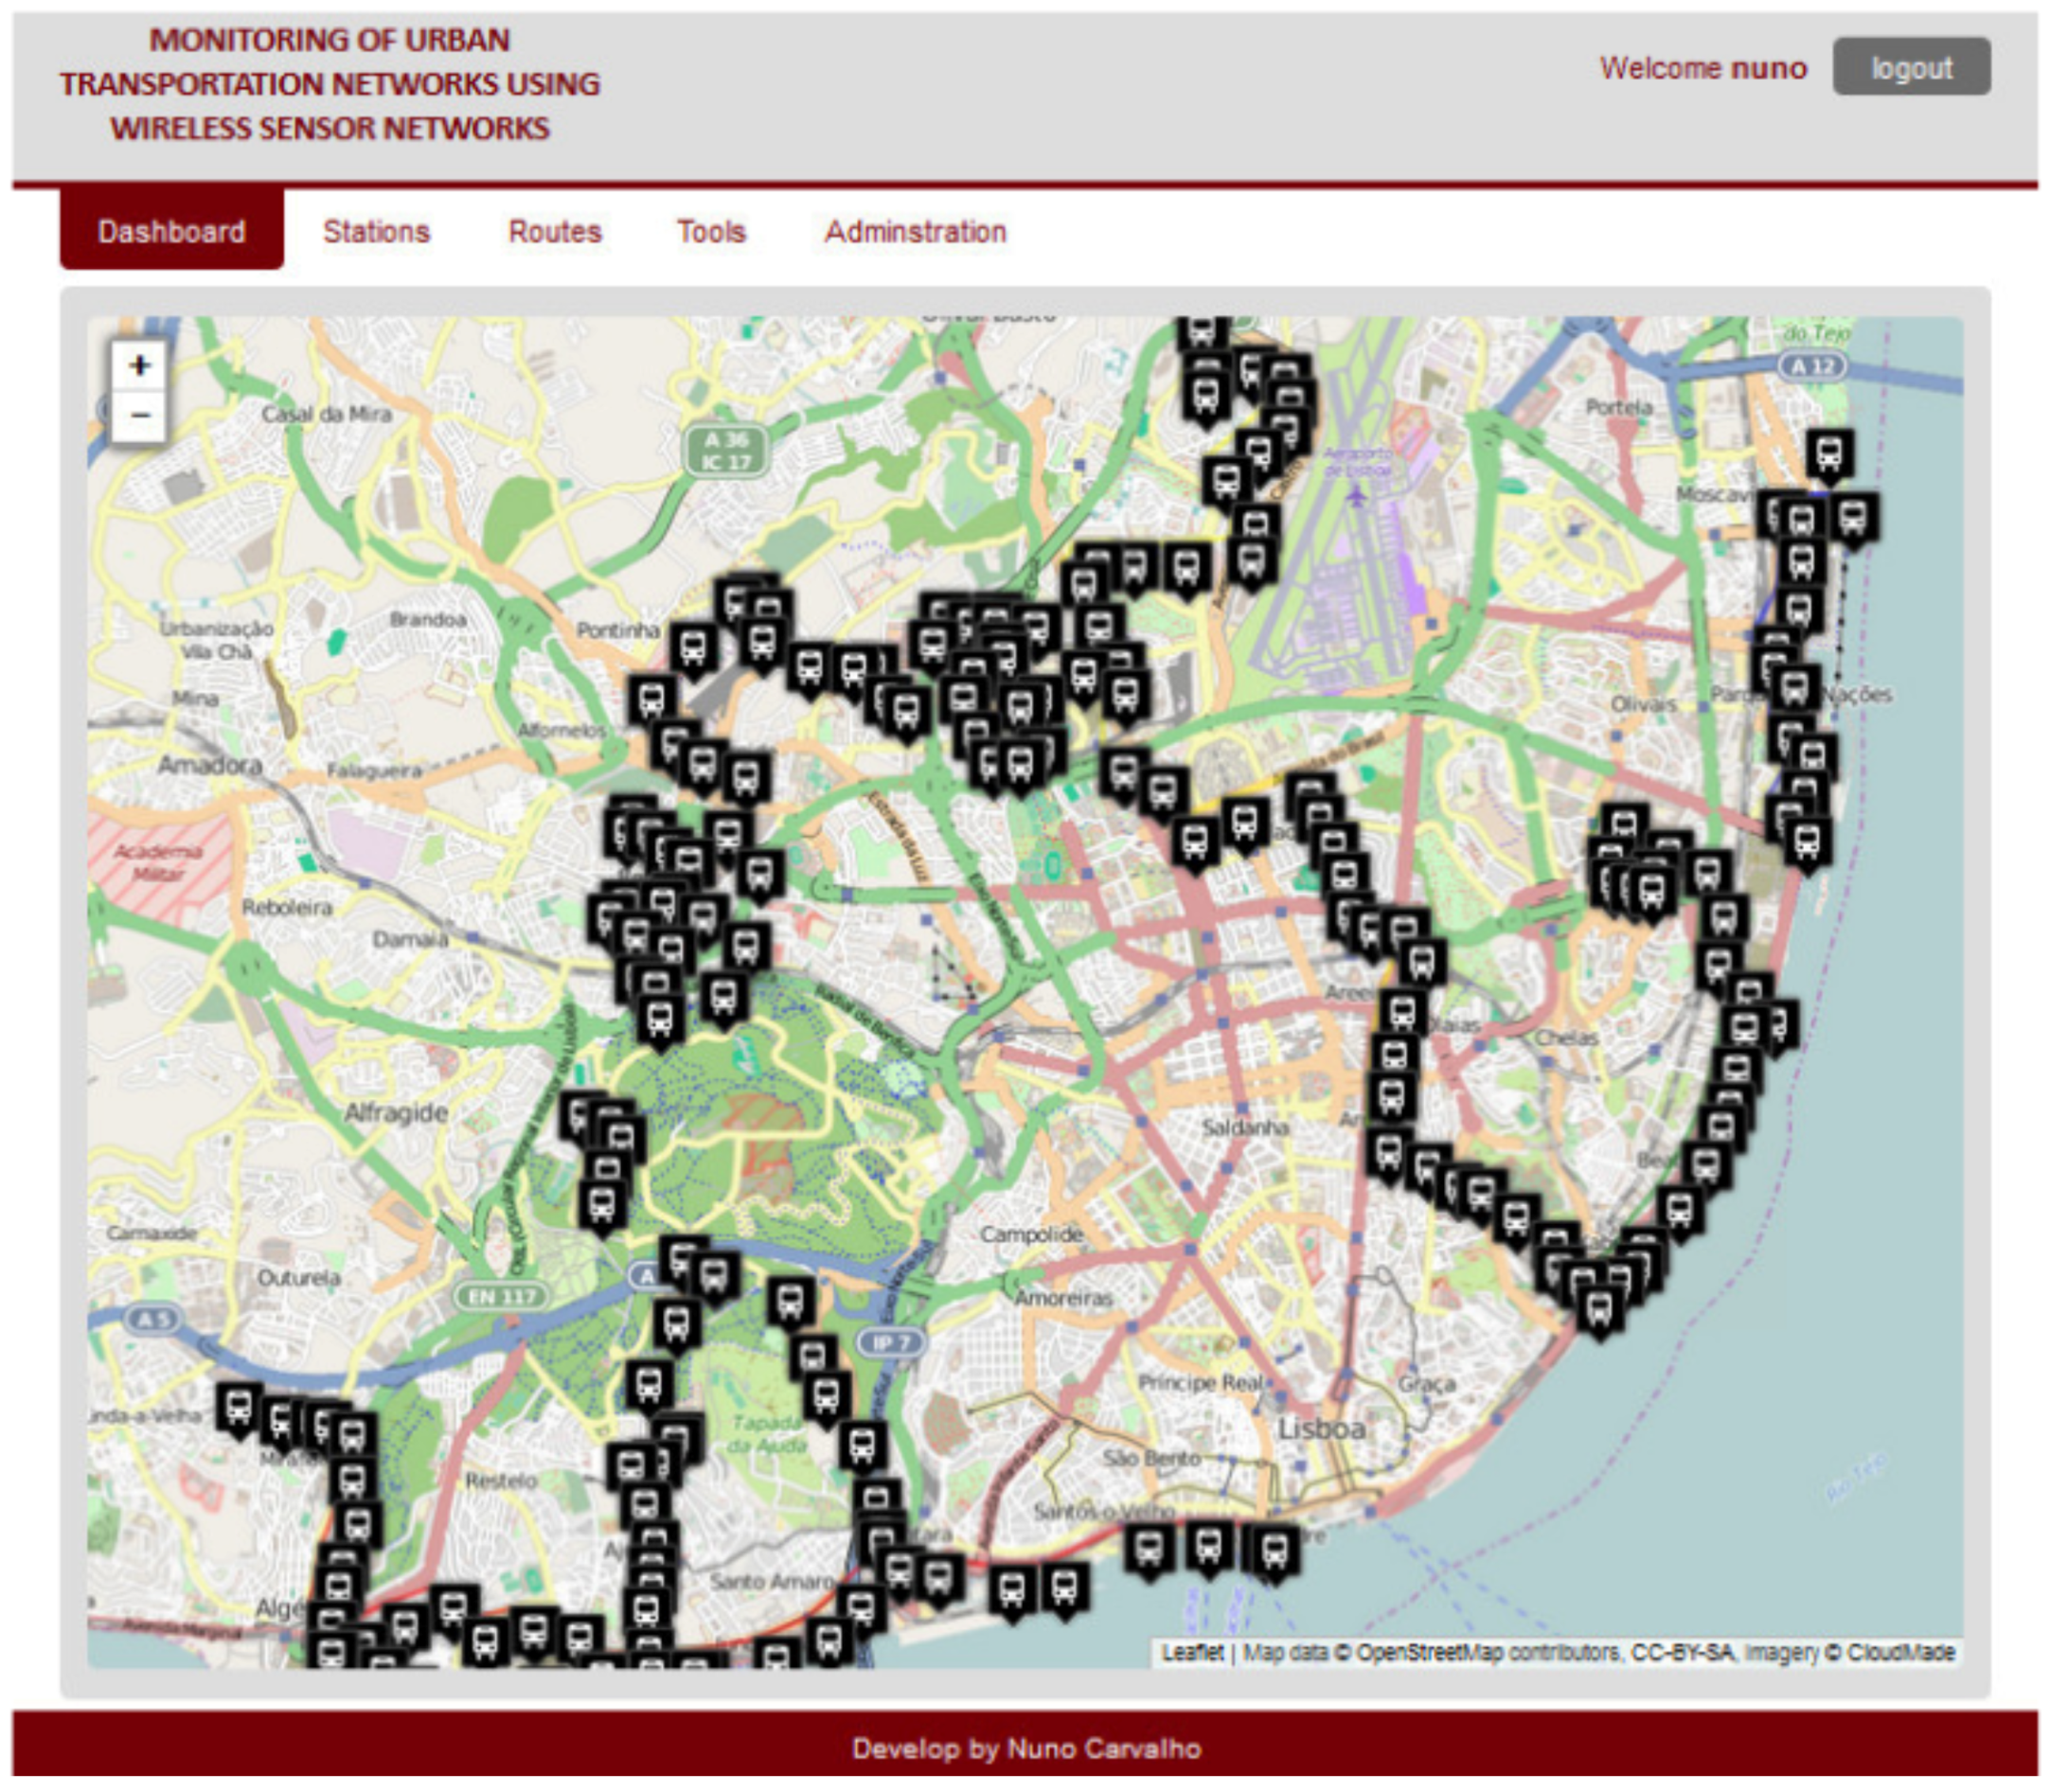
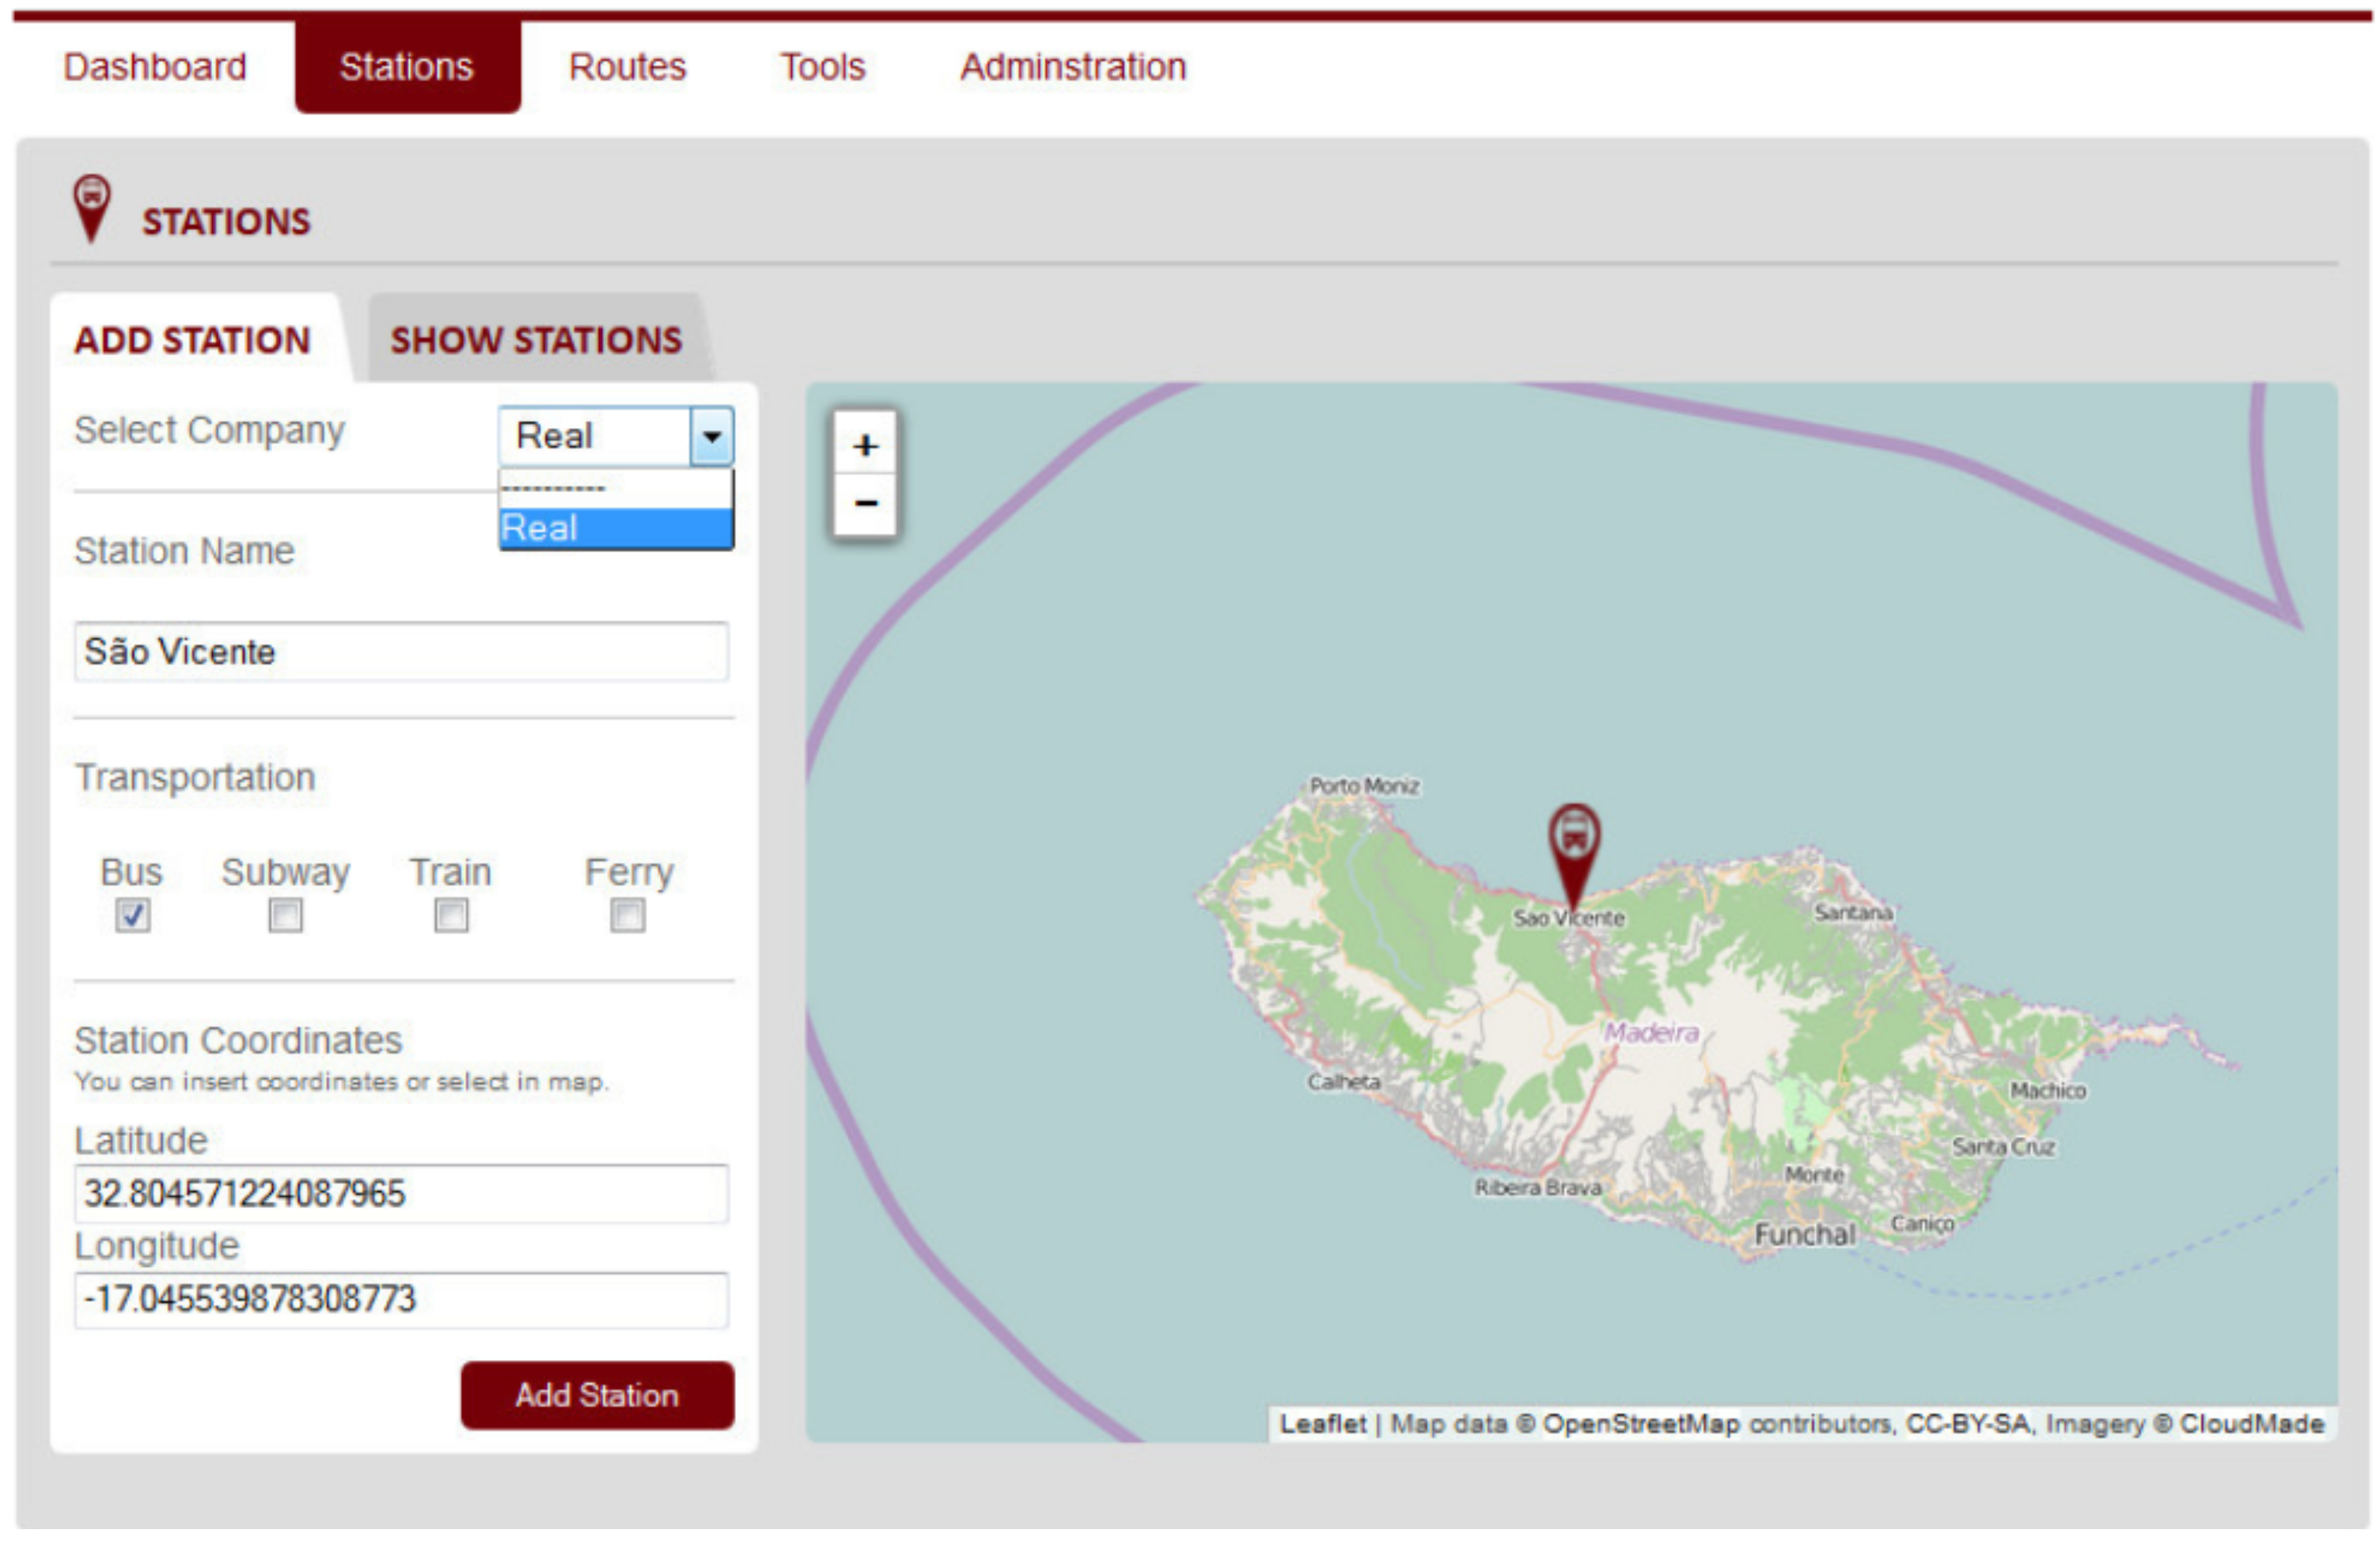
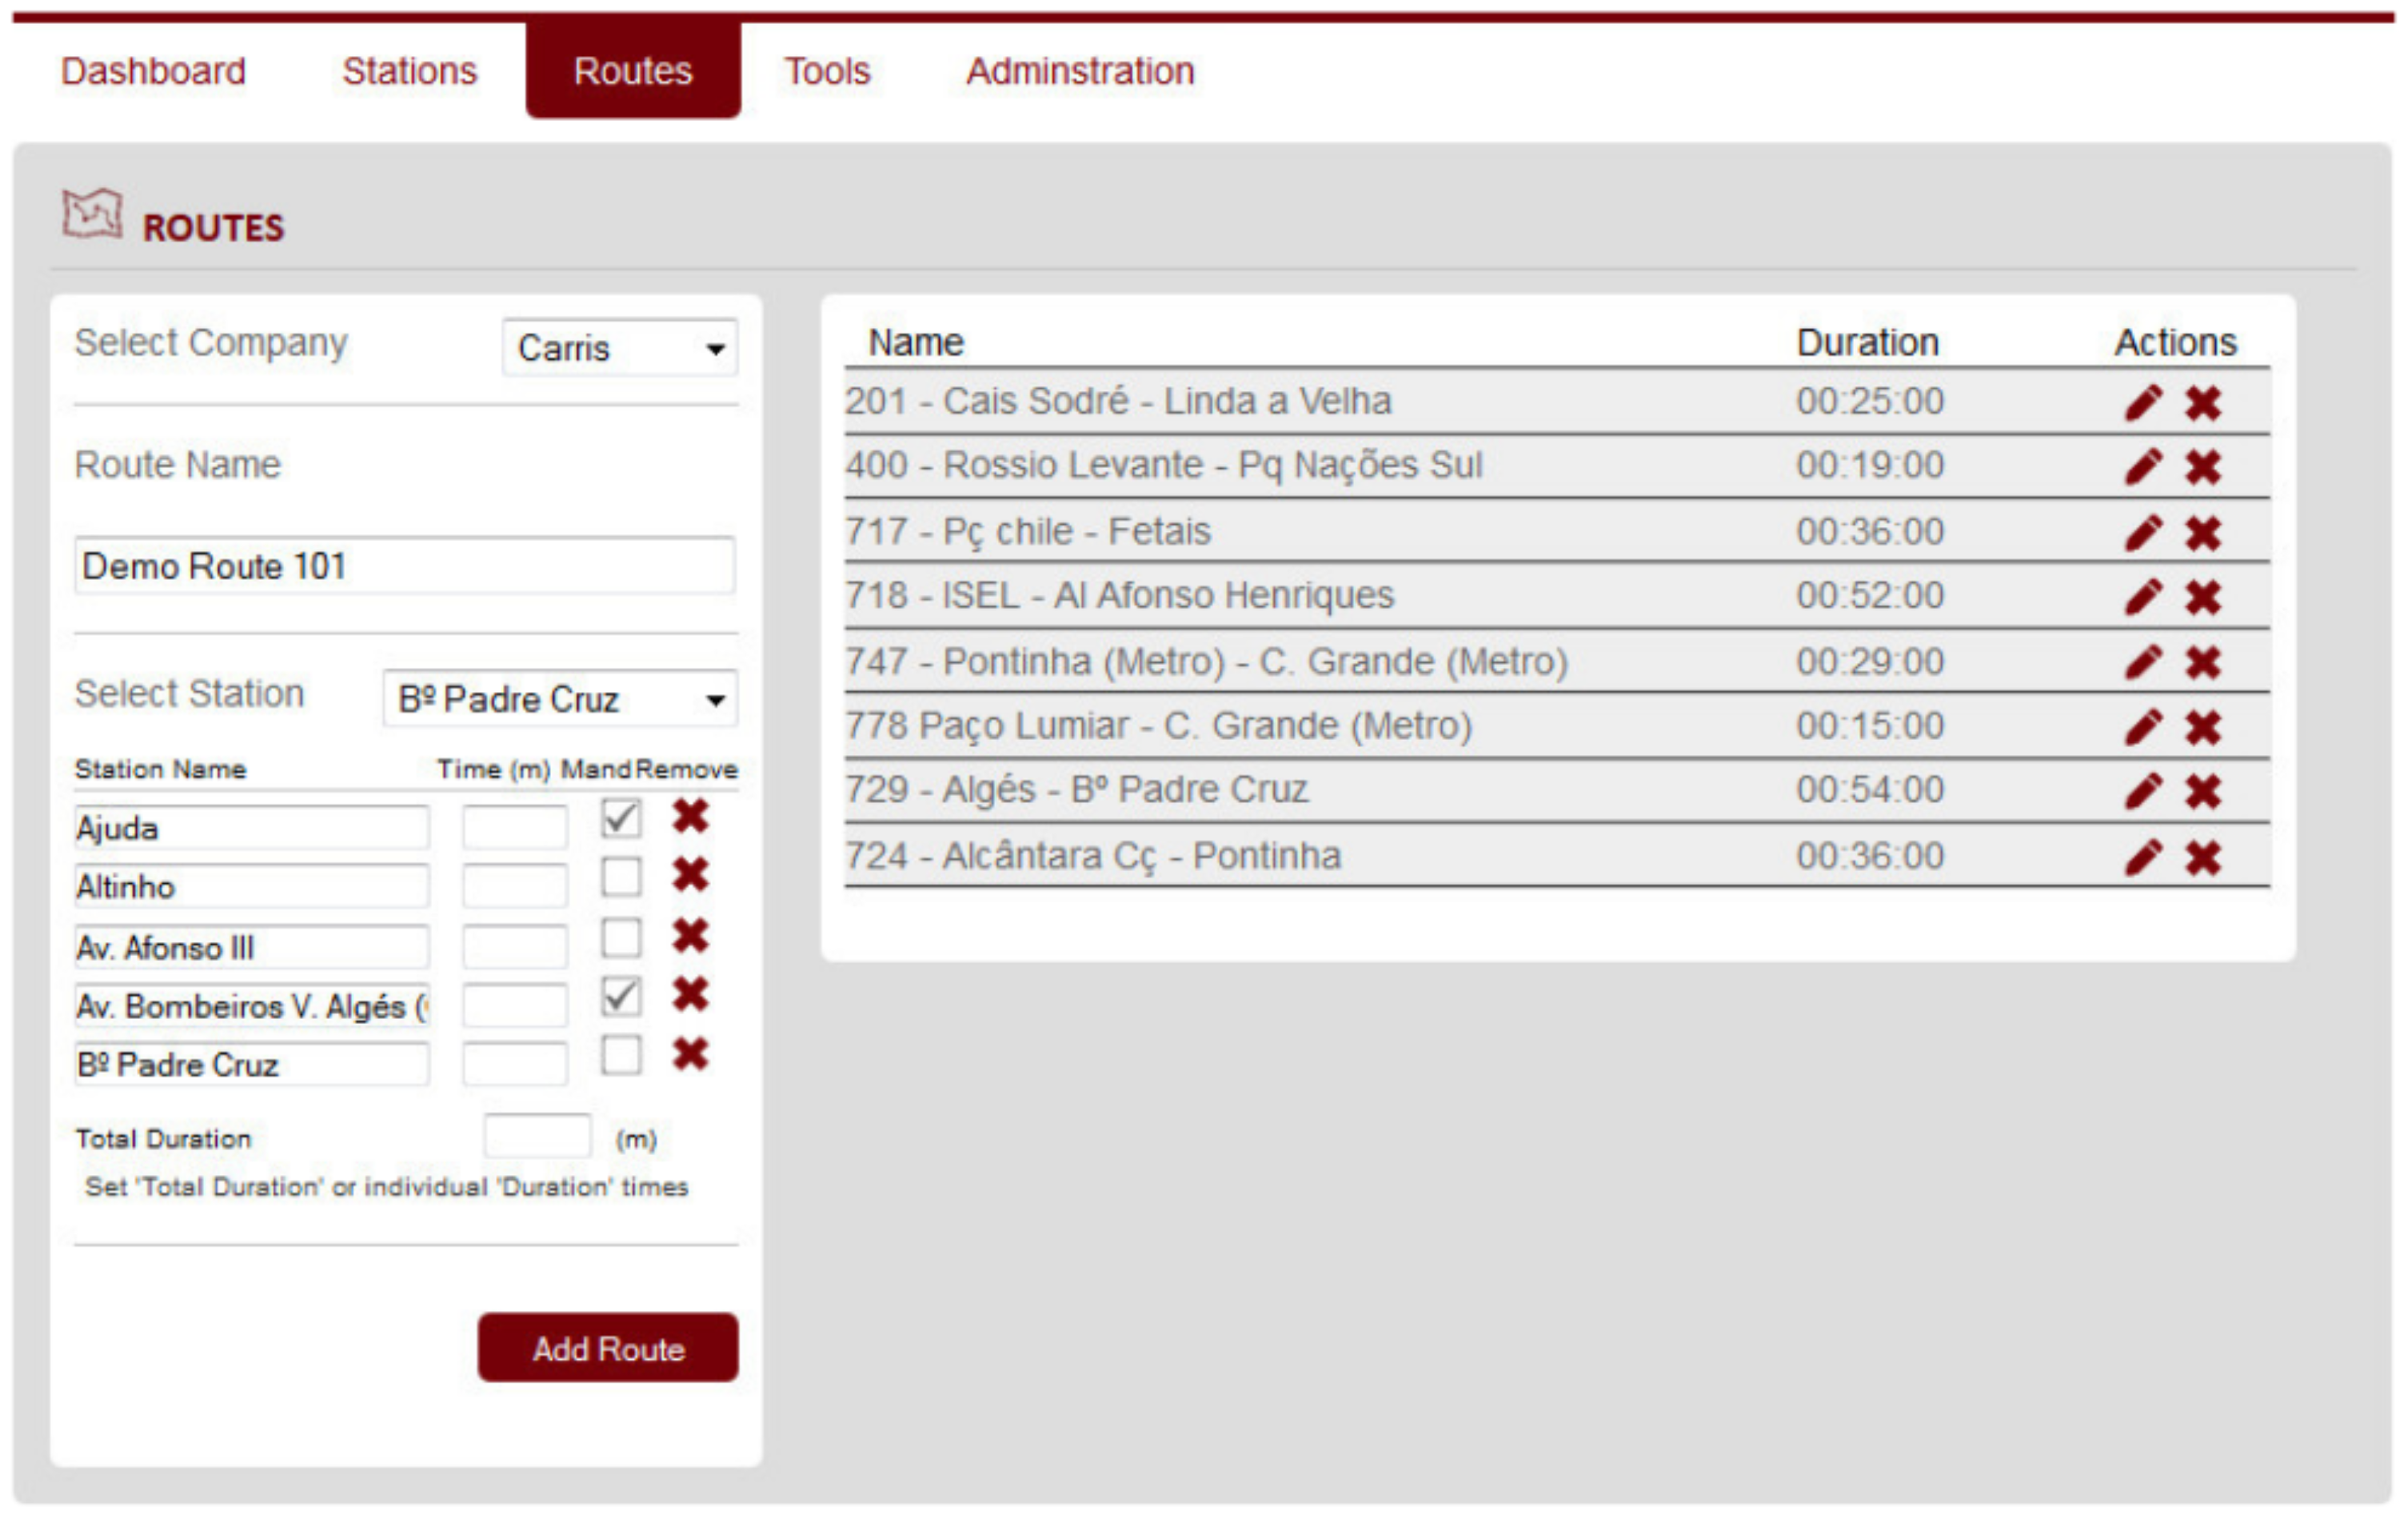
The monitoring tool displayed in Figure 5 is intended to enable the construction/visualization of routes and is connected to a database storing a pool of stations and a set of routes. That is, the monitoring tool allows a pool of stations, each station associated with a company and transportation type, and a set of routes to be stored and visualized (see Figure 6 and Figure 7). Regarding routes, these can be manually inserted by the user or can be the result of heuristic algorithm execution, which is discussed in the following sections. That is, the heuristic algorithm, responsible for finding the vehicle routes with backup provisioning, is to be applied offline by the manager only when he/she wishes to recompute routes (e.g., certain stops with no backup became critical after some months, now requiring backup). The output of the algorithm is used to update the database.
In summary, for the heuristic algorithm to be able to determine the routes with backup provisioning, a pool of stations and a set of unfinished routes must be supplied. Only mandatory stops must be supplied for each route (i.e., starting stop plus any stop forced to be included in the route; the starting stop may be inserted twice if returning back is a requirement). If routes stored at the database include other stations, besides mandatory, such information will not be taken into consideration as this may be the result from a previous algorithm execution or routes have been entered manually. That is, the goal is to recompute routes, and only mandatory stops are considered as input to the heuristic that will populate routes with extra stations from the pool. The monitoring tool allows for the obtained routes to be visualized and changed, if necessary, and is expected to be connected to an infrastructure management tool in the future.

4. Problem Statement

4.1. Notation and Definitions

In the definitions discussed next, R is a given set of routes that must be planned, each route initially having just the source and one or more extra mandatory stops, and S is a given set of stops/locations that must be incorporated into the routes for stops to be visited. A set of critical stops requiring backup, in the case of overcrowding, is given by B S .
Definition 1 (Route).
A route r R can be seen as a path that initially has a set of mandatory stops, M r S . There are at least two mandatory stops: the source or starting point, s r c ( r ) , and another location that might end up being the final destination or not. During route construction, other stops will be inserted into these routes. The final destination d s t ( r ) can be any stop, mandatory or not.
Definition 2 (Mandatory top).
A mandatory stop s M r is a location point that must be visited by the vehicle of route r R . A mandatory stop s has time window info i ( s ) = { s , Δ ( s , s ) } associated with it, which includes the previous mandatory stop s M r , in the route under consideration, and the maximum allowed time from s to s. The extra stops to be inserted in a route, during route construction, cannot violate the time window of mandatory stops.
The i ( s ) = { s , Δ ( s , s ) } pair for a mandatory stop s basically expresses the following: “if the departure from s is done at time Δ s , or after, the arrival at s must be no later than Δ s + Δ ( s , s ) ”. The addition of mandatory stops, with a reference to a previous stop and time window, allows round trips or trips with specific connection points to be planned.
Definition 3 (Stop).
Any stop s S , mandatory or not, is a location point that must be visited by at least one route. A pair of stops ( s i , s j ) has a cost t ( s i , s j ) associated with it that is basically the estimated time when going from s i directly to s j .
Definition 4 (Critical stop).
A stop s is considered a critical stop, s B , if the probability of becoming too crowded is high. Routes should be planned so that a backup vehicle can be sent to a critical stop, for more customers to be collected, whenever the vehicle at stop s gets full.
Definition 5 (Backup).
A backup for a critical stop s B can be supplied by any vehicle that reaches its destination stop, at some place near, and is able to get to s before a specified time threshold T s . That is, the backup for s, denoted by b ( s ) , will be a route, b ( s ) R , whose vehicle will have to make an extra traversal from its destination stop, d s t ( b ( s ) ) , to s in less than T s , the maximum allowed time for backup to arrive at s.
Note that every stop must be visited at least once. A stop may be visited more than once because routes will be built taking backup for critical stops into consideration. That is, it might be necessary to pass through a stop already incorporated in another route in order to ensure backup. However, this is expected to be better than increasing the scheduling and number of vehicles/drivers. A minimum number of stops per route is not imposed since it is assumed that the set of routes to be planned is adequate for the fleet and region covered. Routes with few stops can always be eliminated from the final solution.

4.2. Problem Definition

Having the previous notation and definitions in mind, our route planning problem can be defined as follows. This problem is called here vehicle routing with backup provisioning (VRwBP).
Definition 6 (VRwBP).
Given a set of routes R , each route r R with a reference to a set of mandatory stops M r with time constraints, a set of stops S that need to be visited and a set of critical stops B S requiring backup, inserts stops into routes while ensuring that the total travel time is the lowest possible. Time constraints cannot be violated, and backup, in less than a time threshold T s , must be ensured for every s B .
Please note that routes are to be planned without taking into consideration schedule assignment. After determining the routes, these can be adopted many times a day according to the needs, and, therefore, further schedule/fleet/drivers planning is required. These issues are determinant for the availability of a backup vehicle when overcrowding is detected, as previously stated.

4.3. Problem Mathematical Formalization

We proceed now with the mathematical formalization of the VRwBP problem. This formalization allows us to fully understand the problem, so that adequate local search procedures can be inserted into the heuristic algorithm. Due to the high complexity of the problem, optimal solutions from this formalization cannot be obtained when there is a reasonable number of stops and routes.
In the following formalization, it is assumed that t ( s i , s j ) = if s i = s j . The variables required are:
ξ s i r One if route r R selects stop s i S to become its final destination, d s t ( r ) , zero otherwise.
υ s i , s j r One if route r R includes going directly from stop s i to s j S , zero otherwise.
κ s i r , s When ensuring that the time window associated with mandatory stop s, with time window info Δ ( s , s ) , of route r is not violated, this will be the time value at s i S . Note that to control if a time window is not violated, Δ ( s , s ) is first stored in κ s r , s , will be decreased at nodes traversed and cannot be negative when reaching destination s.
– Objective function:
Minimize r R s i S s j S t ( s i , s j ) × υ s i , s j r
This avoids unnecessary long routes and minimizes the number of extra visits to stops.
– Building routes:
s j S : t ( s i , s j ) υ s i , s j r = 1 , r R , s i = s r c ( r )
s j S : t ( s i , s j ) υ s i , s j r s j S : t ( s j , s i ) υ s j , s i r = ξ s i r , r R , s i S { s r c ( r ) }
s S ξ s r = 1 , r R
The constraints in (2) force routes to emanate from the source s r c ( r ) ; the constraints in (3) impose the flow conservation law to routes; and the constraints in (4) force the existence of a final destination stop at each route.
– Mandatory stops:
s j S : t ( s i , s j ) υ s i , s j r + s j S : t ( s j , s i ) υ s j , s i r 1 , r R , s i M r
Constraints (5) force the vehicle of a route r to arrive/depart at/from every mandatory stop of that route.
– Ensuring backup:
m i n r R { s j S ξ s j r × t ( s j , s i ) } T s i , s i B
where T s i is a threshold for the maximum allowed time for backup to arrive to s i . Constraints (6) may be expanded to a set of linear expressions.
– Visited times:
r R s j S : t ( s i , s j ) υ s i , s j r + r R s j S : t ( s j , s i ) υ s j , s i r 1 , s i S
Constraints (7) state that every stop must be visited at least once.
– Time windows of mandatory stops:
κ s r , s = Δ ( s , s ) , r R , s M r s s r c ( r ) , { s , Δ ( s , s ) } s M r
κ s i r , s t ( s i , s j ) + K × ( 1 υ s i , s j r ) κ s j r , s , r R , s M r , s i , s j S
κ s r , s 0 , r R , s M r
where K is a big time constant. These constraints ensure that the time windows associated with mandatory stops, i.e., the maximum allowed time from the previous mandatory stop, are not violated. For this purpose, considering a route r and mandatory stop s with time window { s , Δ ( s , s ) } , the stop s is assumed to have a Δ ( s , s ) time in it that will vanish as the route is traversed toward s. This is what Constraints (8)–(9) do. At the mandatory stop, such time must be non-negative (Expression (10)).
– Non-negative assignments:
κ s i r , s R ; υ s i , s j r , ξ s i r { 0 , 1 } .
As previously said, this problem can be seen as a variant of the OVRP applied to the transportation of persons, considering multiple depots and having the possibility of backup provisioning to certain stops considered to be critical. Therefore, our problem is also NP-hard. For this reason, the development of an efficient heuristic approach is needful.

5. Heuristic Approach

The heuristic approach discussed in this section has three main steps:
  • Building route framework: Here, the concern is to build the basis framework for route construction, where all stops are visited only once while not violating time window constraints.
  • Extension for backup inclusion: After the basis framework, routes are extended for backup provisioning to be ensured.
  • Applying local search procedures: Inter- and intra-route exchanges of non-mandatory stops are applied for the improvement of the solution.
The first two steps of this heuristic algorithm use a greedy strategy, and therefore, local optimal solutions can be obtained. The third step uses local search procedures to overcome this issue and improve the quality of the solutions initially obtained.

5.1. Building Route Framework

To evaluate the possibility of inserting stops in specific routes, neighborhood information around stops is built. Neighborhood information is associated with consecutive pairs of mandatory stops, to evaluate the possibility of inserting a stop between them. Therefore, the following variables are required when building the route framework:
η ( s i , s j ) r Neighborhood for the pair of consecutive mandatory stops s i and s j M r of route r R . Used to evaluate the possibility of inserting a stop between s i and s j .
ω ( s i , s j ) r Cost of inserting a specific stop between the pair of stops s i and s j of route r R . Used when building neighborhoods.
θ Specific subset of all of the neighborhoods.
Each neighborhood element in η ( s i , s j ) r is a ( s k , φ ) pair, where s k is a potential extra stop and φ the time margin left if s k is inserted. The output will be:
L r List of stops for each route r R .
d s t ( r ) Destination stop for each route r R .
Building the route framework includes inserting mandatory stops first and then non-mandatory. These two sub-steps are discussed next.

5.1.1. Inserting Mandatory Stops

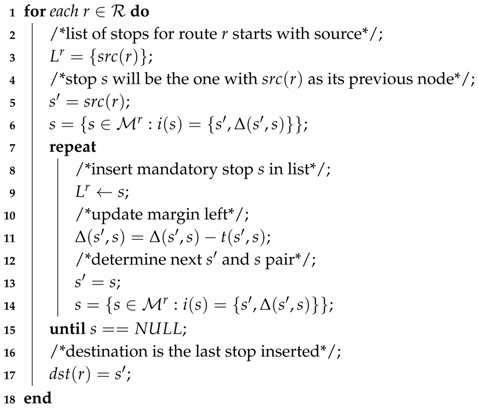
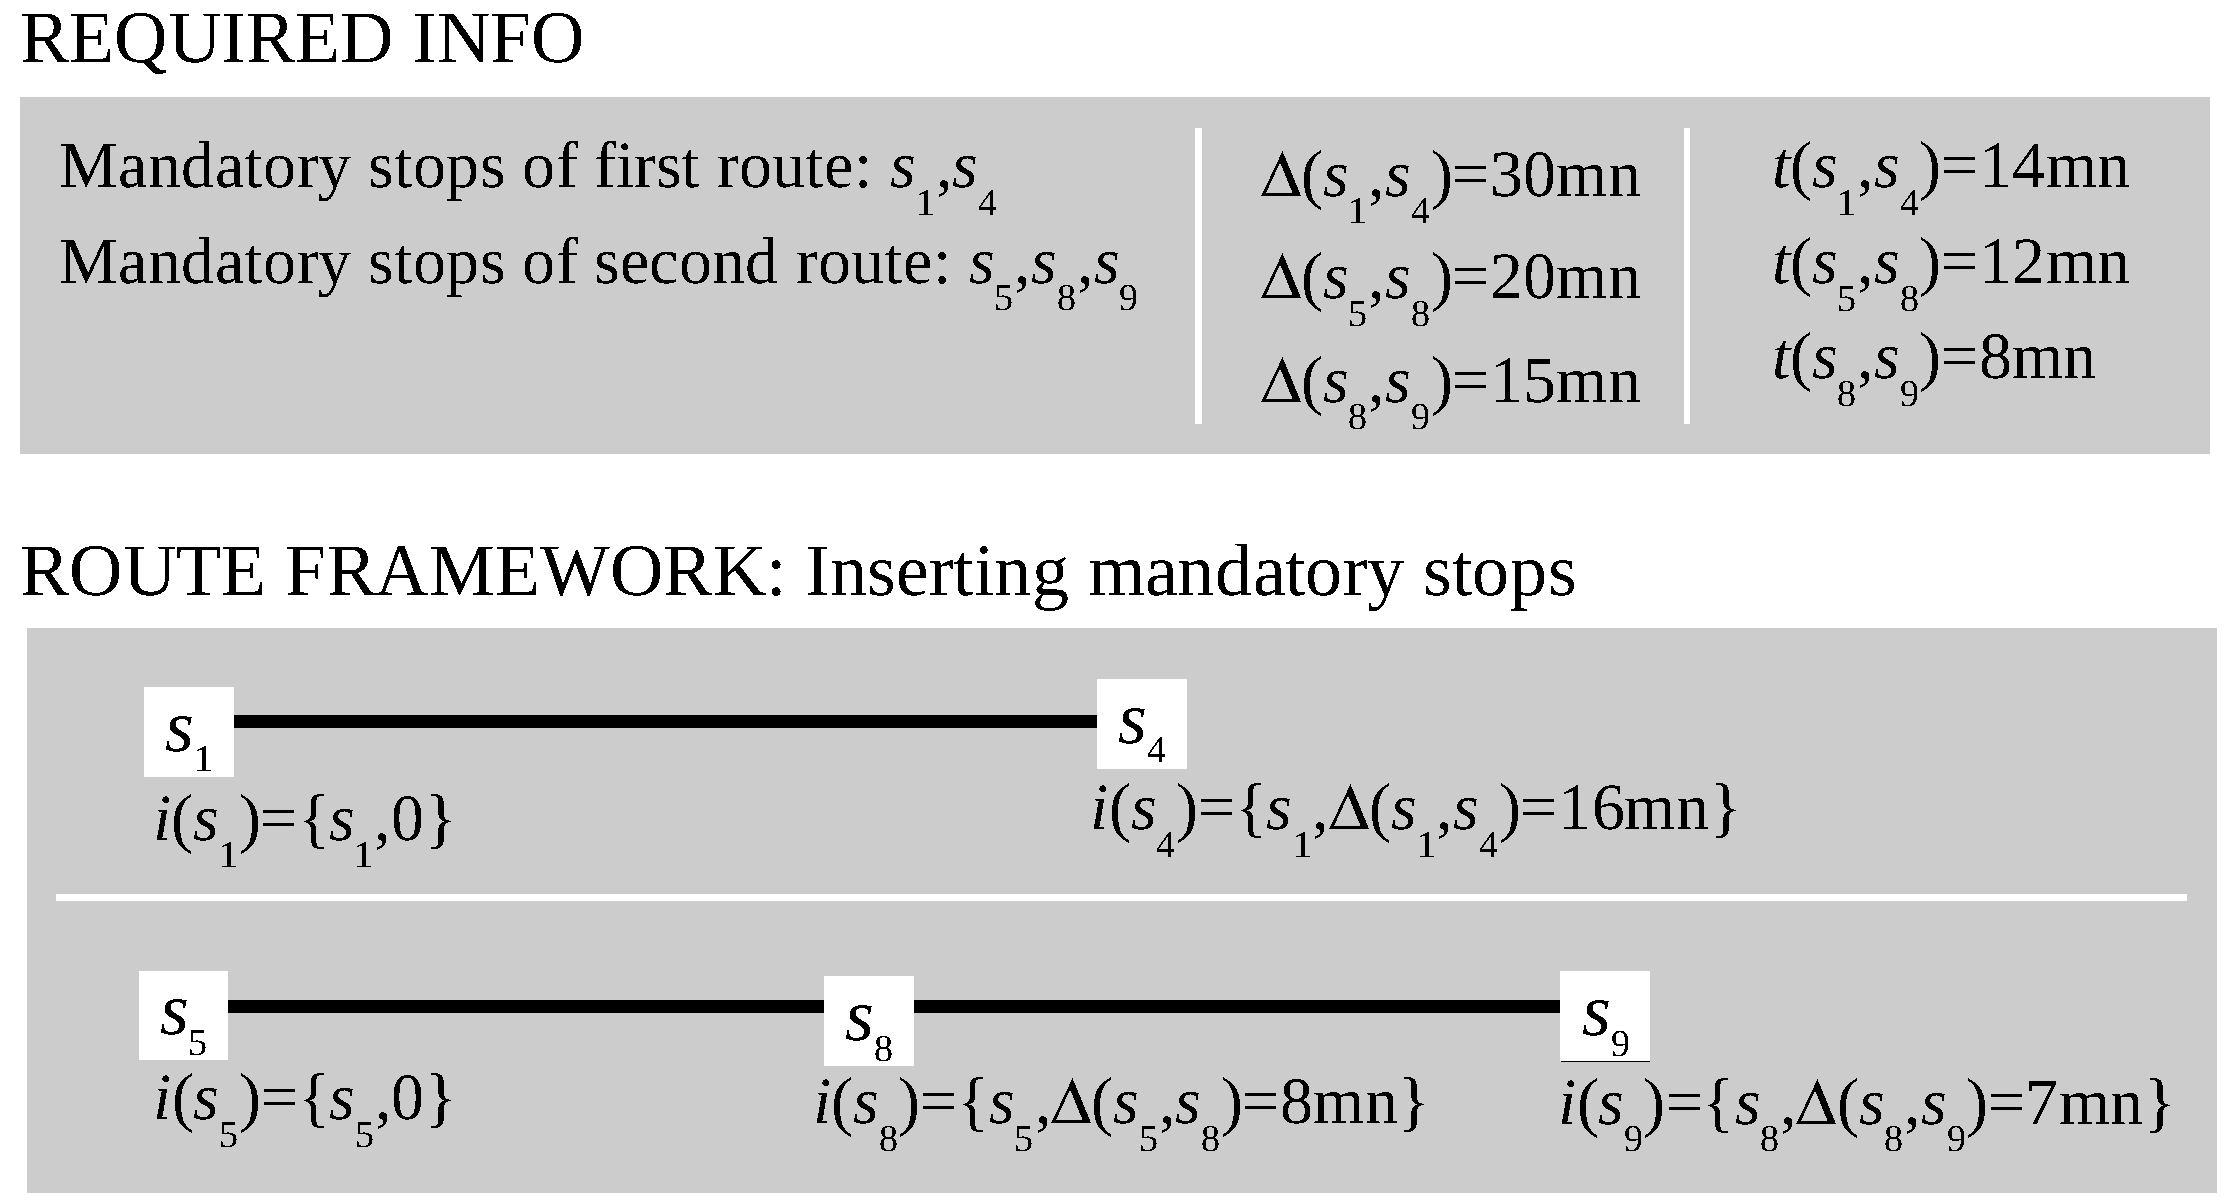
Remember that a mandatory stop s, of a route r R , has info i ( s ) = { s , Δ ( s , s ) } referring to its previous mandatory node on the route, s , and maximum allowed time from s to s, Δ ( s , s ) . The insertion of mandatory stops is done as shown in Algorithm 1.
Algorithm 1: Procedure for the insertion of mandatory stops.
Information 08 00094 i001
Note that the initially given Δ ( s , s ) , included in mandatory stop info i ( s ) = { s , Δ ( s , s ) } , will change when stops are permanently inserted into routes. In the procedure just discussed, t ( s , s ) is subtracted from Δ ( s , s ) when mandatory stop s is inserted after s , so that it stores the time margin left for further insertion of stops. Figure 8 illustrates this info update considering that two routes are starting to be built, the first one having mandatory stops s 1 and s 4 and the second one having mandatory stops s 5 , s 8 and s 9 . The remaining stops, not shown in the figure, would be inserted in the routes by the next steps of the algorithm.

5.1.2. Inserting Non-Mandatory Stops

Here, the neighborhoods are built first, and then, non-mandatory stops are inserted based on this information. At the end of this procedure, the stops not inserted in any route will be attached at the end of routes.
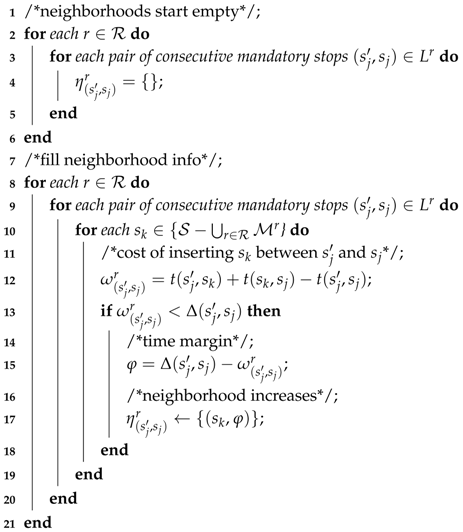
– Neighborhood formation: Neighborhood info is built for each pair of consecutive mandatory stops. The procedure used to build neighborhoods is shown in Algorithm 2.
Algorithm 2: Procedure for neighborhood formation.
Information 08 00094 i002
A non-mandatory stop s k is inserted in the neighborhood of a pair of mandatory stops, s j and s j , whenever the cost of insertion, extra route time, is lower than the time margin at Δ ( s j , s j ) . In this case, a neighborhood element ( s k , φ ) , with stop and time margin left, will be inserted into the neighborhood.
– Insertion of stops using neighborhood info: The stops in less neighborhoods will be processed first. A specific stop will be inserted in the neighborhood leaving the largest time margin. The procedure used to insert stops using neighborhood info is shown in Algorithm 3.
Algorithm 3: Procedure for the insertion of stops using neighborhood info.
Information 08 00094 i003
In Line 1, the θ will have the set of neighborhood elements containing s k , and therefore, the stops in less neighborhoods will be processed first. In Line 3 the pair of consecutive stops in L r where s k should be inserted, the one leaving the largest margin, is chosen. If insertion is possible (the time window of next mandatory stop is not violated), the stop s k is inserted in L r , and the time window of the mandatory stop is updated.
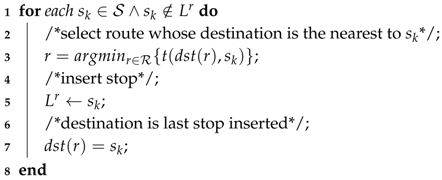
– Remaining stops: Stops not inserted at previous steps will be inserted at the end of current routes. The procedure used to insert the remaining stops is shown in Algorithm 4.
Algorithm 4: Procedure for the insertion of the remaining stops.
Information 08 00094 i004

5.2. Extension for Backup Inclusion

When extending routes for backup provisioning, the following variables are required:
δ Time it takes for backup to arrive at s B .
ϑ List of stops resulting from a shortest path calculation.
The output will be:
b ( s ) Backup for stop s B .
L r Final list of stops for every route r R , after extending.
d s t ( r ) Final destinations for every route r R , after extending.
The procedure in Algorithm 5 is used to extend the route framework in order to incorporate backup provisioning.
Algorithm 5: Procedure to extend the route framework and incorporate backup provisioning.
Information 08 00094 i005
The T s value is the maximum allowed time for backup to arrive at s, as mentioned in Section 4.1. Lines 5–12 determine the best route to provide backup to a critical stop. If the time from the destination of such a route is still higher than threshold T s , then the route is extended (Lines 14–18) until the threshold is accomplished.

5.3. Applying Local Search Procedures

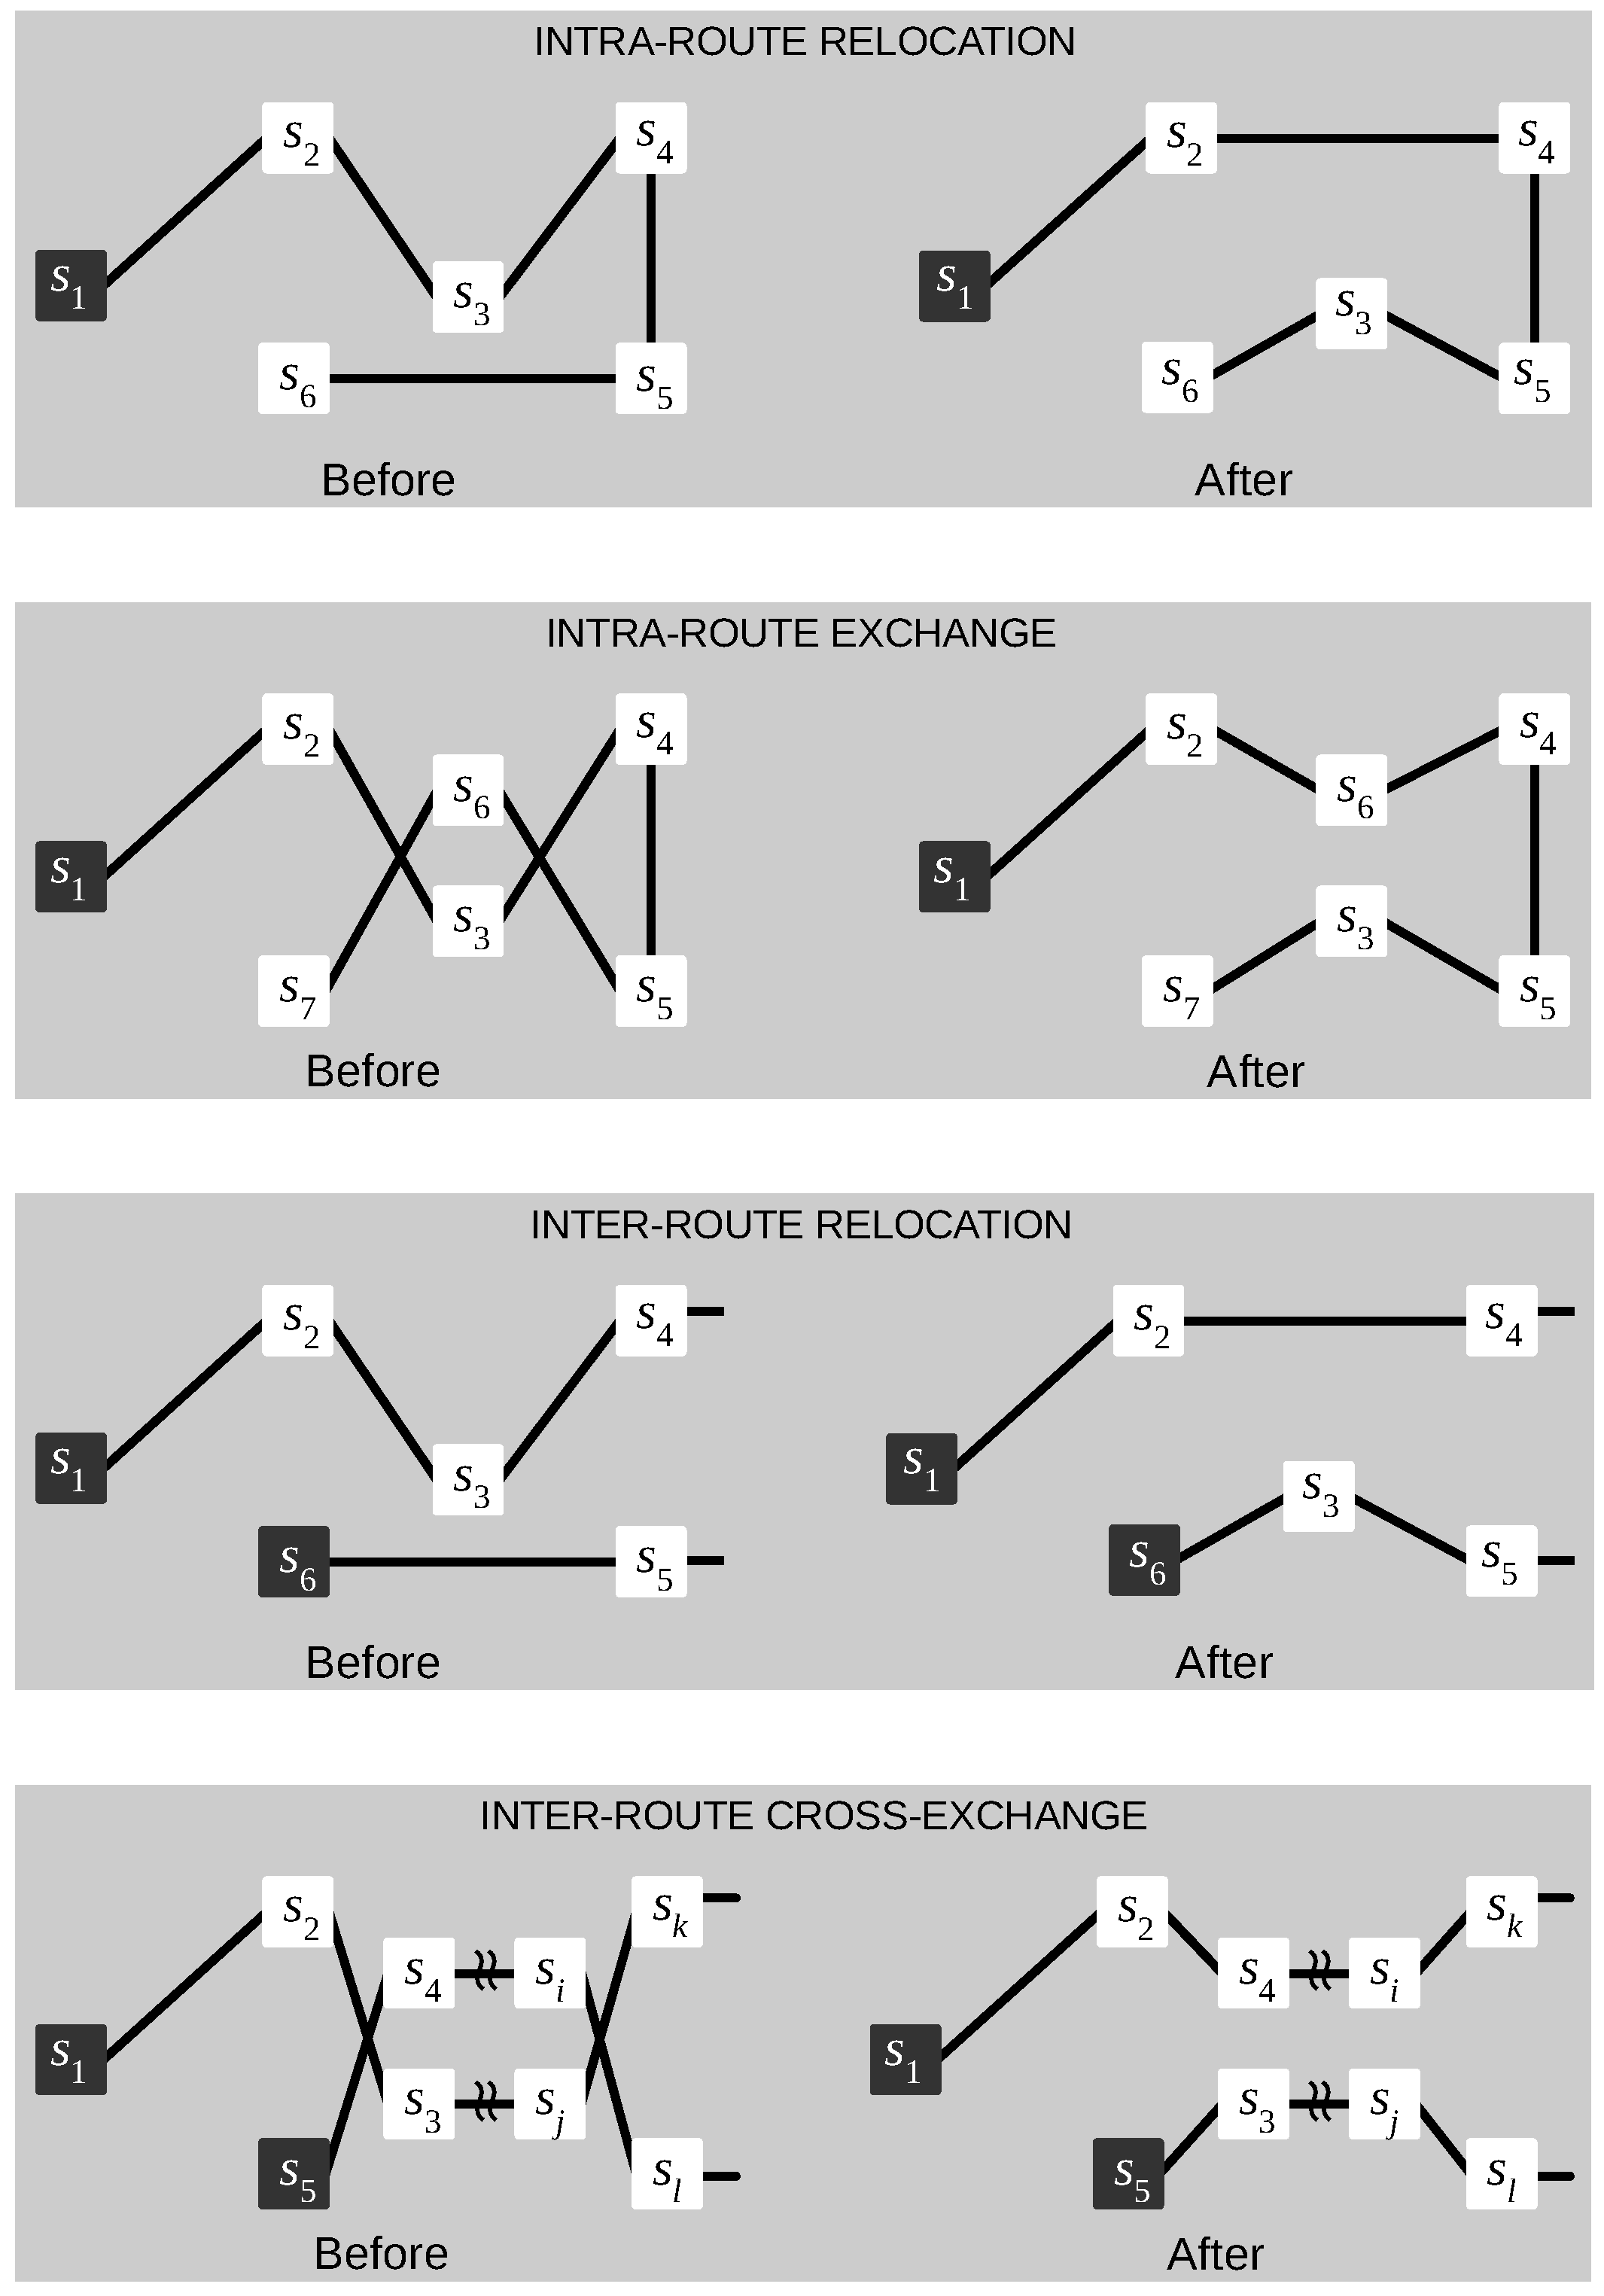
After the routes have been constructed, the following local search procedures are executed. These include intra- and inter-route relocations and exchanges as proposed in [24], but these were adapted to our VRwBP-specific problem.

5.3.1. Intra-Route Relocation

A stop may change its position inside its route. This is illustrated in Figure 9, where route r has changed from r = { s 1 , s 2 , s 3 , s 4 , s 5 , s 6 } to r = { s 1 , s 2 , s 4 , s 5 , s 3 , s 6 } due to the move of stop s 3 . The criteria to select the stop to be moved at each route were the following. Considering a specific route r R , the non-mandatory stop s with the longest distance from its predecessor and successor is picked (stop with high potential for distance reduction). If a better feasible solution is obtained by moving this stop to another place, then removal and relocation occurs. The new place should be the one with the shortest distance from s to the new predecessor and successor stops.

5.3.2. Intra-Route Exchange

A stop may switch its position with another stop, both in the same route. This is illustrated in Figure 9, where route r has changed from r = { s 1 , s 2 , s 3 , s 4 , s 5 , s 6 , s 7 } to r = { s 1 , s 2 , s 6 , s 4 , s 5 , s 3 , s 7 } because stops s 3 and s 6 have switched their position on the route. The criteria to select the stops to be switched was the following. Considering a specific route r R , two non-mandatory stop s i and s j , not between the same pair of mandatory stops, with the shortest distance between them are picked (closer stops are more prone to be shuffled when routes are being built). If a better feasible solution is obtained by switching these stops, then removal and relocation occurs.

5.3.3. Inter-Route Relocation

A stop may be moved to another route. This is illustrated in Figure 9 where routes r 1 and r 2 changed from r 1 = { s 1 , s 2 , s 3 , s 4 , } and r 2 = { s 6 , s 5 , } to r 1 = { s 1 , s 2 , s 4 , } and r 2 = { s 6 , s 3 , s 5 , } due to the move of stop s 3 from r 1 to r 2 . The criteria to select the stop to be moved was the following. Considering a specific route r R , the non-mandatory stop s with the longest distance from its predecessor and successor is picked (stop with high potential for distance reduction). If a better feasible solution is obtained by moving this stop to another route, then removal and relocation occurs. The new route and place should be the one with the shortest distance from s to the new predecessor and successor stops.

5.3.4. Inter-Route Cross-Exchange

Two sets of consecutive stops of two different routes may be switched. This is illustrated in Figure 9 where routes r 1 and r 2 changed from r 1 = { s 1 , s 2 , s 3 , , s j , s k , } and r 2 = { s 5 , s 4 , s i , s l , } to r 1 = { s 1 , s 2 , s 4 , , s i , s k , } and r 2 = { s 5 , s 3 , s j , s l , } because the consecutive stops s 3 , , s i and s 4 , , s j have switched their position. The criteria to select the stops to be switched was the following. Two stops s i and s j with the shortest distance between them, and belonging to different routes, are initially picked (closer stops are more prone to be shuffled when routes are being built). Stop s i will be part of set X , while stop s j will be part of set Y . Then, sets X and Y are extended, by including a consecutive nearby stop, while a better feasible solution is obtained if sets were switched. The consecutive nearby stop should be the one that minimizes the total distance from all stops of one set to all stops of the other set.
These local search procedures are repeatedly applied while the feasible solution is improved.

6. Performance Analysis

In this section, the results obtained by the proposed heuristic algorithm are analyzed. Since the instance sets available in the literature to evaluate vehicle routing problems cannot be directly applied to our VRwBP problem, the instance sets commonly used to evaluate the multi-depot vehicle routing problem (MDVRP) heuristics have been adopted while making some assumptions. The following analysis includes only the results for the 50 node instances available in [25]. Both instance sets and best known results for the MDVRP are available in [25]. Information on how instance sets were generated is also provided. Please note that these are instance sets that are widely accepted by the research community, allowing not only multiple scenarios to be evaluated (results become more conclusive), but also a future comparison between algorithms if researchers propose other heuristic algorithms.

6.1. Assumptions

The MDVRP instances include information about the number of depots available, the maximum number of vehicles available per depot and nodes/stops to be visited. For each stop, its coordinates, service time and demand are given. The P instances have zero for the service time, while PR instances have non-zero service times (types of instances and their format can be found in [25]). For the VRwBP problem under analysis, the following assumptions must be applied to each instance:
  • To define the total number of routes in R , the solutions provided by the best known heuristic results were used. In such solutions, if m vehicles leave a specific depot, then m routes starting at that depot will be included in R . This choice is based on the fact that such best known solutions provide good upper bounds on the number of routes required to cover all stops. Therefore, it is not necessary to consider all vehicles available per depot (info provided by MDVRP instances).
  • Considering a specific depot s i and the m routes starting at s i , determined as stated previously, the mandatory stops of these routes will include s i and the m stops farther away from s i , one for each route. That is, each route has two mandatory stops, the depot and one of the m stops.
  • Due to the way mandatory stops have been defined, a reasonable time window for a mandatory stop s at route r will be:
    Δ ( s , s ) = d u r a t i o n ( r ) s k S s e r v i c e ( s k ) | R | 2
    where d u r a t i o n ( r ) is the total duration of route r, provided by the best known results, and s e r v i c e ( s k ) is the service time at stop s k . That is, the average total service time per route is removed from the total duration of the route, since service time is not relevant for our VRwBP problem. This result must be divided by two because the total duration of routes includes returning to the depot, and this must not be considered when defining the time windows of mandatory stops.
  • Critical stops are the ones having more demand. More specifically, tests were done with B including a single critical stop (the one with highest demand value), two critical stops, and so on, until a maximum of | R | critical stops, assuming that no two stops belong to the same route of the best known results.
  • The threshold of a critical node s j , denoted by T s j , will be a percentage of s j ’s route duration, i.e., route of the best known results where s j is inserted. Thus, T s j = p × d u r a t i o n ( r ) , s j r , 0 < p 1 . Different percentage values will be tested.
Note that in a real scenario, the critical stops would be retrieved from the database storing the number of passengers on-board (please refer to Section 3).

6.2. Impact Analysis of Backup Provisioning and Local Search Procedures

In this section, we analyze the impact of planning vehicle routes with backup provisioning. Since the heuristic will run for many instances, having different service times, demands, etc., there might be different performances for different instances. For this reason, to analyze the impact of backup provisioning (BP), the following gap is analyzed:
G a p i B P = D i s t a n c e i B P D i s t a n c e i N o B P D i s t a n c e i N o B P
where D i s t a n c e i B P is the distance value obtained when backup is provided and D i s t a n c e i N o B P is the distance value obtained if no backup is provided, considering a specific instance i. Results shown in the following plots include the average of these gaps, over all analyzed instances.
Regarding the effectiveness of the local search (LS) procedures and also due to the fact that there will be many instances, the following gap is analyzed:
G a p i L S = D i s t a n c e i N o L S D i s t a n c e i L S D i s t a n c e i N o L S
where D i s t a n c e i N o L S is the distance value obtained when no local search procedures are used and D i s t a n c e i L S is the distance value obtained after applying local search procedures, considering a specific instance i. Results plotted in the following figures include the average of these gaps over all analyzed instances.
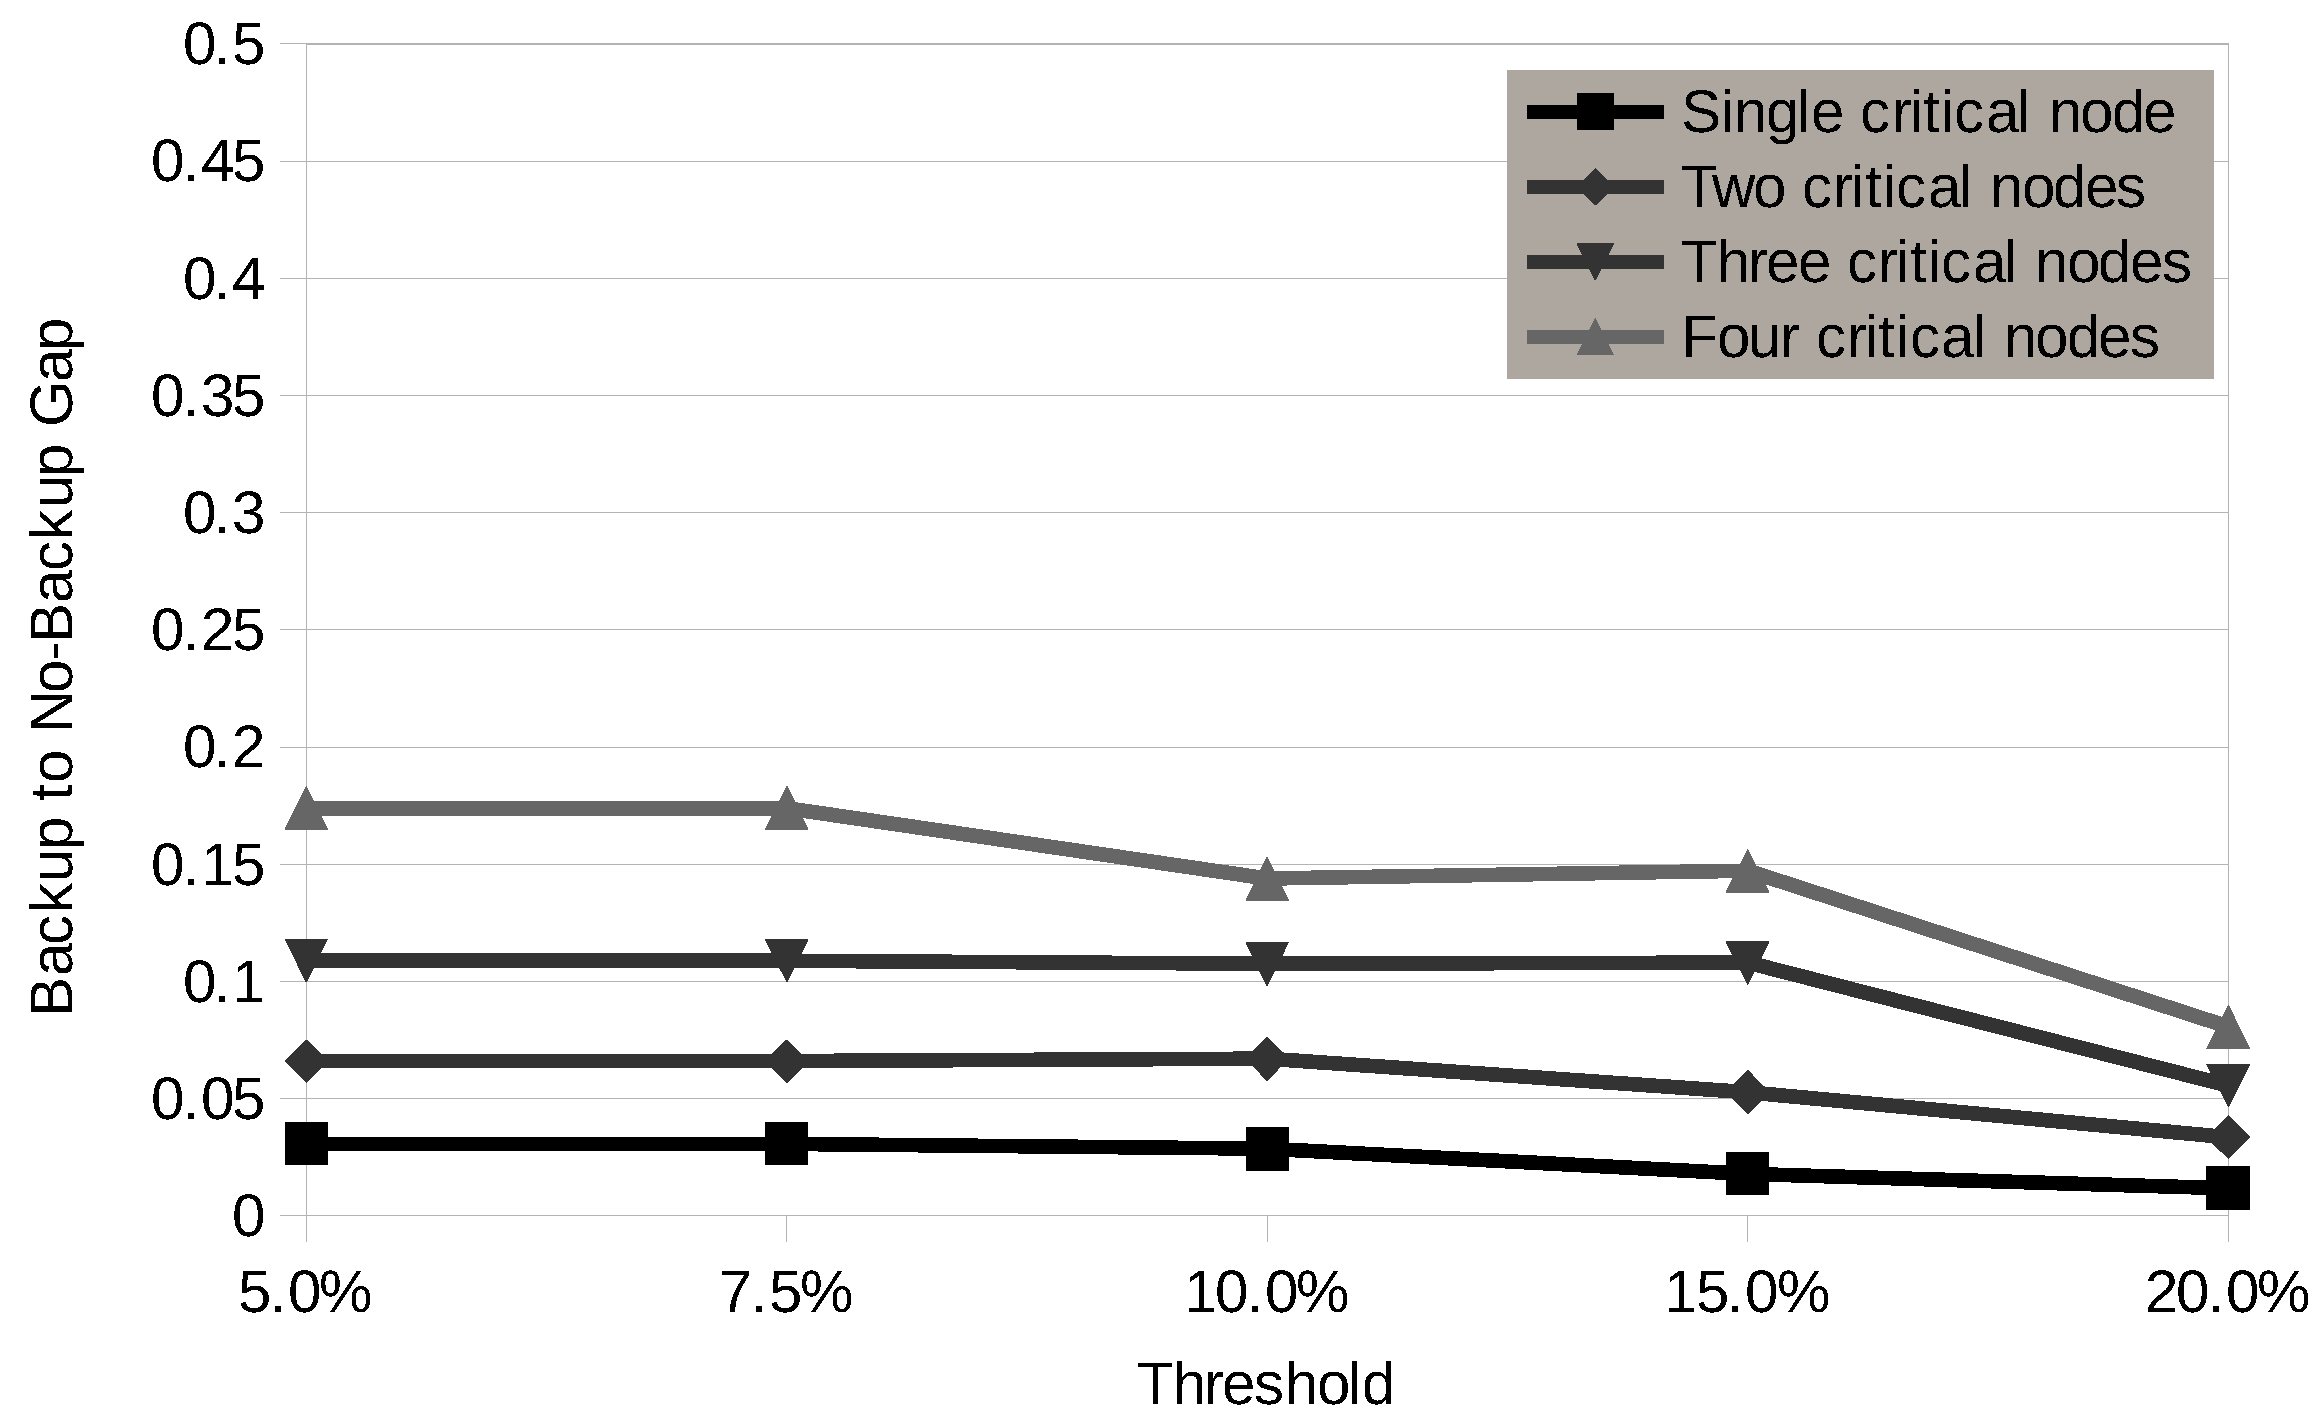
Figure 10 shows the increase on distance values, obtained by the heuristic, when backup is provided to a certain number of critical nodes. Tests were performed for different thresholds on backup arrival time (see Section 6.1 regarding assumptions on thresholds). Results show that the increase of the distance values gets higher as the number of critical stations increases, as expected, reaching ∼15% for four critical nodes, while for a single node, it reached ∼2.5%. However, when the threshold gets looser, the gap between backup and no backup solutions reduces, whatever the number of critical nodes, as less route extensions are required for backup provisioning. This means that there is some cost (distance values increase) for backup provisioning, but thresholds can be adequately set to keep such a cost acceptable.
Please note that extra route duration in the case of backup provisioning also means serving more stops, meaning that this is not necessarily a disadvantage. In fact, stop weights can be used at the backup inclusion step in order to extend routes using stops with more visiting needs. Therefore, the right balance between threshold, influencing route extension and number of routes should be carefully planned in order to reduce the operational costs related with the number of route schedules and vehicles, while providing high quality service and customer satisfaction.
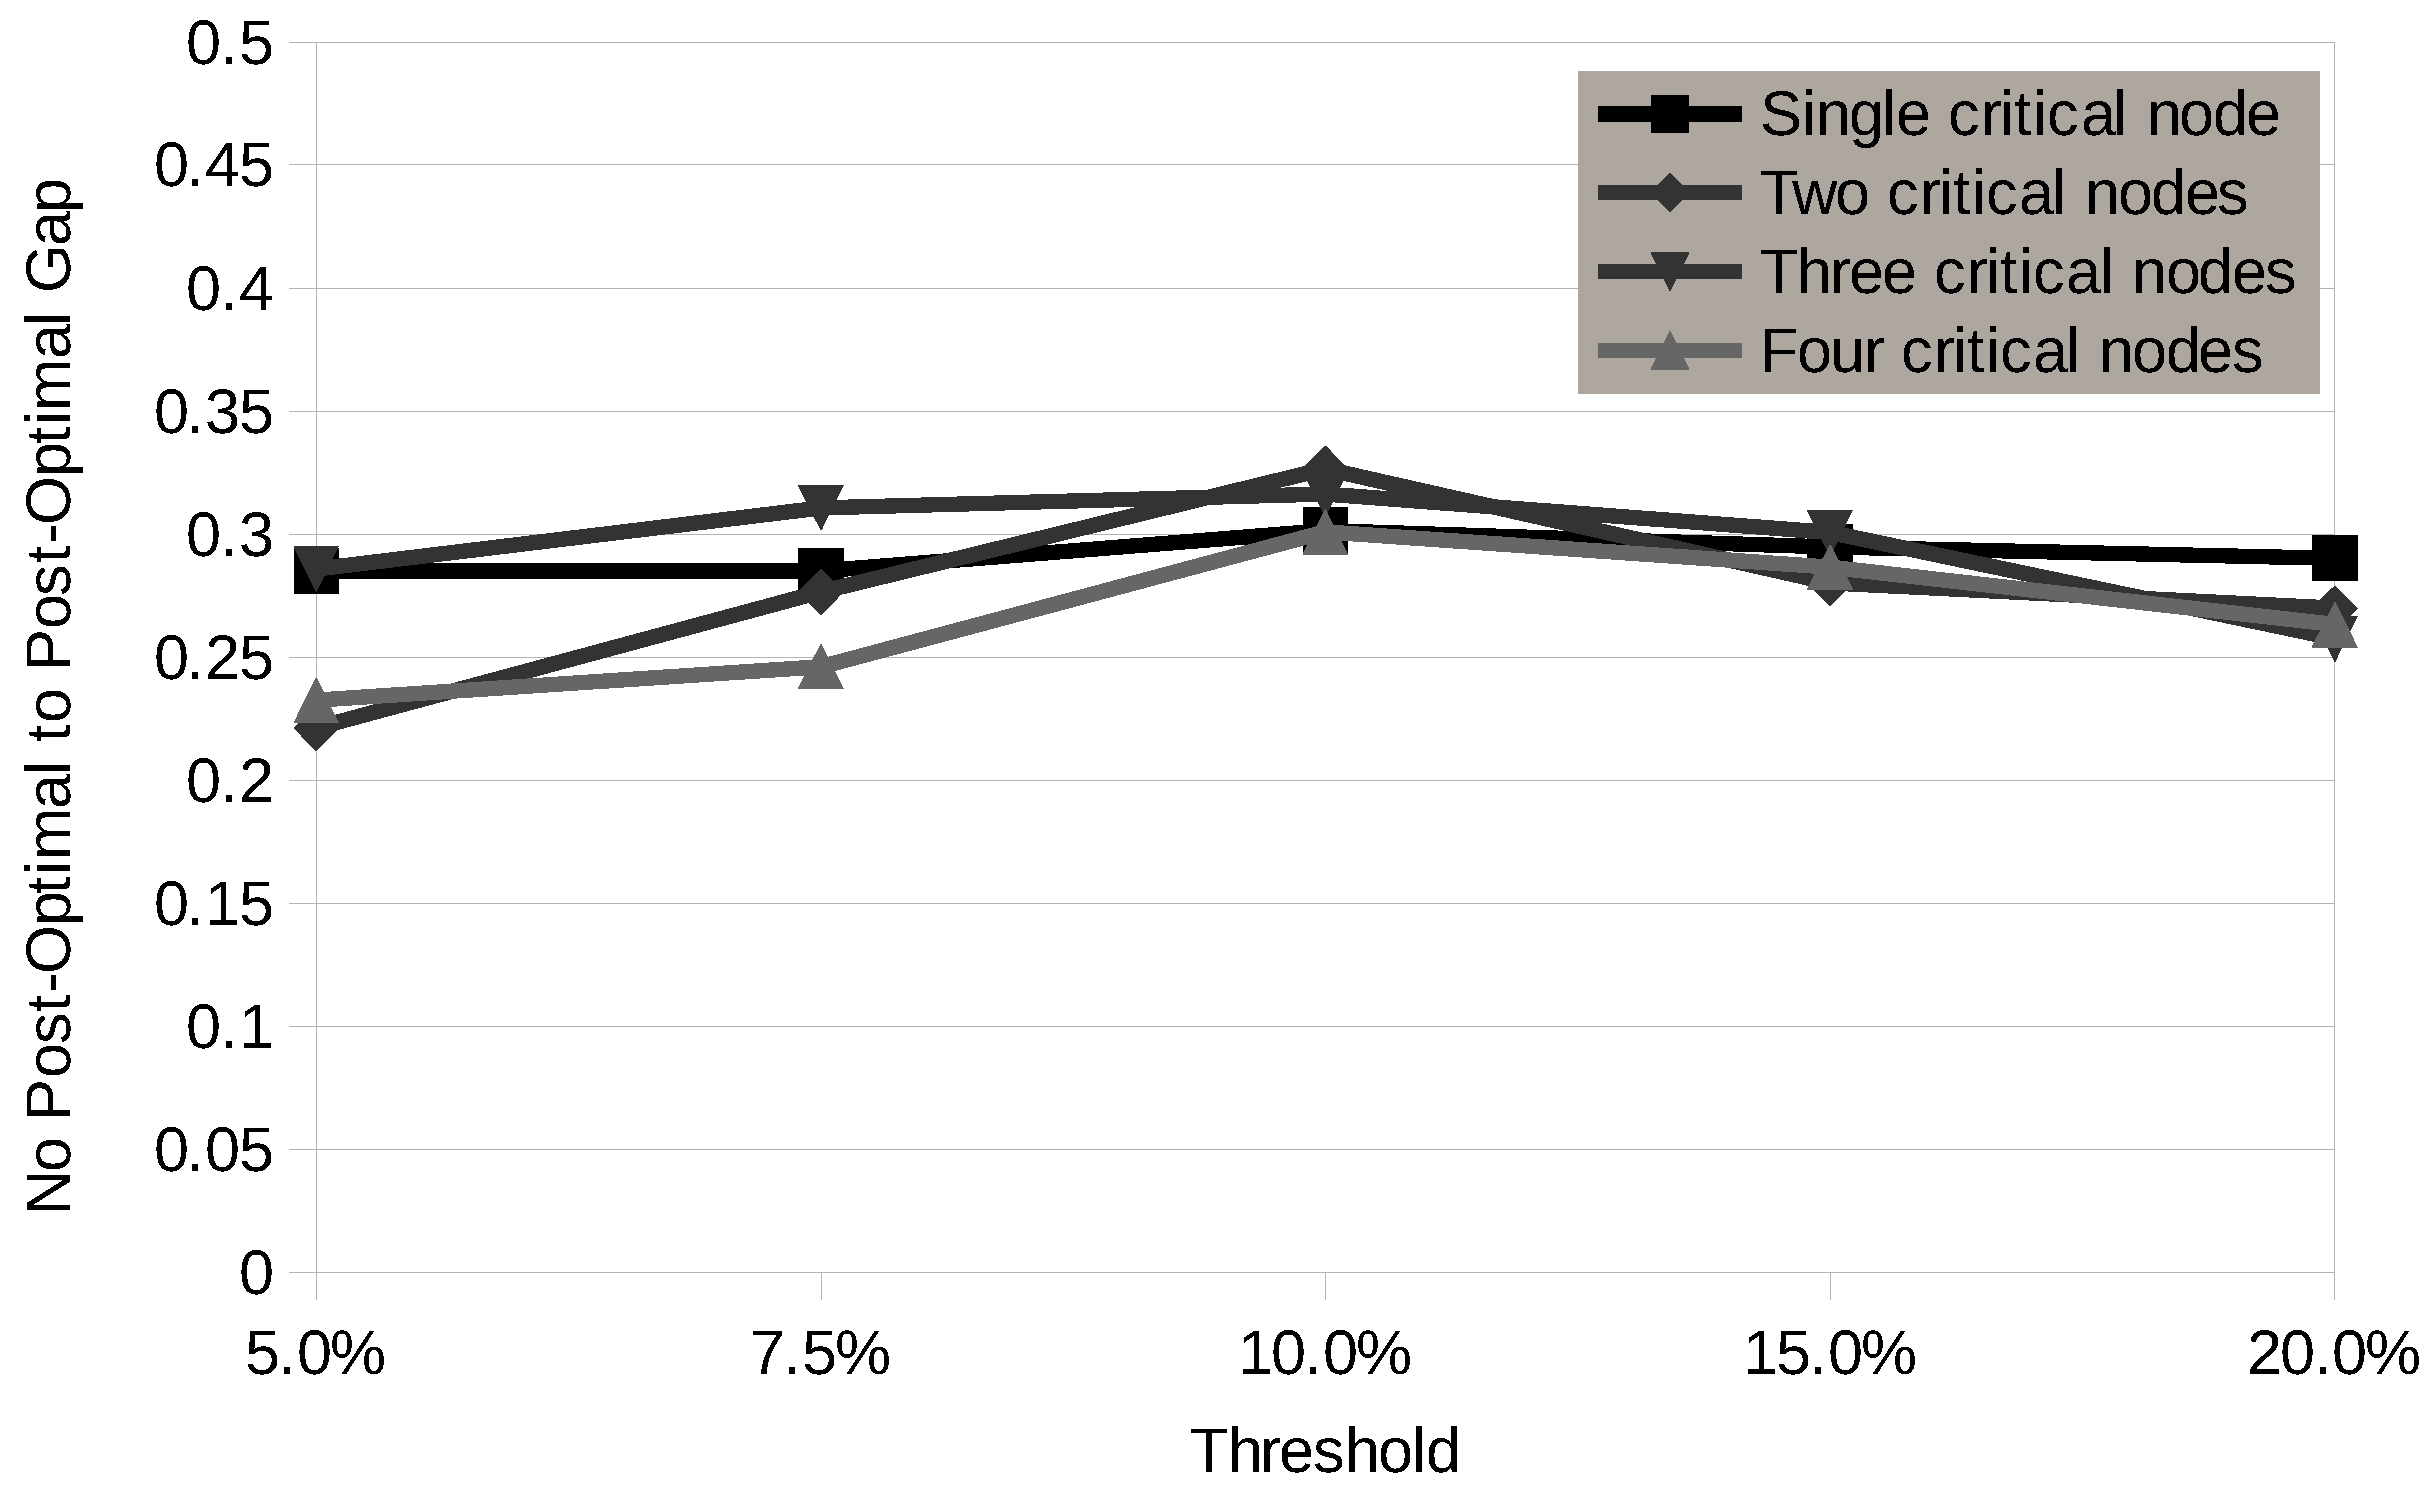
Regarding the improvement on distance values, when using local search procedures, Figure 11 shows the decrease on the distance values obtained when local search procedures are applied, assuming that backup is being provided to critical stops. As can be observed, local search procedures are very effective at reducing the overall route lengths by approximately 30%. When no backup is provided, the distance value reduction, which is independent of the number of critical stops and threshold, was also 30%.
It is also possible to conclude from Figure 11 that the optimal threshold value is around 10%. For tighter thresholds, the performance of local search procedures is not so good, but such a penalty is not high. For threshold values higher than 10%, the benefit of the local search procedure remains almost unchanged. Since tight thresholds lead to longer route extensions, while loose thresholds result in few or no route extensions, we can state that the insertion of just a few stations for route extension is enough to reach the best improvements. No station insertion means less flexibility when making exchange/relocation, while the insertion of too many stations results in longer routes, and exchange/relocation is not able to compensate such an increase.
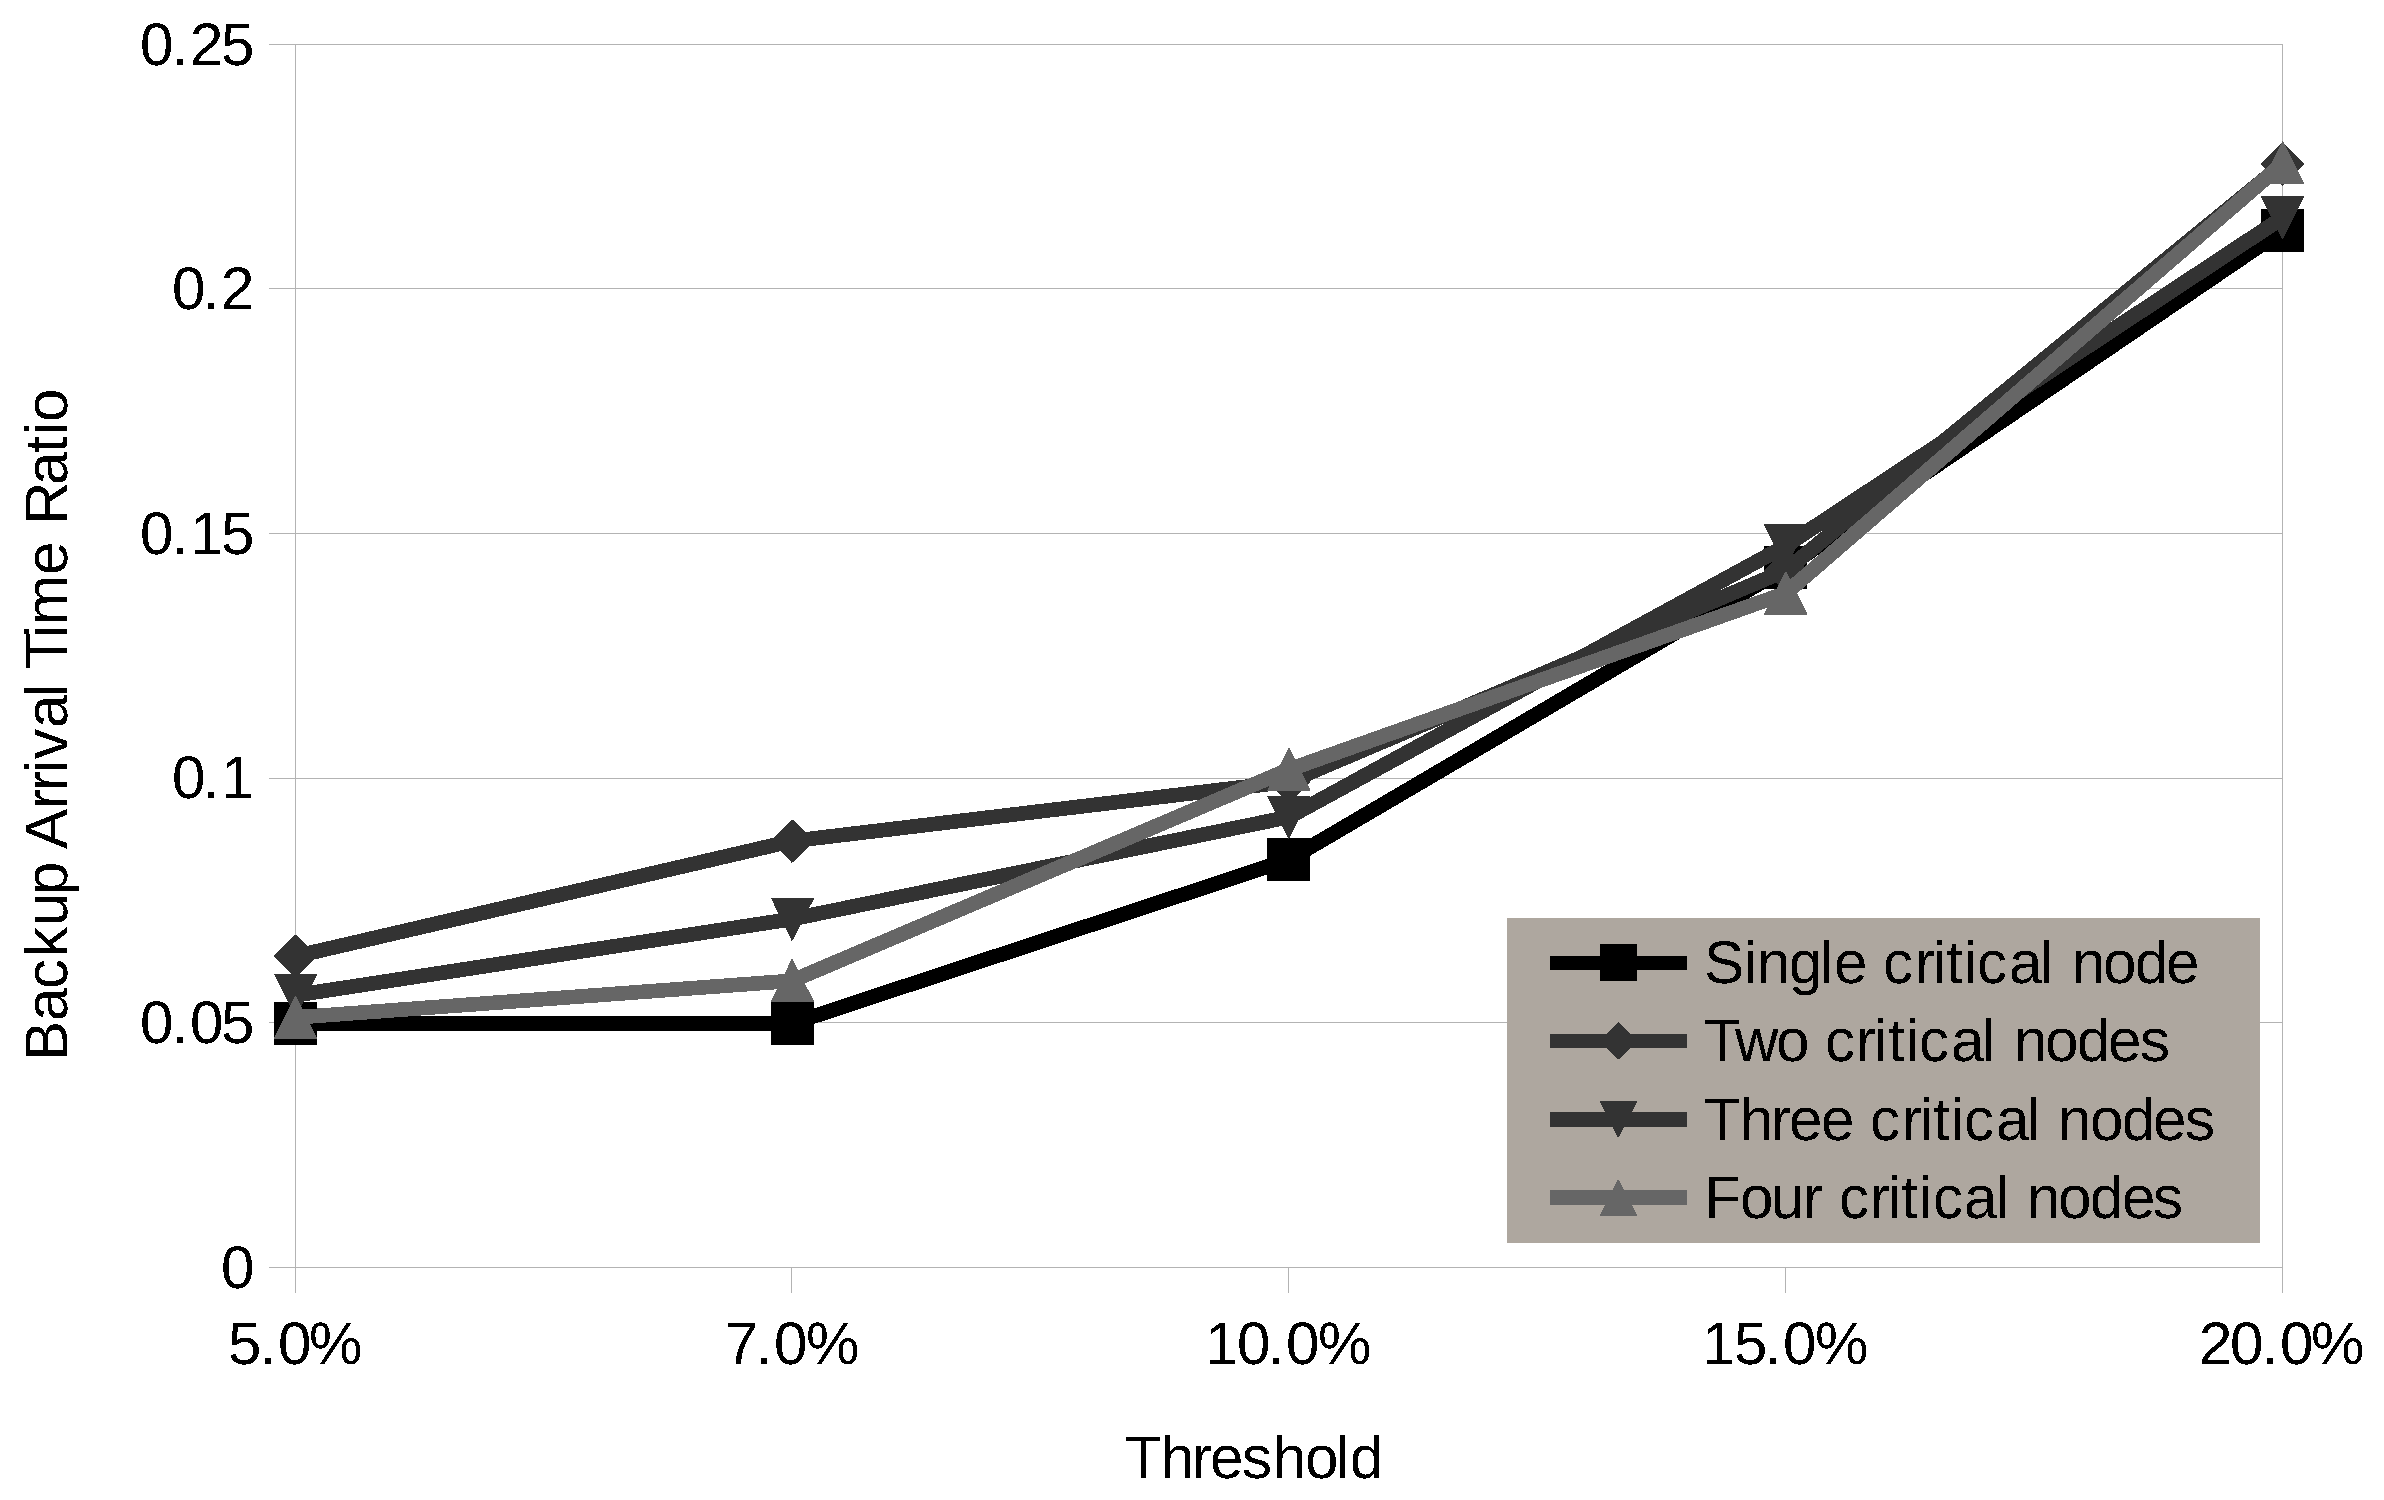
Figure 12 shows the average of the ratios between the time it takes for a vehicle finishing its route somewhere in the neighborhood, and providing backup, to come to the critical station and the time it takes for a new vehicle to come from the depot, so that extra clients are accommodated. When looking into this plot, we can observe that backup provisioning times are always lower than the times associated with the routes that would be traversed if a new vehicle comes from the source. This happens for all threshold values and number of critical nodes. Therefore, the approach being proposed provides higher quality of service, regarding time for the backup vehicle to arrive, when the backup is required. Note also that a new schedule, vehicle and driver would be required when routes are not planned having backup provisioning in mind (extra vehicle coming from the source). If routes are planned with backup provisioning in mind (the proposed approach), there is no need for such a new schedule, extra vehicle and driver.
When observing this last plot, we can state that higher threshold values result in a more pronounced increase of ratio values because not only backup takes more time to arrive, but also routes become shorter. It is also possible to observe that since the threshold for a critical node is a percentage of the route duration, where the critical node is inserted, more critical nodes do not necessarily lead to a smoothing of the average values plotted, at least for lower threshold values. This would be the case if similar absolute thresholds were used for all critical nodes.

6.3. Quality of Heuristic Solutions

As previously mentioned, the mathematical formalization presented in Section 4.3 is too hard to solve for scenarios with many stops. The instances used in our evaluation, with 50 nodes, are impracticable for an optimizer (e.g., IBM ILOG CPLEX Optimizer) because solving the corresponding mathematical formalizations, to get optimal solutions, would take too long. Furthermore, reducing the number of nodes leads to unrealistic scenarios, may choke the operation of the algorithm and will not enable future comparison between algorithms, if researchers propose new approaches in the future. Another possibility would be to compare the heuristic results with the best known results, from other heuristics in the literature; however, the VRwBP problem is new, and no previous results exist.
The best way to evaluate the quality of the VRwBP heuristic is to compare its solutions with the results obtained for the multi-depot open vehicle routing problem (MDOVRP) described in [26] while assuming a large threshold for the arrival of backup to critical nodes because the MDOVRP does not incorporate backup provisioning. The authors in [26] also adapt the test data available in [25] to the MDOVRP, but our assumptions must be different because in our VRwBP, we have critical nodes, mandatory stops and thresholds. This evaluation allows us to see if the neighborhood formation approach and local search procedures perform well. The heuristic effectiveness is evaluated using the following gap:
G a p i B P 2 B K = D i s t a n c e i B P D i s t a n c e i B K D i s t a n c e i B K
where D i s t a n c e i B K is the MDOVRP best known distance result available for instance i and D i s t a n c e i B P is the distance value obtained by the VRwBP heuristic for instance i.
As previously mentioned, the comparison between the VRwBP heuristic and the MDOVRP best known results, G a p B P 2 B K , consider a very large threshold value, or infinite, meaning that routes have no need to be extended for backup provisioning. Therefore, result values remain the same when the number of critical nodes changes. The average result value obtained for the gaps was 2.3 % . Therefore, we can state that our heuristic results are close to the MDOVRP best known results, only 2.3% higher, when a very large threshold is assumed. This means that the neighborhood formation approach and local search procedures are effective. This slight increase might be caused by the existence of mandatory stops in VRwBP, not considered in MDOVRP.

6.4. Overall Perception

From the previous analysis, the overall perception is that planning routes with backup provisioning can allow fast response to overload while reducing costs because of the following:
  • Backup provisioning allows fast response to overload and reduces waiting times for customers;
  • Extension of routes to incorporate a backup can be done while serving stops with more needs;
  • Backup provisioning avoids more schedules/vehicles/drivers, reducing costs;
  • The extra traversal by a vehicle providing backup is only done in case of need, namely when sensors detect overcrowding in a critical stop. This is a flexible and cost-effective solution for transportation network enhancement.

7. Conclusions

In this article, a vehicle routing with backup provisioning approach is proposed for sustainable urban mobility with efficient use of resources. Besides formalizing mathematically the problem, a heuristic is proposed that allows solutions to be obtained more quickly. The vehicle routing with backup provisioning approach is able to provide higher quality of service, regarding time for the backup vehicle to arrive, and it avoids new schedules/vehicles/drivers for backup provisioning. Although routes become longer, to ensure backup, thresholds on time for backup to arrive can be adequately set to keep such distances acceptable. However, since more stops are being served, the increase of routes should not be seen just as a penalty. Regarding the neighborhood formation approach and local search procedures, incorporated in the heuristic, these have proven to be effective. Route distances reduced by approximately 30%. In summary, the overall perception is that the proposed heuristic is able to effectively solve the vehicle routing with backup provisioning problem under consideration. As future work, we expect to study fleet planning considering vehicles of different sizes.

Acknowledgments

This work was supported by FCT (Foundation for Science and Technology) from Portugal within CEOT (Center for Electronic, Optoelectronic and Telecommunications) and the UID/MULTI/00631/2013 project.

Author Contributions

N. Correia and G. Schütz worked on the mathematical formalization and local search procedures, while N. Carvalho worked on the implementation of these and on the monitoring tool.

Conflicts of Interest

The authors declare no conflict of interest.

References

  1. Yick, J.; Mukherjee, B.; Ghosal, D. Wireless Sensor Network Survey. Comput. Netw. 2008, 52, 2292–2330. [Google Scholar] [CrossRef]
  2. Zheng, J.; Jamalipour, A. Wireless Sensor Networks, a Networking Perspective, 1st ed.; Wiley-IEEE Press: New York, NY, USA, 2009. [Google Scholar]
  3. Härri, J.; Filali, F.; Bonnet, C. Mobility Models for Vehicular Ad Hoc Networks. IEEE Commun. Surv. Tutor. 2009, 11, 19–41. [Google Scholar] [CrossRef]
  4. Zhang, G.; Xu, Y.; Wang, X.; Tian, X.; Liu, J.; Gan, X.; Yu, H.; Qian, L. Multicast Capacity for VANETs with Directional Antenna and Delay Constraint. IEEE J. Select. Areas Commun. 2012, 30, 818–833. [Google Scholar] [CrossRef]
  5. Restuccia, F.; Das, S.K. Optimizing the Lifetime of Sensor Networks with Uncontrollable Mobile Sinks and QoS Constraints. ACM Trans. Sens. Netw. 2016, 12, 2. [Google Scholar] [CrossRef]
  6. Carvalho, N.; Schütz, G.; Correia, N. Vehicle Routing with Backup Provisioning Using Wireless Sensor Infrastructure. In Proceedings of the IEEE International Conference on Connected Vehicles and Expo (ICCVE), Vienna, Austria, 3–7 November 2014; pp. 647–652. [Google Scholar]
  7. Yeun, L.C.; Ismail, W.R.; Omar, K.; Zirour, M. Vehicle Routing Problem: Models and Solutions. J. Q. Meas. Anal. 2008, 4, 205–218. [Google Scholar]
  8. Cordeau, J.F.; Laporte, G. The Dial-a-Ride Problem: Models and Algorithms. Ann. Oper. Res. 2007, 153, 29–46. [Google Scholar] [CrossRef]
  9. Li, F.; Golden, B.; Wasil, E. The Open Vehicle Routing Problem: Algorithms, Large-Scale Test Problems, and Computational Results. Comput. Oper. Res. 2007, 34, 2918–2930. [Google Scholar] [CrossRef]
  10. López-Sánchez, A.; Hernández-Díaz, A.; Vigo, D.; Caballero, R.; Molina, J. A multi-start algorithm for a balanced real-world Open Vehicle Routing Problem. Eur. J. Oper. Res. 2014, 238, 104–113. [Google Scholar] [CrossRef]
  11. Cormen, T.H.; Leiserson, C.E.; Rivest, R.L.; Stein, C. Introduction to Algorithms, 3rd ed.; MIT Press: Cambridge, MA, USA, 2009. [Google Scholar]
  12. Marinakis, Y.; Marinaki, M. A Bumble Bees Mating Optimization algorithm for the Open Vehicle Routing Problem. Swarm Evol. Comput. 2014, 15, 80–94. [Google Scholar] [CrossRef]
  13. Liu, J.; Fang, Y. Urban Traffic Control System Based on Wireless Sensor Networks. In Proceedings of the IEEE International Conference on Information Acquisition, Weihai, China, 20–23 August 2006; pp. 295–300. [Google Scholar]
  14. Wu, Z.; Chu, H.; Pan, Y.; Yang, X. Bus Priority Control System Based on Wireless Sensor Network (WSN) and Zigbee. In Proceedings of the IEEE International Conference on Vehicular Electronics and Safety, Beijing, China, 13–15 December 2006; pp. 148–151. [Google Scholar]
  15. Cai, C.Q.; Zhang, Z.; Ji, S.D. The Intelligent Bus Scheduling Based on Zigbee. In Proceedings of the 7th International Conference on Computer Science Education, Melbourne, Australia, 14–17 July 2012; pp. 1002–1005. [Google Scholar]
  16. Pun-Cheng, L.S.C. An Interactive Web-Based Public Transport Enquiry System With Real-Time Optimal Route Computation. IEEE Trans. Intell. Transp. Syst. 2012, 13, 983–988. [Google Scholar] [CrossRef]
  17. Zhou, Y.; Lee, G.M. A Lagrangian Relaxation-Based Solution Method for a Green Vehicle Routing Problem to Minimize Greenhouse Gas Emissions. Sustainability 2017, 9, 776. [Google Scholar] [CrossRef]
  18. Qin, J.; Ye, Y.; Rong Cheng, B.; Zhao, X.; Ni, L. The Emergency Vehicle Routing Problem with Uncertain Demand under Sustainability Environments. Sustainability 2017, 9, 288. [Google Scholar] [CrossRef]
  19. Lavanya, G.; Preethy, W.; Shameem, A.; Sushmitha, R. Passenger Bus Alert System for Easy Navigation of Blind. In Proceedings of the IEEE International Conference on Circuits, Power and Computing Technologies, Nagercoil, India, 20–21 March 2013; pp. 798–802. [Google Scholar]
  20. Zhou, L.; Feng, L.; Gupta, A.; Ong, Y.S.; K. Liu, C.C.; Sha, E.; Yang, B.; Yan, B.W. Solving Dynamic Vehicle Routing Problem Via Evolutionary Search with Learning Capability. In Proceedings of the IEEE Congress on Evolutionary Computation (CEC), San Sebastián, Spain, 5–8 June 2017; pp. 890–896. [Google Scholar]
  21. Gutierrez, V.; Izaguirre, M.; Perez, J.; Munoz, L.; Lopez, D.; Sanchez, M. Ambient Intelligence in Intermodal Transport Services: A Practical Implementation in Road Logistics. In Proceedings of the 4th International Conference on Sensor Technologies and Applications (SENSORCOMM), Venice, Italy, 18–25 July 2010; pp. 203–209. [Google Scholar]
  22. Wang, Y.; Ho, O.; Huang, G.; Li, D.; Huang, H. Study on RFID-Enabled Real-Time Vehicle Management System in Logistics. In Proceedings of the International Conference on Automation and Logistics, Qingdao, China, 1–3 September 2008; pp. 2234–2238. [Google Scholar]
  23. Wang, Y.; Ho, O.K.; Huang, G.Q.; Li, D. Study on Vehicle Management in Logistics Based on RFID, GPS and GIS. Int. J. Internet Manuf. Serv. 2008, 1, 294–304. [Google Scholar] [CrossRef]
  24. Carić, T.; Galić, A.; Fosin, J.; Gold, H.; Reinholz, A. A Modelling and Optimization Framework for Real-World Vehicle Routing Problems; InTechOpen: Rijeka, Croatia, 2008. [Google Scholar]
  25. Networking and Emerging Optimization Research Group. Available online: http://neo.lcc.uma.es/vrp/vrp-instances/multiple-depot-vrp-instances/ (accessed on 26 November 2015).
  26. Liu, R.; Jiang, Z.; Geng, N. A Hybrid Genetic Algorithm for the Multi-Depot Open Vehicle Routing Problem. OR Spectr. 2014, 36, 401–421. [Google Scholar] [CrossRef]
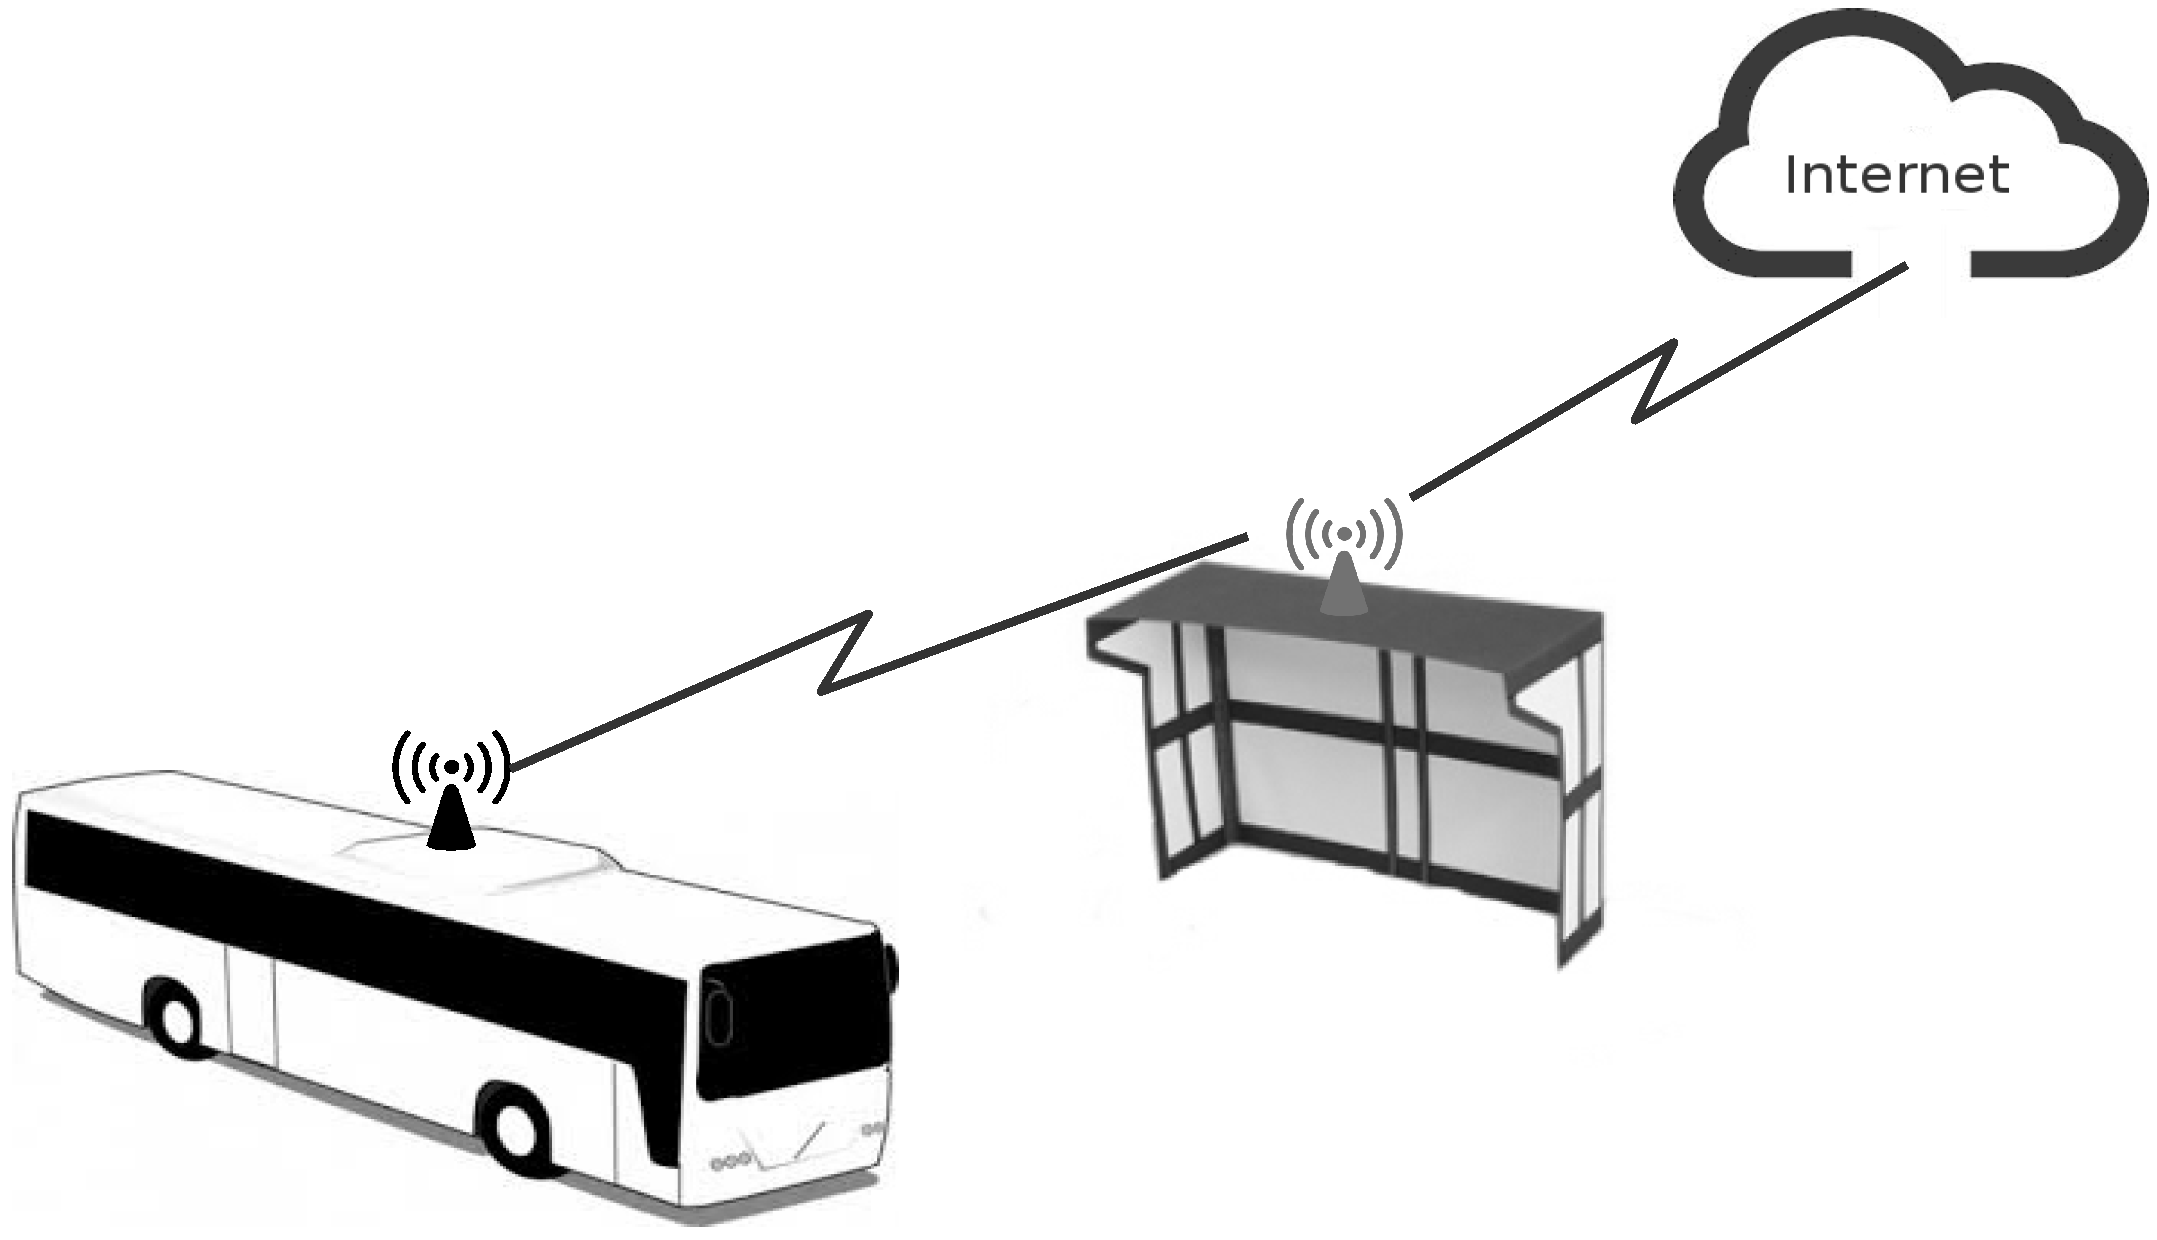
Figure 1. Vehicle to roadside access point example.
Information 08 00094 g001
Figure 2. Illustration of vehicle routing problem with reactive response to overload.
Information 08 00094 g002
Figure 3. Sensor application in a bus. PIRs, passive infrared sensors.
Information 08 00094 g003
Figure 4. FSM diagram for each sensor node of dual implementation.
Information 08 00094 g004
Figure 5. Monitoring tool: main page.
Information 08 00094 g005
Figure 6. Monitoring tool: adding stations.
Information 08 00094 g006
Figure 7. Monitoring tool: adding routes.
Information 08 00094 g007
Figure 8. Algorithm illustration: inserting mandatory stops.
Information 08 00094 g008
Figure 9. Local search procedures: intra-route relocation, intra-route exchange, inter-route relocation and inter-route cross-exchange.
Information 08 00094 g009
Figure 10. Increase on distance values, obtained by the heuristic, when backup is provided.
Information 08 00094 g010
Figure 11. Decrease on distance values, obtained by the heuristic, when local search procedures are applied. Backup is being provided.
Information 08 00094 g011
Figure 12. Backup provisioning vs. vehicle from the depot time ratio. Local search procedures are incorporated.
Information 08 00094 g012