


Abstract
Parkinson’s disease has brought great harm to human life and health. The detection of Parkinson’s disease based on electroencephalogram (EEG) provides a new way to prevent and treat Parkinson’s disease. However, due to the limited EEG data samples, there are large differences among different subjects, especially among different datasets. In this study, a new method called Improved Convex Hull and Maximum Mean Discrepancy (ICMMD)for cross-dataset classification of Parkinson’s disease is proposed by combining convex hull and transfer learning. The paper innovatively implements cross-data transfer learning in the field of brain–computer interfaces for Parkinson’s disease, using Euclidean distance for data alignment and EEG channel selection, and combines the convex envelope with MMD distance to form an effective source domain selection method. Lowpd, San and UNM datasets are used to verify the effectiveness of the proposed method through experiments on different brain regions and frequency bands in Parkinson’s. The results show that this method has good classification performance in different regions of the brain and frequency bands. The research in this paper provides a new idea and method for disease detection of Parkinson’s disease across datasets.
1. Introduction
Parkinson’s disease (PD) is a chronic and progressive neurodegenerative disorder that primarily affects motor function due to the gradual loss of dopaminergic neurons in the substantia nigra, a critical part of the brain’s basal ganglia circuitry [1]. This neuronal loss disrupts the normal functioning of motor pathways, leading to the hallmark symptoms of PD: tremor at rest, muscle rigidity, bradykinesia (slowness of movement) and postural instability. In addition to these motor symptoms, PD patients may also experience a range of non-motor symptoms, including cognitive decline, mood disorders and autonomic dysfunction, which significantly impact their quality of life [2].
The early diagnosis and monitoring of Parkinson’s disease are crucial for managing symptoms and slowing disease progression. However, diagnosing PD, especially in its early stages, remains challenging due to the overlap of its symptoms with other neurological disorders [3]. In this context, electroencephalography (EEG) [4] has emerged as a valuable tool for studying the brain’s electrical activity and identifying potential biomarkers for PD [5]. EEG signals, which reflect the summed electrical activity of neurons, are non-invasive and relatively easy to acquire, making them suitable for longitudinal studies and real-time monitoring [6].
The classification of EEG signals in Parkinson’s disease involves distinguishing between the abnormal brain activity patterns associated with PD and normal or other pathological states. This task is complicated by the intrinsic variability of EEG signals, which can be influenced by factors such as age, medication and the severity of the disease. Several studies have employed EEG signals with traditional machine learning techniques for the detection of PD. Liu [7] combined wavelet transform and sample feature; an accuracy of 92.68% was obtained by using the three-way decision model. Yuvaraj [8] proposed the Higher-order spectra (HOS) feature extract method. The model was learned in various machine learning models such as KNN, DT and SVM, and an accuracy of 90.6% to 99.6% was obtained. Anjum [9], by placing PSD features into Hyperplanes models for learning, achieved an accuracy of 85.4% on the UNM dataset. Khare [10] combined Baud’s sign with statistical features, and Aljalal [11] combined CSP and entropy features; both achieved good results on the San Diego dataset.
In recent years, there has been a significant interest in leveraging machine learning techniques to enhance the performance of BCIs [12], particularly in the classification and interpretation of complex brain signals [10,13]. Transfer learning involves using knowledge gained from one task or dataset to improve the performance of a model on a different but related task or dataset [14]. This approach can address the variability in brain anatomy, cognitive state and the environmental conditions during data collection [15]. Transfer learning can be used to adapt models trained on data from one or more source domains to a target domain [16,17]. The advantages of transfer learning in BCIs are particularly pronounced in scenarios where data availability is limited or where data collection is costly or time-consuming. By effectively transferring knowledge from related tasks, transfer learning enables the development of more accurate and adaptable BCI systems [18].
Li [19] proposed the multi-direction transfer learning (MDTL) strategy for MI BCI. He [20] proposed an adaptive EEG emotion recognition method based on Transfer Component Analysis (TCA). Zhang [21] proposed MI-DAGSC, an end-to-end domain-adaptive graph-structured convolutional network tailored for the MI-EEG classification task. Gao [22] proposed a novel approach to apply transfer learning in both preprocessing and feature extraction stages, which combined EA and source domain test reweighting with Riemannian space. While transfer learning has shown success in motor imagery and emotion recognition, its potential for cross-dataset Parkinson’s disease (PD) detection has not been fully realized. Meanwhile, in the existing research on Parkinson’s disease, traditional machine learning struggles to demonstrate effective generalization ability in the face of the differences in EEG signals across subjects and datasets. Consequently, there is a pressing need for novel approaches specifically designed to tackle these challenges.
In this paper, in order to solve the problem of differences between different subjects and experimental environments across datasets, a method of source domain test selection based on convex hull combined migration is proposed. The Riemannian alignment of source domain and target domain data is first performed to narrow the Riemannian spatial differences of the test data. The features of different frequency bands are extracted using power spectrum, and the source domain data with a certain false alarm rate is screened by using MMD distance and convex hull calculation and the final model training.
The contributions of this paper are three-fold:
- In order to solve the data differences caused by different subjects and experimental environments, this paper realizes the research of Parkinson’s detection and recognition across datasets, and achieves a good accuracy rate.
- In order to reduce the difference between source domain and target domain, the concept of convex hull is combined with MMD distance to form a new source domain selection method. This method can effectively identify the source domain that is most similar to the target domain, so as to improve the effect of transfer learning.
- In order to prevent the influence caused by the location difference in EEG channels in different datasets, combined with EA, the covariance matrix of source domain and target domain is used to screen EEG channels, remove the channel data with large differences and reduce the difference in outliers between samples.
The rest of this paper is structured as follows: Section 2 describes the algorithm associated with the method. Section 3 describes the methods and details used in the paper. Section 4 describes the datasets with their preprocessing and evaluates the performance of these methods from different aspects. Section 5 discusses and evaluates the performance of the proposed methods from different aspects. The final Section 6 summarizes the whole paper and points out what improvements can be made.
2. Related Work
This section introduces some concept and methods related to the paper, including multiple source domain to single target domain (MTS), Maximum mean discrepancy and QuickHull.
2.1. Multiple Source Domain to Single Target Domain (MTS) Transfer Learning
In the framework of transfer learning, multi-source domain to single target domain (MTS) transfer learning focuses on how to integrate knowledge from multiple related but differently distributed source domains to enhance model performance on a single target domain, which is naturally applicable in scenarios such as EEG cross-subject analysis. MTS has emerged as a pivotal research direction in EEG transfer learning, aiming to effectively transfer knowledge from multiple heterogeneous source domains to a single unlabeled target domain while addressing the distributional discrepancies across domains [23].
MTS transfer learning encompasses various paradigms including feature-based adaptation, model-based transfer, instance-based weighting, and adversarial adaptation, each offering distinct advantages for addressing cross-domain discrepancies in EEG signal processing. Recent research has witnessed significant advancements, where multi-source domain adaptation methods have evolved to incorporate domain adversarial neural networks that simultaneously align multiple source distributions [23], common-branch networks with novel sample hybridization techniques to enhance feature representation consistency [24] and multi-source marginal distribution adaptation frameworks that explicitly address domain-specific characteristics in EEG emotion recognition tasks [25]. Some research develop sophisticated frameworks that incorporate attention mechanisms [26] and cycle self-refinement strategies [27] to enhance cross-domain knowledge transfer capabilities.
Existing studies have proposed various feature transfer methods [28,29] or source domain selections [30] to improve the performance of MTS. However, they mostly ignore the geometric structure of the data distribution and the influence of specific outlier samples within the source domain. Most existing methods predominantly focus on global distribution alignment while neglecting fine-grained class-level discrepancies and conditional distribution mismatches [31]. The inherent heterogeneity among multiple source domains often leads to negative transfer when source domains exhibit substantial divergence or contain irrelevant samples. This limitation highlights the necessity of introducing a more fine-grained screening mechanism, that is, combining geometric constraints with distance metrics.
2.2. Maximum Mean Discrepancy (MMD) and QuickHull
MMD is a non-parametric statistical method used to measure the difference between two probability distributions. The basic idea is to assess whether two distributions are the same by comparing the sample means drawn from each distribution. MMD supports many classic algorithms, such as Transfer Component Analysis (TCA) [32], which learns shared subspaces by minimizing MMD. And deep adaptation network (DAN) [33], which integrates multi-core MMD into the deep neural network architecture to align the feature distribution of each layer. Some researchers have attempted to improve MMD to enhance the performance of distribution alignment. For instance, recent advancements have extended MMD to joint distribution alignment through Joint Maximum Mean Discrepancy (JMMD) [34] and discriminative joint probability frameworks (DJP-MMD) [35], addressing both marginal and conditional distribution shifts simultaneously.
Although MMD measures the distribution distance by calculating the mean difference between two domains in the feature space, relying solely on MMD may lead to the problem of overfitting the source domain. When the data distribution in the source domain and the target domain is complex and nonlinear, simple linear feature mapping may not be able to fully narrow the distance between the two.
The QuickHull [36] algorithm operates on the principle of divide-and-conquer, similar to the QuickSort algorithm. The convex hull algorithm can accurately locate the external boundary of the point set, ensuring that all points are either inside or on the boundary of the convex polygon.
Recent research demonstrates that convex hull algorithms can accurately locate external boundaries of point sets in high-dimensional feature spaces, ensuring comprehensive coverage of data distributions [37]. In transfer learning contexts, convex hull-based approaches have been successfully employed for feature adaptation in object detection tasks and domain adaptation frameworks [38]. The geometric characterization of transfer learning in Hilbert spaces further validates the effectiveness of convex hull constructions for defining interpolation regions and transfer boundaries [39], making it a promising geometric tool for precisely defining the effective range of target domains. In the construction of the target domain, convex hull can efficiently define its effective range in the feature space to improve the screening efficiency and accuracy of source domain samples.
3. Methods
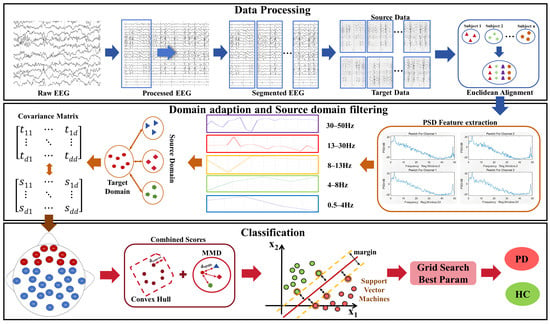
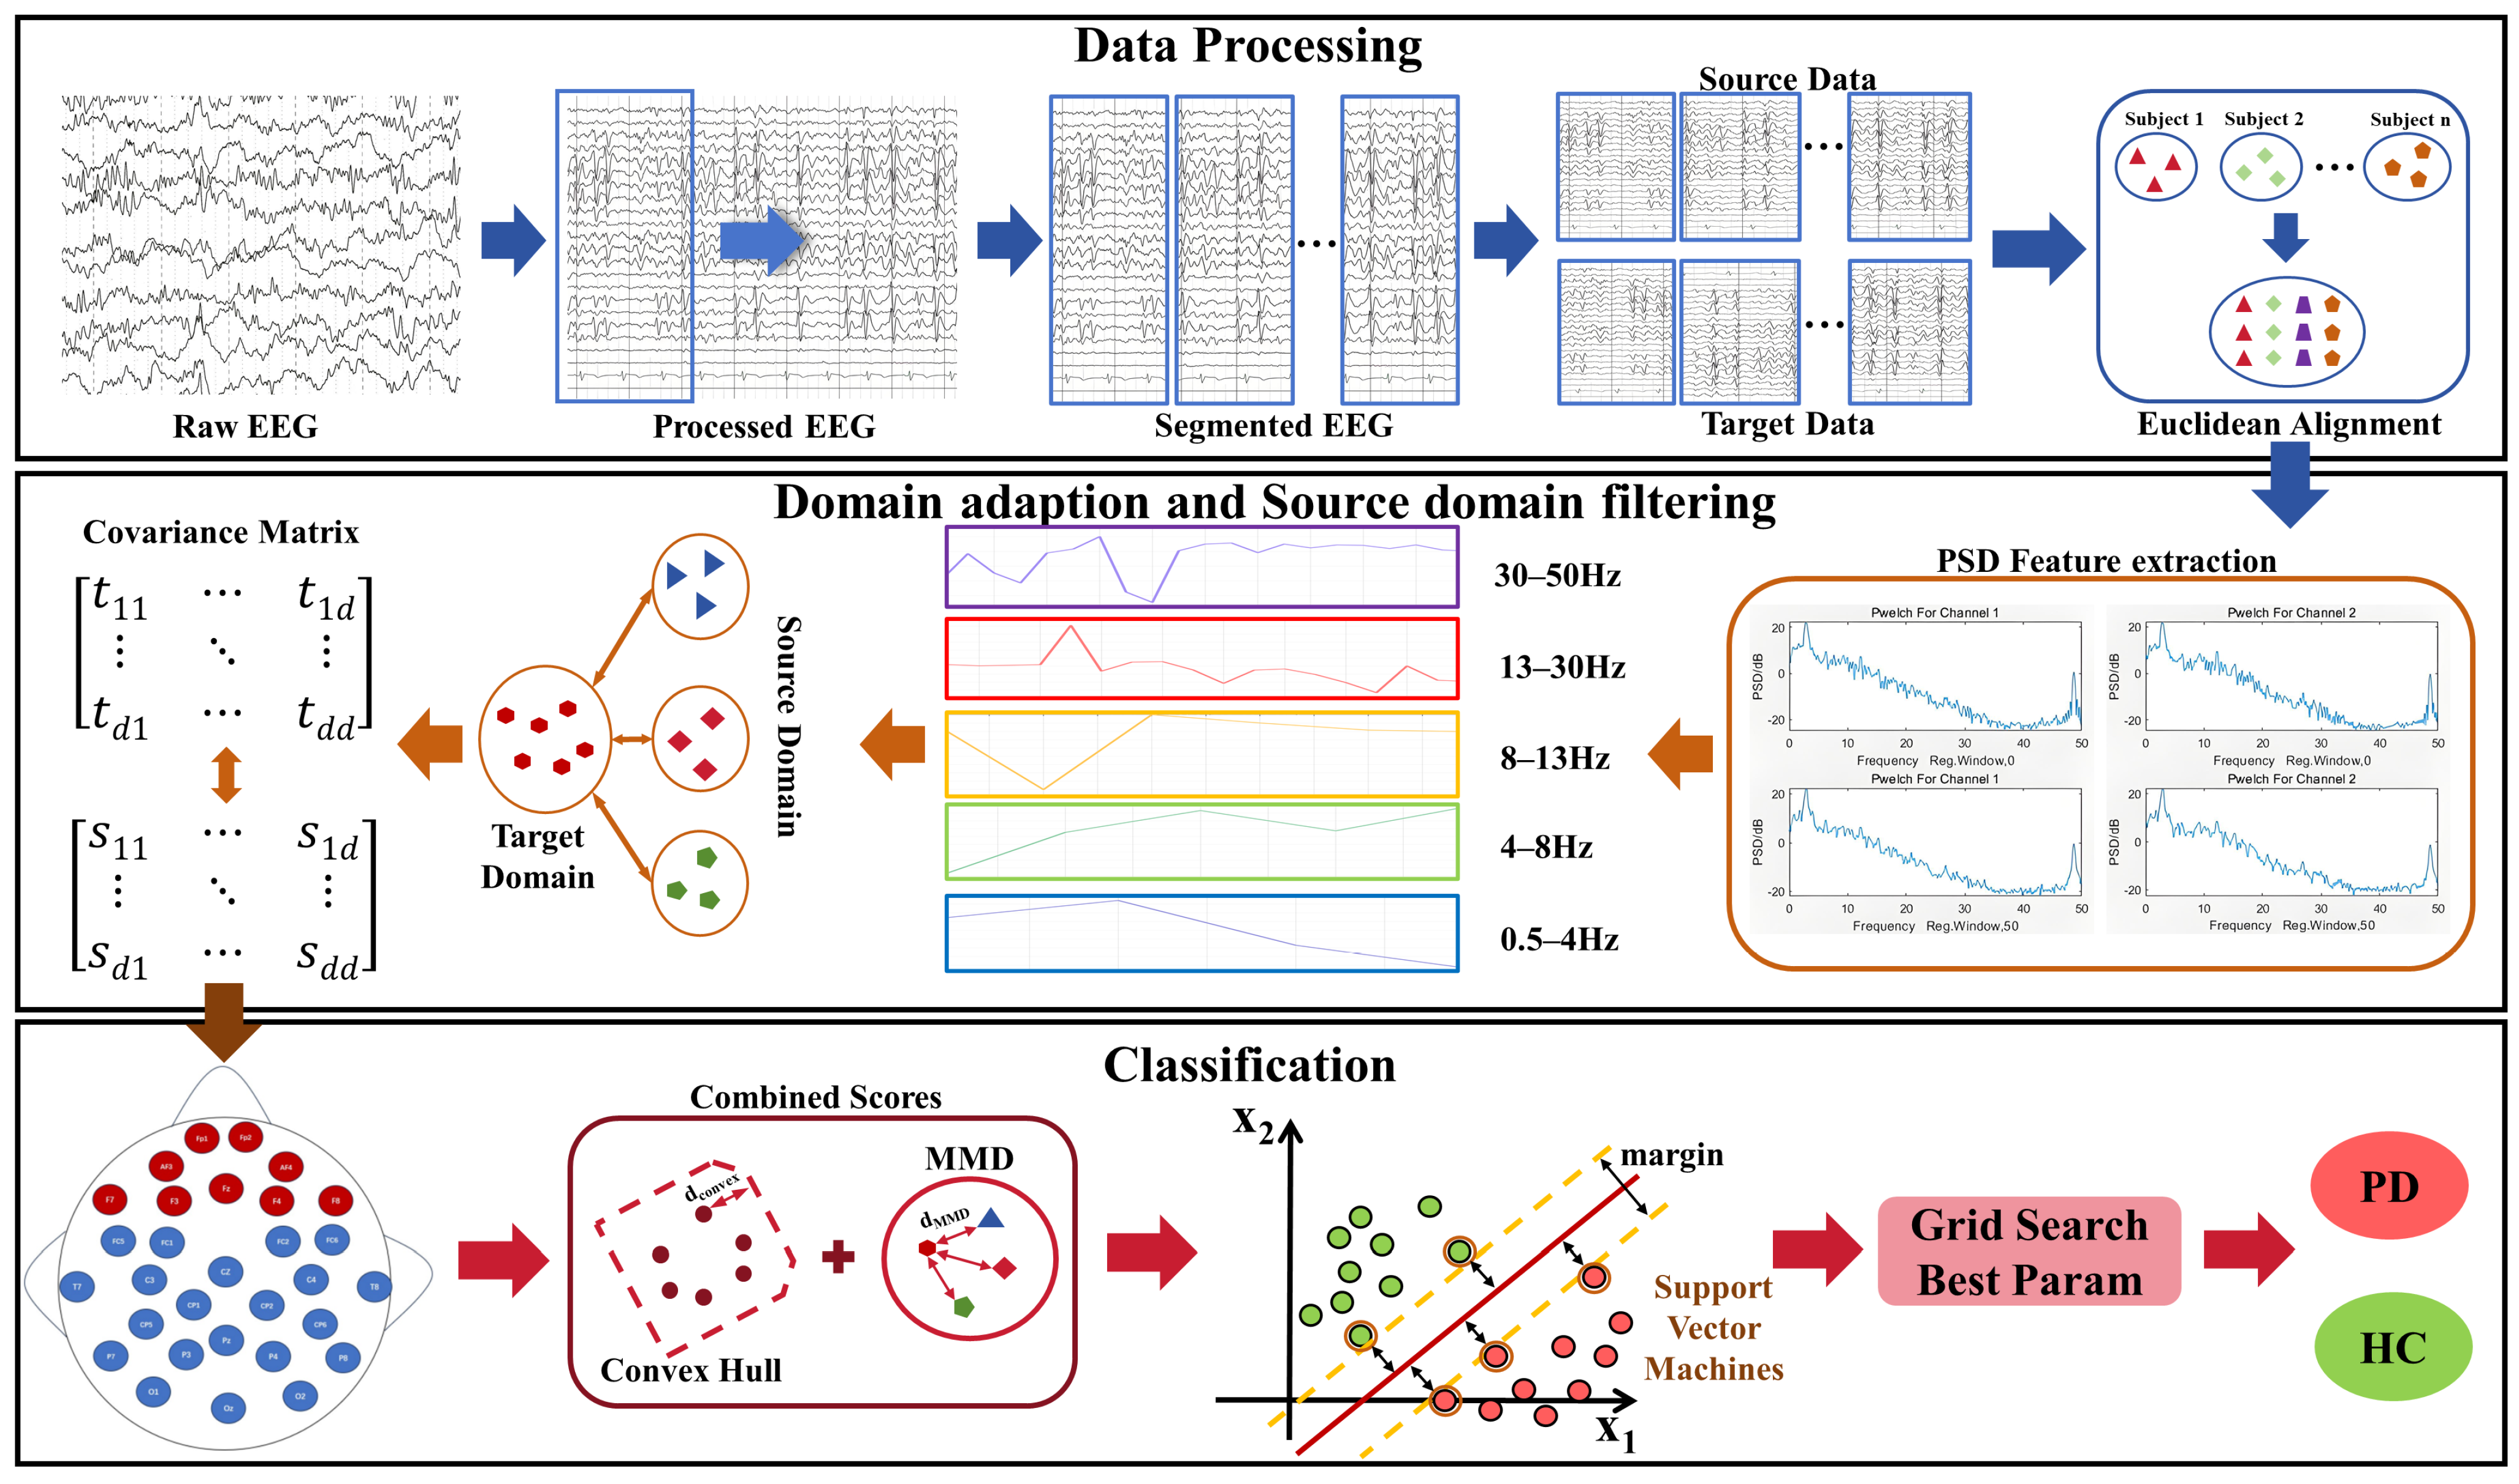
In this section, the allocation and feature extraction of the source domain and the target domain of the dataset are introduced, and the ICMMD method is introduced. As shown in Figure 1. After preprocessing and Euclidean alignment, the features of the source domain and target domain were extracted using power spectral density (PSD) and divided according to five frequency bands. Source domain sample screening was carried out through the improved convex hull and maximum mean difference (ICMMD) method: Firstly, calculate the covariance matrix difference between the source domain and the target domain, and select the key feature dimensions. Then, construct the convex hull of the target domain features and calculate the distance from the source domain samples to the convex hull and the maximum mean difference (MMD) between the source domain and the target domain. Combine these two distances for screening to select the source domain samples that are most similar to the target domain. The SVM classifier is input for cross-dataset classification of Parkinson’s disease.
Figure 1.
Experimental flow chart. Band-pass filtering was applied to the EEG signals first, and then the extracted specific time window. After EA and ICMMD, features were then classified by SVM.
3.1. Euclidean Alignment (EA)
The EA method is an approach designed to align EEG data in Euclidean space, making the distribution of data more similar across different subjects [40]. The entire EA algorithm consists of two main components. Suppose a subject has n trials. First, the reference matrix is computed as follows:
where is the covariance matrix of the i-th EEG trial of this subject. And is the arithmetic mean of the covariance matrix of all trials from this subject. Then, alignment can be performed by
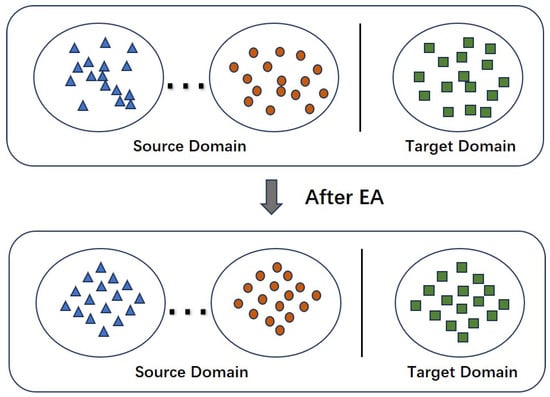
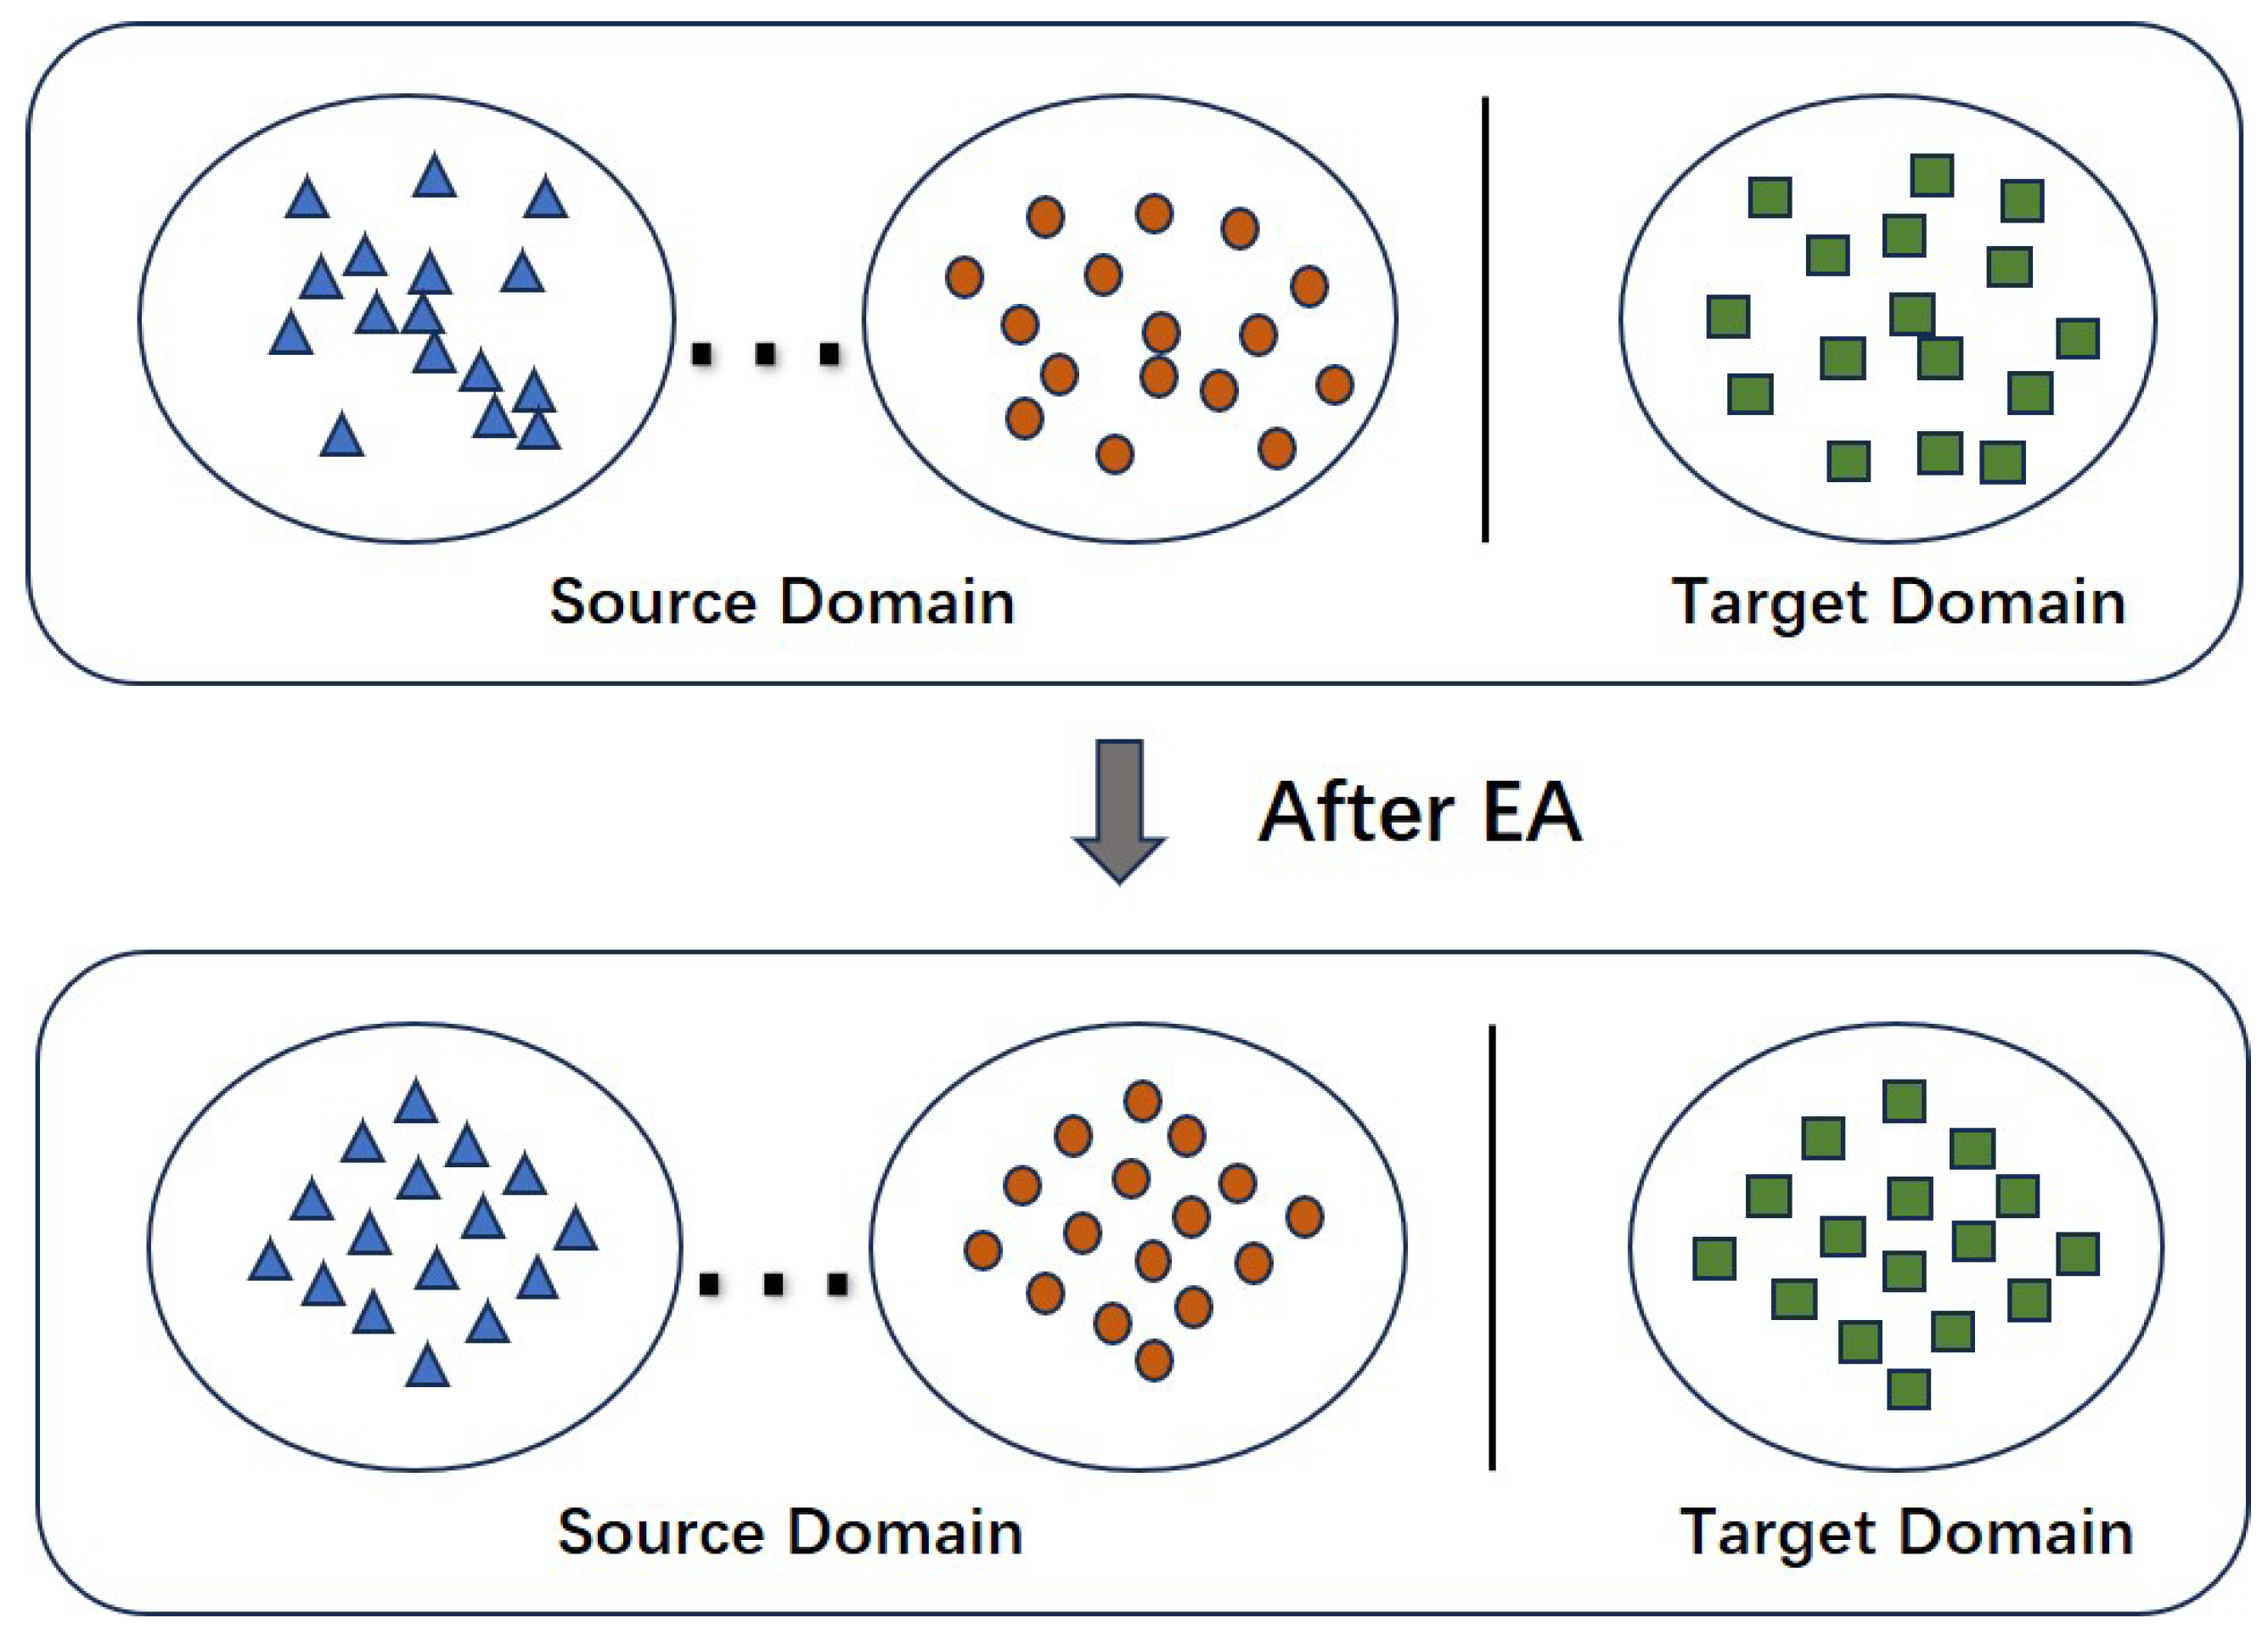
After the EA as show in Figure 2, the arithmetic mean of the new covariance matrix of all trials from this subject is shown below,
the mean covariance matrix of each subject is equal to the identity matrix, according to the above formulas. Therefore, the differences between subjects are reduced.
Figure 2.
The distribution of domain samples changes after EA.
3.2. Source Domain Partitioning and Feature Extraction
In this paper, the method of multi-source domain to single target domain is adopted to increase the data amount of source domain samples in order to better adjust the model. For all source domain samples and target domain samples , the EA alignment method is used to narrow the spatial distance between source domain and target domain experiments, as shown in Figure 2. Then power spectral density was used to extract the features.
The five frequency band mappings are set as
where F(delta) = [0.5, 4], F(theta) = [4, 8], F(alpha) = [8, 13], F(beta) = [13, 30], F(gamma) = [30, 50], Unit (Hz).
A single test for a single channel is , where c is some channel, t is some trial. Welch’s method was used to calculate the power spectral density characteristics of each channel test.
The signal is divided into K overlapping segments, and window function is used to obtain the window signal in each segment:
where L is the length of each segment, S is the overlap length and w(t) is the window function. In the experiment, the paper used a Hamming window.
Calculate the FFT for the windowed signal and the average power spectral density:
where k is the k-th window.
After extracting the features, maximum and minimum value normalization is used to constrain the features:
where is the minimum value and is the maximum value in the trial.
3.3. Improved Convex Hull and Maximum Mean Discrepancy (ICMMD)
Then Improved Convex Hull and Maximum Mean Discrepancy (ICMMD) method is proposed to select the source domain tests. The feature dimension is reduced according to the covariance matrix of source domain and target domain.
For source domain features and target domain features , calculate the covariance matrices:
and calculate the difference in covariance between source and target domain features:
Select the first N features according to the covariance matrix to obtain and .
Use the following formula to calculate the MMD value:
where is the set of samples from the source domain, is the set of samples from the target domain, is the number of samples in the source domain, is the number of samples in the target domain, is the i-th sample from the source domain , is the j-th sample from the target domain and is the j-th sample from the target domain .
The process of convex hull construction begins by identifying the points with the minimum and maximum x-coordinates, denoted as and . These points are guaranteed to be vertices of the convex hull.
where S is the set of points and is the x-coordinate of point P.
The remaining points are divided into two subsets: those above the line segment and those below it. The line can be represented parametrically or with a linear equation, and the point P is considered above or below based on the sign of the following expression:
For each subset, the algorithm identifies the point farthest from the line segment . This point, , is also part of the convex hull:
where represents the perpendicular distance from point P to the line segment .
After identifying , the remaining points are divided again into two new subsets based on their position relative to the new line segments and . Recursion terminates when there are no remaining points or when the remaining points are collinear. The final convex hull is built by merging the points found in each recursive step.
Given the target domain features , first calculate its convex hull to define the range of the target distribution. Given a feature point p and the vertices of the convex hull , find each vertex from P to the convex shell and take the minimum value.
Regarding the value of , it is defined as the ratio of the distance from the source domain sample to the convex hull of the target domain to the standard deviation of the MMD distances between the source domain and the target domain, which is used to characterize the structural differences in the convex hull and the distribution differences between the source domain and the target domain. Introducing the modified parameter to the MMD distance, combine_scores is used as the test importance ranking index to filter suitable source domain features. Then, the selected features are trained in the classifier as a training set, and the target domain is used as a test for classification verification.
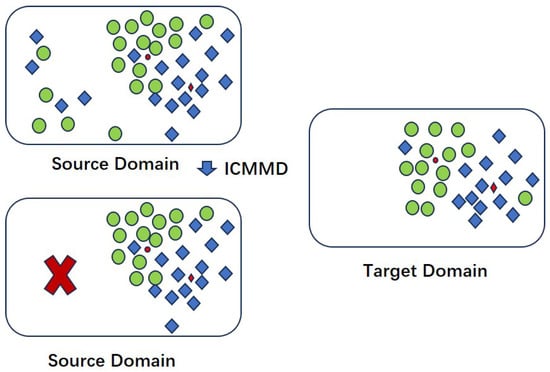
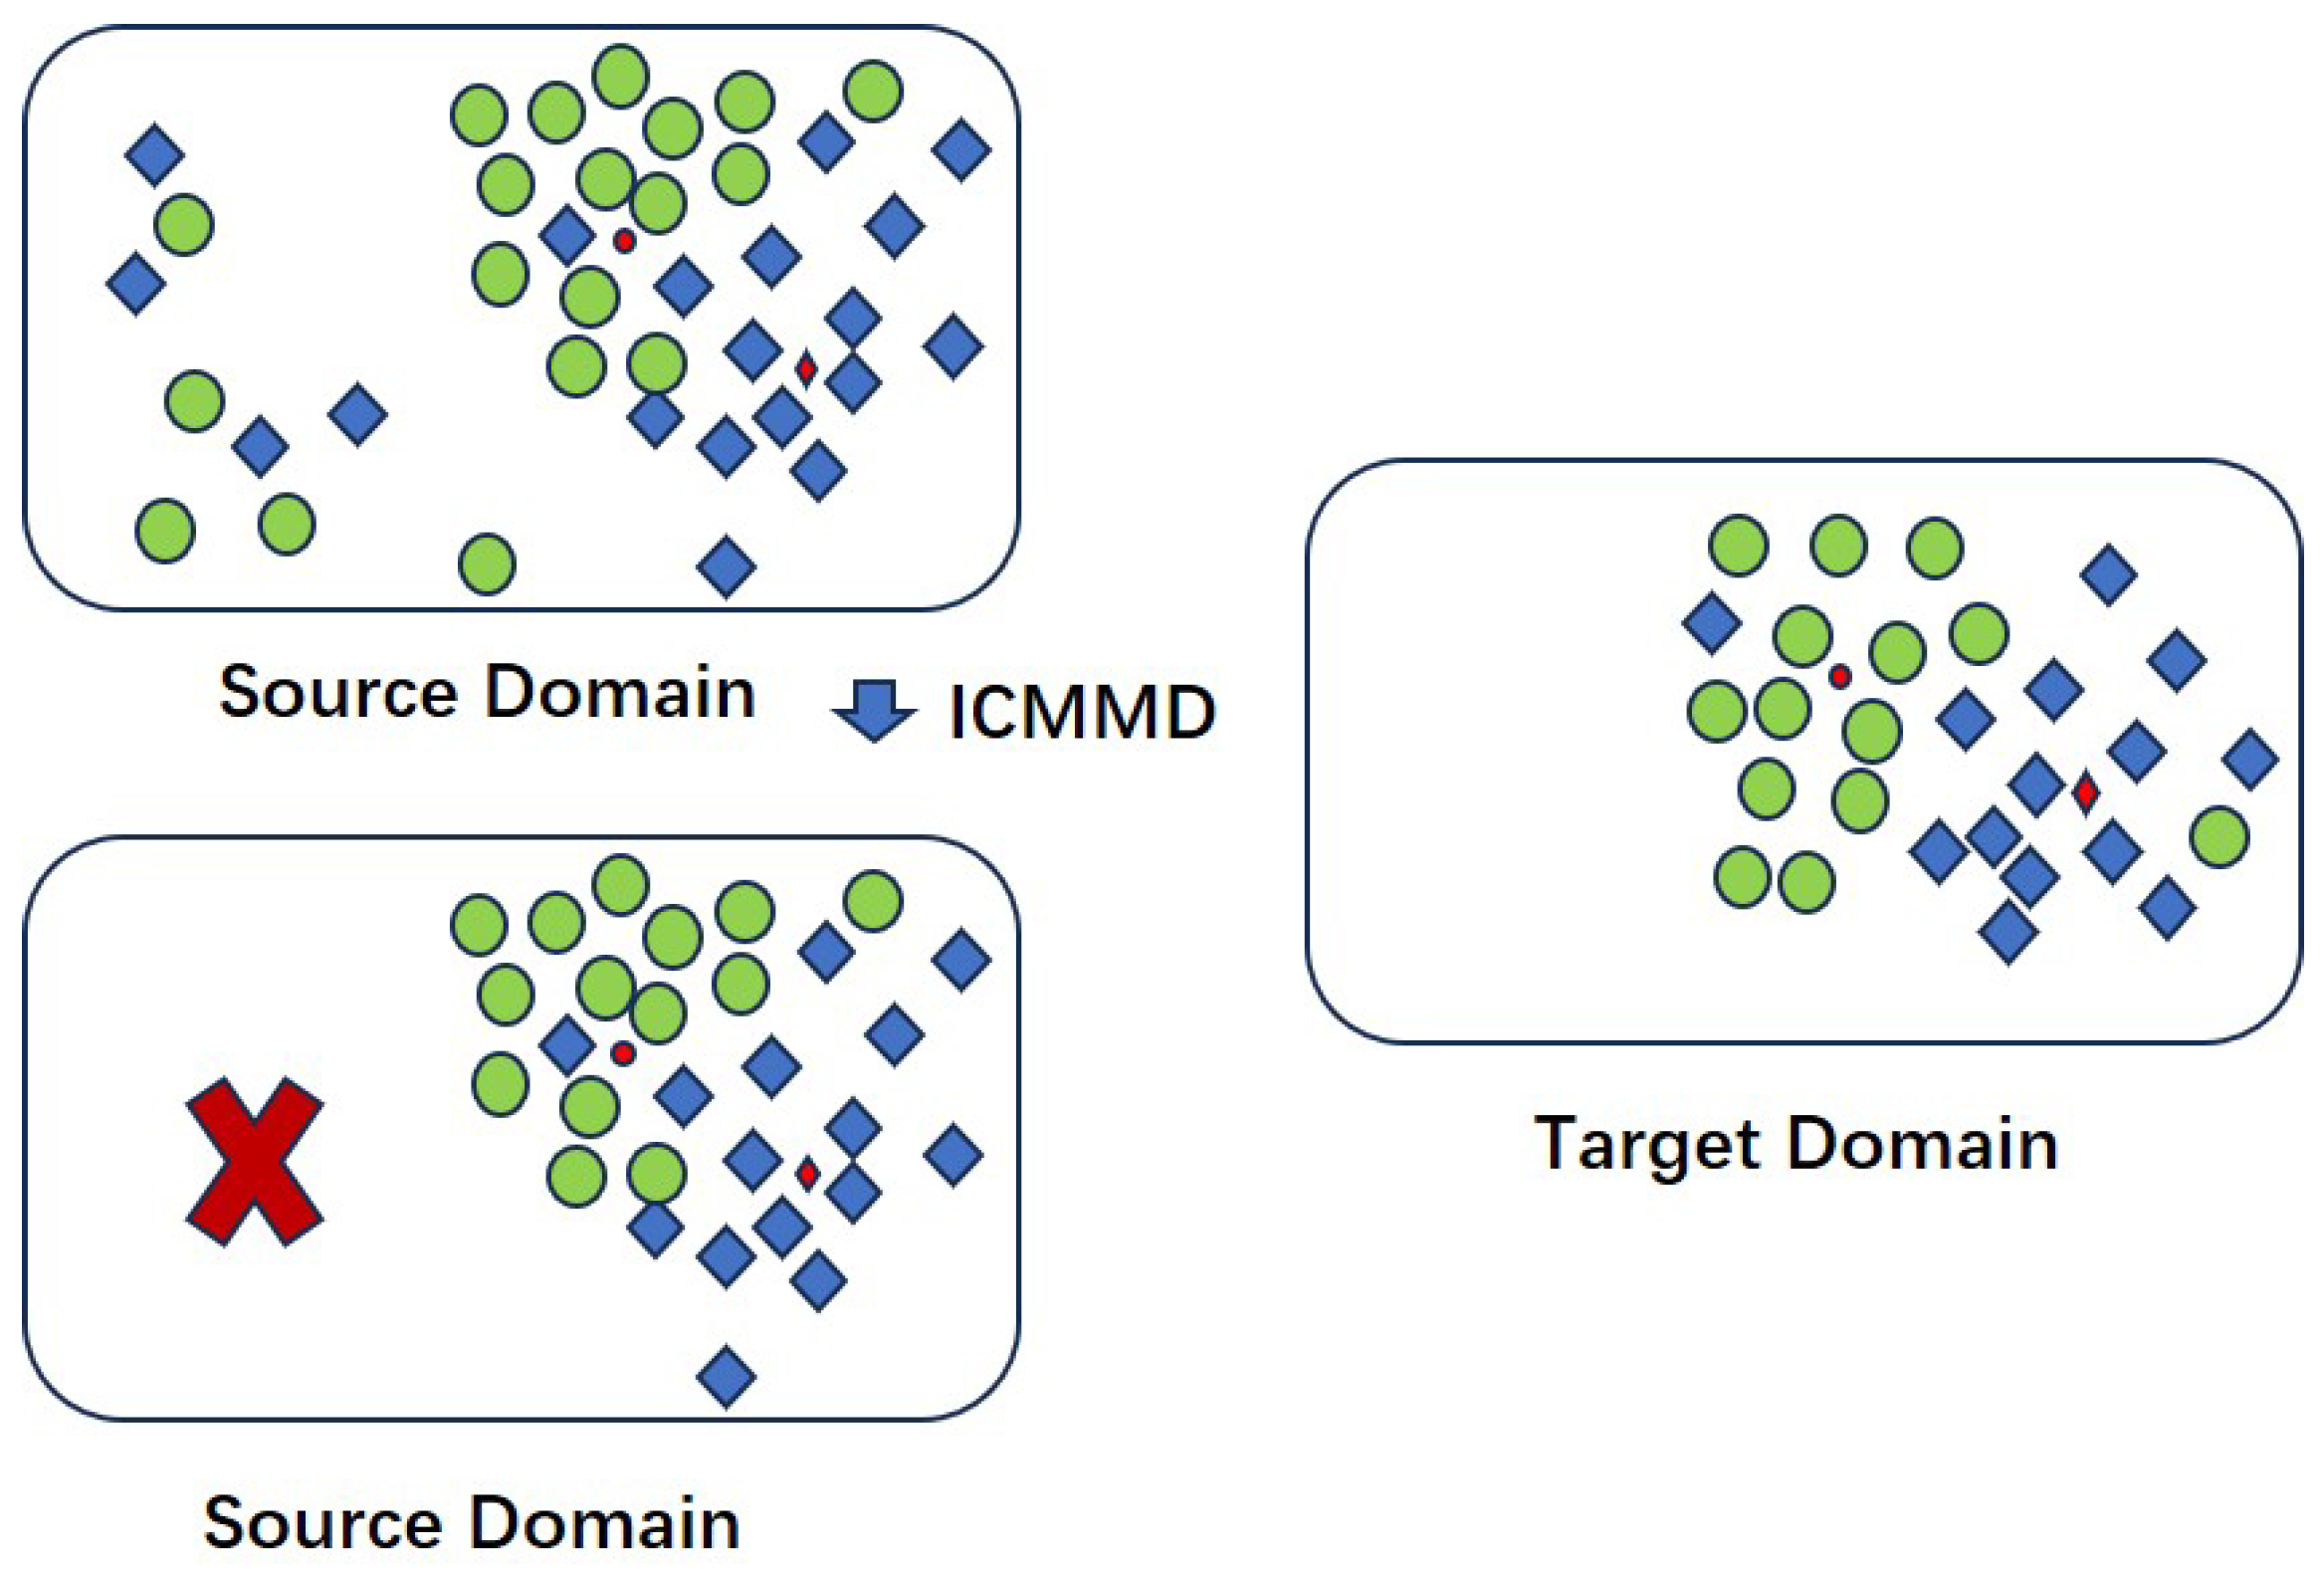
The effect of ICMMD is shown in Figure 3. For the sample screening rate q, we drew on the idea of the optimal ROC threshold. We sorted the normalized combined_score and selected the point with the maximum vertical distance from the diagonal as the optimal threshold, thereby automatically determining the optimal sample screening ratio q.
Figure 3.
ICMMD effect diagram. After ICMMD, the points that are far away from the convex hull target domain are eliminated.
4. Experiment and Result
4.1. Datasets
In this study, three open-source EEG datasets are utilized to evaluate the proposed approaches. The first is the SanDiego dataset [41], containing EEG recordings from 14 PD patients and 16 healthy controls, with detailed demographics in Table 1. The groups were matched in handedness, gender, age, and cognitive ability (MMSE/NAART). PD patients, with disease durations of 3.5–4.5 years, were recorded both ON and OFF medication, while controls had a single session. All data were recorded for at least 3 min at 512 Hz using a 32-channel Biosemi system while participants fixated on a cross.
Table 1.
PD patients vs. controls of different datasets.
The second dataset is UNM [42], comprising 28 PD patients and 28 matched healthy controls. PD patients were recorded in both ON and OFF medication states across two visits. Each participant underwent a 2 min recording (1 min eyes closed, 1 min eyes open) using a 64-electrode Brain Vision system at 500 Hz. For consistency, we used data from 32 channels.
The third dataset, referred to as the Lowpd dataset [9], includes 14 PD patients with Freezing of Gait (FOG) and 14 demographically matched healthy controls. All PD patients were recorded during ON medication state while performing cognitive and pedaling motor tasks, following questionnaire completion (e.g., FOG-Q). Cognitive and motor functions were assessed using MoCA and UPDRS-III.
4.2. Data Preprocessing
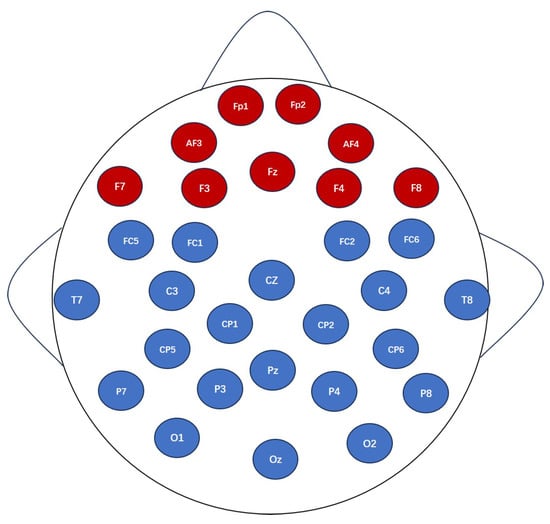
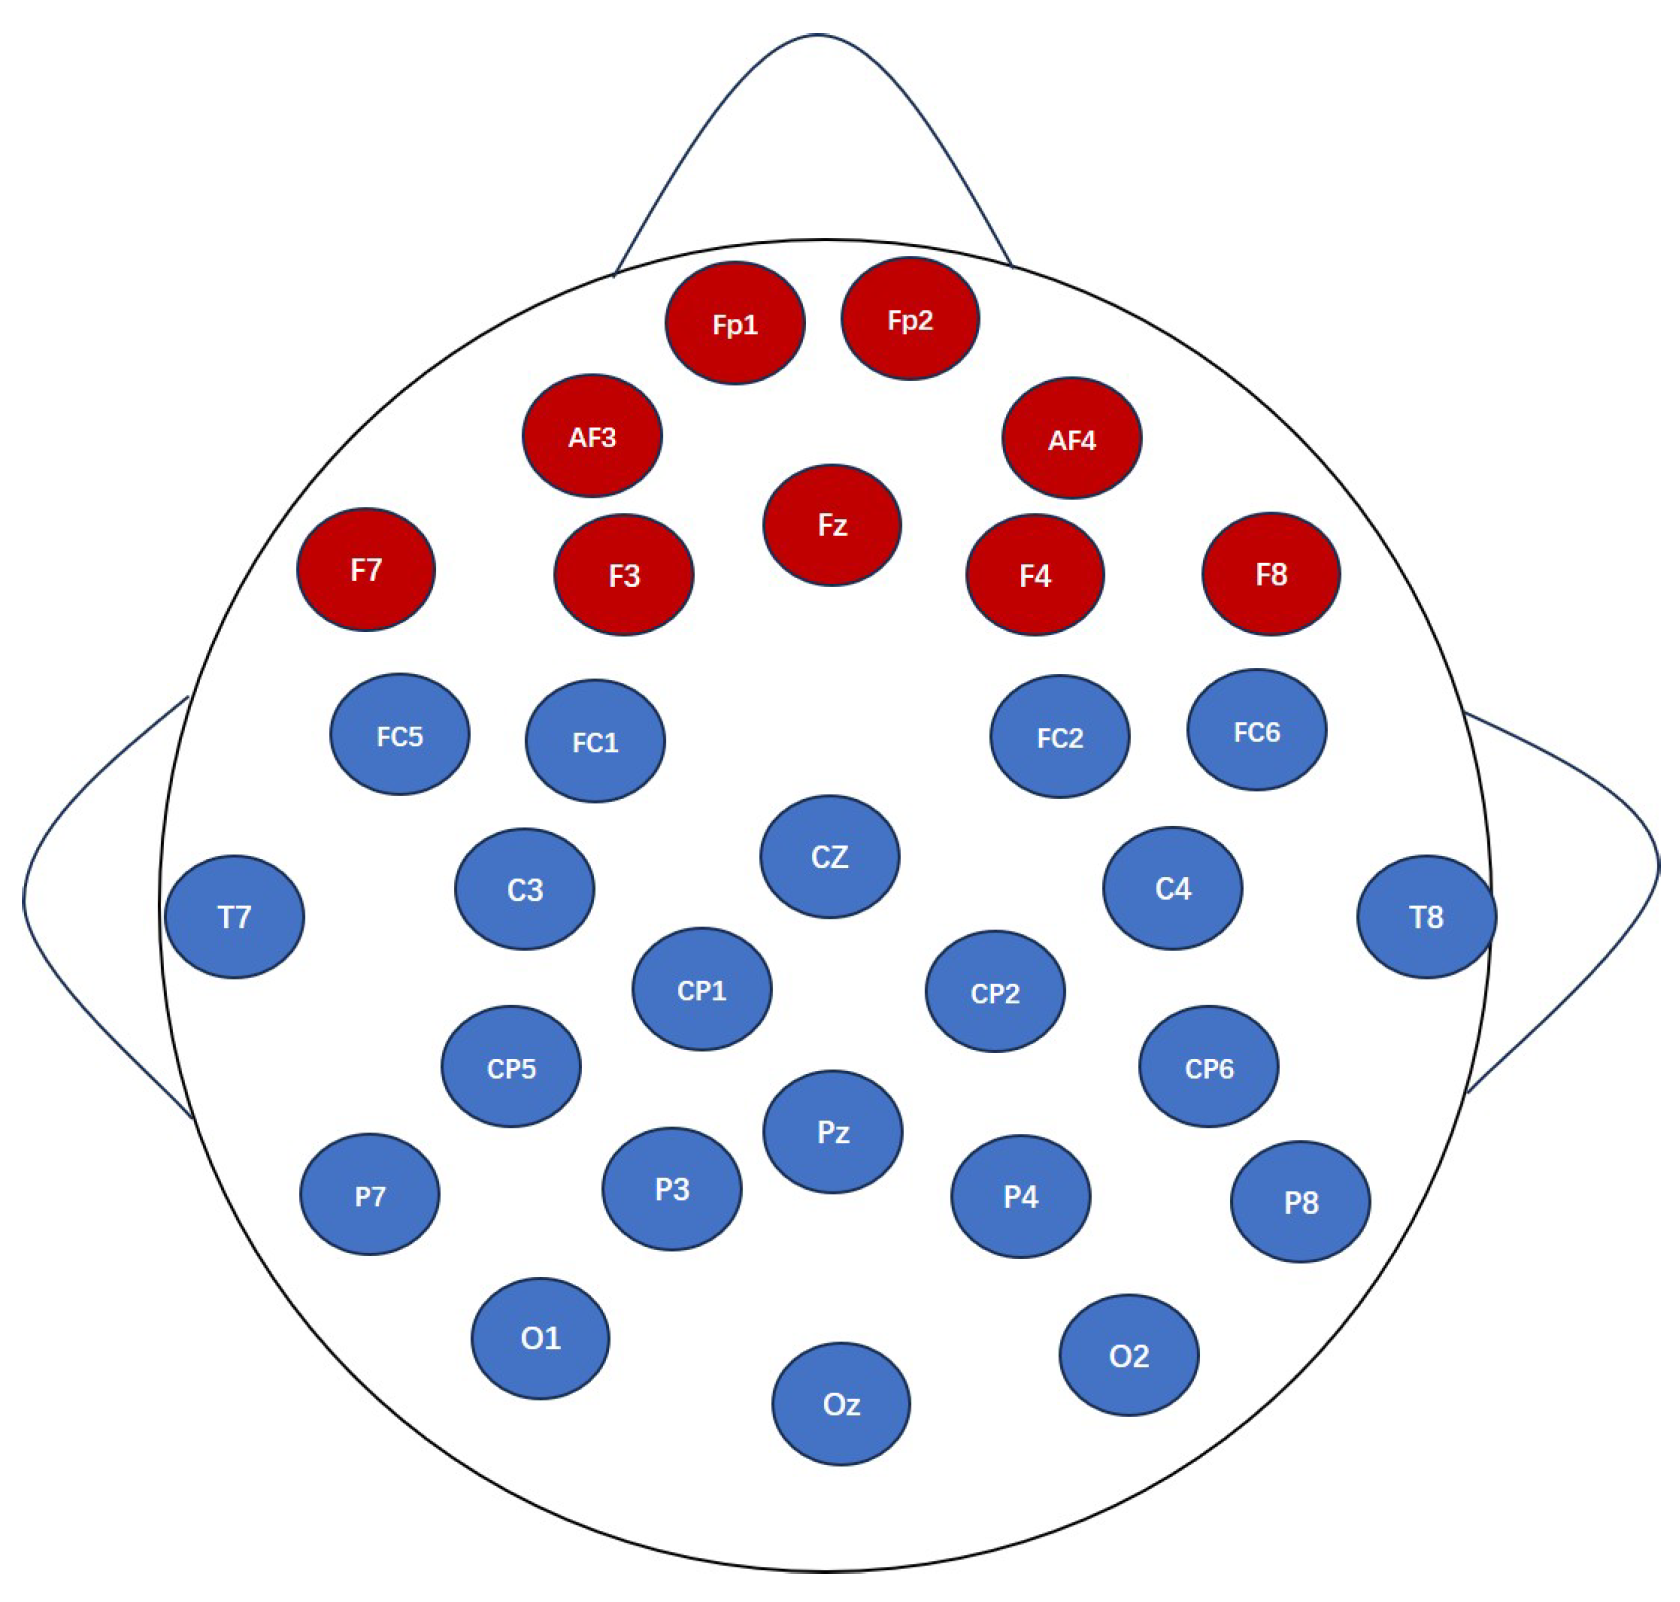
All data is divided into smaller segments, each measuring ch units by 10 s, where ch represents the count of channels. And ICA is used to detect and reject ECG and EOG artifacts based on the EEGLab toolbox. These segments are then subjected to a 0.5 to 50 Hz fifth-order band-pass Butterworth filter to smooth the data and encompass the majority of the power present. According to references [43,44,45,46], theta wave activity in the prefrontal cortex of Parkinson’s disease patients is significantly reduced during cognitive control processes. Meanwhile, the channels from the non-motor cortex of the frontal lobe can be used to express non-motor symptoms (NMSs) of the disease and reduce the possible interference caused by the motor channels. Therefore, the common prefrontal cortex channels in the three datasets are selected and the relevant channels in the central motor sensory area are excluded. As shown in Figure 4, the EEG channels of the three datasets only take the data of the common frontal lobe. After processing, all the trials were segmented into 8 × 10 s trials.
Figure 4.
EEG channel acquisition map of the San dataset, in which the channel marked with red is the frontal lobe channel. In the experiment, the F3 channel data was not used because channel F3 did not exist in the other two datasets.
4.3. Experiment Result
All algorithms are implemented using MATLAB R2022b. The SVM is configured with the parameters kernel type ’rbf’, gamma = 0.33. In the experiment, we extracted the features of the five frequency bands under the frontal channel, placed them under different sample screening ratio q for classification and recognition, and compared them under the three datasets San, UNM and Lowpd, respectively, as shown in Table 2.
Table 2.
The accuracy for different datasets as the target domain.
When San is the target domain and the other two datasets are the source domains, according to the adaptive sample screening rate and model balance parameter calculation method described in Section 3.3, the obtained q = 0.71 and = 0.83. Among them, the beta band has the highest accuracy rate, reaching 77.36. When UNM is taken as the target domain, q = 0.67 and = 0.64. The highest accuracy rate occurred in the beta band, reaching 74.28. When Lowpd is used as the target domain, the highest accuracy of 73.76 is achieved in the theta band at q = 0.7 and = 0.30.
Compared with classical transfer learning methods, the proposed ICMMD approach demonstrates clear advantages, as illustrated in Table 3. The Origin method, which only extracts the power spectrum features of each frequency band and directly performs transfer without explicitly calculating sample differences for alignment and screening, yielded unsatisfactory results. This outcome strongly indicates the necessity of conducting source domain screening and target domain alignment before knowledge transfer. Furthermore, traditional linear subspace methods, such as TCA, did not achieve ideal performance when training and testing this cross-dataset model. Similarly, CORAL’s performance on the Parkinson’s dataset was not outstanding, suggesting that not all general domain adaptation methods are inherently suitable for the current application of Parkinson’s cross-dataset recognition. In contrast, ICMMD consistently achieves a relatively high accuracy rate across most frequency bands. This superior performance validates the high adaptability of ICMMD to Parkinson’s disease datasets and confirms that its combined geometric and statistical sample screening effect is superior to that of the compared models.
Table 3.
The accuracy of different methods.
The results in Table 4 and Table 5 shows the combined effects of feature extraction methods and classifiers. The results demonstrate that PSD significantly performs better than sample entropy in Parkinson’s disease EEG analysis, primarily because PSD more effectively captures energy distribution characteristics across different frequency bands, which are closely related to the neurophysiological changes in Parkinson’s disease. In contrast, sample entropy mainly reflects signal complexity and is more sensitive to individual differences in cross-dataset scenarios, limiting its generalization capability. Among classifiers, SVM shows clear advantages due to its ability to construct optimal decision boundaries in high-dimensional feature spaces, making it particularly suitable for handling the small-sample, high-dimensional nature of EEG signals. KNN is vulnerable to cross-dataset distribution shifts, while LDA’s assumption of normal data distribution is difficult to satisfy with real-world EEG data. The PSD-SVM combination not only enables effective extraction of frequency-domain features but also optimizes classification boundaries through structural risk minimization, explaining its superior performance in cross-dataset Parkinson’s disease classification tasks.
Table 4.
The accuracy of different classifier.
Table 5.
The accuracy of sample entropy.
5. Discussion
5.1. Analysis of Parameter
In the ICMMD method, parameter achieves adaptive balancing between convex hull geometric structure and distribution statistical characteristics through innovative design. not only regulates the weight of geometric distances from source domain samples to the target domain convex hull, but more importantly, establishes a dynamic coupling mechanism between two heterogeneous feature spaces. This design carries profound theoretical significance: convex hull distance precisely captures geometric structural similarity in feature space, while MMD distance effectively quantifies inter-domain distribution differences, forming a comprehensive domain adaptation evaluation system through their complementary relationship.
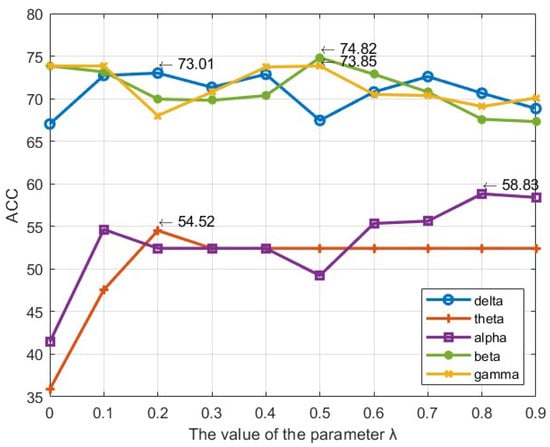
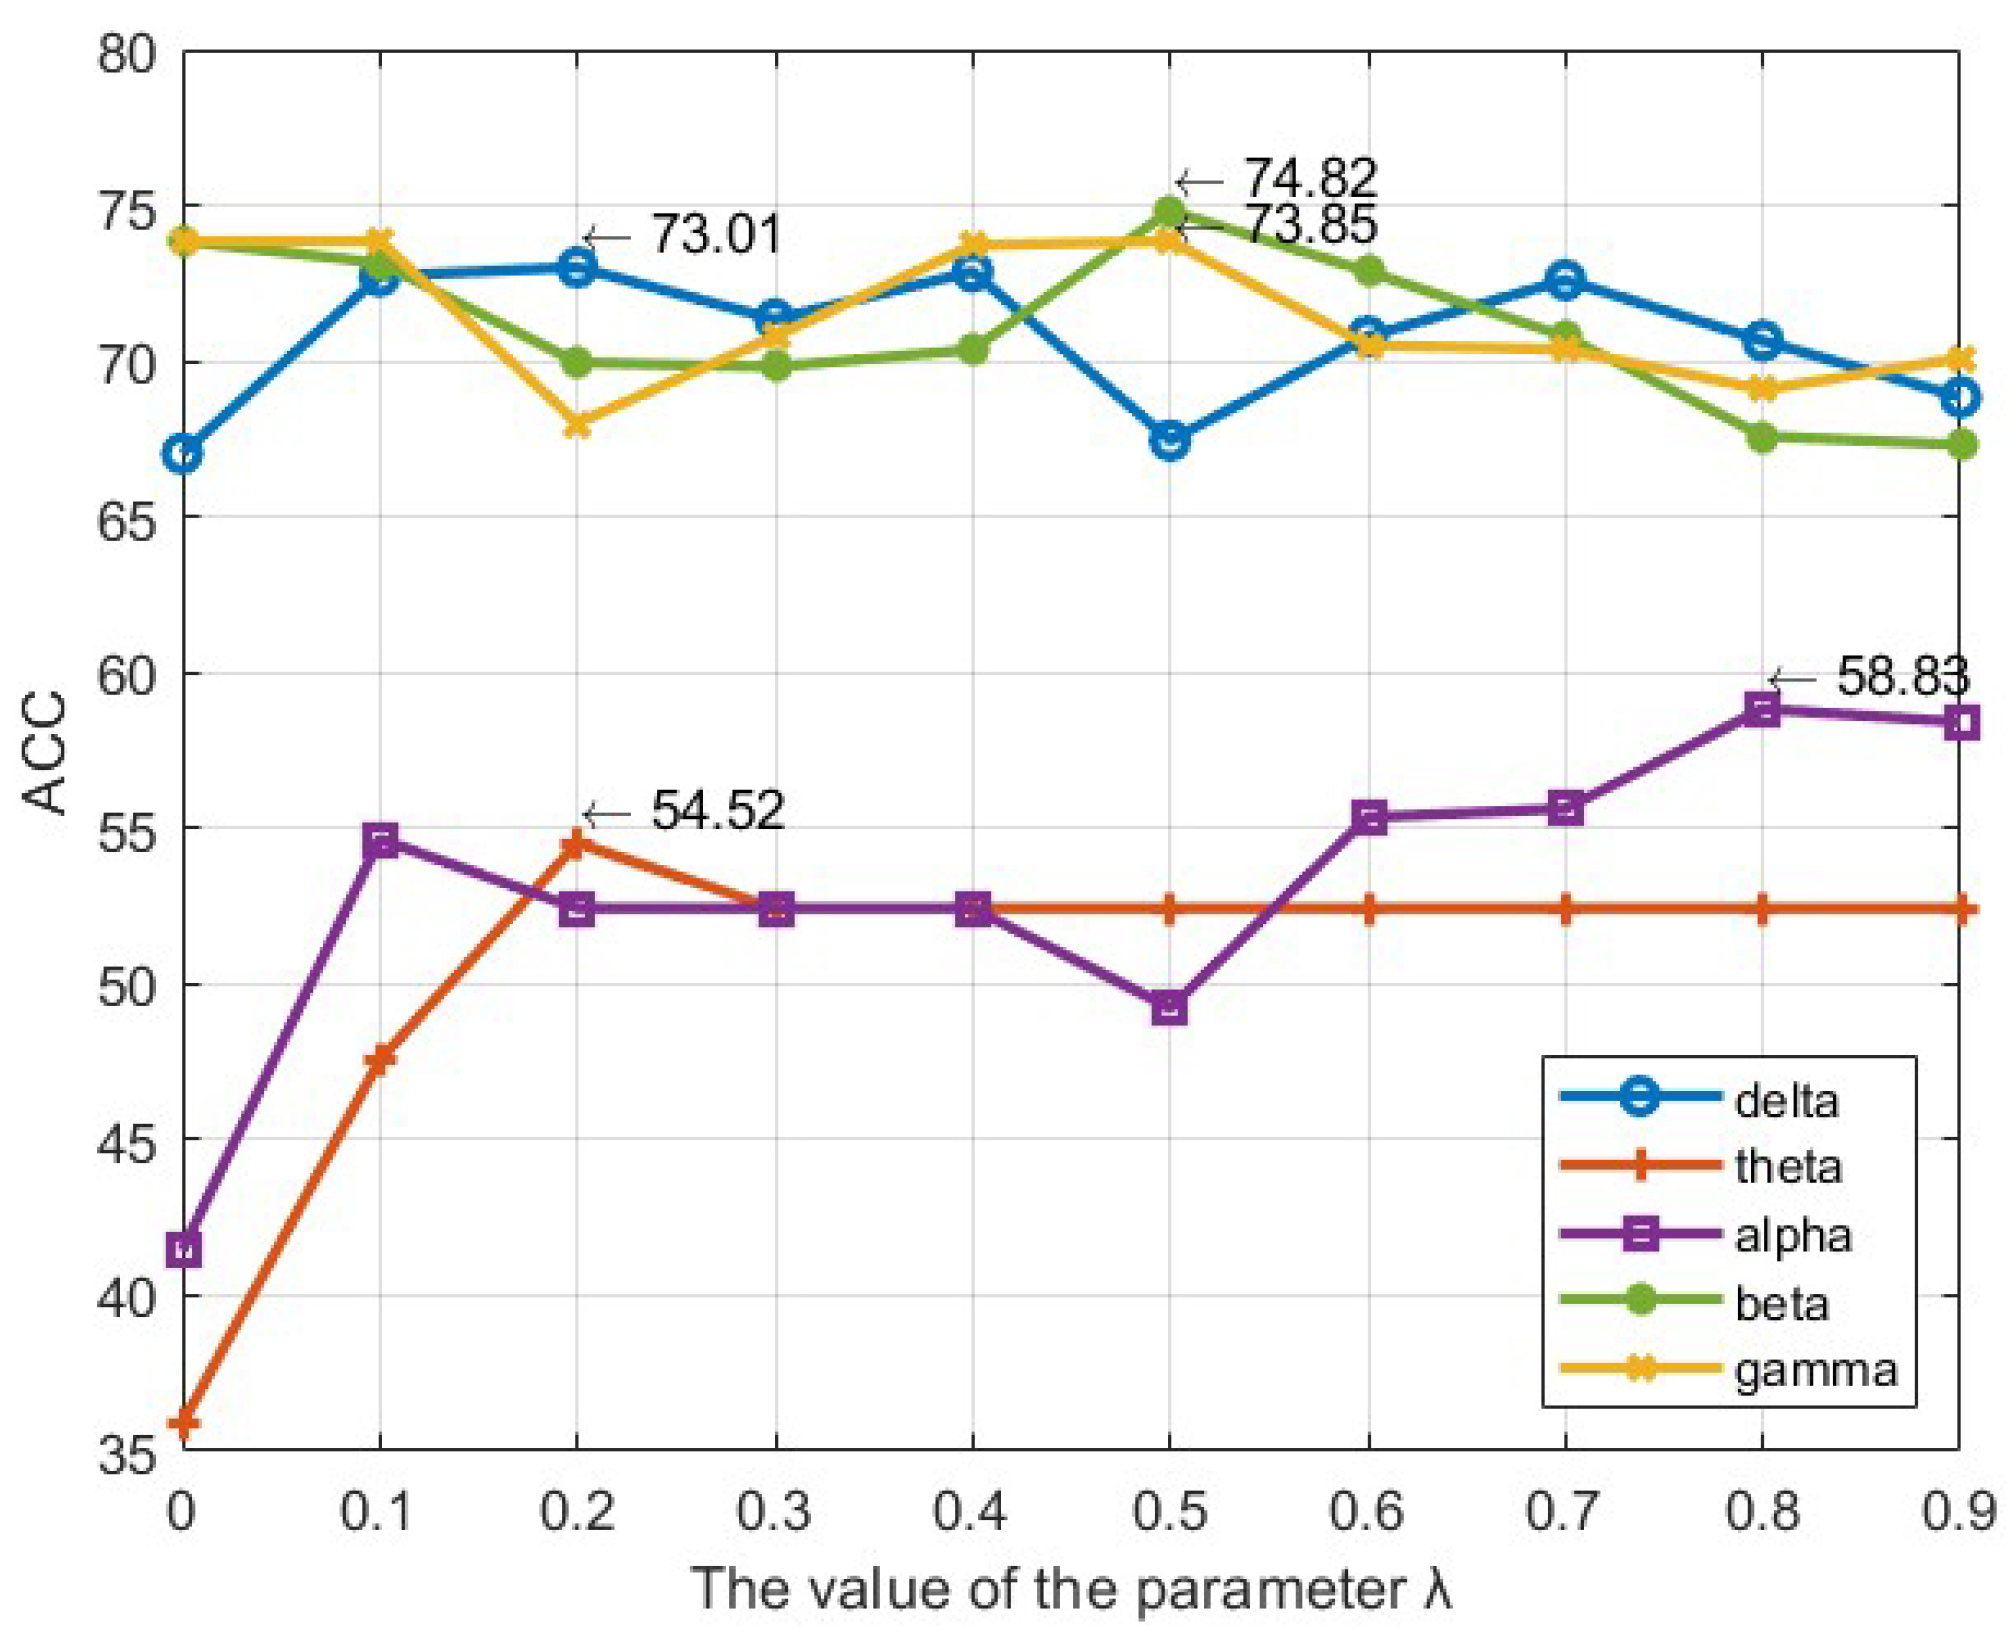
As shown in Figure 5, experiments on the San dataset (q = 0.8) reveal significant differences in sensitivity to across frequency bands, uncovering the frequency-specific transfer patterns of EEG signals. When = 0 (relying solely on convex hull distance), performance significantly deteriorates in delta and theta bands, indicating that single geometric metrics cannot adequately represent the complex distribution characteristics of these frequency bands; conversely, convex hull distance dominates in the gamma band. Based on the standard deviation ratio between source-to-target convex hull distances and MMD distances, we determined = 0.83 as the optimal parameter. At this value, the alpha band accuracy improves by nearly 10% compared to its minimum value, while the average accuracy across all frequency bands reaches its peak at 64.7%, achieving globally optimal performance. This adaptive balancing mechanism transcends the limitations of traditional single-distance metrics, providing a novel theoretical framework and technical pathway for cross-domain classification of small-sample medical signals.
Figure 5.
The accuracy of corresponding lambda in different frequency bands. Arrows show the highest.
5.2. Sample Screening Rate Control
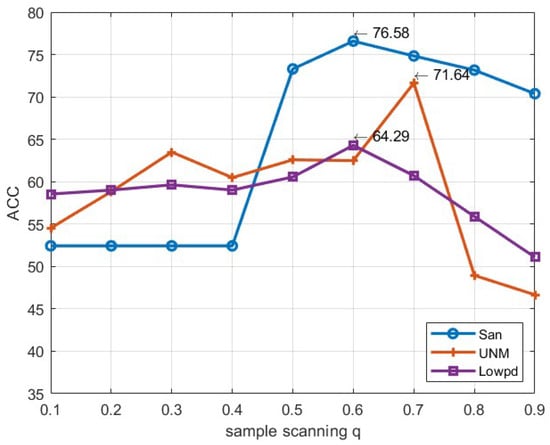
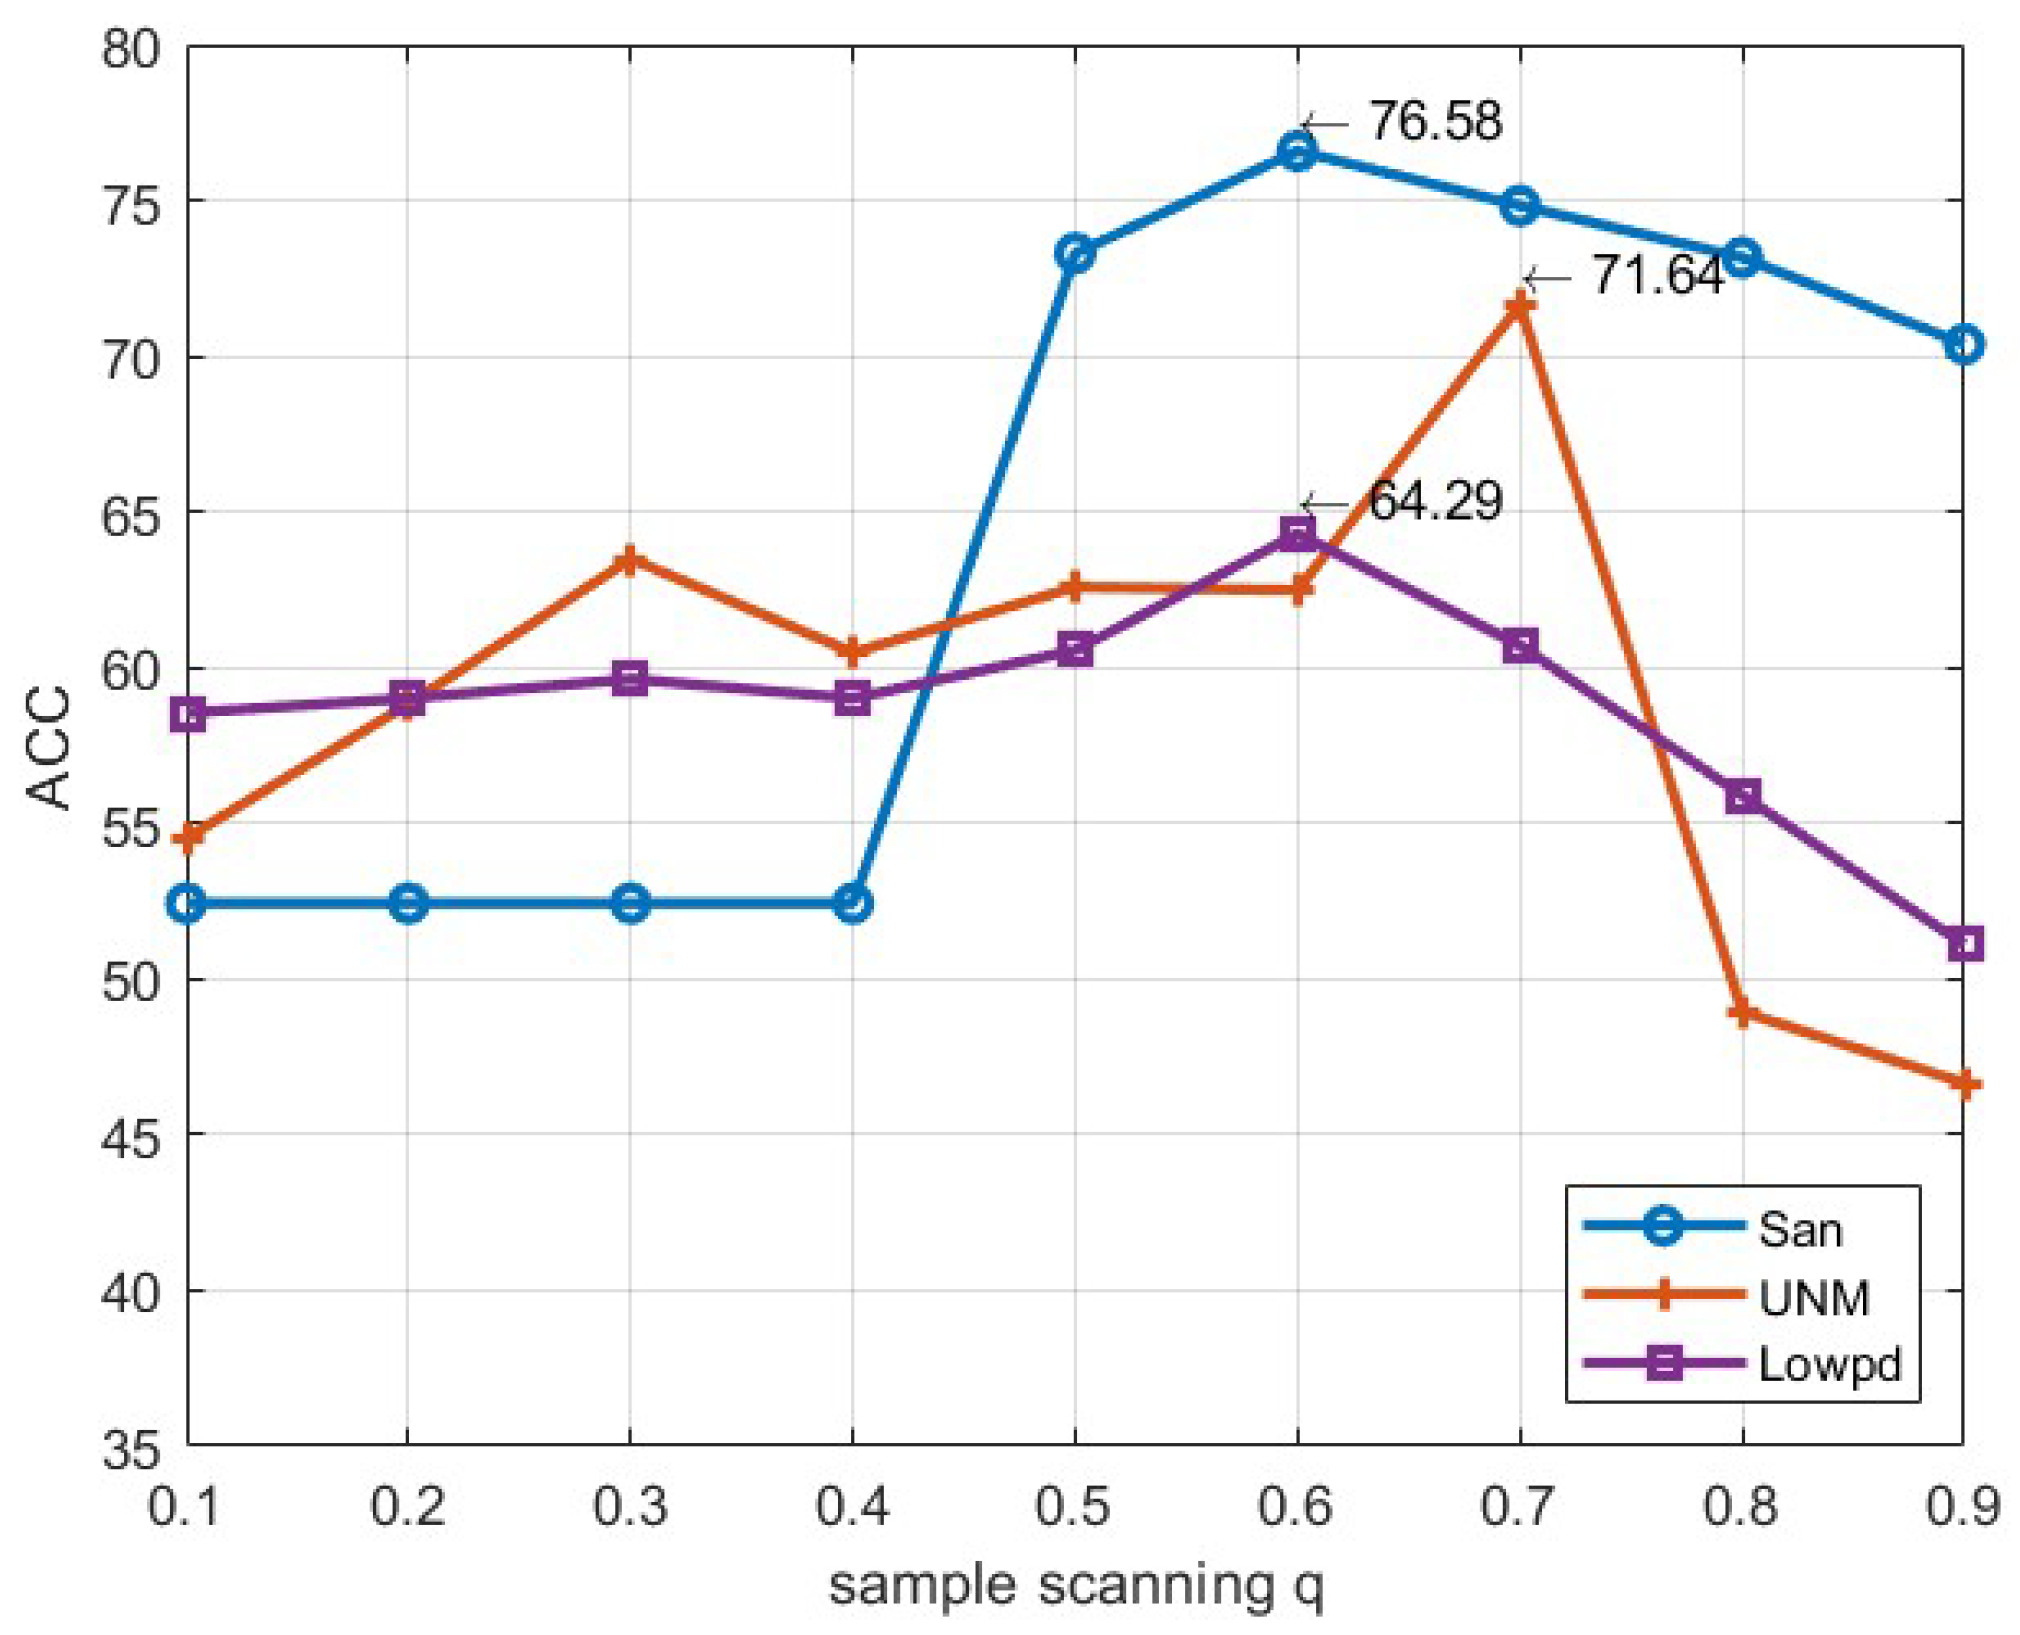
Due to the different sizes and collection times of various datasets, the number of trainable samples in the source domain or target domain also varies. Therefore, we introduced a sample screening rate to screen the source samples and analyze its impact on the experimental results. The sample screening ratio q serves as a critical parameter balancing the quantity and quality of source domain samples. As shown in Figure 6, for the beta band, classification performance across all three datasets shows limited improvement at low q values, but exhibits significant accuracy leaps when q reaches dataset-specific thresholds. Because some of the differences between the datasets are too large, the disparate samples have not been filtered out, resulting in too high redundancy among the datasets. This reveals that cross-dataset transfer learning leads to low model learning efficiency when the unfiltered source domain samples contain a large number of noise samples with significant differences in distribution from the target domain.
Figure 6.
The accuracy curve of beta band under the change in q. Arrows show the highest.
Notably, when q varies at 0.1 precision intervals, approximately 200 samples are added or removed per adjustment (given 1700 total source samples), causing substantial accuracy fluctuations. This coarse-grained screening mechanism compromises clinical application stability. Future work will optimize q selection precision to the 0.01–0.005 level, ensuring sample quantity variations remain within 20 per adjustment, thereby enhancing clinical applicability of our method. This work provide crucial insights for small-sample medical signal processing: parameter sensitivity analysis not only guides parameter selection during clinical deployment but also lays the foundation for building adaptive parameter optimization frameworks, which holds profound significance for advancing transfer learning applications in personalized medicine.
5.3. Effectiveness of the Improved Convex Hull
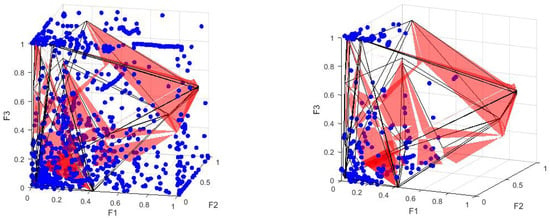
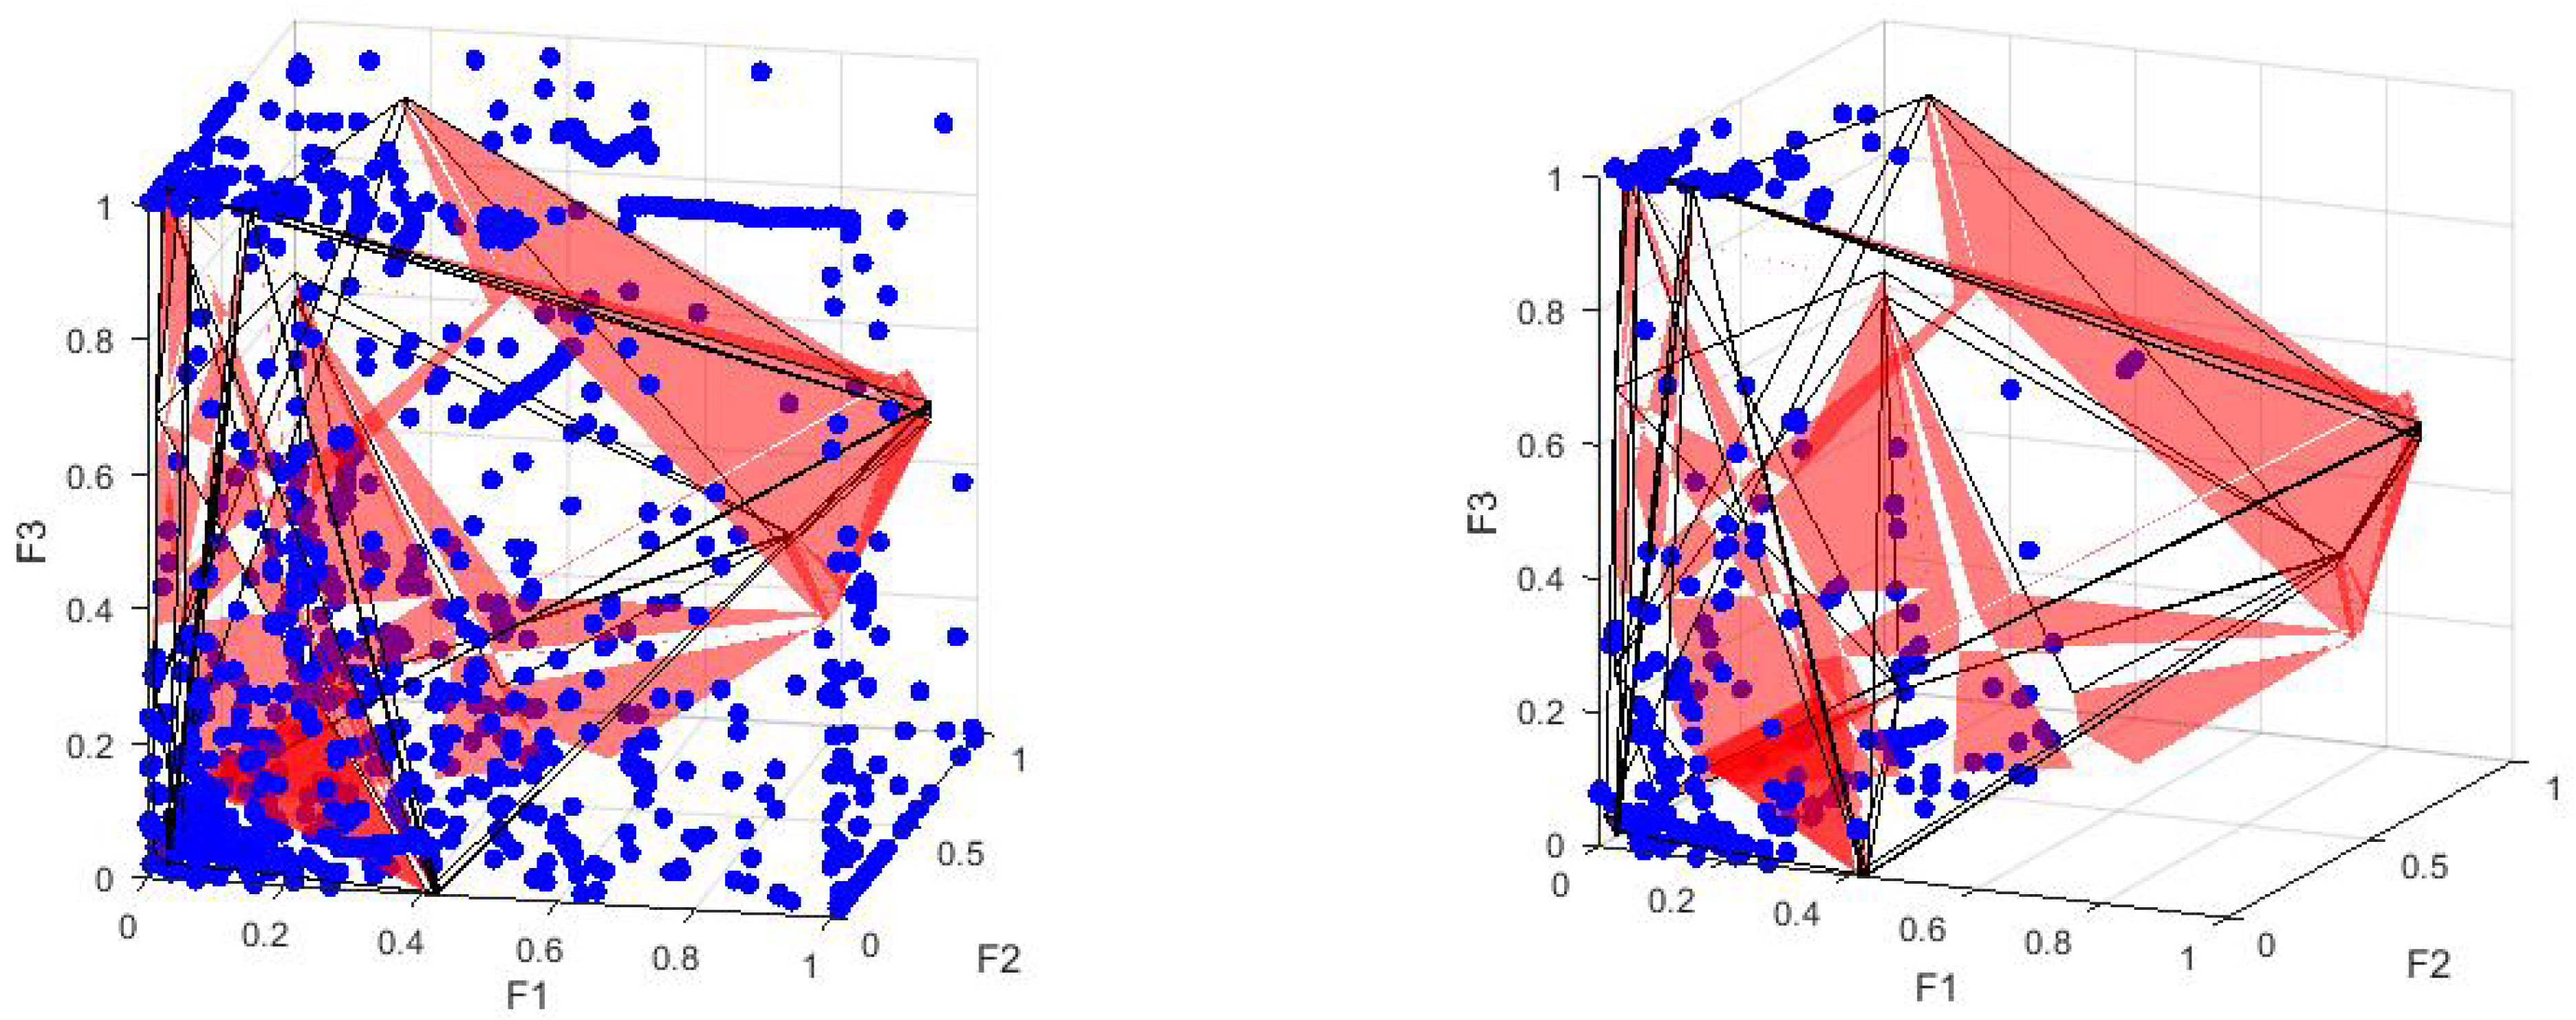
The ICMMD method proposed in this study innovatively integrates convex hull theory with the transfer learning framework, providing a breakthrough solution for the classification of electroencephalogram (EEG) signals across datasets. As shown in Figure 7, when the sample screening rate is 0.6, the ICMMD method demonstrates outstanding feature selection ability. The blue dots in the figure represent the feature points of the source domain samples, which are distributed in the three dimensions of F1, F2 and F3. In traditional methods, the convex hull constructed in the target domain cannot contain most of the feature points of the source domain, and similar features are mainly concentrated in the F2–F3 plane and a small range of the F1 plane region. The ICMMD method accurately identifies and retains the source domain samples that are most similar to the target domain distribution by combining MMD with geometric structure constraints, effectively eliminating distribution shifts across datasets. This is conducive to solving the domain adaptation problem and establishing a new sample screening paradigm that combines geometric structure with statistical distribution. Experiments have proved that this method significantly enhances the generalization ability of the model while retaining key discriminative features, providing reliable technical support for the early diagnosis of neurodegenerative diseases and marking a milestone in promoting the application of brain–computer interfaces in clinical diagnosis and treatment.
Figure 7.
Convex hull diagram before and after ICMMD. ICMMD screens out most of the points distributed outside the convex hull, which makes the remaining source-domain tests less different from the target domain.
6. Conclusions
This study introduces a novel transfer learning method, ICMMD, which integrates convex hull geometry with maximum mean discrepancy (MMD) to address cross-dataset variability challenges in EEG-based Parkinson’s disease classification. By synergistically combining Euclidean alignment with convex hull-based source domain selection, our approach effectively minimizes inter-subject and cross-dataset distribution discrepancies while preserving discriminative features essential for accurate classification. Comprehensive experimental validation across three independent datasets—LowPD, San, and UNM—demonstrates consistent performance improvements across diverse brain regions and frequency bands, confirming the robustness and adaptability of our framework.
Furthermore, our innovative integration of geometric structural constraints with statistical distribution alignment offers a paradigm shift in source domain preprocessing for transfer learning. This dual perspective enables more precise identification of transferable features, significantly enhancing the model’s ability to capture subtle EEG patterns associated with Parkinson’s disease across datasets.
However, our approach has several limitations that warrant attention. The parameter selection strategy requires further refinement, and while single PSD features demonstrate effectiveness, they provide limited representation of Parkinson’s disease neural activity patterns. Looking ahead, future research will focus on refining our adaptive parameter selection mechanisms, attempt multi-scale feature fusion and more advanced deep learning models to enhance the effectiveness of our framework. We also plan to address current limitations in sample screening precision that contribute to result fluctuations, particularly through improved optimization algorithms for automatic parameter determination. These will help to bridge the gap between transfer learning and clinical practice, ultimately contributing to earlier diagnosis and personalized treatment strategies for Parkinson’s disease and related neurodegenerative disorders.
Author Contributions
Conceptualization, Y.G.; methodology, X.W.; software, X.W. and W.G.; validation, X.W. and W.G.; formal analysis, X.W. and J.L.; writing—original draft preparation, X.W.; writing—review and editing, J.L.; supervision, Y.G.; project administration, X.W. and Y.G.; funding acquisition, Y.G. All authors have read and agreed to the published version of the manuscript.
Funding
This work was supported in part by the Natural Science Foundation of Zhejiang Province, China (LZ25F010006), and the National Nature Science Foundation of China (62371171, 62371178).
Institutional Review Board Statement
Not applicable.
Informed Consent Statement
Not applicable.
Data Availability Statement
The original contributions presented in this study are included in the article. Further inquiries can be directed to the corresponding author.
Conflicts of Interest
The authors declare that the research was conducted in the absence of any commercial or financial relationships that could be construed as a potential conflict of interest.
References
- Bloem, B.; Okun, M.; Klein, C. Parkinson’s disease. Lancet 2021, 397, 2284–2303. [Google Scholar] [CrossRef] [Scilit]
- Jankovic, J. Parkinson’s disease: Clinical features and diagnosis. J. Neurol. Neurosurg. Psychiatry 2008, 79, 368–376. [Google Scholar] [CrossRef] [Scilit]
- Tolosa, E.; Garrido, A.; Scholz, S.; Poewe, W. Challenges in the diagnosis of Parkinson’s disease. Lancet Neurol. 2021, 20, 385–397. [Google Scholar] [CrossRef] [Scilit]
- Teplan, M. Fundamental of EEG Measurement. Meas. Sci. Rev. 2002, 2, 1–11. [Google Scholar]
- Soikkeli, R.; Partanen, J.; Soininen, H.; Pääkkönen, A.; Riekkinen, P., Sr. Slowing of EEG in Parkinson’s disease. Electroencephalogr. Clin. Neurophysiol. 1991, 79, 159–165. [Google Scholar] [CrossRef] [Scilit]
- Morita, A.; Kamei, S.; Mizutani, T. Relationship between slowing of the EEG and cognitive impairment in Parkinson disease. J. Clin. Neurophysiol. 2011, 28, 384–387. [Google Scholar] [CrossRef] [Scilit] [PubMed]
- Liu, G.; Zhang, Y.; Hu, Z.; Du, X.; Wu, W.; Xu, C.; Wang, X.; Li, S. Complexity Analysis of Electroencephalogram Dynamics in Patients with Parkinson’s Disease. Park. Dis. 2017, 2017, 8701061. [Google Scholar] [CrossRef] [Scilit]
- Yuvaraj, R.; Rajendra Acharya, U.; Hagiwara, Y. A novel Parkinson’s Disease Diagnosis Index using higher-order spectra features in EEG signals. Neural Comput. Appl. 2018, 30, 1225–1235. [Google Scholar] [CrossRef] [Scilit]
- Anjum, M.F.; Dasgupta, S.; Mudumbai, R.; Singh, A.; Cavanagh, J.F.; Narayanan, N.S. Linear predictive coding distinguishes spectral EEG features of Parkinson’s disease. Park. Relat. Disord. 2020, 79, 79–85. [Google Scholar] [CrossRef] [Scilit] [PubMed]
- Khare, S.; Bajaj, V.; Acharya, U. Detection of Parkinson’s disease using automated tunable Q wavelet transform technique with EEG signals. Biocybern. Biomed. Eng. 2021, 41, 679–689. [Google Scholar] [CrossRef] [Scilit]
- Aljalal, M.; Aldosari, S.A.; AlSharabi, K.; Abdurraqeeb, A.M.; Alturki, F.A. Parkinson’s Disease Detection from Resting-State EEG Signals Using Common Spatial Pattern, Entropy, and Machine Learning Techniques. Diagnostics 2022, 12, 1033. [Google Scholar] [CrossRef] [Scilit]
- Mane, R.; Chouhan, T.; Guan, C. BCI for stroke rehabilitation: Motor and beyond. J. Neural Eng. 2020, 17, 041001. [Google Scholar] [CrossRef] [Scilit]
- Saha, S.; Mamun, K.; Ahmed, K.; Mostafa, R.; Naik, G.R.; Darvishi, S.; Khandoker, A.H.; Baumert, M. Progress in Brain Computer Interface: Challenges and Opportunities. Front. Syst. Neurosci. 2021, 15, 578875. [Google Scholar] [CrossRef] [Scilit]
- Weiss, K.; Khoshgoftaar, T.; Wang, D. A survey of transfer learning. J. Big Data 2016, 3, 9. [Google Scholar] [CrossRef] [Scilit]
- Azab, A.; Toth, J.; Mihaylova, L.S.; Arvaneh, M. A review on transfer learning approaches in brain–computer interface. In Signal Processing and Machine Learning for Brain-Machine Interfaces; The Institution of Engineering and Technology: London, UK, 2018; pp. 81–98. [Google Scholar] [CrossRef] [Scilit]
- Wan, Z.; Yang, R.; Huang, M.; Zeng, N.; Liu, X. A review on transfer learning in EEG signal analysis. Neurocomputing 2021, 421, 1–14. [Google Scholar] [CrossRef] [Scilit]
- Wu, D.; Xu, Y.; Lu, B. Transfer Learning for EEG-Based Brain–Computer Interfaces: A Review of Progress Made Since 2016. IEEE Trans. Cogn. Dev. Syst. 2022, 14, 4–19. [Google Scholar] [CrossRef] [Scilit]
- Zhang, K.; Robinson, N.; Lee, S.W.; Guan, C. Adaptive transfer learning for EEG motor imagery classification with deep Convolutional Neural Network. Neural Netw. 2021, 136, 1–10. [Google Scholar] [CrossRef] [Scilit]
- Li, A.; Wang, Z.; Zhao, X.; Xu, T.; Zhou, T.; Hu, H. MDTL: A Novel and Model-Agnostic Transfer Learning Strategy for Cross-Subject Motor Imagery BCI. IEEE Trans. Neural Syst. Rehabil. Eng. 2023, 31, 1743–1753. [Google Scholar] [CrossRef] [Scilit] [PubMed]
- He, Z.; Zhuang, N.; Bao, G.; Zeng, Y.; Yan, B. Cross-Day EEG-Based Emotion Recognition Using Transfer Component Analysis. Electronics 2022, 11, 651. [Google Scholar] [CrossRef] [Scilit]
- Zhang, D.; Li, H.; Xie, J.; Li, D. MI-DAGSC: A domain adaptation approach incorporating comprehensive information from MI-EEG signals. Neural Netw. 2023, 167, 183–198. [Google Scholar] [CrossRef] [Scilit]
- Gao, Y.; Li, M.; Peng, Y.; Fang, F.; Zhang, Y. Double Stage Transfer Learning for Brain-Computer Interfaces. IEEE Trans. Neural Syst. Rehabil. Eng. 2023, 31, 1128–1136. [Google Scholar] [CrossRef] [Scilit]
- Liu, D.; Zhang, J.; Wu, H.; Liu, S.; Long, J. Multi-Source Transfer Learning for EEG Classification Based on Domain Adversarial Neural Network. IEEE Trans. Neural Syst. Rehabil. Eng. 2022, 31, 218–228. [Google Scholar] [CrossRef] [Scilit]
- Wu, X.; Ju, X.; Dai, S.; Li, X.; Li, M. Multi-source domain adaptation for EEG emotion recognition based on inter-domain sample hybridization. Front. Hum. Neurosci. 2024, 18, 1464431. [Google Scholar] [CrossRef] [Scilit]
- Li, G.; Wu, C.; Zhou, Z.; Tian, N.; Liang, Z. MATL-DC: A Multi-domain Aggregation Transfer Learning Framework for EEG Emotion Recognition with Domain-Class Prototype under Unseen Targets. arXiv 2025, arXiv:2509.01135. [Google Scholar]
- Zuo, Y.K.; Yao, H.T.; Xu, C.S. Attention-Based Multi-Source Domain Adaptation. IEEE Trans. Image Process. 2021, 30, 3793–3803. [Google Scholar] [CrossRef] [Scilit]
- Zhou, C.; Wang, Z.; Du, B.; Luo, Y. Cycle Self-Refinement for Multi-Source Domain Adaptation. Proc. AAAI Conf. Artif. Intell. 2024, 38, 17096–17104. [Google Scholar] [CrossRef] [Scilit]
- She, Q.; Shi, X.; Fang, F.; Ma, Y.; Zhang, Y. Cross-subject EEG emotion recognition using multi-source domain manifold feature selection. Comput. Biol. Med. 2023, 159, 106860. [Google Scholar] [CrossRef] [Scilit] [PubMed]
- Altindis, F.; Banerjee, A.; Phlypo, R.; Yilmaz, B.; Congedo, M. Transfer Learning for P300 Brain-Computer Interfaces by Joint Alignment of Feature Vectors. IEEE J. Biomed. Health Inform. 2023, 27, 4696–4706. [Google Scholar] [CrossRef] [Scilit] [PubMed]
- Wu, Z.; She, Q.; Hou, Z.; Li, Z.; Tian, K.; Ma, Y. Multi-source online transfer algorithm based on source domain selection for EEG classification. Math. Biosci. Eng. 2023, 20, 4560–4573. [Google Scholar] [CrossRef] [Scilit]
- Huang, M.; Xie, Z.; Sun, B.; Wang, N. Multi-Source Unsupervised Domain Adaptation with Prototype Aggregation. Mathematics 2025, 13, 579. [Google Scholar] [CrossRef] [Scilit]
- Pan, S.J.; Tsang, I.W.; Kwok, J.T.; Yang, Q. Domain Adaptation via Transfer Component Analysis. IEEE Trans. Neural Netw. 2021, 22, 199–210. [Google Scholar] [CrossRef] [Scilit] [PubMed]
- Long, M.; Cao, Y.; Cao, Z.; Wang, J.; Jordan, M.I. Transferable Representation Learning with Deep Adaptation Networks. IEEE Trans. Pattern Anal. Mach. Intell. 2019, 22, 199–210. [Google Scholar] [CrossRef] [Scilit]
- Long, M.; Wang, J.; Jordan, M. Deep Transfer Learning with Joint Adaptation Networks. arXiv 2016, arXiv:1605.06636. [Google Scholar] [CrossRef] [Scilit]
- Zhang, W.; Wu, D. Discriminative Joint Probability Maximum Mean Discrepancy (DJP-MMD) for Domain Adaptation. In Proceedings of the 2020 International Joint Conference on Neural Networks (IJCNN), Glasgow, UK, 19–24 July 2020; pp. 1–8. [Google Scholar] [CrossRef] [Scilit]
- Barber, C.; Dobkin, D.; Huhdanpaa, H. The quickhull algorithm for convex hulls. ACM Trans. Math. Softw. 1996, 22, 469–483. [Google Scholar] [CrossRef] [Scilit]
- Yousefzadeh, R. Decision boundaries and convex hulls in the feature space that deep learning functions learn from images. arXiv 2022, arXiv:2202.04052. [Google Scholar] [CrossRef] [Scilit]
- Guo, Z.; Liu, C.; Zhang, X.; Jiao, J.; Ji, X.; Ye, Q. Beyond Bounding-Box: Convex-hull Feature Adaptation for Oriented and Densely Packed Object Detection. In Proceedings of the IEEE/CVF Conference on Computer Vision and Pattern Recognition (CVPR), Nashville, TN, USA, 20–25 June 2021; pp. 8788–8797. [Google Scholar] [CrossRef] [Scilit]
- Ingebrand, T.; Thorpe, A.J.; Topcu, U. Function encoders: A principled approach to transfer learning in hilbert spaces. arXiv 2025, arXiv:2501.18373. [Google Scholar] [CrossRef] [Scilit]
- He, H.; Wu, D. Transfer Learning for Brain-Computer Interfaces: A Euclidean Space Data Alignment Approach. IEEE Trans. Biomed. Eng. 2020, 67, 399–410. [Google Scholar] [CrossRef] [Scilit]
- George, J.; Strunk, J.; Mak-McCully, R.; Houser, M.; Poizner, H.; Aron, A. Dopaminergic therapy in Parkinson’s disease decreases cortical beta band coherence in the resting state and increases cortical beta band power during executive control. Neuroimage Clin. 2013, 3, 261–270. [Google Scholar] [CrossRef] [Scilit]
- Cavanagh, J.; Kumar, P.; Mueller, A.; Richardson, S.; Mueen, A. Diminished EEG habituation to novel events effectively classifies Parkinson’s patients. Clin. Neurophysiol. 2018, 129, 409–418. [Google Scholar] [CrossRef] [Scilit]
- Singh, A.; Richardson, S.; Narayanan, N.; Cavanagh, J. Mid-frontal theta activity is diminished during cognitive control in Parkinson’s disease. Neuropsychologia 2018, 117, 113–122. [Google Scholar] [CrossRef] [Scilit]
- Singh, A.; Cole, R.; Espinoza, A.; Brown, D.; Cavanagh, J.; Narayanan, N. Frontal theta and beta oscillations during lower-limb movement in Parkinson’s disease. Clin. Neurophysiol. 2020, 131, 694–702. [Google Scholar] [CrossRef] [Scilit] [PubMed]
- Pfeiffer, F. Non-motor symptoms in Parkinson’s disease. Park. Relat. Disord. 2016, 22, S119–S122. [Google Scholar] [CrossRef] [Scilit] [PubMed]
- Chaudhuri, R.; Healy, G.; Schapira, H. Non-motor symptoms of Parkinson’s disease: Diagnosis and management. Lancet Neurol. 2006, 5, 235–245. [Google Scholar] [CrossRef] [Scilit] [PubMed]

Disclaimer/Publisher’s Note: The statements, opinions and data contained in all publications are solely those of the individual author(s) and contributor(s) and not of MDPI and/or the editor(s). MDPI and/or the editor(s) disclaim responsibility for any injury to people or property resulting from any ideas, methods, instructions or products referred to in the content. |
© 2025 by the authors. Licensee MDPI, Basel, Switzerland. This article is an open access article distributed under the terms and conditions of the Creative Commons Attribution (CC BY) license.