1. Introduction
Growth in technology has changed how data/information is collected and analyzed. Nowadays, data is systematically aggregated, analyzed, and interpreted to inform practices, methodologies, and decision-making across diverse sectors [
1], including the education sector [
2,
3]. Thus, there is a growing research interest in the analysis of data generated through educational technologies recently [
4], owing to its potential to drive innovation in pedagogical practices [
5] and to challenge established educational paradigms [
6]. Concurrently, the proliferation of sophisticated analytical tools designed for academic data analysis has significantly increased [
7]. This evolution has prompted educators to critically reassess traditional conceptions of teaching and learning, encouraging a shift towards data-informed instructional strategies that enhance educational outcomes.
The International Educational Data Mining (EDM) Society emphasized that EDM involves developing methodologies for analyzing the diverse and intricate data generated within educational environments to enhance our understanding of student behaviours and learning contexts [
8]. Before now, researchers have recognized the potential for longitudinal tracking of student learning progress, which enables the identification of activities that significantly contribute to improved learning outcomes [
9]. Integrating big data technologies into educational settings has led to an important shift from traditional, instructor-centered pedagogies to more learner-centric models, largely driven by advancements in e-learning. EDM is specifically defined as the application of data mining techniques to educational data, focusing on addressing critical questions and challenges within the educational landscape [
10]. The EDM framework informs instructional design as well as empowers educators to make data-driven decisions that enhance student engagement and achievement.
In practice, EDM entails analyzing large data volumes generated by the integration of technology in education, such as data mining, statistical modeling, and artificial intelligence (AI). It aims to address educational queries through computational methods, analyzing and interpreting educational content [
11]. The EDM field enables a profound transformation of the education system, urging a reevaluation of its structure to elevate a nation’s standing globally [
12]. Using data mining, the primary technique behind EDM, institutions and educators can uncover hidden patterns and insights from various information sources. This will help in facilitating a comprehensive review of student performance and related factors. Employing different algorithms allows for the detailed categorization of student databases based on multiple factors and to prioritize psychological over intellectual traits, offering insights into student behavior patterns, helping to effectively profile students in any educational environment [
13,
14].
Bibliometric analysis serves as a comprehensive methodology for both quantitative and qualitative assessment of academic publications, and it has been extensively utilized across various scientific domains [
15]. This approach enables researchers to conduct a comprehensive examination of topic evolution, identify core research methodologies, and pinpoint emerging areas for further inquiry within a specific field. It is particularly well suited for unravelling the knowledge structure and developmental direction of studies focused on student behaviours about their academic objectives [
16,
17].
Bibliometric analysis uses statistical and visual techniques to illustrate the knowledge structures and developmental trends associated with a given topic. By analyzing publication data, it is easier to identify prevailing research trends and emergent themes. Additionally, it facilitates the evaluation of publication outputs by authors and institutions, allowing for the mapping of international collaboration networks and geographical distribution patterns [
18]. Also, this comprehensive analytical framework enhances the understanding of scholarly communication as well as informs strategic decision-making in educational research and policy development.
There are diverse bibliometric analysis tools, each possessing unique advantages and limitations. It is, therefore, prudent to employ multiple tools for a comprehensive analysis. Among the most widely utilized software packages for bibliometric and visualization analysis are CiteSpace, Visualization of Similarities Viewer (VOSviewer), and R-bibliometrix [
19,
20]. These tools facilitate the collection of important information from included documents, enable the identification of relevant articles within cooperative networks, and allow for the assessment of contributions from authors, institutions, and countries or regions [
21].
Raw bibliometric data can be obtained from different databases, including WoS, PubMed, and Scopus. WoS and Scopus are extensive subscription-based databases, while PubMed serves as a free resource primarily focused on the biomedical literature, positioning it as the premier database for electronic biomedical research. Scopus encompasses a broader range of journals, which is beneficial for conducting keyword searches and citation analyses. However, it is worth noting that Scopus is limited to publications from 1992 onwards, whereas WoS provides access to materials published before 1992 [
22]. This temporal breadth in WoS may offer a more comprehensive perspective for historical bibliometric studies, further emphasizing the importance of selecting appropriate databases based on research needs.
This paper presents a bibliometric study aimed at revealing state-of-the-art research works on AI applications in predicting student performance within higher education. To the best of our knowledge, this represents a novel endeavor in providing a comprehensive bibliometric review of AI-driven performance prediction in the educational sector. Furthermore, the paper highlights the significant influence of the COVID-19 pandemic on the accelerated adoption of AI technologies in educational contexts.
The major contributions of the paper are as follows:
This study provides an extensive bibliometric overview of the literature on AI applications related to predicting student performance in higher education, mapping publication trends, influential authors, and research collaborations.
The paper identifies key trends in AI research within higher education, including emerging themes, methodologies, and technologies that dominate the field.
It elucidates the critical role of the COVID-19 pandemic in driving the adoption of AI in educational settings, reflecting on how this global event has reshaped educational practices.
The study evaluates the publication output from various authors, institutions, and countries, providing insights into collaborative networks and the geographical distribution of research efforts.
By identifying gaps in the existing literature, the paper proposes avenues for future research, encouraging further exploration of hybrid methodologies that combine AI with traditional educational assessment techniques.
Author Contributions
B.U., S.U., D.M., and N.H. were involved in the full process of producing this paper, including conceptualization, methodology, modeling, validation, visualization, and preparing the manuscript. All authors have read and agreed to the published version of the manuscript.
Funding
This work was supported by the European Regional Development Fund under the “Research Innovation and Digitization for Smart Transformation” program 2021–2027 under Project BG16RFPR002-1.014-0006 “National Centre of Excellence Mechatronics and Clean Technologies”, and the APC was funded by Project BG16RFPR002-1.014-0006.
Institutional Review Board Statement
Not applicable.
Data Availability Statement
The data for this study were obtained from the Web of Science database (
https://www.webofscience.com (accessed on 15 September 2024) and are subject to access restrictions.
Acknowledgments
The authors thank the anonymous reviewers for their insightful comments and constructive suggestions, which substantially improved the manuscript.
Conflicts of Interest
The authors declare no conflicts of interest.
Abbreviations
The following abbreviations are used in this manuscript:
| Notation | Meaning |
| AI | Artificial Intelligence |
| CPCI-S | Conference Proceedings Citation Index—Science |
| DOI | Digital Object Identifier |
| EDM | Educational Data Mining |
| ESCI | Emerging Sources Citation Index |
| MCP | Multiple-Country Publication |
| MCP_Ratio | Multiple-Country Publication Ratio |
| R-Tool | R-Package |
| SCIE | Science Citation Index Expanded |
| SCP | Single-Country Publication |
| SSCI | Social Science Citation Index |
| TC | Total Citations |
| VoSviewer | Visualization of Similarities Viewer |
| WoS | Web of Science |
References
- Kar, A.K.; Dwivedi, Y.K. Theory building with big data-driven research—Moving away from the “What” towards the “Why”. Int. J. Inf. Manag. 2020, 54, 102205. [Google Scholar] [CrossRef]
- Baek, C.; Doleck, T. A Bibliometric Analysis of the Papers Published in the Journal of Artificial Intelligence in Education from 2015–2019. Int. J. Learn. Anal. Artif. Intell. Educ. (iJAI) 2020, 2, 67–84. [Google Scholar] [CrossRef]
- Charitopoulos, A.; Rangoussi, M.; Koulouriotis, D. On the Use of Soft Computing Methods in Educational Data Mining and Learning Analytics Research: A Review of Years 2010–2018. Int. J. Artif. Intell. Educ. 2020, 30, 371–430. [Google Scholar] [CrossRef]
- Ang, K.L.M.; Ge, F.L.; Seng, K.P. Big Educational Data & Analytics: Survey, Architecture and Challenges. IEEE Access 2020, 8, 116392–116414. [Google Scholar] [CrossRef]
- Doleck, T.; Lemay, D.; Basnet, R.; Bazelais, P. Predictive analytics in education: A comparison of deep learning frameworks. Educ. Inf. Technol. 2020, 25, 1951–1963. [Google Scholar] [CrossRef]
- Bakti, I.K.; Zulkarnain; Yarun, A.; Rusdi; Syaifudin, M.; Syafaq, H. The Role of Artificial Intelligence in Education: A Systematic Literature Review. J. Iqra Kaji. Ilmu Pendidik. 2023, 8, 182–197. [Google Scholar] [CrossRef]
- Rimpy; Dhankhar, A.; Solanki, K. Educational Data Mining tools and Techniques used for Prediction of Student’s Performance: A Study. In Proceedings of the 2022 10th International Conference on Reliability, Infocom Technologies and Optimization (Trends and Future Directions) (ICRITO), Noida, India, 13–14 October 2022; pp. 1–5. [Google Scholar] [CrossRef]
- Du, X.; Yang, J.; Hung, J.L.; Shelton, B. Educational data mining: A systematic review of research and emerging trends. Inf. Discov. Deliv. 2020, 48, 225–236. [Google Scholar] [CrossRef]
- Roediger, H.L.; Karpicke, J.D. Test-Enhanced Learning: Taking Memory Tests Improves Long-Term Retention. Psychol. Sci. 2006, 17, 249–255. [Google Scholar] [CrossRef]
- Asif, R.; Merceron, A.; Ali, S.A.; Haider, N.G. Analyzing undergraduate students’ performance using educational data mining. Comput. Educ. 2006, 113, 177–194. [Google Scholar] [CrossRef]
- Boztas¸, G.D.; Berigel, M.; Altınay, F. A bibliometric analysis of Educational Data Mining studies in global perspective. Educ. Inf. Technol. 2023, 29, 8961–8985. [Google Scholar] [CrossRef]
- Etherington, M. The Challenge with Educational Transformation. J. Cult. Values Educ. 2019, 2, 96–112. [Google Scholar] [CrossRef]
- Angeline, D.M.D. Association Rule Generation for Student Performance Analysis using Apriori Algorithm. SIJ Trans. Comput. Sci. Eng. Its Appl. CSEA 2013, 1, 16–20. [Google Scholar] [CrossRef]
- Sinaga, K.P.; Yang, M.S. Unsupervised K-Means Clustering Algorithm. IEEE Access 2020, 8, 80716–80727. [Google Scholar] [CrossRef]
- Mudawi, N.A.; Pervaiz, M.; Alabduallah, B.I.; Alazeb, A.; Alshahrani, A.; Alotaibi, S.S.; Jalal, A. Predictive Analytics for Sustainable E-Learning: Tracking Student Behaviors. Sustainability 2023, 15, 14780. [Google Scholar] [CrossRef]
- Prahani, B.K.; Rizki, I.A.; Jatmiko, B.; Suprapto, N.; Tan, A. Artificial Intelligence in Education Research During The Last Ten Years: A Review and Bibliometric Study. Int. J. Emerg. Technol. Learn. IJET 2022, 17, 169–188. [Google Scholar] [CrossRef]
- Akhmadieva, R.S.; Udina, N.N.; Kosheleva, Y.P.; Zhdanov, S.P.; Timofeeva, M.O.; Budkevich, R.L. Artificial intelligence in science education: A bibliometric review. Contemp. Educ. Technol. 2023, 15, ep460. [Google Scholar] [CrossRef]
- Choudhri, A.F.; Siddiqui, A.; Khan, N.R.; Cohen, H.L. Understanding Bibliometric Parameters and Analysis. RadioGraphics 2015, 35, 736–746. [Google Scholar] [CrossRef]
- Eck, N.J.V.; Waltman, L. Software survey: VOSviewer, a computer program for bibliometric mapping. Scientometrics 2010, 84, 523–538. [Google Scholar] [CrossRef]
- Dai, Z.; Xu, S.; Wu, X.; Hu, R.; Li, H.; He, H.; Hu, J.; Liao, X. Knowledge Mapping of Multicriteria Decision Analysis in Healthcare: A Bibliometric Analysis. Front. Public Health 2022, 10, 895552. [Google Scholar] [CrossRef]
- Devos, P.; Menard, J. Bibliometric analysis of research relating to hypertension reported over the period 1997–2016. J. Hypertens. 2019, 37, 2116–2122. [Google Scholar] [CrossRef]
- Falagas, M.E.; Pitsouni, E.I.; Malietzis, G.A.; Pappas, G. Comparison of PubMed, Scopus, Web of Science, and Google Scholar: Strengths and weaknesses. FASEB J. 2008, 22, 338–342. [Google Scholar] [CrossRef]
- Tikhonova, E.; Raitskaya, L. Citations and References: Guidelines on Literature Practices. J. Lang. Educ. 2022, 8, 5–10. [Google Scholar] [CrossRef]
- Zawacki-Richter, O.; Marín, V.I.; Bond, M.; Gouverneur, F. Systematic review of research on artificial intelligence applications in higher education—where are the educators? Int. J. Educ. Technol. High. Educ. 2019, 16, 39. [Google Scholar] [CrossRef]
- Aldowah, H.; Al-Samarraie, H.; Fauzy, W.M. Educational data mining and learning analytics for 21st century higher education: A review and synthesis. Telemat. Inform. 2019, 37, 13–49. [Google Scholar] [CrossRef]
- Costa, E.B.; Fonseca, B.; Santana, M.A.; de Araújo, F.F.; Rego, J. Evaluating the effectiveness of educational data mining techniques for early prediction of students’ academic failure in introductory programming courses. Comput. Hum. Behav. 2017, 73, 247–256. [Google Scholar] [CrossRef]
- Cerezo, R.; Sánchez-Santillán, M.; Paule-Ruiz, M.P.; Núñez, J.C. Students’ LMS interaction patterns and their relationship with achievement: A case study in higher education. Comput. Educ. 2016, 96, 42–54. [Google Scholar] [CrossRef]
- Onan, A. Sentiment analysis on massive open online course evaluations: A text mining and deep learning approach. Comput. Appl. Eng. Educ. 2021, 29, 572–589. [Google Scholar] [CrossRef]
- Romero, C.; Espejo, P.G.; Zafra, A.; Romero, J.R.; Ventura, S. Web usage mining for predicting final marks of students that use Moodle courses. Comput. Appl. Eng. Educ. 2013, 21, 135–146. [Google Scholar] [CrossRef]
- Waheed, H.; Hassan, S.-U.; Aljohani, N.R.; Hardman, J.; Alelyani, S.; Nawaz, R. Predicting academic performance of students from VLE big data using deep learning models. Comput. Hum. Behav. 2020, 104, 106189. [Google Scholar] [CrossRef]
- Alyahyan, E.; Düştegör, D. Predicting academic success in higher education: Literature review and best practices. Int. J. Educ. Technol. High. Educ. 2020, 17, 3. [Google Scholar] [CrossRef]
- Natek, S.; Zwilling, M. Student data mining solution—knowledge management system related to higher education institutions. Expert Syst. Appl. 2014, 41, 6400–6407. [Google Scholar] [CrossRef]
- Guo, H.; Shen, Z.; Zeng, J.; Hong, N. Hybrid Methods of Bibliographic Coupling and Text Similarity Measurement for Biomedical Paper Recommendation. In Proceedings of the MEDINFO 2021: One World, One Health—Global Partnership for Digital Innovation, Virtual Event, 2–4 October 2022; IOS Press: Amsterdam, The Netherlands, 2022; pp. 287–291. [Google Scholar] [CrossRef]
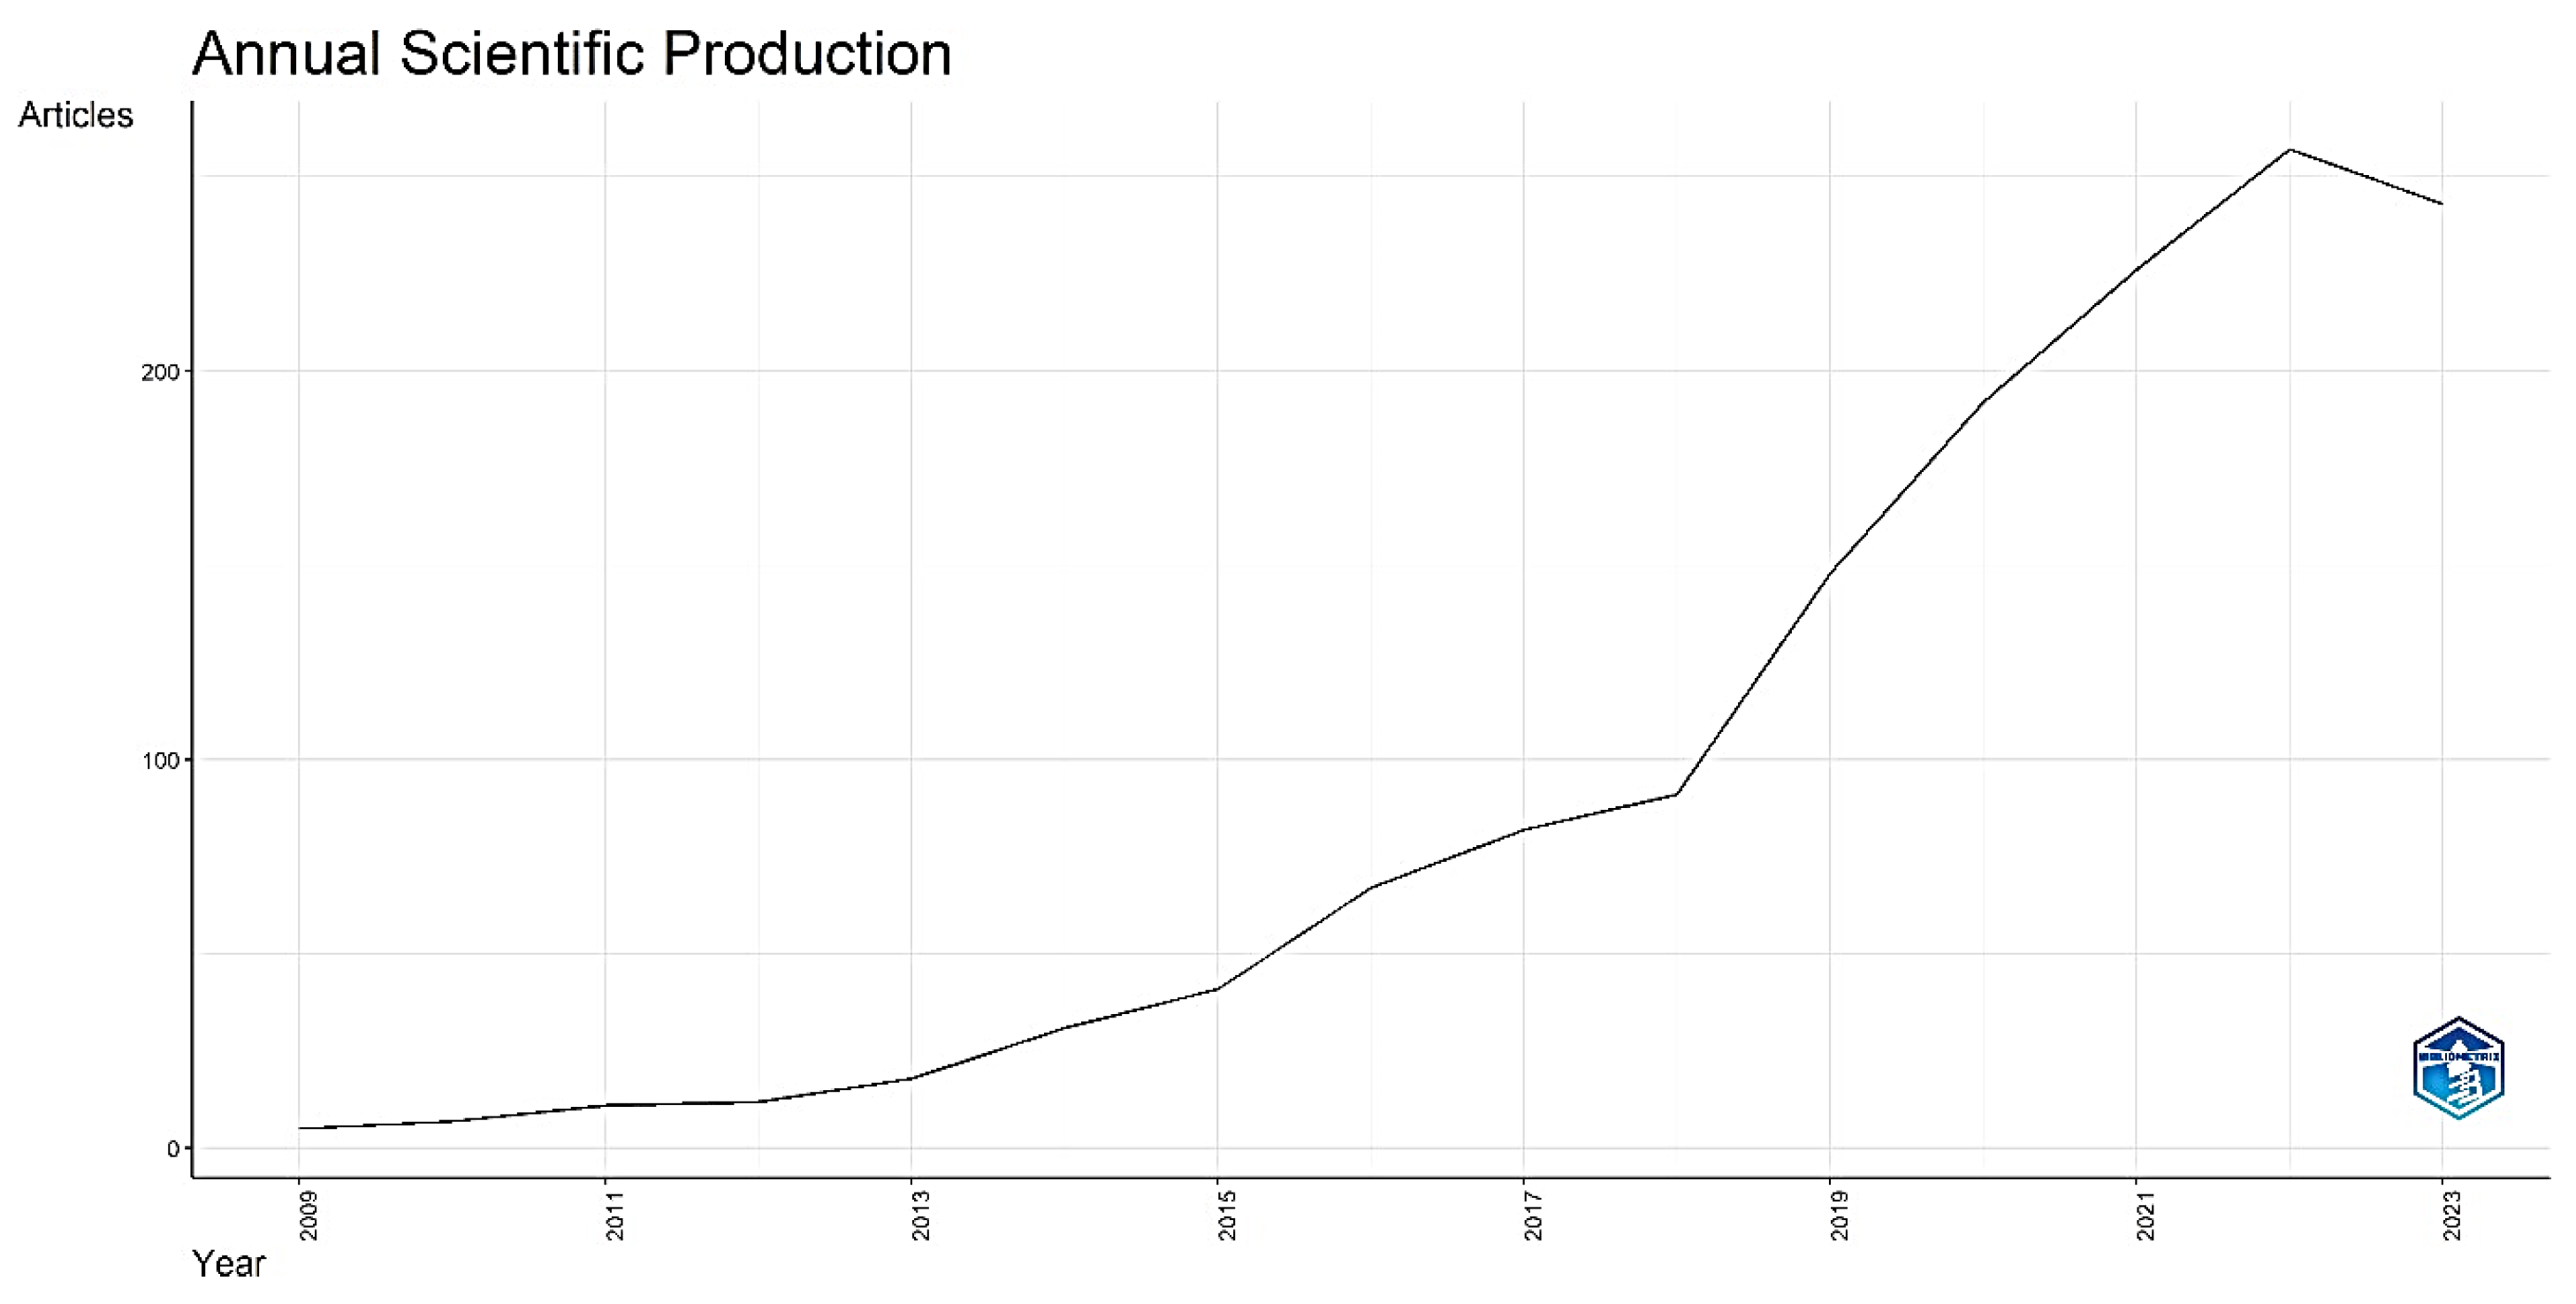
Figure 1.
Annual production of documents (2009–2023).
Figure 2.
Top 10 relevant sources.
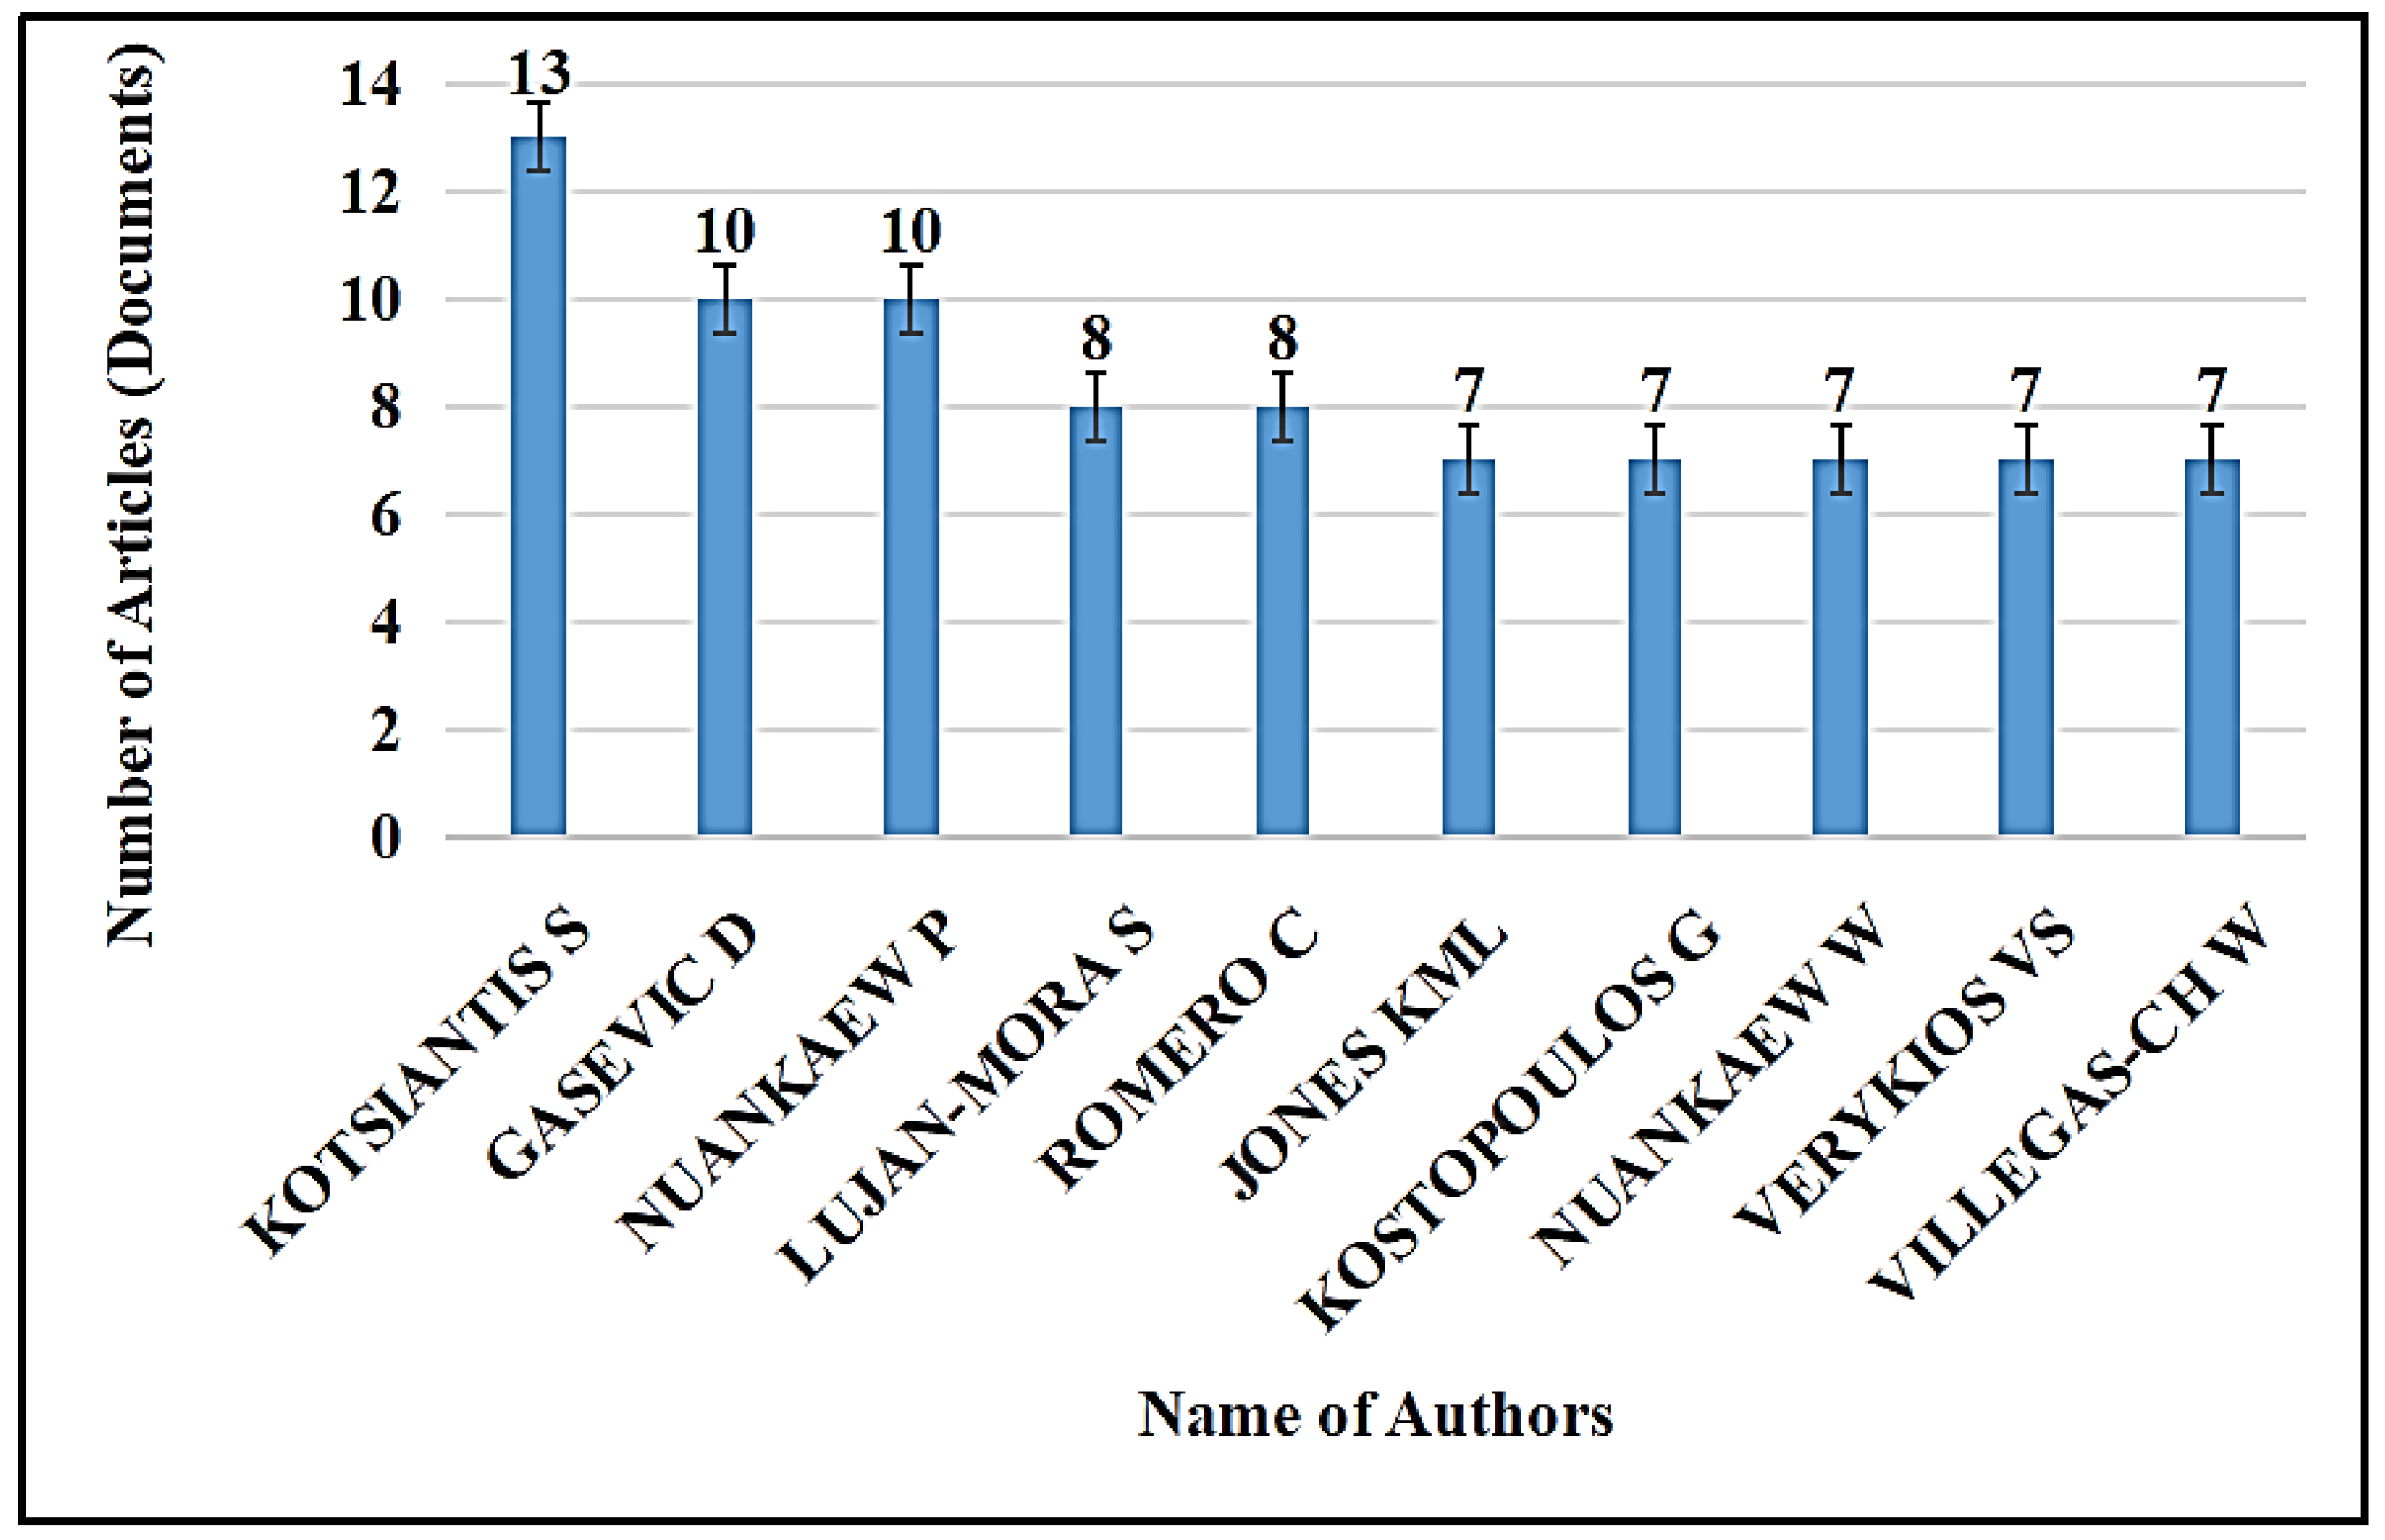
Figure 3.
Top 10 relevant authors.
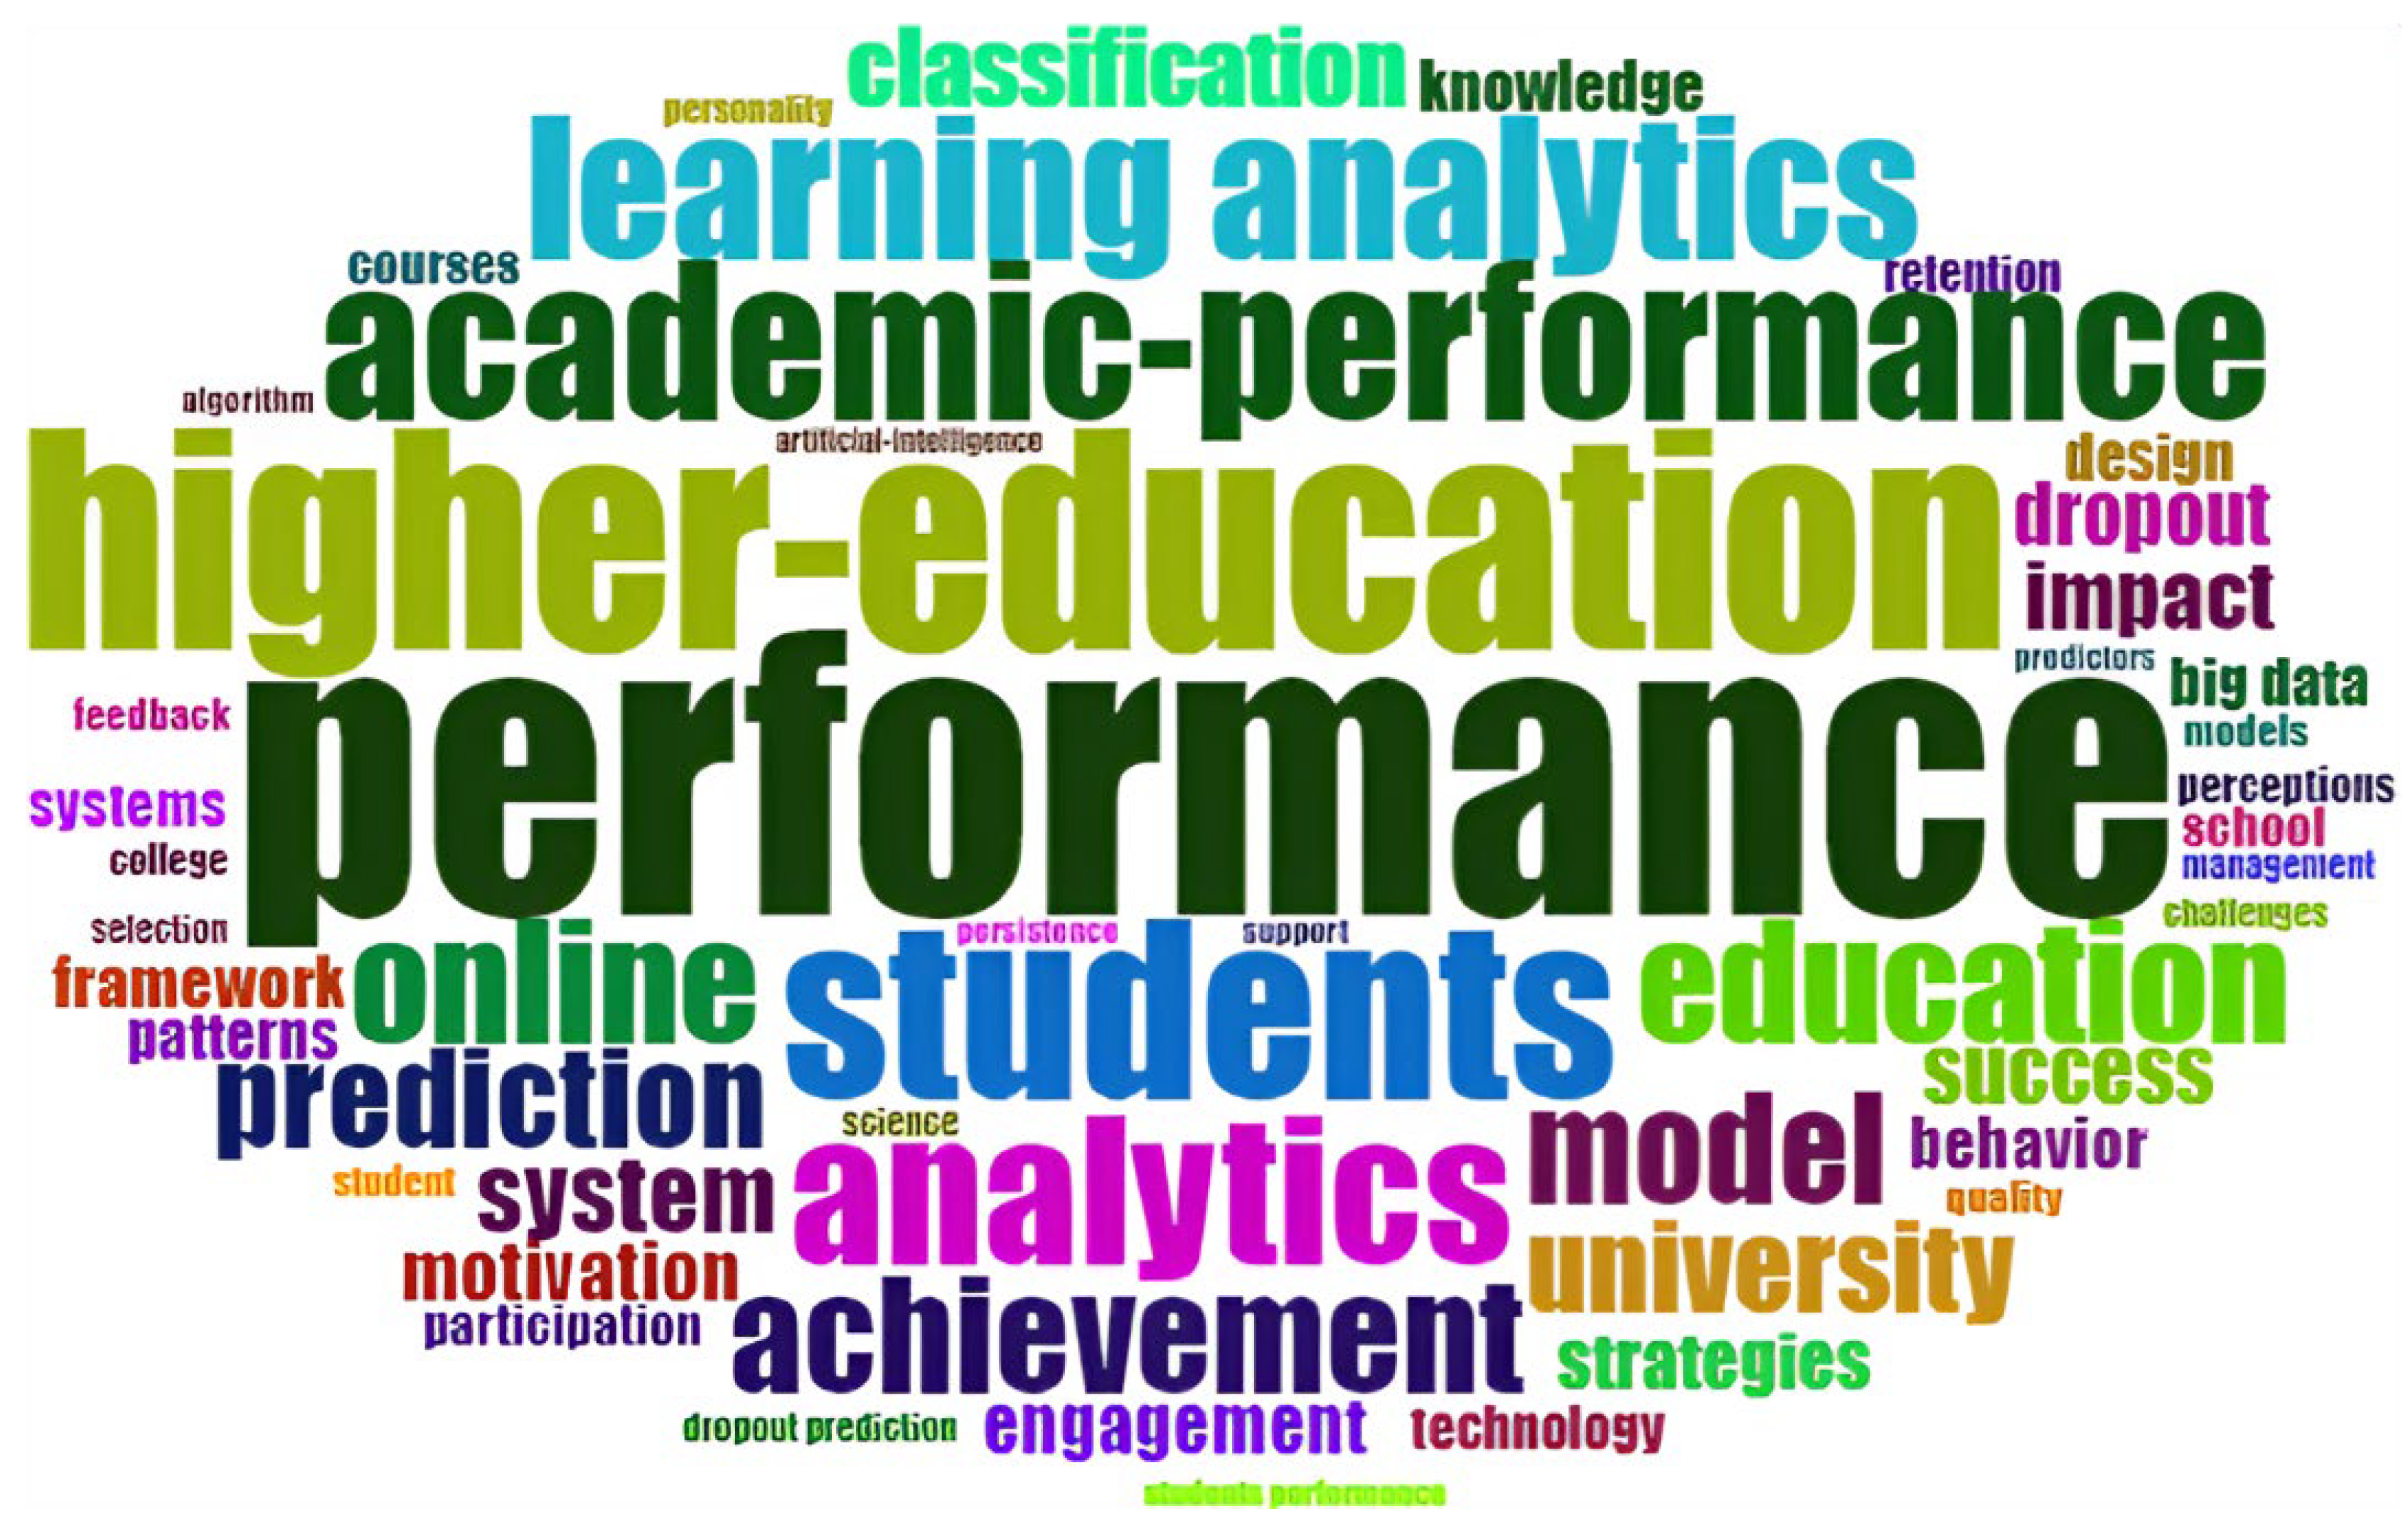
Figure 4.
Word cloud based on author keywords.
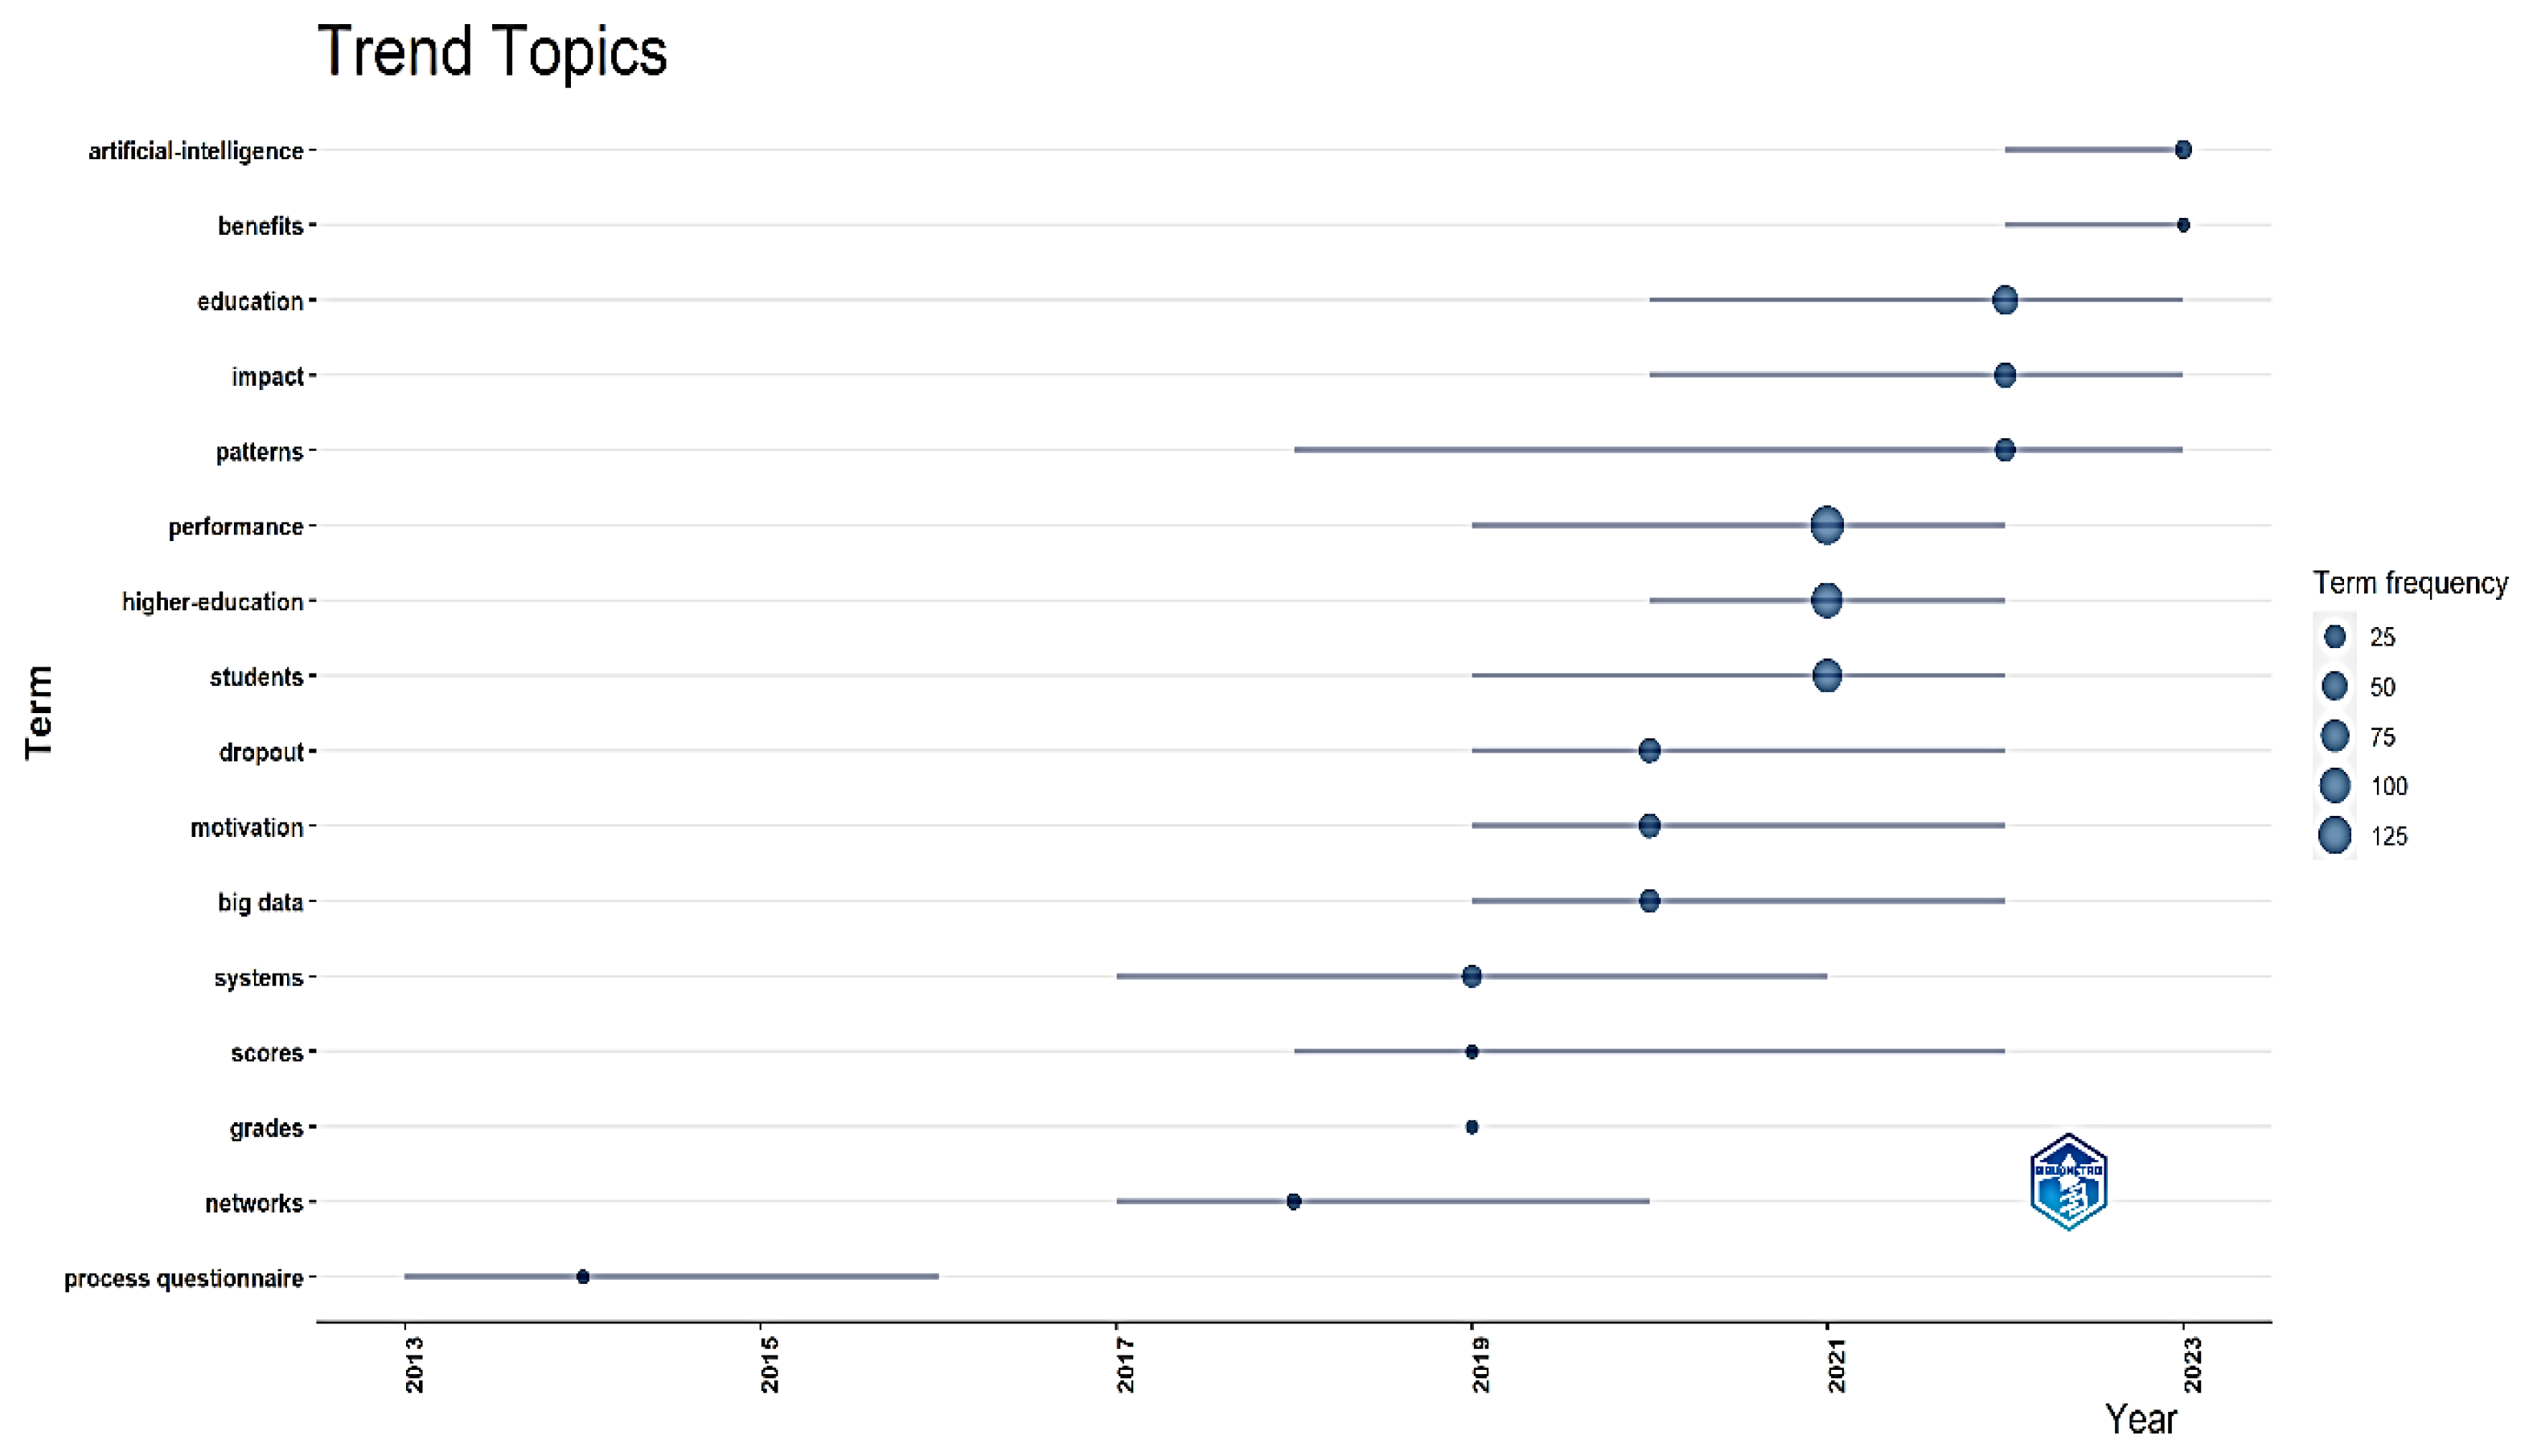
Figure 5.
Trending topics over time.
Figure 6.
Co-authorship—author map.
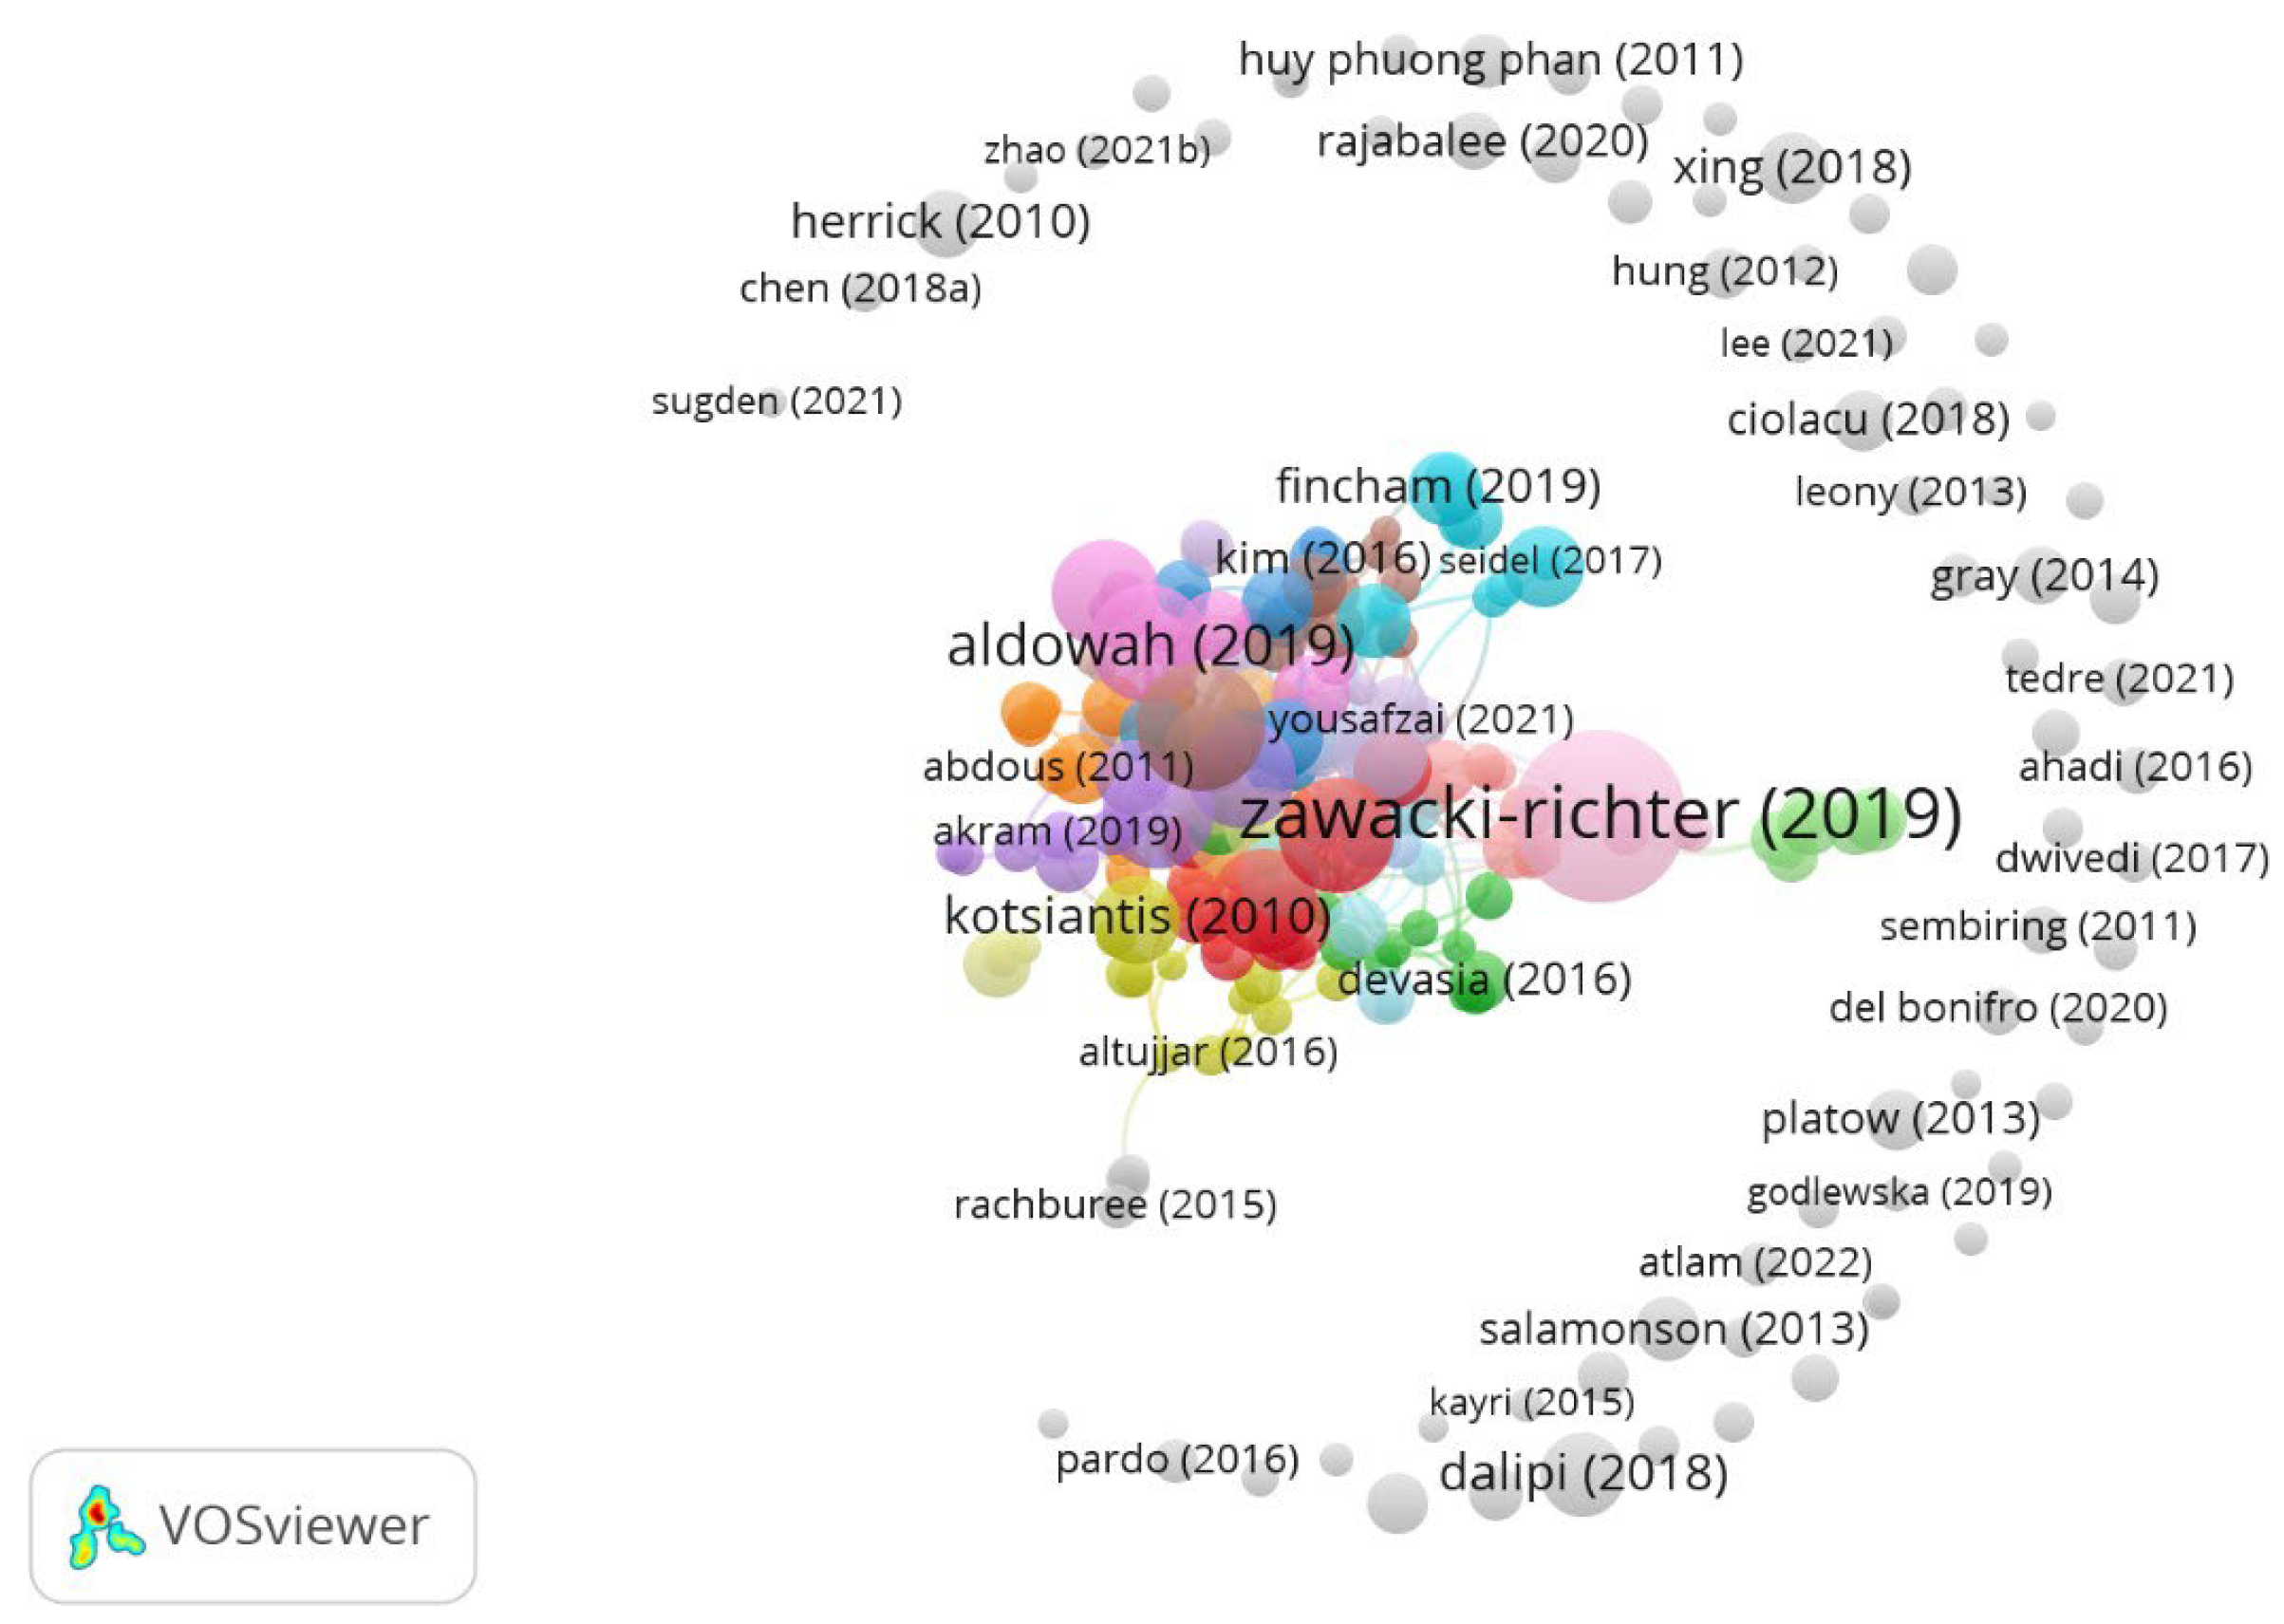
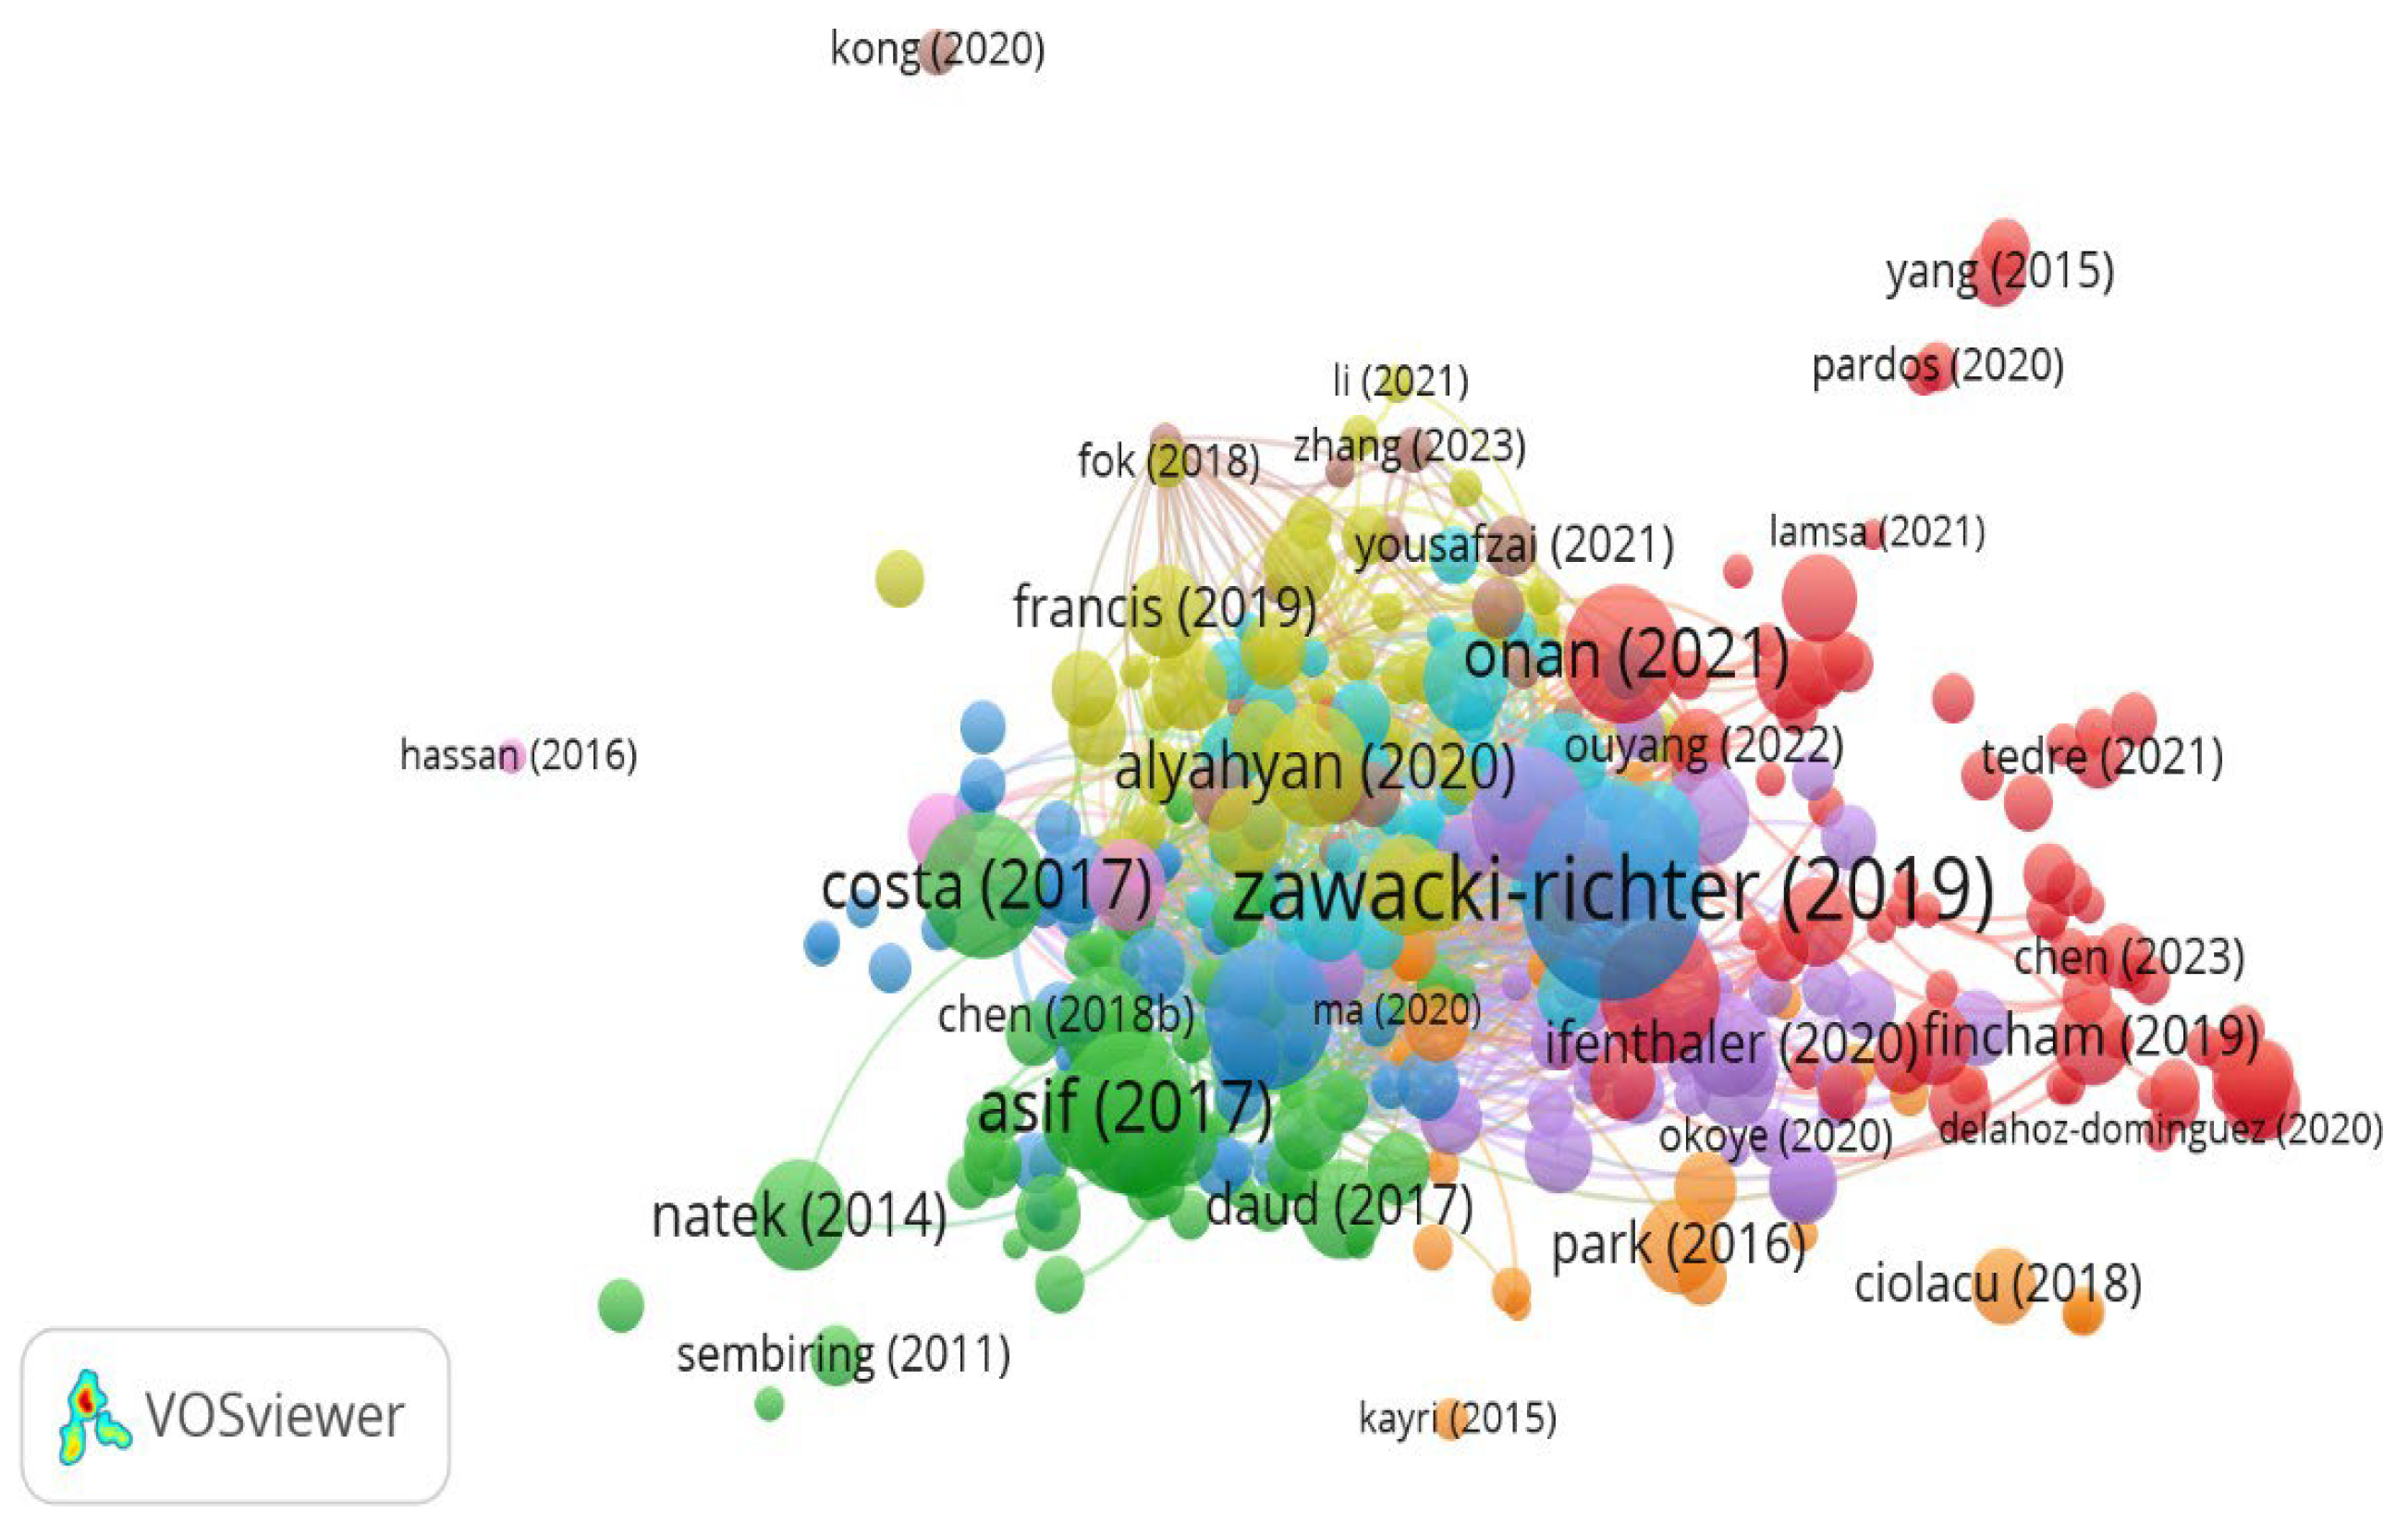
Figure 7.
Citations—documents network visualization.
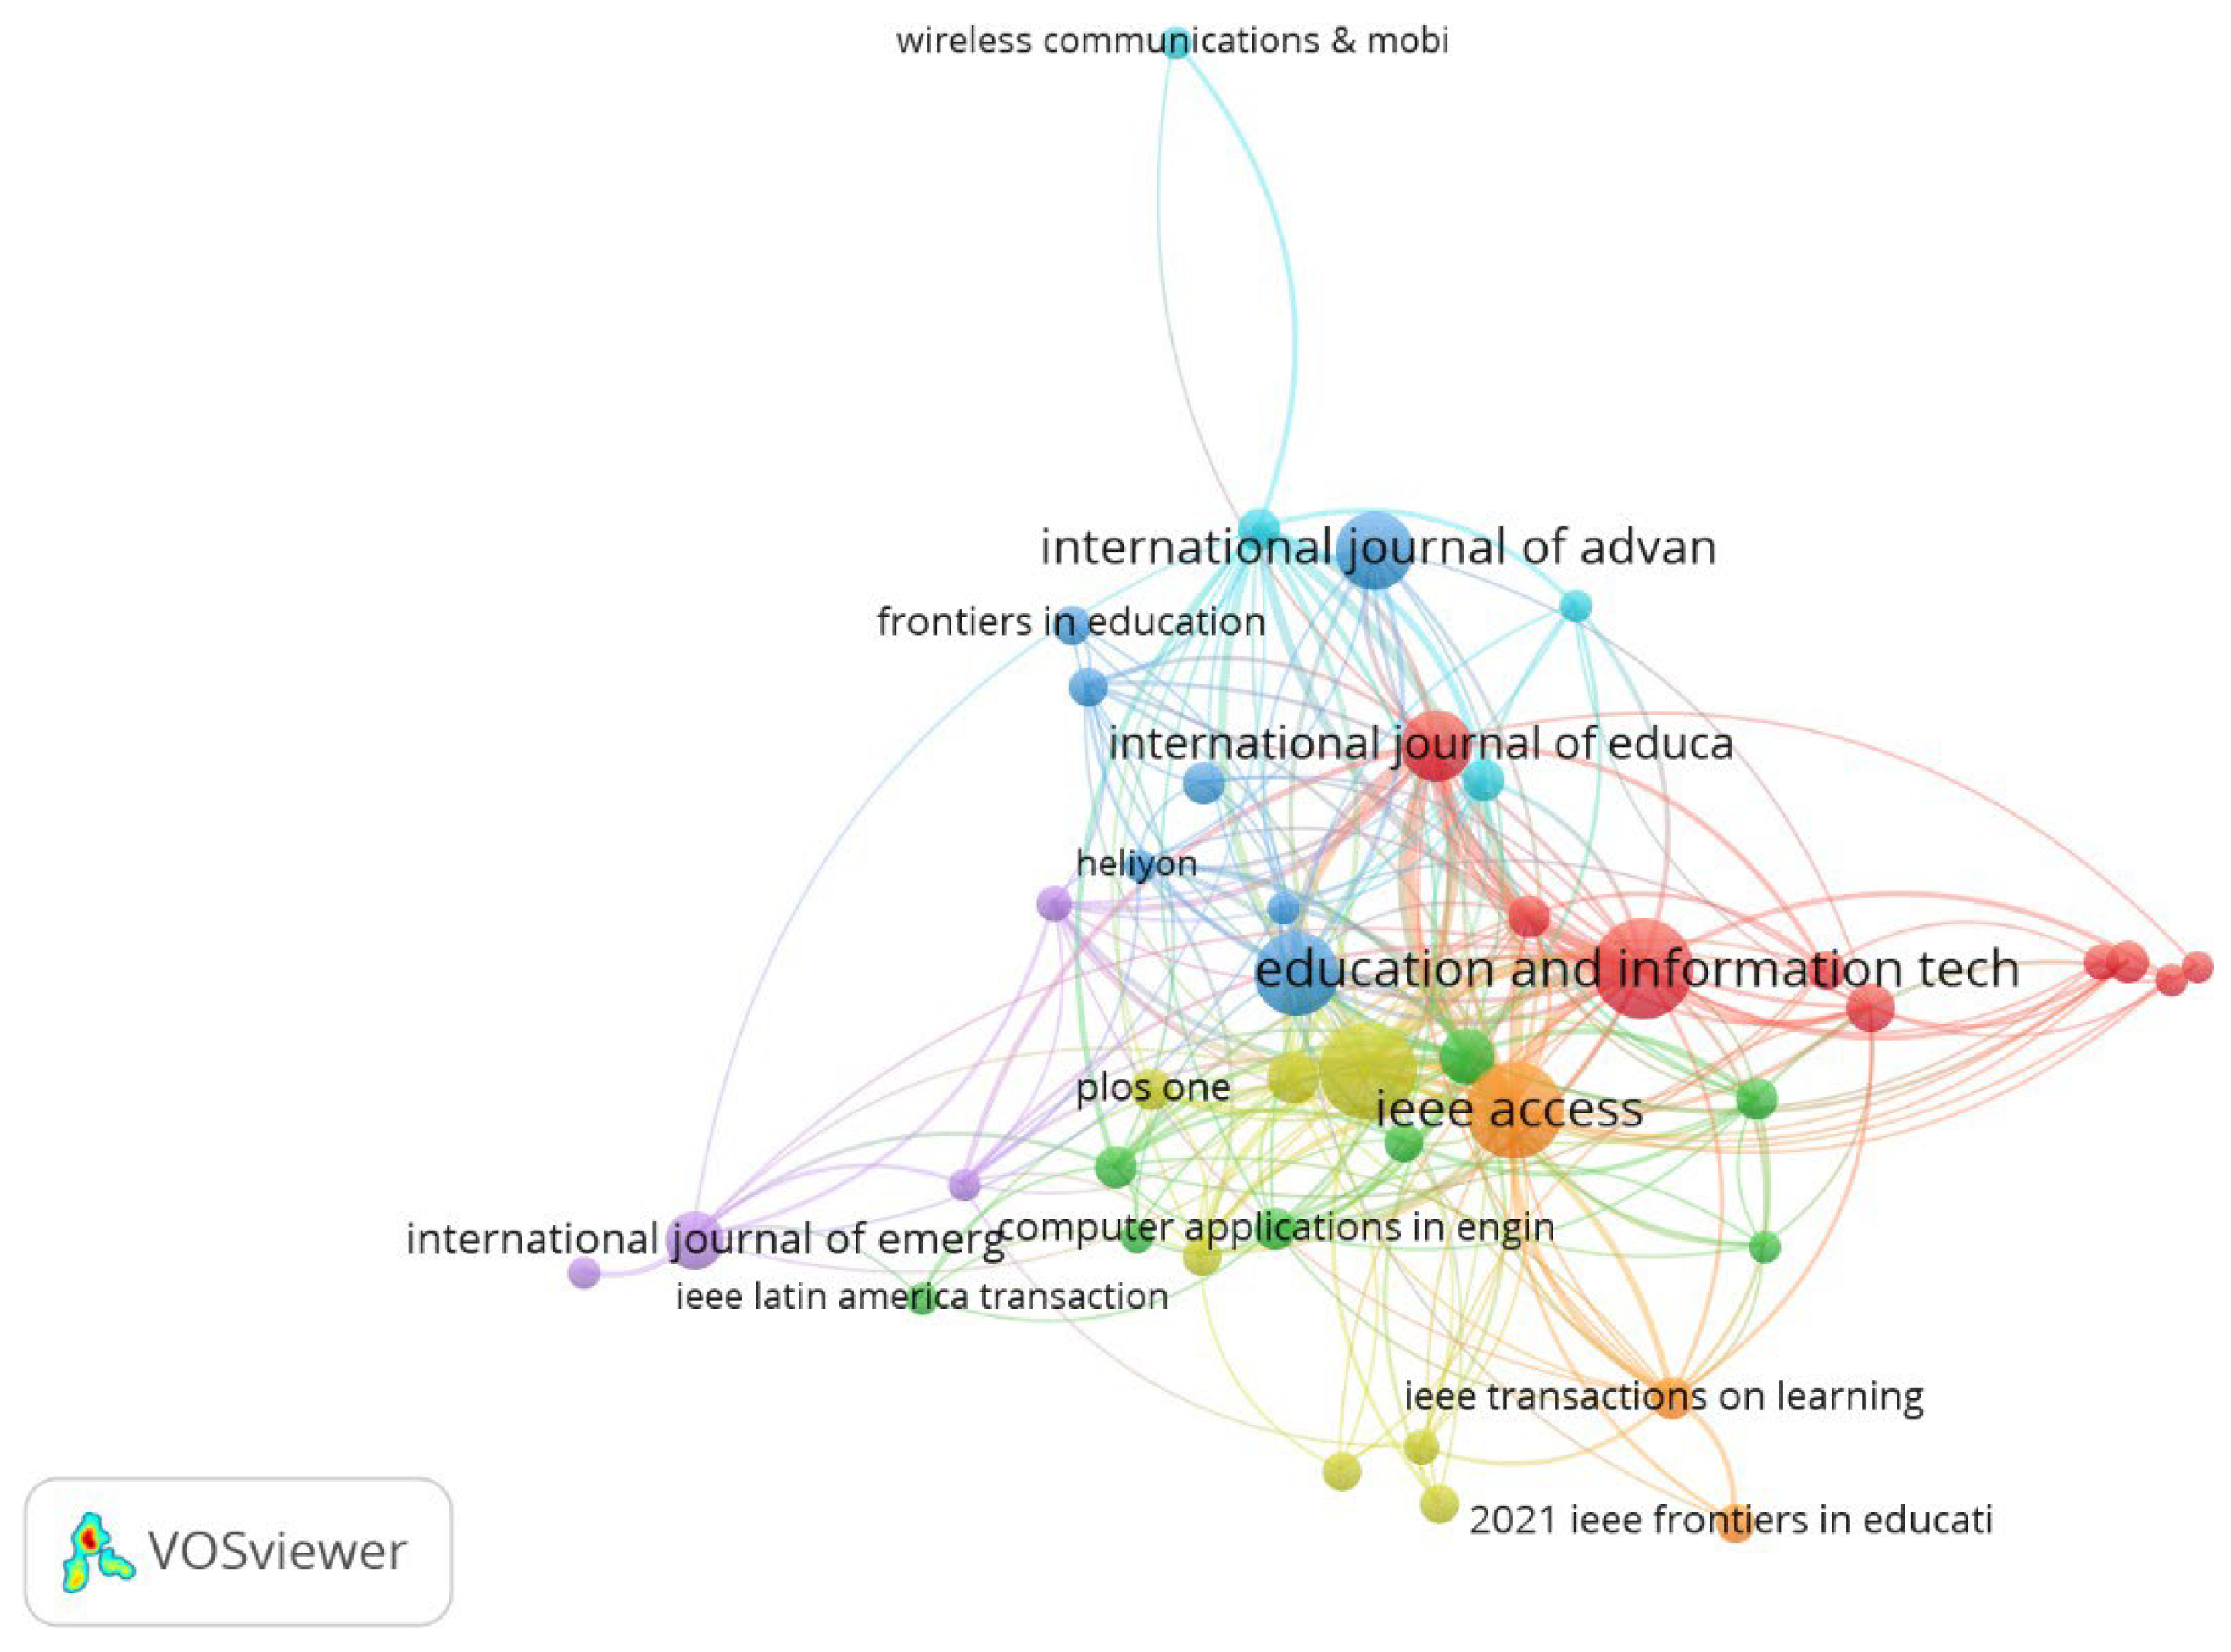
Figure 8.
Citations—sources mapping.
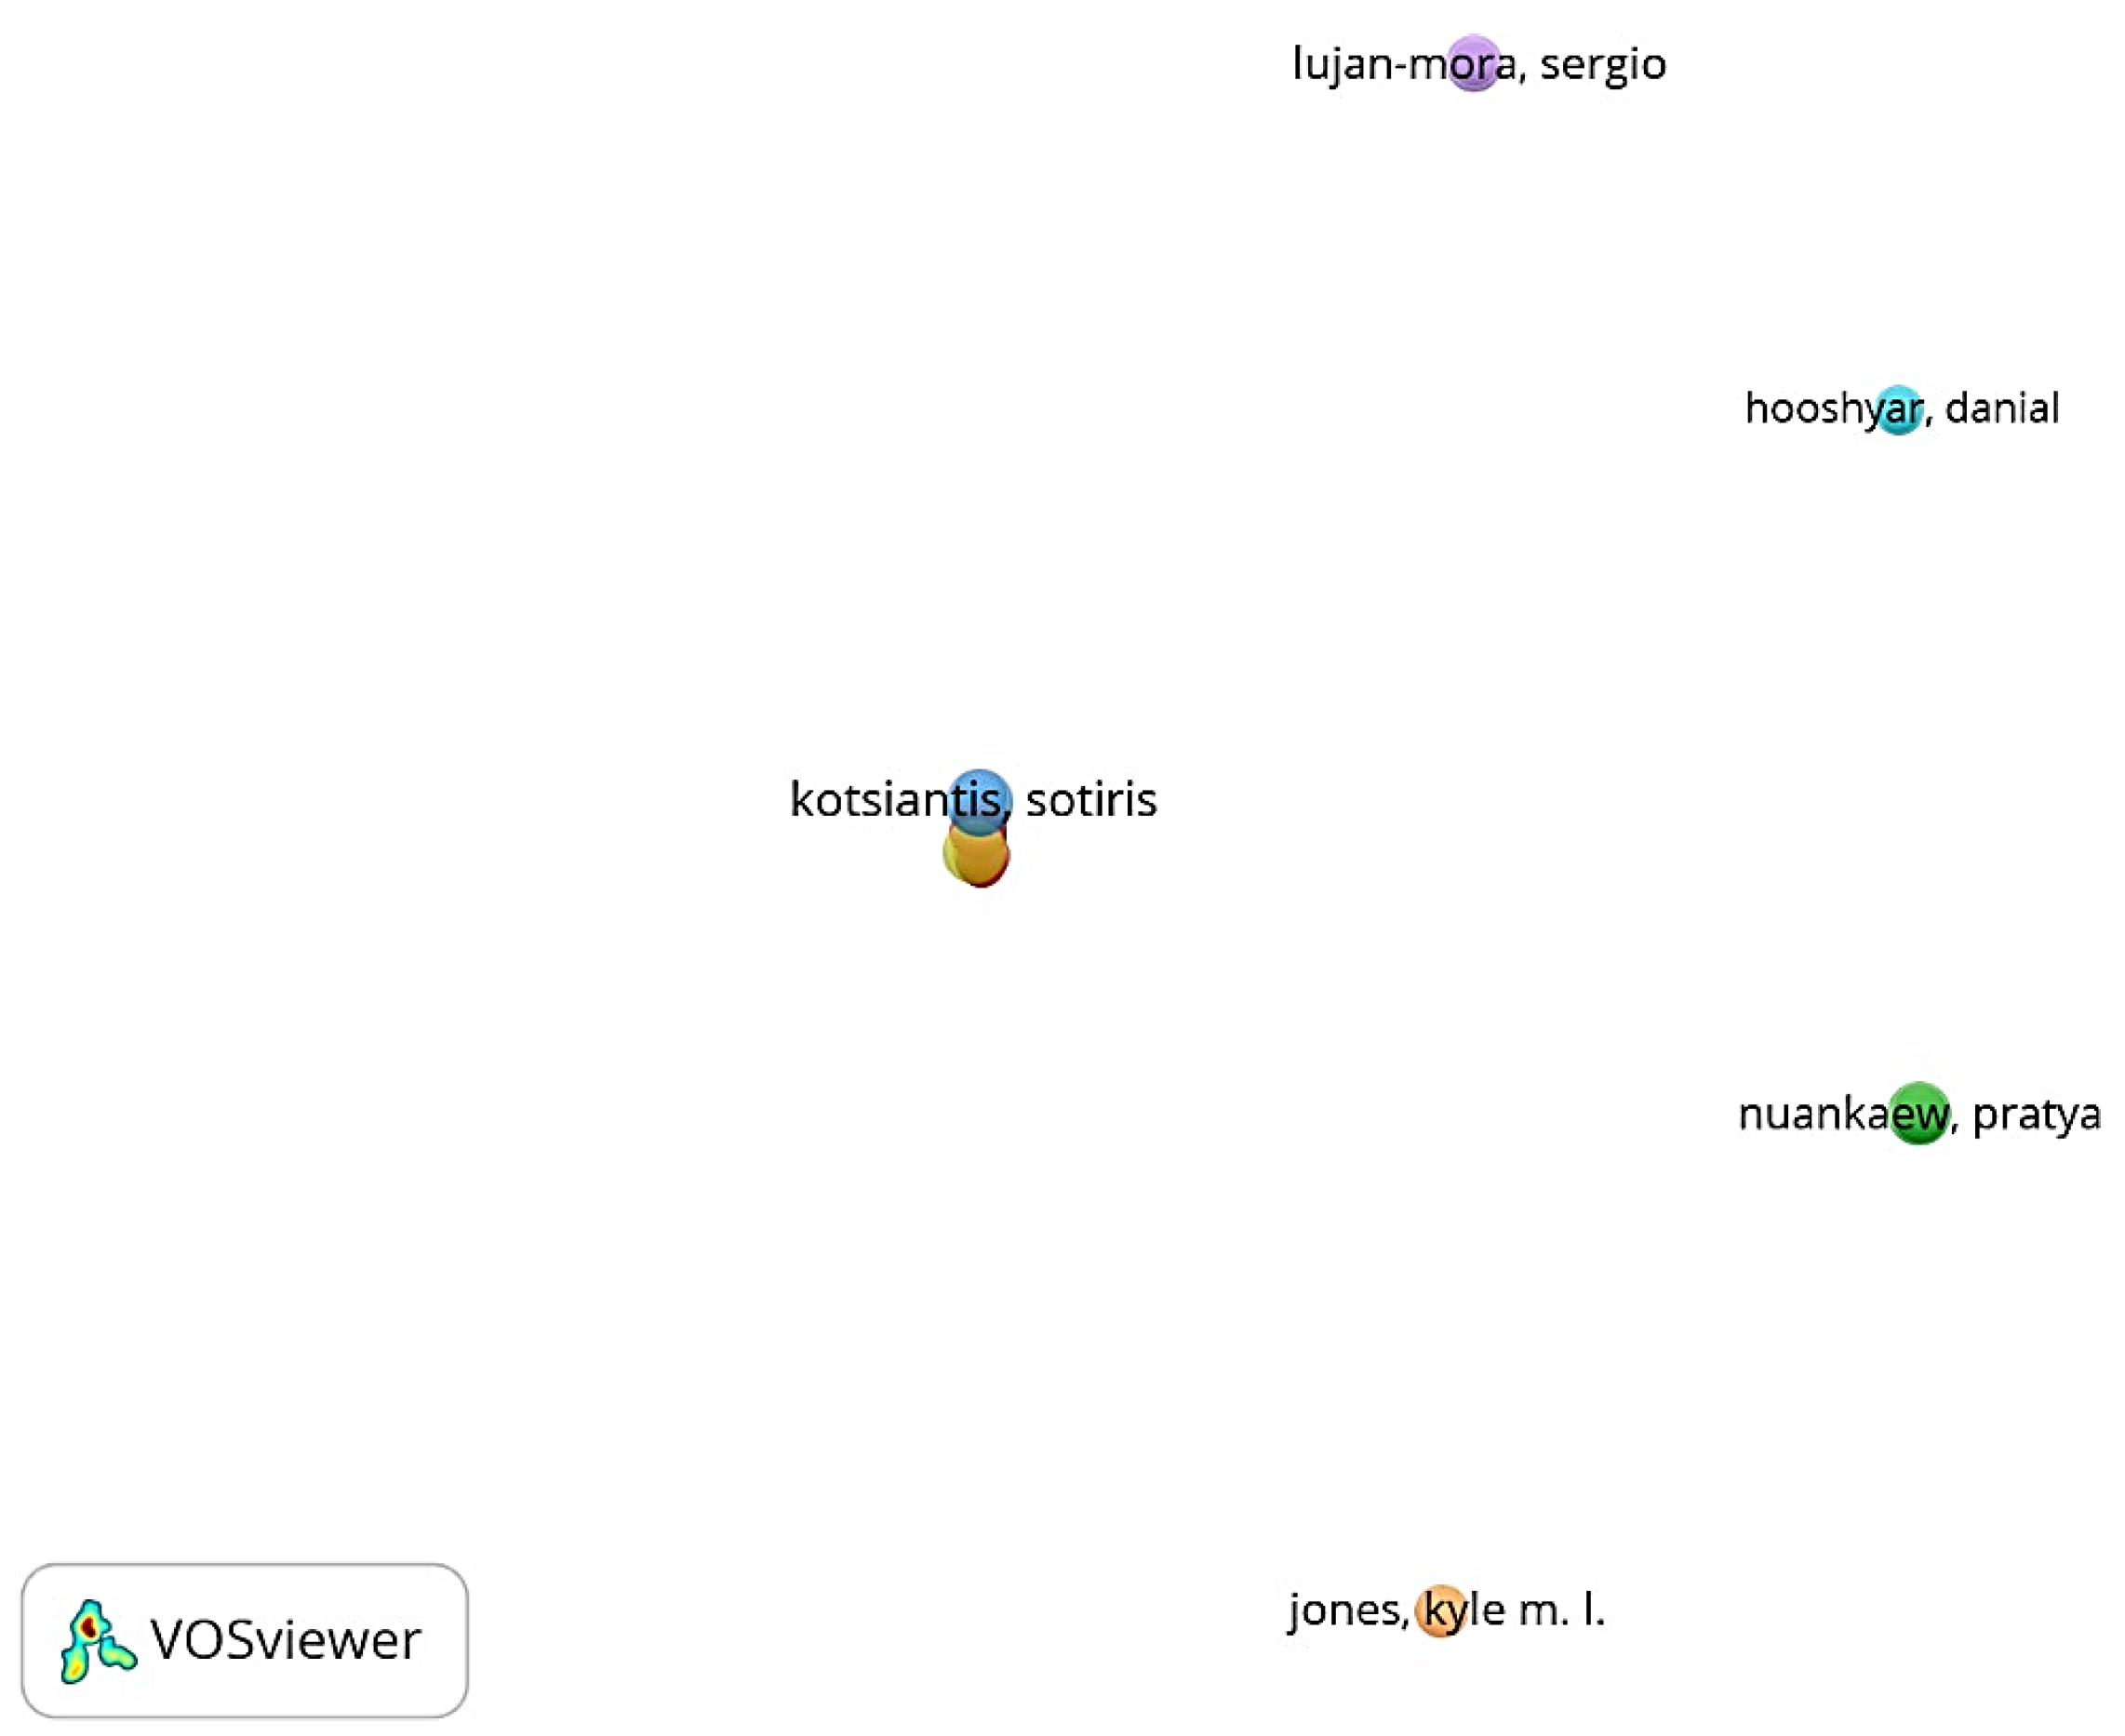
Figure 9.
Network visualization of citation–author nodes.
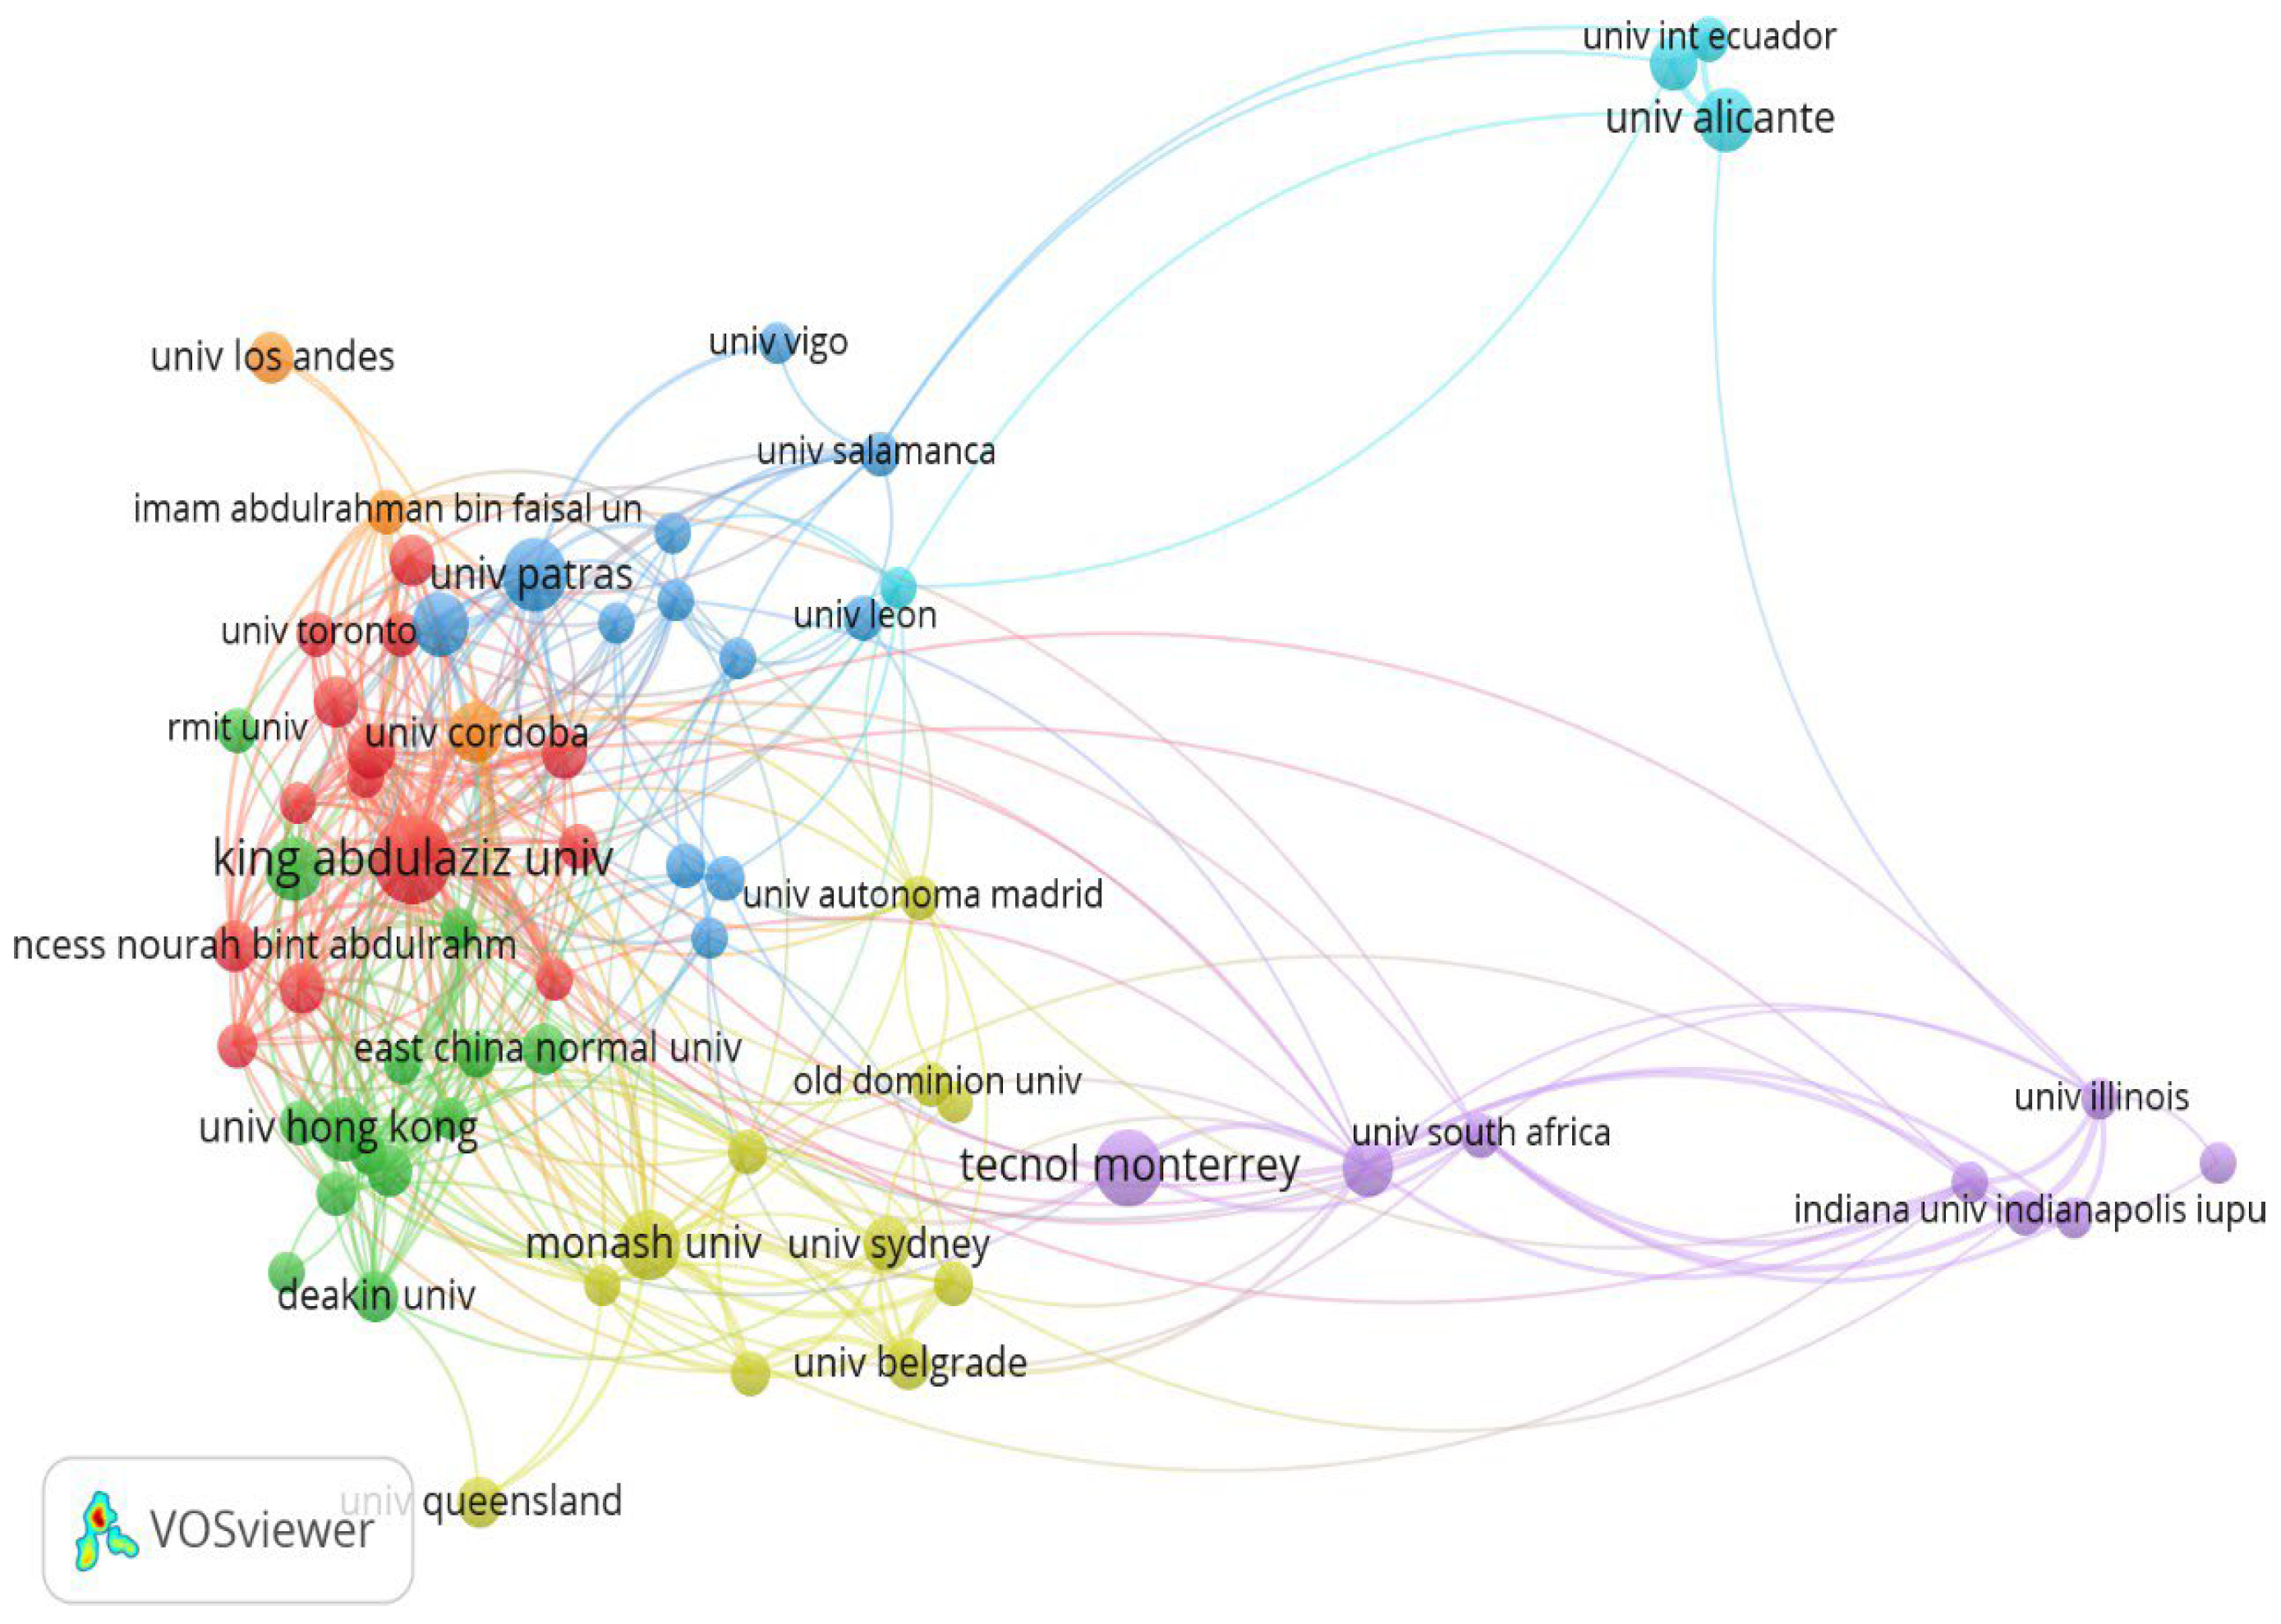
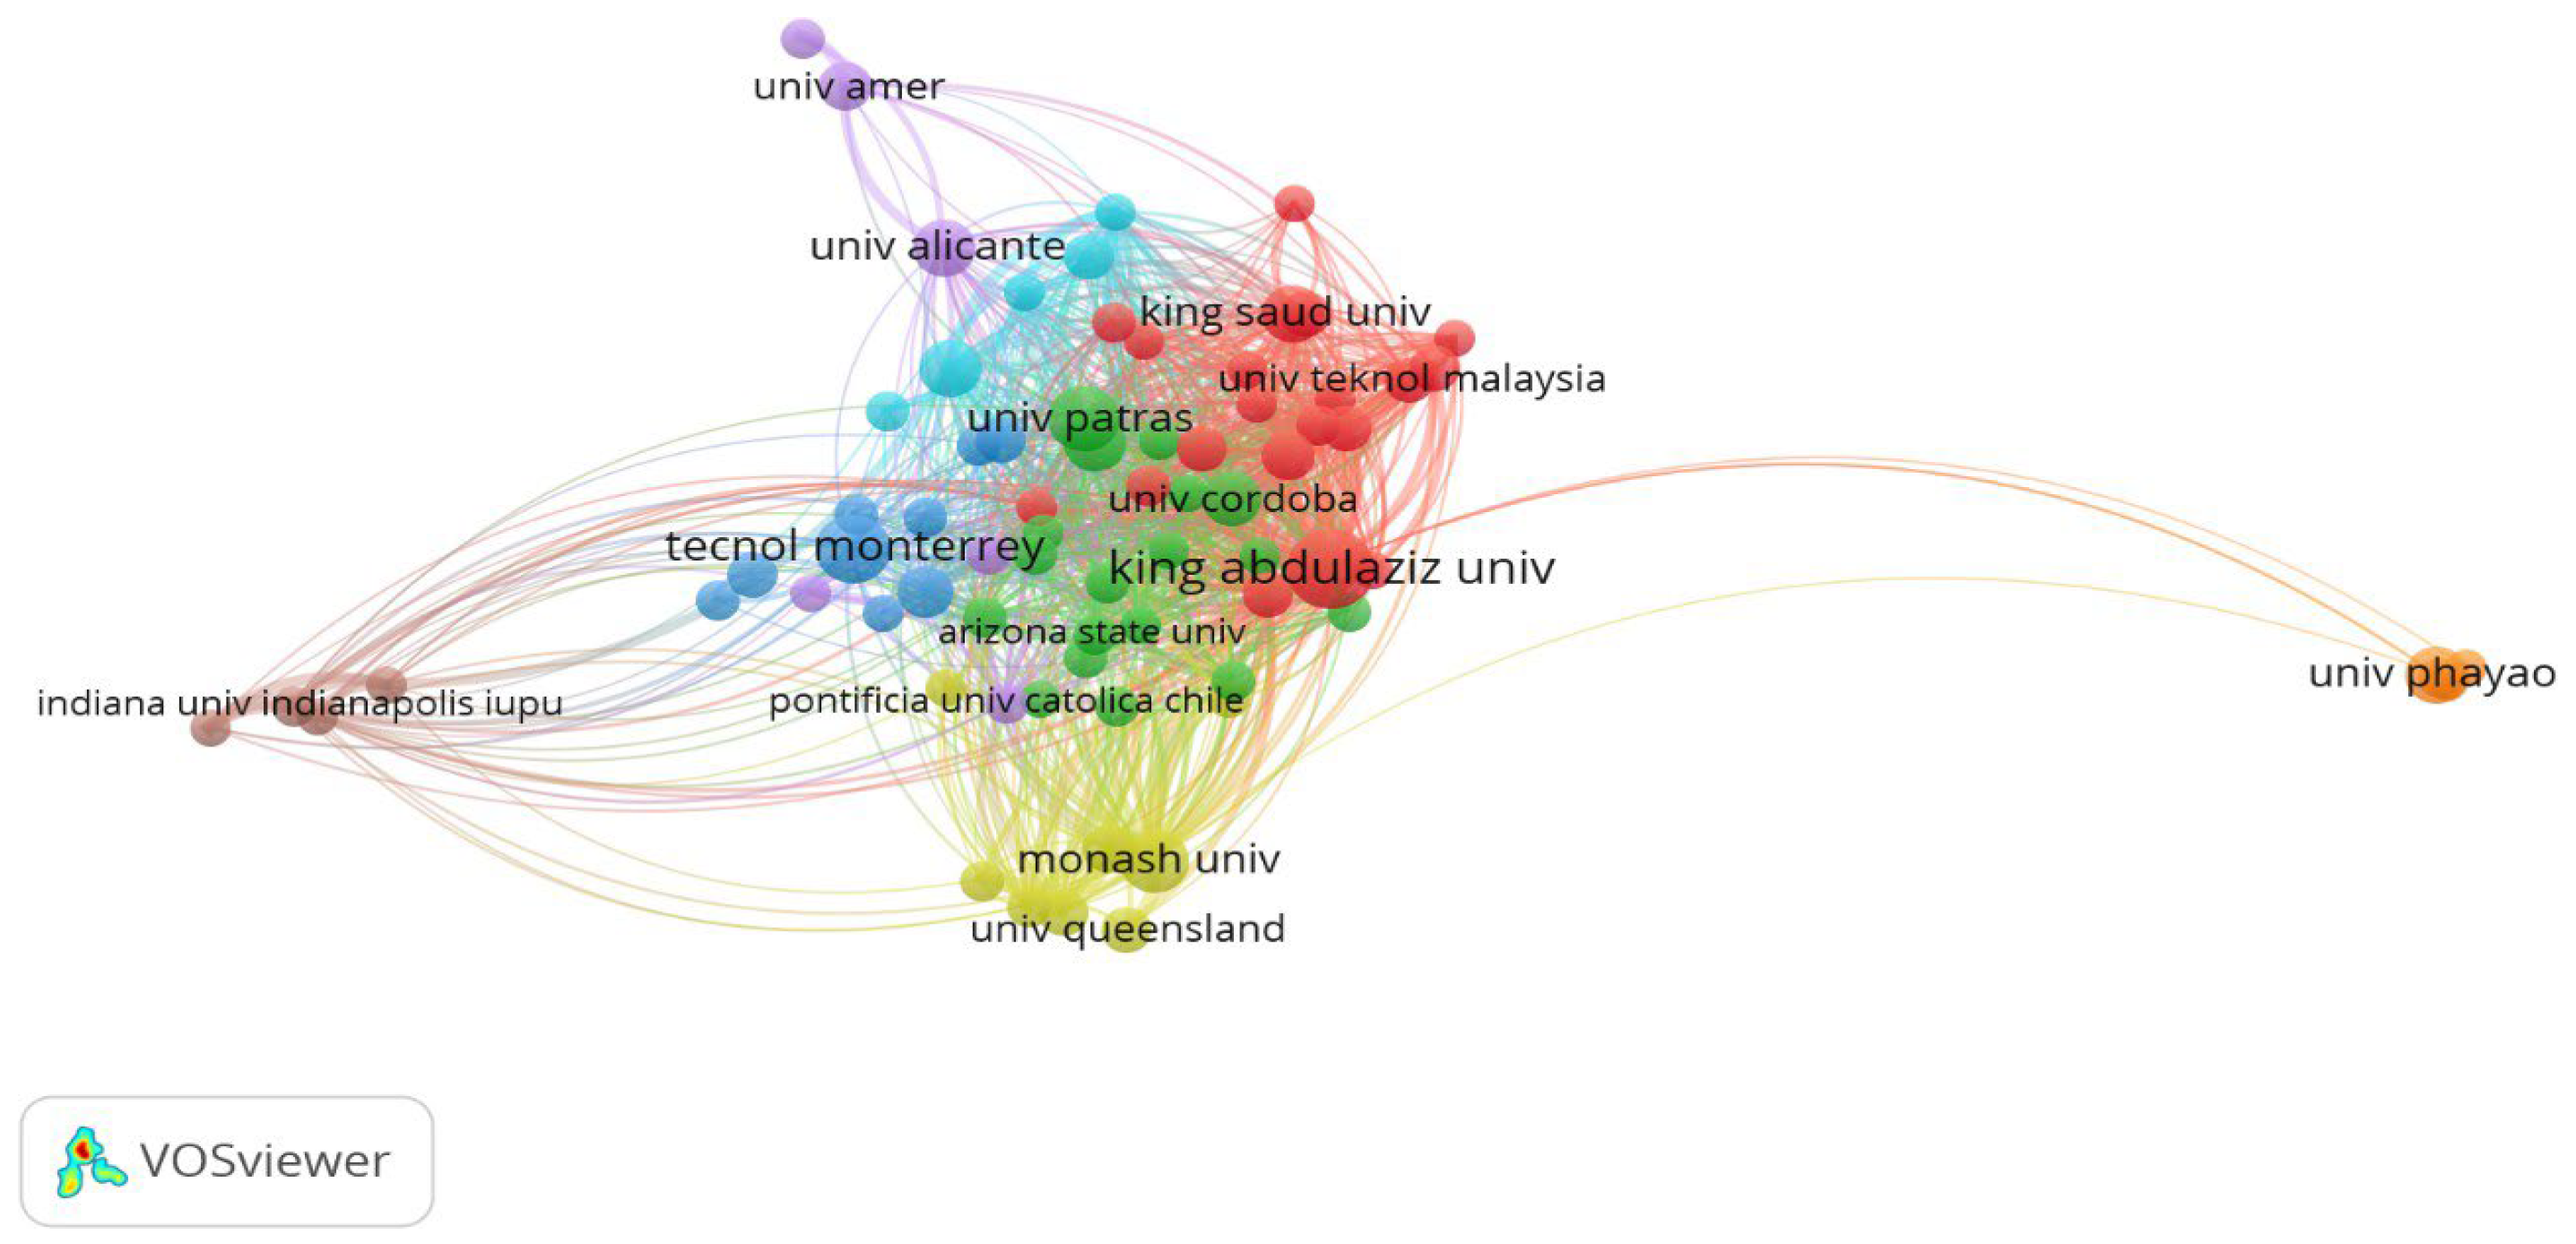
Figure 10.
Network visualization of citation–organization nodes.
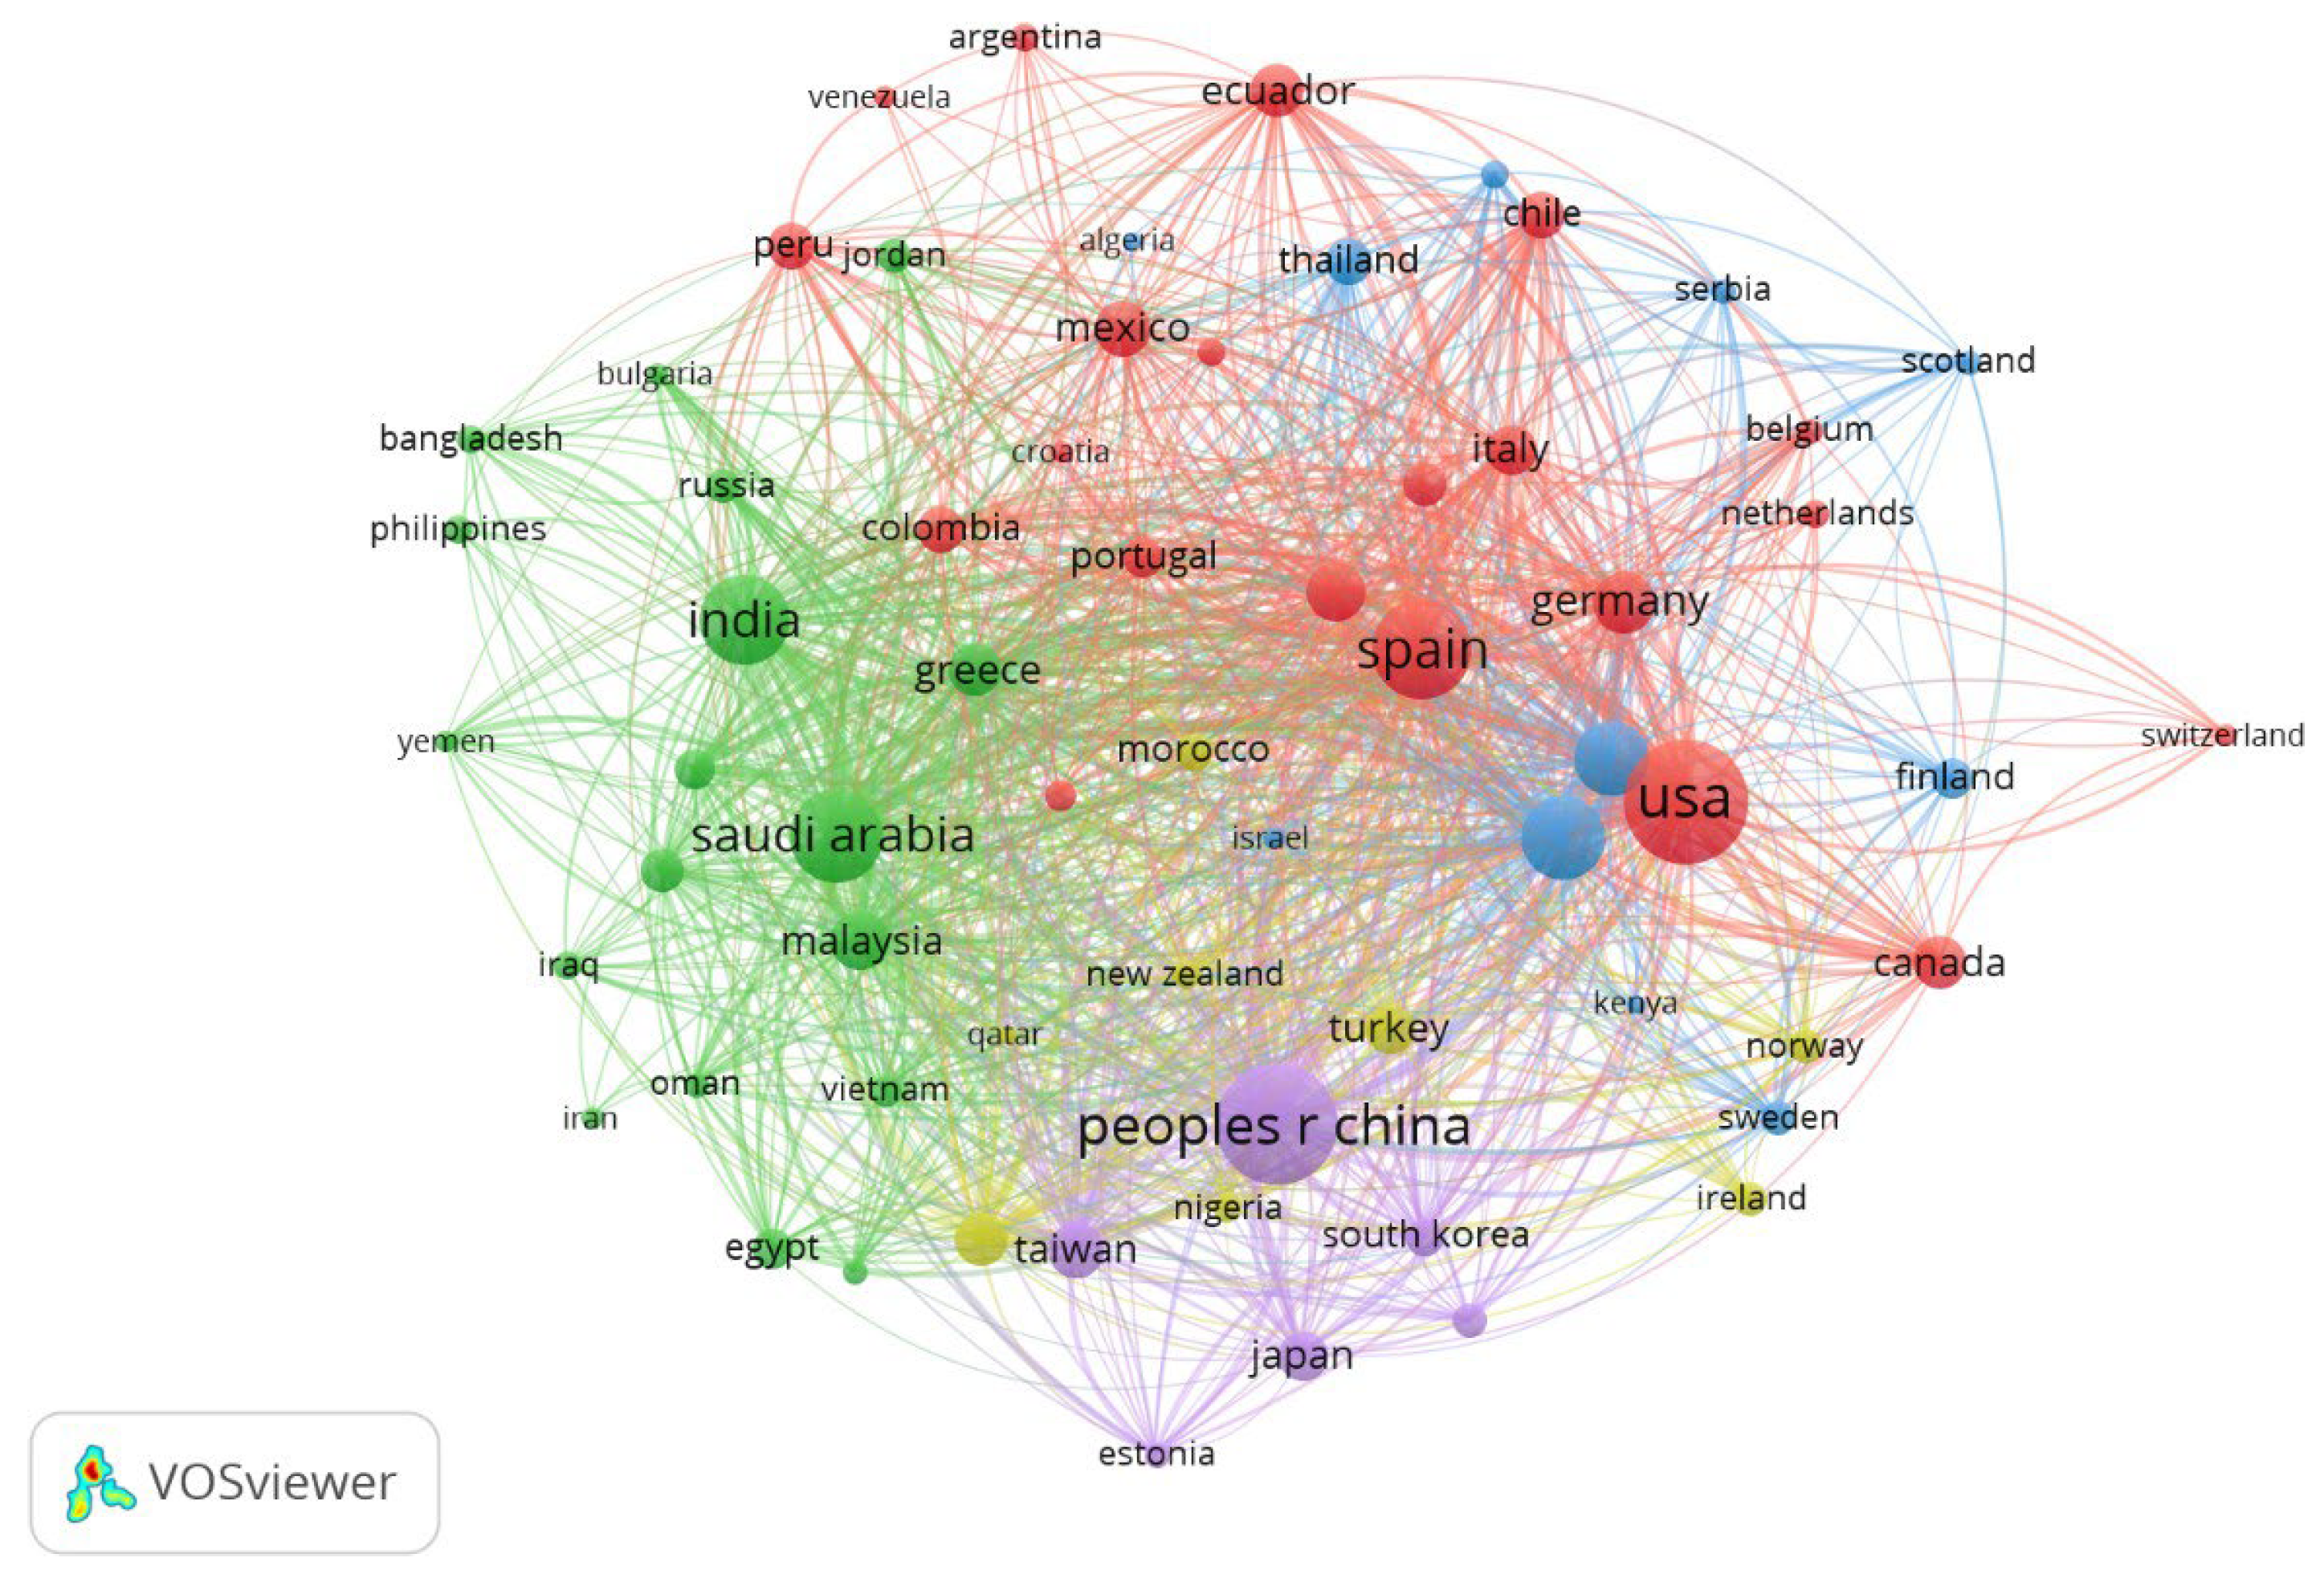
Figure 11.
Network visualization of citation–country nodes.
Figure 12.
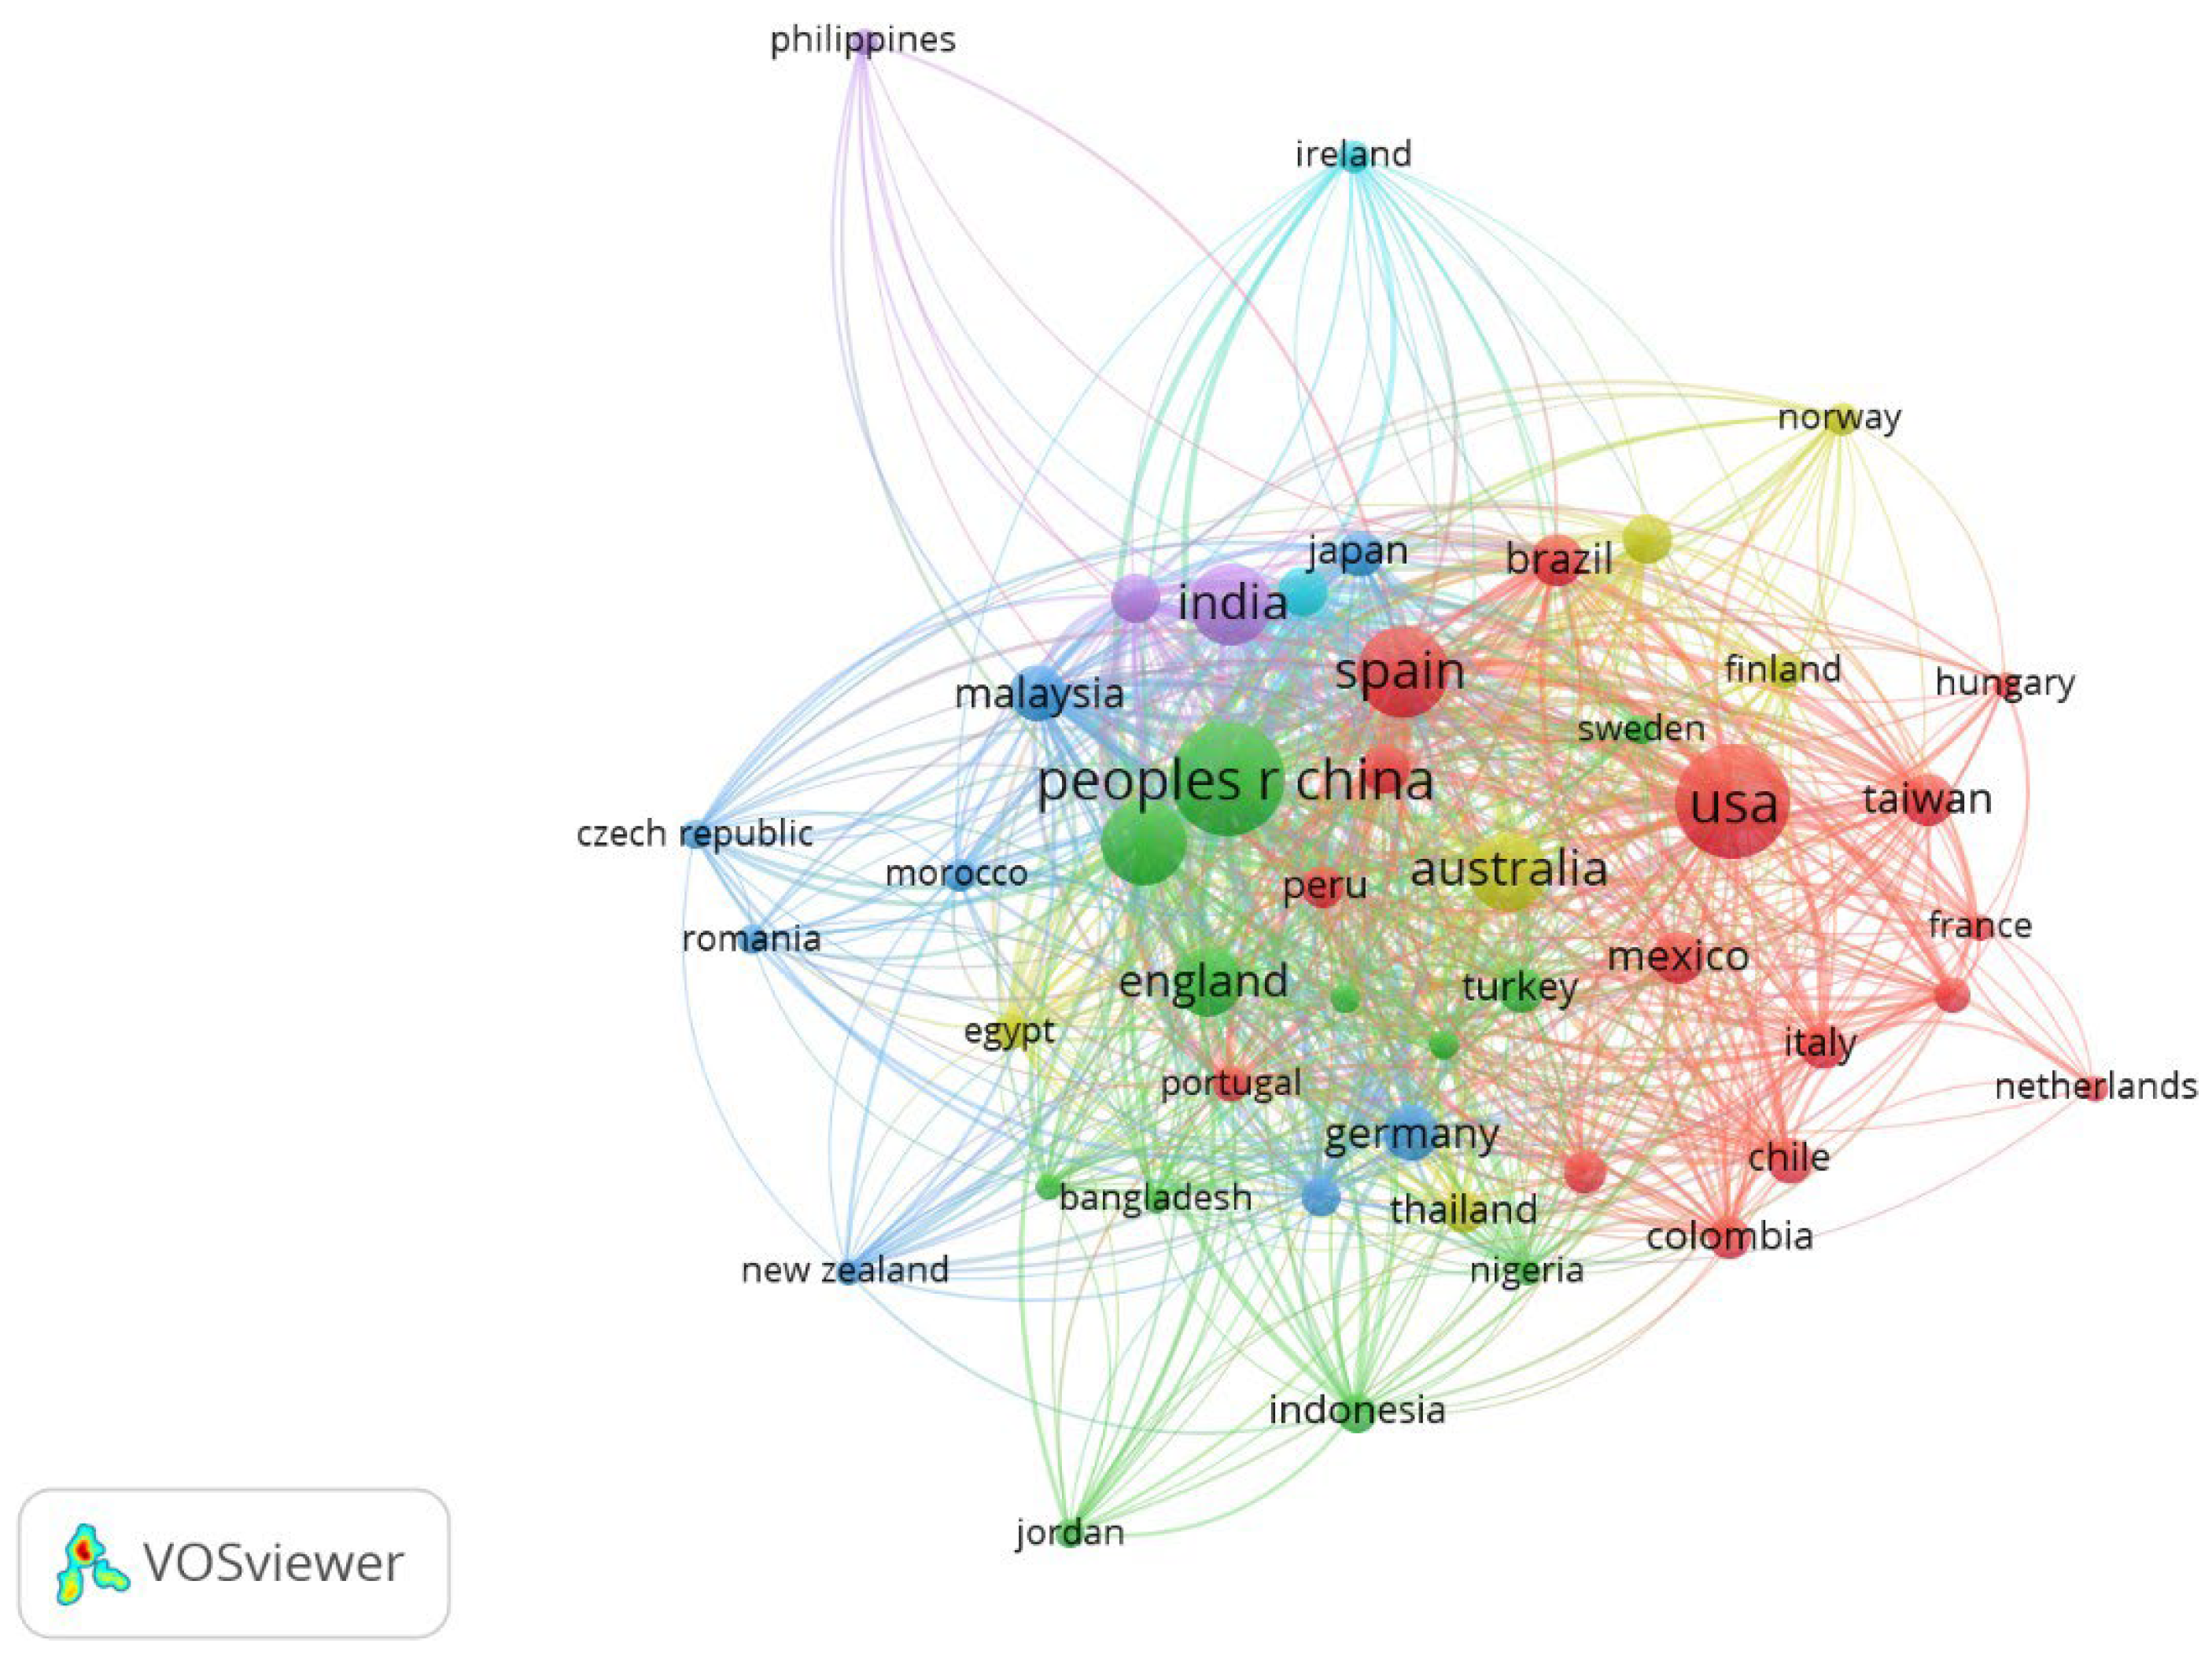
Network visualization of bibliographic coupling–document nodes.
Figure 13.
Network visualization of bibliographic–author nodes.
Figure 14.
Network visualization of bibliographic coupling–country nodes.
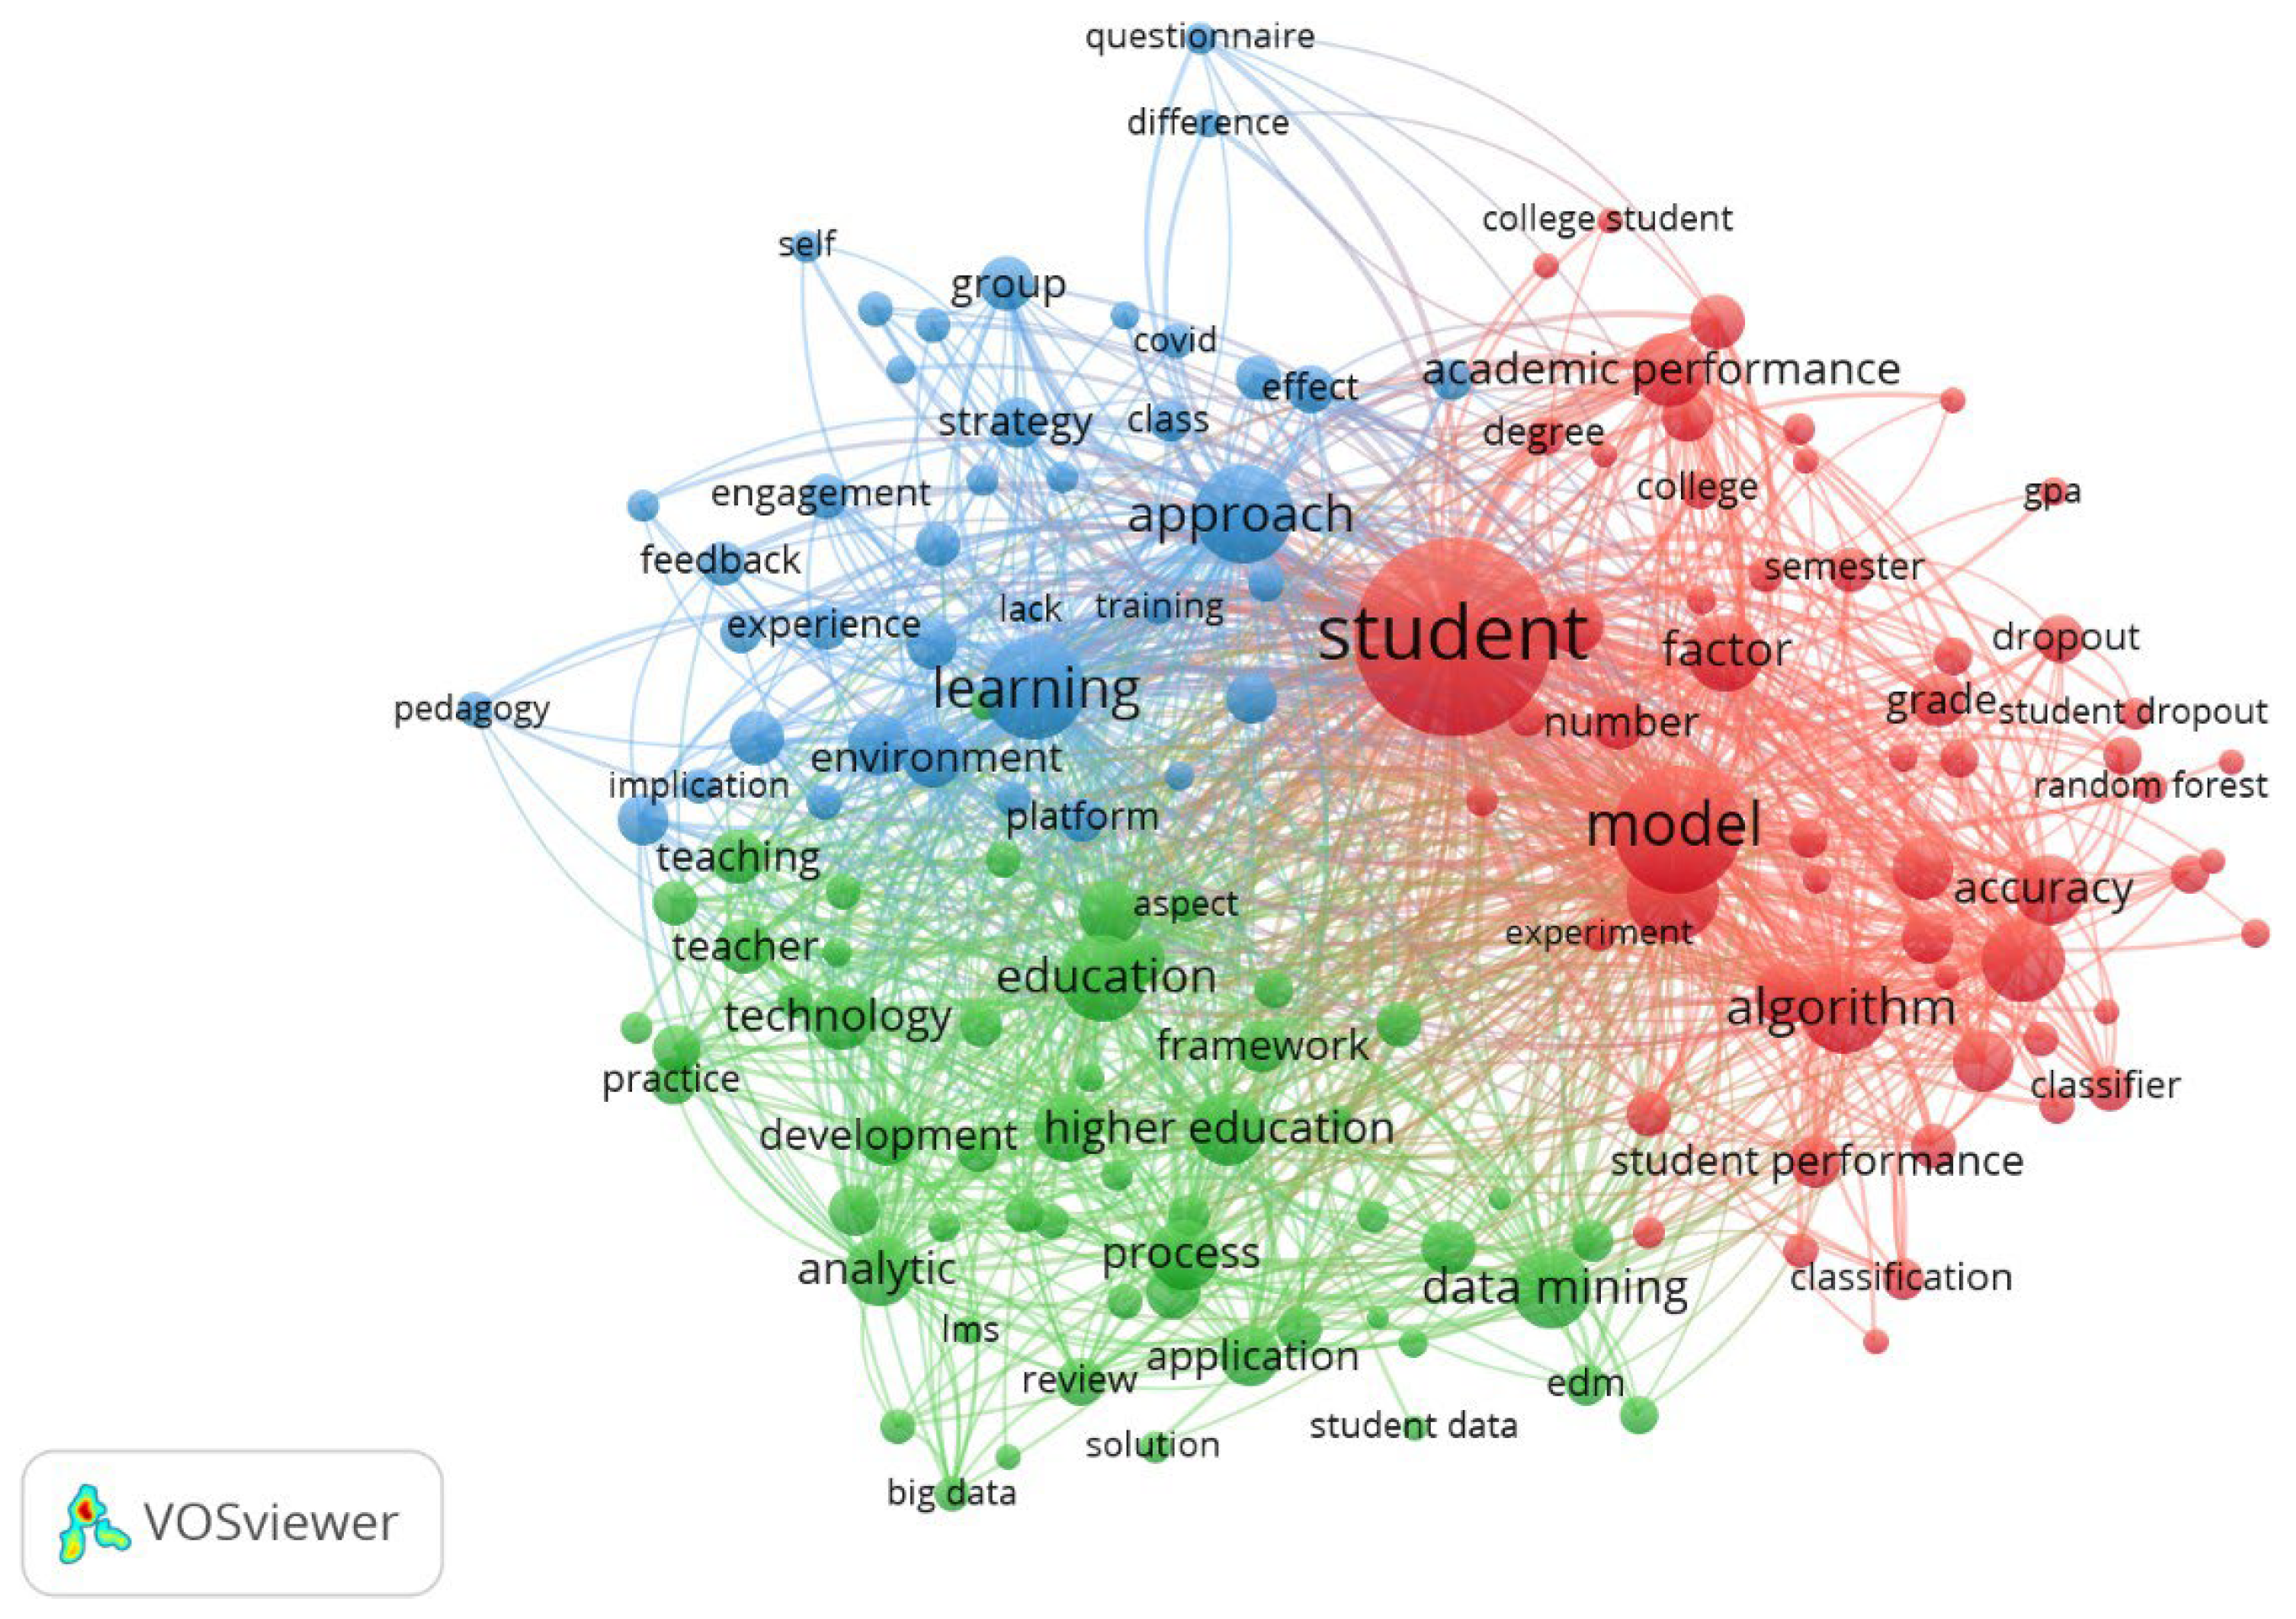
Figure 15.
A network visualization of the co-occurring terms.
Table 1.
WoS-compatible query string for bibliometric analysis.
| Query String |
|---|
| “academic performance*” OR “education modeling” OR “pedagogy*” OR “educational data*” OR “learning analytics*” OR “academic success*” OR “student success*” OR “student dropout*” OR “student enrollment*” OR “precision education*” OR “predictive learning*” OR “student academic*” AND “higher education*” OR “university” OR “universities” OR “tertiary education” |
Table 2.
Main information of the extracted documents.
| Description | Results |
|---|
| Timespan | 2009–2023 |
| Sources (journals, books, etc.) | 802 |
| Documents | 1431 |
| Annual growth rate % | 31.97 |
| Document average age | 4.15 |
| Average citations per doc | 9.573 |
| References | 40.188 |
| Document contents |
| Keywords plus (ID) | 902 |
| Author’s keywords (DE) | 3234 |
| Authors |
| Authors | 4250 |
| Authors of single-authored docs | 132 |
| Author collaboration |
| Single-authored docs | 137 |
| Co-authors per doc | 3.55 |
| International co-authorships % | 23.83 |
| Document types |
| Article | 637 |
| Article; book chapter | 1 |
| Article; data paper | 5 |
| Article; early access | 206 |
| Article; proceedings paper | 2 |
| Correction | 1 |
| Editorial material | 5 |
| Proceedings paper | 515 |
| Proceedings paper; early access | 2 |
| Review | 39 |
| Review; early access | 18 |
Table 3.
The top five institutions with the largest number of publications.
| Affiliation | Articles |
|---|
| Tecnologico De Monterrey | 40 |
| King Abdulaziz University | 32 |
| Egyptian Knowledge Bank | 18 |
| California State University | 14 |
| University of Patras | 13 |
Table 4.
Corresponding author’s countries.
| Country | Articles | SCP | MCP | Freq | MCP_Ratio |
|---|
| China | 182 | 147 | 35 | 0.127 | 0.192 |
| USA | 145 | 123 | 22 | 0.101 | 0.152 |
| Spain | 81 | 66 | 15 | 0.057 | 0.185 |
| India | 79 | 73 | 6 | 0.055 | 0.076 |
| Saudi Arabia | 59 | 42 | 17 | 0.041 | 0.288 |
| Australia | 56 | 35 | 21 | 0.039 | 0.375 |
| United Kingdom | 54 | 39 | 15 | 0.038 | 0.278 |
| Germany | 37 | 24 | 13 | 0.026 | 0.351 |
| Brazil | 36 | 29 | 7 | 0.025 | 0.194 |
| Mexico | 35 | 28 | 7 | 0.024 | 0.2 |
Table 5.
Top ten most cited articles.
| Paper | DOI | Total Citations | TC Per Year | Normalized TC |
|---|
| Zawacki-Richter O., 2019 [24] | https://doi.org/10.1186/s41239-019-0171-0 | 403 | 67.17 | 22.82 |
| Asif R., 2017 [10] | https://doi.org/10.1016/j.compedu.2017.05.007 | 223 | 27.88 | 15.59 |
| Aldowah H., 2019 [25] | https://doi.org/10.1016/j.tele.2019.01.007 | 192 | 32.00 | 10.87 |
| Costa Eb., 2017 [26] | https://doi.org/10.1016/j.chb.2017.01.047 | 184 | 23.00 | 12.86 |
| Cerezo R., 2016 [27] | https://doi.org/10.1016/j.compedu.2016.02.006 | 172 | 19.11 | 12.31 |
| Onan A., 2021 [28] | https://doi.org/10.1002/cae.22253 | 167 | 41.75 | 21.51 |
| Romero C., 2013 [29] | https://doi.org/10.1002/cae.20456 | 162 | 13.50 | 6.37 |
| Waheed H., 2020 [30] | https://doi.org/10.1016/j.chb.2019.106189 | 157 | 31.40 | 11.62 |
| Alyahyan E., 2020 [31] | https://doi.org/10.1186/s41239-020-0177-7 | 128 | 25.60 | 9.47 |
| Natek S., 2014 [32] | https://doi.org/10.1016/j.eswa.2014.04.024 | 110 | 10.00 | 7.65 |
Table 6.
Core sources by Bradford’s Law.
| Source | Rank | Freq | cumFreq | Zone |
|---|
| Education and Information Technologies | 1 | 41 | 41 | Zone 1 |
| IEEE Access | 2 | 40 | 81 | Zone 1 |
| Applied Sciences-Basel | 3 | 38 | 119 | Zone 1 |
| Sustainability | 4 | 29 | 148 | Zone 1 |
| International Journal of Advanced Computer Science and Applications | 5 | 26 | 174 | Zone 1 |
| International Journal of Educational Technology in Higher Education | 6 | 22 | 196 | Zone 1 |
| International Journal of Emerging Technologies in Learning | 7 | 14 | 210 | Zone 1 |
| Computers & Education | 8 | 13 | 223 | Zone 1 |
| Education Sciences | 9 | 11 | 234 | Zone 1 |
| British Journal of Education Technology | 10 | 10 | 244 | Zone 1 |
| Disclaimer/Publisher’s Note: The statements, opinions and data contained in all publications are solely those of the individual author(s) and contributor(s) and not of MDPI and/or the editor(s). MDPI and/or the editor(s) disclaim responsibility for any injury to people or property resulting from any ideas, methods, instructions or products referred to in the content. |
© 2025 by the authors. Licensee MDPI, Basel, Switzerland. This article is an open access article distributed under the terms and conditions of the Creative Commons Attribution (CC BY) license (https://creativecommons.org/licenses/by/4.0/).
