Abstract
Ordinal regression combines classification and regression techniques, constrained by the intrinsic order among categories. It has wide-ranging applications in real-world scenarios, such as product quality grading, medical diagnoses, and facial age recognition, where understanding ranked relationships is crucial. Existing models, which often employ a series of binary classifiers with ordinal consistency loss, effectively enforce global order consistency but frequently encounter misclassification errors between adjacent categories. Achieving both global and local (neighbor-level) ordinal consistency, however, remains a significant challenge. In this study, we propose a hybrid ordinal regression model that addresses global ordinal structure while enhancing local consistency between neighboring categories. Our approach leverages ordinal metric learning to generate embeddings that capture global ordinal relationships and extends consistent rank logits with a neighbor order penalty in the loss function to reduce adjacent category misclassifications. Experimental results on multiple benchmark ordinal datasets demonstrate that our model significantly minimizes neighboring misclassification errors and global order inconsistencies, outperforming existing ordinal regression models.
1. Introduction
Ordinal regression is a specialized form of supervised learning designed for tasks where target variables exhibit a natural, ordered progression [1]. Situated between classification and regression, it combines the ability to handle discrete categories with the capacity to capture their inherent rank order. This makes ordinal regression particularly valuable in domains where label ordering carries semantic meaning, such as disease severity grading in healthcare, credit risk assessment in finance, or satisfaction rating in customer feedback systems. Unlike traditional classification models that treat class labels as independent, ordinal regression considers them as points along a continuum, enabling more nuanced and contextually accurate predictions [2].
Despite its practical relevance, ordinal regression still faces significant technical challenges. Classical statistical techniques such as ordinal logistic regression and cumulative link models provide interpretable results but do not scale effectively to high-dimensional, non-linear data such as images. More recent deep learning-based methods adapt classification architectures using label encoding schemes, cumulative losses, or binary decomposition strategies to approximate ordinal behavior. However, these models often lack explicit mechanisms to enforce global ordinal structure across all classes and typically neglect the subtle but important relationships between adjacent labels. Such shortcomings can degrade performance in fine-grained applications, including facial age estimation and medical disease staging, where small deviations between categories are common yet impactful.
Recent efforts have introduced ordinal constraints into loss functions and representation learning to better preserve ordering [3,4,5]. Examples include ranking-based losses, multi-output convolutional neural networks (CNNs), and ordinal embeddings based on metric learning. While these approaches improve overall ordinal consistency, most focus on penalizing large misclassifications or enforcing global order, without adequately addressing adjacent label errors. Yet in many real-world applications, especially those involving images, the most frequent and problematic mistakes occur between neighboring categories. These seemingly minor misclassifications can erode model stability and reduce trust in critical applications, such as when differentiating between moderate and severe disease stages.
Motivated by these observations, this work focuses on ordinal regression for image-based prediction tasks, where spatial features are rich and ordinal labels often reflect semantic or pathological progression. Representative use cases include facial age estimation, medical imaging for disease severity assessment, and quality control in industrial inspection. In such contexts, existing ordinal losses frequently fail to encourage the smooth label transitions necessary for robust boundary formation. Our goal is to directly address this gap by integrating a globally consistent embedding space with a loss function that explicitly penalizes adjacent misclassifications.
To this end, we propose a comprehensive model that jointly enforces global ordinal structure and local label consistency. First, we employ an ordinal metric learning framework inspired by [6], where the ordinal relationships are represented through angular distances learned via a triplet-based embedding strategy. This produces a feature space where ordinal proximity is geometrically meaningful. Second, we enhance the Consistent Rank Logits loss [7] by introducing a novel neighbor penalty term, which constrains predictions to evolve smoothly across adjacent ordinal ranks. While prior methods focus primarily on penalizing distant errors, our formulation directly addresses fine-grained inconsistencies by enforcing structural smoothness at a local level. Experiments across multiple domains, including medical imaging, facial analysis, and industrial inspection, show that our approach significantly reduces adjacent-category errors and outperforms existing ordinal regression models. This not only improves model reliability but also enhances decision-making in practical deployments.
The main contributions of this work are summarized as follows:
- We propose a novel framework for ordinal regression that integrates global ordinal metric learning with a local neighbor-aware loss, specifically designed for image-based ordinal prediction tasks.
- We introduce a new neighbor penalty term that explicitly targets adjacent misclassifications, offering a complementary constraint to existing ordinal loss functions and improving stability in fine-grained settings.
- We demonstrate the effectiveness of the proposed method on diverse datasets across medical imaging, facial age estimation, and industrial quality control, achieving consistent improvements over state-of-the-art ordinal regression models.
The remainder of the paper is organized as follows: Section 2 reviews related work on ordinal regression and embedding. Section 3 introduces the problem formulation and the proposed method. Section 4 outlines the experimental setup and discusses the results. Section 5 addresses the limitations and outlines potential directions for future research. Finally, Section 6 summarizes the key findings and concluding remarks.
2. Related Works
2.1. Ordinal Regression
Recent advancements in ordinal regression have explored integrating convolutional neural networks (CNNs) with random forests to preserve target distributions, showing promise in tasks like age estimation from facial images [4]. However, this approach faces limitations in adaptability and computational efficiency. The random forest’s structure is predetermined, with split nodes selected from the CNN’s fully connected (FC) layer features, restricting dynamic adjustments during training and limiting generalization across diverse data distributions [8]. Furthermore, the computational demands are significant, as the deep layers of the CNN are resource-intensive, and the random forest adds overhead through multiple tree evaluations. This combination results in a model that is both resource-heavy and slow to train, making it impractical for large-scale or high-resolution datasets.
In ordinal data classification, CNN is commonly applied with parameters optimized using cross-entropy (CE) loss. However, CE loss does not adequately capture the ordinal structure of labels, prompting the development of specialized methods, particularly in medical image classification [9]. A foundational approach involves constructing multiple binary classification tasks to compute cumulative probabilities. To adapt CNNs for ordinal data, ref. [5] introduced Ranking-CNN, an ensemble of CNNs for binary classification that aggregates predictions to estimate age labels [3]. Their findings showed that such ensembles outperform a single CNN with multiple binary outputs [5]. Nevertheless, independently trained binary classifiers overlook ordinal relationships among labels, undermining the preservation of global ordinal structure [4,5]. To address this, ref. [7] proposed the Consistent Rank Logits (CORAL) framework, which enforces rank monotonicity and consistent confidence scores with robust theoretical guarantees. However, while these improvements enhance global order learning, they can also reduce the model’s ability to distinguish adjacent categories, increasing the likelihood of misclassification between neighboring classes due to small probability differences.
Recent efforts in ordinal regression have integrated CNNs with random forests for enhanced ordinal relationship modeling. Ref. [4] introduced the Convolutional Ordinal Regression Forest (CORF), combining CNNs with differentiable decision trees to optimize binary classifiers jointly, leveraging ordinal relationships. Similarly, ref. [8] developed the Meta Ordinal Regression Forest (MORF), a meta-learning framework for medical image classification. However, these methods face high computational complexity, limiting scalability and applicability in resource-constrained environments.
Beyond deep learning, traditional machine learning models have also been adapted for ordinal regression. For example, binary SVMs have been extended to ordinal structures [10], and pinball loss functions have been proposed to improve ranking performance [11]. However, these approaches often rely on multiple binary classifiers, which increases the risk of adjacent-category misclassification and limits scalability. Recent methods focus on learning ordinal-aware features, such as Ordinal Deep Feature Learning (ODFL) for facial age estimation [12] and unimodal regularization for cross-entropy loss [13]. While many emphasize penalizing large ranking errors, preserving local consistency between adjacent ranks is equally important. Frequent small misclassifications can still disrupt ordinal structure and destabilize decision boundaries, particularly in fine-grained tasks.
Facial age estimation has long served as a benchmark task in computer vision, with growing interest in modeling it as an ordinal regression problem due to the inherently ordered structure of age labels. Traditional approaches that frame age estimation as either regression or multi-class classification fail to capture ordinal relations, potentially leading to semantically inconsistent predictions. Consequently, a substantial body of work has shifted towards designing models that explicitly encode age progression as an ordinal structure.
One early and influential method is the Ranking-CNN framework, which decomposes age prediction into a series of binary classification tasks [5]. Each binary classifier determines whether the input face is older than a given age threshold. The final age prediction is then computed by summing the outputs. This strategy introduces a margin-based formulation with strong theoretical guarantees on error bounds. Compared to conventional multiclass classification, Ranking-CNN more effectively exploits age–order relationships, thereby reducing prediction variance.
Building on this ordinal decomposition idea, Ordinal Regression with Multiple Output CNNs introduced an end-to-end learning framework that simultaneously learns age-relevant features and solves a series of ordinal sub-tasks [3]. The method enables joint learning across binary classifiers through a shared convolutional backbone, preserving inter-task correlations and enhancing model robustness. To support large-scale evaluation, the authors introduced the Asian Face Age Dataset (AFAD), which includes over 160,000 labeled images, significantly expanding the empirical scope for age estimation research.
To further model global ordinal consistency, the Convolutional Ordinal Regression Forest (CORF) framework integrated differentiable decision trees with convolutional feature extraction [4]. Unlike prior binary decomposition methods, CORF directly learns a coherent ordinal distribution by jointly optimizing all ordinal constraints in a single model. This leads to improved global order preservation and smoother predictions. Evaluations on facial age estimation and image aesthetic scoring demonstrated its effectiveness and stability across multiple ordinal estimation tasks.
Recognizing the spatial heterogeneity of aging features, the Deep Multi-Input Multi-Stream Ordinal (D2MO) model employs multi-scale attention mechanisms to capture both global context and localized facial cues such as wrinkles and hair color [14]. The model operates through a multi-stream architecture combining full-face images and cropped patches, enhancing its ability to capture fine-grained aging signals. By casting age prediction as a label distribution learning problem using multi-hot vectors, D2MO leverages ordinal supervision alongside label distribution and regression objectives within a unified training paradigm, achieving state-of-the-art results on MORPH II, FG-NET, and UAGD.
While deep neural networks provide strong empirical performance, their lack of interpretability remains a barrier for high-stakes applications such as biometrics and forensics. To bridge this gap, Ordinal Neural Network Transformation Models (ontrams) were recently introduced [15]. These models synergize deep learning with classical ordinal regression by decomposing the transformation function additively across image and tabular predictors. Applied to datasets such as UTKFace, ontrams maintain competitive predictive performance while offering clear interpretability of predictor contributions—a critical requirement in applications demanding model transparency and clinical accountability.
Despite these advances, most existing models assume fixed ordinal distances between classes or rely on proxy decompositions that may not accurately reflect inter-class variability. Moreover, few approaches explicitly model the degree of ordinal discrepancy between samples in the feature space, which is particularly important in facial age estimation where perceptual differences are often subtle and non-uniform. These limitations motivate further research into learning paradigms that incorporate differential ordinal information in a data-driven and end-to-end manner.
2.2. Ordinal Embedding
Metric learning is instrumental in generating representations that enhance downstream tasks like ordinal regression. However, existing methods often neglect to capture the inherent order in ordinal labels. Ref. [16] addressed this with the Consistent Ordinal Representations (CORE) framework, which constructs an ordinal manifold to align features and labels while optimizing feature representations via convex programming. Despite its strengths, CORE’s computational intensity and sensitivity to initialization limit scalability and robustness, especially on large datasets.
Embedding-based methods, alongside optimization techniques, effectively capture ordinal structures and enhance model discriminative capacity by aligning the feature space with ordinal information. Ref. [17] introduced an ordinal-preserving latent graph hashing method for image similarity, while [18] utilized relative similarity comparisons to generate ordinal embedding. Ref. [19] proposed an angular triangle distance metric combined with a triplet network for robust ordinal data embedding. This approach ensures that the embedding effectively preserves ordinal relationships within a low-dimensional space. Nevertheless, these methods often lack alignment with regression-specific ordinal constraints. Our work bridges this gap by incorporating ordinal embedding techniques within an ordinal regression framework, enhancing performance and robustness through closer alignment of feature spaces with target data structures.
In addition to embedding-based techniques, several studies have focused on modeling ordinal relationships directly within the decision space. For example, ref. [20] proposed an ordinal ranking-based framework that addresses class imbalance using pairwise comparisons, and [21] extended this approach to deep learning by incorporating ordinal constraints into forensic evaluation tasks. Ref. [22] further formulated ordinal regression as a constrained optimization problem with a pairwise regularization term to enforce ordinal structure, especially under limited data conditions. These decision-space methods effectively encode ordinal relations during classification but lack mechanisms to guide feature representations toward ordinal consistency. Our method addresses this by integrating ordinal embedding into the regression framework, aligning both feature and decision spaces with the underlying ordinal hierarchy. This joint modeling improves discriminative performance and robustness, particularly in fine-grained scenarios.
2.3. Ordinal Regression in Healthcare
A notable study applied ordinal logistic regression for early sepsis prediction by integrating domain knowledge from clinical scoring systems [23]. This approach combined a machine learning model with traditional medical scoring systems, including the National Early Warning Score (NEWS), Systemic Inflammatory Response Syndrome (SIRS), and Quick Sequential Organ Failure Assessment (QSOFA). By applying knowledge transfer and score transformation, the proposed method addresses the challenges of class imbalance and limited sample size in electronic health records (EHRs), achieving better performance in terms of the Volume Under the ROC Surface (VUS).
Ordinal regression has also been applied to medical imaging tasks, such as prostate cancer grading. One study used a convolutional neural network (CNN) based on VGG-16 in conjunction with an ordinal class classifier to categorize prostate cancer from multiparametric magnetic resonance imaging (mpMRI) into five grade groups [24]. The method improved over baseline classifiers, demonstrating the benefits of modeling the ordinal nature of cancer grades.
In another domain, cervical cell classification was enhanced by integrating simultaneous image super-resolution and ordinal regression [25]. A generative adversarial network (GAN) was used to improve image resolution during training, while smooth L1 loss was applied to enforce ordinal consistency. This technique yielded higher classification accuracy and reduced mean absolute error, particularly under low-resolution input conditions.
To better model uncertainty and label order, deep probabilistic models have also been proposed. A recent method introduced a quantum-inspired deep ordinal regression approach for the diagnosis of diabetic retinopathy and prostate cancer [26]. By considering the progression of disease stages and leveraging probabilistic representations, this model improved both accuracy and interpretability compared to conventional classifiers.
Despite these advances, few methods have explicitly modeled the degree of difference between ordinal classes. To address this limitation, our work introduces a differential ordinal learning framework that quantifies inter-class differences by comparing features of sample pairs. We propose a vision transformer-based architecture that simultaneously performs categorical and ordinal prediction, supported by a tailored loss function. Evaluated on three cancer grading datasets, the proposed method demonstrates improved performance and reliability compared to prior categorical and ordinal models [27].
3. Methodology
This section introduces a novel hybrid model to address classifier inconsistency in ordinal CNNs, a common challenge in ordinal regression frameworks that rely on multiple binary classifiers for ranking [3,7].
3.1. Preliminary
In this paper, we address the problem of ordinal regression, which involves predicting ordinal labels for given data instances while preserving the inherent order among the classes. We let represent the dataset, where each is a d-dimensional feature vector, and is the corresponding label for the ith instance. Here, represents the ordered set of C categories or classes, such that there exists a natural ordering among them. This ordering reflects the ordinal nature of the problem, where each label is not merely categorical but possesses a relative rank or degree, indicating a higher or lower intensity, level, or severity relative to other classes.
The goal of ordinal regression is to learn a function that not only classifies each input to a corresponding ordinal category but also respects the ordinal relationships among the categories. This ordinal structure imposes a constraint on the predicted categories, wherein the model should penalize misclassifications based on their ordinal distance.
In line with prior works [3,7], each rank in the training dataset is transformed into binary labels, , where each represents whether exceeds a specific threshold rank . More formally, , where the indicator function yields 1 if the condition is met and 0 otherwise. For instance, when , each is encoded as a binary vector , where each indicates whether surpasses threshold . This results in ordinal representations like as , as , and as , effectively capturing the rank structure.
During training, these binary labels are used within a single CNN, where the output layer comprises binary classifiers, each dedicated to learning the probability for each threshold . Here, each classifier’s output represents the probability that the original rank exceeds the corresponding threshold , thereby providing a probabilistic interpretation of the ordinal relationship. By optimizing the CNN to accurately predict these probabilities across thresholds, the model is able to learn and generalize the ordinal relationships within the dataset.
In contrast to previous methods, the proposed hybrid ordinal CNN model leverages global ordinal features to effectively capture ordinal relationships across sample categories. Furthermore, it introduces a neighbor penalty mechanism designed to reduce inconsistency errors in the misclassification of samples in adjacent categories, as illustrated in Figure 1. As shown in Figure 1, the model comprises two sub-networks: the main network, denoted as f, and the embedding network, denoted as . The two sub-networks share the same architecture and parameters. However, during training, remains frozen, as it is pre-trained to map global ordinal features via metric learning.
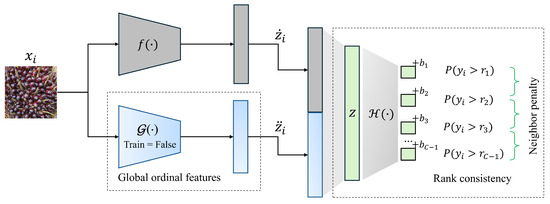
Figure 1.
Proposed hybrid ordinal regression model leveraging global ordinal features and a neighbor penalty to enhance ordinal consistency.
Given an input , we obtain its low-dimensional latent representations from mappings f and , denoted by and , respectively. These representations are concatenated to form a unified feature vector, which is then compressed into a single latent representation, . This combined representation, , is subsequently passed through the penultimate layer , as expressed in Equation (1).
The model is parameterized by W, representing the weight matrix, and , the bias of category c. These parameters are iteratively refined during training through backpropagation, with optimization carried out using standard stochastic gradient descent (SGD). The sigmoid activation function is applied to the raw outputs of each binary classifier, transforming them into probability scores. These scores represent the likelihood that a given sample belongs to a specific ordinal category. By leveraging this probabilistic representation, the model provides a robust and interpretable framework for making predictions, ensuring consistency with the ordinal nature of the data while preserving accuracy across the classification boundaries.
The following subsections provide a detailed account of our approach, with particular emphasis on the use of global ordinal features and the neighbor penalty to improve ordinal classification consistency.
3.2. Global-Ordinal Features
To capture global ordinal features, we employ a deep metric learning approach specifically designed for ordinal data, as introduced in [19]. This approach produces an embedding model, , that maps high-dimensional inputs to low-dimensional latent representations while preserving ordinal relationships through angular distance. Using triplet inputs , , and , the model learns to compare angular distances and , as illustrated in Figure 2 and formalized in Equation (2). This setup enables the model to maintain relative ranking information effectively within the embedded space.
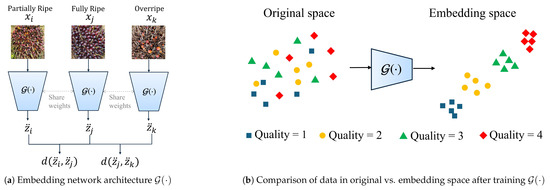
Figure 2.
An illustration of embedding network for learning global ordinal features using triplet inputs.
To define the ground truth angular distance , we take an example from manufacturing quality assessment, where products are assigned to five distinct quality levels on an ordinal scale, from the lowest to the highest quality. Each category is represented by an angle in the embedding space, with angular distances between categories corresponding to their ordinal differences. Given five quality levels, the angular space is divided into four intervals of each, computed as , where C is the total number of categories. The angular distance label thus represents the normalized angular distance between quality levels i and j, capturing their relative ordinal relationships. For instance, between the lowest and highest quality levels is 1 (indicating a full span of ), while between adjacent levels is or . This ordinal relationship, defined by , serves as a target in training to guide the embedding network in preserving ordinal distances.
Algorithm 1 outlines a learning mechanism for obtaining ordinal embeddings through an ordinal triplet network. This process begins with a dataset comprising triplets of data points, each assigned ordinal labels indicating the relationships within each triplet. The objective is to train an embedding network, , to map high-dimensional inputs to a lower-dimensional space while preserving ordinal relationships.
| Algorithm 1: Training embedding network for obtaining ordinal embedding. |
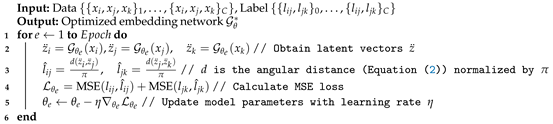 |
For each training epoch, the algorithm first passes the input triplets through the current model to produce latent vectors , , and . These latent representations capture essential characteristics of the input data in the embedding space. The angular distance function , defined by Equation (2), is then applied to compute the predicted distances and between the embeddings. Here, (approximately 3.14159 radians or 180 degrees) is used as a normalization factor to scale the angular distance, which stabilizes the network’s training process by ensuring that the distances remain within a manageable range.
These normalized distances are compared with the ground truth ordinal labels using a mean squared error (MSE) loss function, which quantifies the discrepancy between the predicted and actual distances for each pair in the triplet. Finally, the model parameters are updated through gradient descent, minimizing the loss with a learning rate , thus enhancing the embedding network’s capacity to represent ordinal relationships across epochs. This iterative training process ultimately produces an optimized embedding network, , that effectively captures the ordinal structure of the data globally.
3.3. Neighbor Order Consistency
One significant drawback of the rank consistency loss is its susceptibility to misclassification errors among adjacent or neighboring categories. As illustrated in Figure 3, the probability values for immediate neighbors tend to exhibit relatively small discrepancies. Consequently, misclassification errors frequently occur between these adjacent classes; for instance, when the true label is Class 1, it is often predicted as Class 2, and similarly, when is Class 2, it may be misclassified as Class 3. In contrast, the classification errors between more distantly situated categories are typically less frequent, as the probability gaps are more pronounced according to the ordinal structure of the ranks, resulting in a lower vulnerability to misclassification. To address this issue, we propose the introduction of a neighbor misclassification penalty in addition to the original rank consistency loss. This enhancement aims to mitigate the misclassification risks associated with neighboring classes, thereby improving the overall robustness of the model.
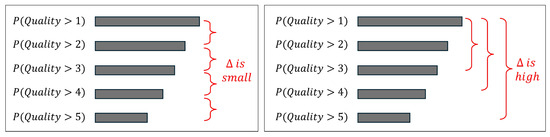
Figure 3.
An illustration of ordinal consistency in labeling shows that low probability discrepancies between adjacent categories increase susceptibility to misclassification (left). This phenomenon occurs because enforcing rank consistency results in greater probability discrepancies between more distant categories (right).
The loss function consists of two main components: a base ordinal loss and an additional penalty term to handle neighbor misclassifications. We let y denote the true label in ordinal vector form and denote the predicted label (also in ordinal vector form) based on the neural network’s output. We let z represent the latent representation from the nonlinear combination features of f and . To obtain probabilities for each class level, we apply the sigmoid activation function, yielding .
The first component, the base ordinal loss [7], is inspired by a cross-entropy term that respects the ordinal structure of the labels. This is computed as follows:
where represents the true label for the ith class level, is the predicted probability for that class level, and is an importance weight used to account for class imbalance.
The second component, neighbor misclassification penalty , is added to address situations where predictions are close to the true class but are slightly misclassified (e.g., predicting Class 1 for a true Class 0). This term is designed to apply a higher penalty to neighboring classes than to those that are further from the true class. It is computed as
The neighbor penalty loss, denoted as , is designed to address misclassifications specifically between adjacent categories in ordinal regression tasks. It sums the instances where the predicted label deviates from the true label by exactly one category, as expressed by , where the indicator function outputs 1 if and 0 otherwise. By penalizing these neighboring misclassifications, encourages the model to more accurately distinguish between closely ranked categories, thereby improving its robustness in ordinal classification scenarios.
Compared to the quasi-unimodal loss (QUL) introduced in [28], our approach differs in two key aspects. First, explicitly penalizes misclassifications involving exactly one rank, thereby emphasizing consistency between adjacent categories. In contrast, QUL imposes a broader unimodality constraint, shaping the overall probability distribution among the top-ranked predictions. Second, our method enforces local ordering directly, whereas QUL permits greater flexibility by tolerating deviations beyond adjacent ranks. This distinction renders particularly effective in applications where even small ranking errors can substantially affect model performance.
The total loss function, , combines the base ordinal loss and the neighbor misclassification penalty:
By optimizing the total loss, , the model learns not only to predict the correct ordinal class but also to minimize misclassification errors between adjacent categories. This dual objective enhances overall performance in ordinal regression tasks, particularly where small ranking errors can lead to significant performance degradation.
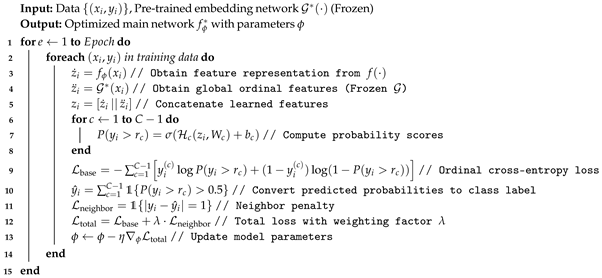
To achieve this, Algorithm 2 trains the main network while utilizing the frozen embedding network , which was previously trained using Algorithm 1. In each training iteration, extracts a local feature representation , while provides a global ordinal feature . These features are concatenated to form the final representation , which is then passed through the classification head to estimate the probability scores for each ordinal threshold. The training process optimizes the ordinal cross-entropy loss to preserve ranking consistency, while the neighbor penalty loss enforces monotonicity between adjacent ordinal probabilities. The total loss is minimized using SGD, refining while ensuring an ordinally structured decision boundary.
| Algorithm 2: Training the main network given ordinal embedding for ordinal regression. |
 |
4. Experimentation
This section evaluates our method through experiments comparing it to existing models, analyzing the neighbor penalty’s impact on misclassification, and assessing the embedding network’s effect on performance.
4.1. Data and Setting
We evaluated our model using several publicly available datasets commonly used in ordinal regression research, including the Breast Ultrasound Images (BUSI) dataset [29], Oil Palm Fruit Quality (OPALM) dataset [30], Morphological Face Database II (MORPH-2) [31], Asian Face Database (AFAD) [3], and Cross-Age Celebrity Dataset (CACD) [32]. The BUSI dataset (780 images) captures three stages of breast health, useful for evaluating medical imaging tasks. OPALM (4,728 images) categorizes oil palm fruits into five ripeness levels, introducing real-world variability such as lighting conditions. For facial analysis, MORPH-2, AFAD, and CACD provide large-scale datasets with comprehensive age annotations, serving as benchmarks for fine-grained ordinal distinctions.
To ensure consistency, all images were resized to pixels. During training, data augmentation included random cropping to and horizontal flipping; evaluation used center cropping. These preprocessing steps enhanced generalization across datasets. All models used ResNet-34 as the backbone to ensure a fair comparison, as detailed in Table 1. Our method, GNOOR (Global and Neighborhood Order—Ordinal Regression), was built upon this architecture. CE-CNN applied standard cross-entropy loss, OR-CNN followed the ordinal classification scheme from [3], and CORAL-CNN adopted a rank-consistent output layer from [7]. GNOOR extended CORAL-CNN by incorporating a neighbor penalty term and a pretrained embedding network to improve global ordinal representation.

Table 1.
Modified ResNet-34 backbone architecture with 512-dimensional embedding output.
We selected three baseline models to represent key directions in ordinal regression research: (1) CE-CNN, which applies standard cross-entropy loss and serves as a baseline classifier that ignores ordinal constraints; (2) OR-CNN, which implements ordinal classification using a series of binary comparisons, following the formulation in [3]; and (3) CORAL-CNN, which applies rank-consistent ordinal regression with a theoretically grounded output layer [7]. These models were chosen to reflect the progression from naive classification to structured ordinal regression, offering a robust framework for comparative analysis. Our proposed model, GNOOR (Global and Neighborhood Order – Ordinal Regression), extends CORAL-CNN by incorporating a neighbor-aware penalty term and a pretrained embedding network to improve both global and local ordinal consistency.
The embedding network used a ResNet-34 architecture and was trained independently to learn a 512-dimensional feature representation . Once trained, was frozen and served as a fixed feature extractor. The training process ran for 100 epochs using the Adam optimizer (, ) with a learning rate of and a weight decay of . To ensure stable optimization, a batch size of 256 was used for facial datasets, while the smaller BUSI and OPALM datasets employed batch sizes of 16 and 32, respectively.
The main network , which also followed the ResNet-34 architecture, was designed for ordinal regression and produced a separate 256-dimensional feature vector . The final representation was formed by concatenating and , yielding a 512-dimensional embedding . This was passed through a fully connected layer to generate scalar logits. A trainable bias term was added before applying the sigmoid activation function to estimate ordinal probabilities. The network was trained for 200 epochs using SGD with Adam optimization (, ) at a learning rate of , with batch size settings consistent with to maintain uniform training dynamics. Model performance was evaluated using Mean Absolute Error (MAE) and Root Mean Squared Error (RMSE) on independent test sets, with results reported as the best across three random seed initializations. All experiments were conducted on a Windows 11 Pro system with an Intel Core i7-12700 CPU, 96 GB RAM, NVIDIA RTX 4090 GPU, Python 3.9.19, CUDA 12.1, and PyTorch 2.4.0.
4.2. Results and Discussion
Ordinal regression bridges classification and regression, enabling evaluation with both classification and regression metrics. Classification metrics like accuracy, precision, recall, and F1-score assess the model’s ability to capture ordinal relationships and minimize misclassification. High precision indicates alignment with true ordinal labels, while high recall reflects effective identification within the ordered framework. F1-score balances these aspects, measuring overall effectiveness. Regression metrics, such as MAE and RMSE, quantify prediction errors, with smaller values indicating closer alignment to true labels, where errors between neighboring classes are less severe.
As shown in Table 2, our method (GNOOR) outperformed existing models (CE-CNN, OR-CNN, and CORAL-CNN) on the BUSI dataset across both classification and regression metrics. This highlights its strength in leveraging ordinal structure for medical imaging, where errors such as misclassifying malignant tumors can have critical consequences. On the OPALM dataset, CE-CNN slightly outperformed our method, likely due to its circular labeling pattern. While fruit maturity increases from Level 0 to 2 and declines by Level 4, this circularity challenges models that assume linear order. Nonetheless, our method preserved the ordinal structure more effectively, as shown in the confusion matrices (Figure 4 and Figure 5), where errors clustered around neighboring classes, indicating better ordinal consistency.
Table 2.
Comparison of ordinal regression model performance in classification (accuracy, precision, recall, and F1-score) and regression (MAE and RMSE).
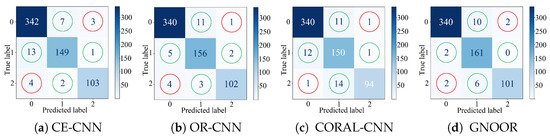
Figure 4.
Confusion matrix visualization for the BUSI dataset. The green circles indicate misclassification errors with the first (closest) immediate neighbor, while the red circles highlight misclassification errors with the second (farthest) immediate neighbor.
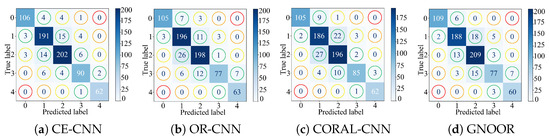
Figure 5.
Confusion matrix representation for the OPALM dataset. Green circles denote misclassification with the first neighbor, yellow with the second, orange with the third, and red with the fourth.
Preserving adjacent ordinal relationships is critical in real-world applications where small-scale misclassifications can lead to significant consequences. In medical imaging, for example, misclassifying a tumor’s malignancy level as Grade 2 instead of Grade 0 is a severe mistake, but frequent misclassifications between adjacent Grades (e.g., 1 vs. 2, 2 vs. 3) can still disrupt clinical decision-making, making diagnoses inconsistent and unreliable. Similarly, in agriculture, repeatedly predicting slightly unripe fruit as ripe can lead to systematic harvesting errors, reducing product quality and market value. While many existing ordinal loss functions emphasize penalizing distant errors, our approach complements them by enforcing local ranking consistency, ensuring that predictions do not fluctuate unpredictably between adjacent ranks. By explicitly incorporating neighbor-aware penalties, our method stabilizes ordinal decision boundaries, reducing the risk of adjacent inconsistencies while preserving global order.
Figure 4 and Figure 5 show confusion matrices for the BUSI and OPALM datasets, illustrating misclassification distributions across ordinal categories. These visualizations highlight the effectiveness of our method, which integrates a neighbor penalty term into the loss function to address challenges in ordinal regression. In Figure 4 (BUSI dataset), two error types are emphasized: misclassifications involving the first (nearest) neighbor, marked in green, and those involving the second (distant) neighbor, in red. For example, predicting a label of 2 instead of 0 is more severe (red) than predicting it as 1 (green). Traditional models like CE-CNN ignore ordinal structure, penalizing all errors equally, regardless of severity. OR-CNN improves this using multiple binary classifiers but lacks consistency enforcement. CORAL-CNN adds consistency loss to reduce distant errors but often overlooks neighboring misclassifications. Our method explicitly penalizes neighboring errors, significantly reducing them while maintaining low distant error rates. This balance is especially critical in medical contexts like BUSI, where errors such as misclassifying a malignant tumor as normal can have serious consequences.
Figure 5 (OPALM dataset) offers a finer view of errors, distinguishing first (green), second (yellow), third (orange), and fourth (red) neighboring categories. The dataset’s circular ordinal structure—from immature to ripe to decayed—poses unique challenges, increasing the chance of neighboring errors. Traditional models prioritize reducing distant errors but often struggle with adjacent ones. By incorporating a neighbor penalty, our method effectively reduces errors across both near and distant categories. Our approach aligns predictions with the data’s ordinal nature, producing more reliable outcomes even in non-linear structures. This robustness illustrates the method’s broader applicability to complex ordinal regression tasks. It is important to note that reducing misclassification errors for both adjacent and distant labels simultaneously is a challenging task.
Table 3 compares age prediction errors, measured by mean absolute error (MAE) and root mean squared error (RMSE), across our proposed method and three widely used ordinal regression models adapted from [7]. To ensure a fair and controlled comparison, all models were trained using the same backbone architecture (ResNet-34), identical training hyperparameters (e.g., learning rate, optimizer, batch size, number of epochs), and consistent data preprocessing procedures. We also initialized all models with the same random seeds (0, 1, and 2) across three runs. This design choice eliminates confounding factors, allowing us to isolate the impact of the ordinal modeling strategy and loss function used in each method.
Table 3.
Comparison of age prediction errors between our method and existing ordinal regression models.
Our method consistently achieved lower MAE and RMSE values compared to CE-CNN, OR-CNN, and CORAL-CNN, demonstrating its superior performance. CE-CNN, which treats ordinal regression as a standard classification task, disregards the ordinal structure of labels, leading to less accurate, rank-inconsistent predictions. OR-CNN incorporates ordinal information through binary decomposition but lacks explicit mechanisms to enforce rank consistency, often resulting in violations of ordinal order. CORAL-CNN uses a cumulative link formulation to enforce global consistency but may overemphasize this constraint, thereby increasing errors among adjacent categories. In contrast, our proposed model integrates both global ordinal structure and local neighborhood consistency, yielding more reliable and semantically coherent predictions.
In contrast, our method addresses these limitations by integrating a neighbor penalty term and metric learning. The neighbor penalty explicitly reduces adjacent category errors, preserving ordinal relationships and ensuring rank consistency. Metric learning enhances the embedding network, aligning samples in a latent space that reflects their ordinal relationships, minimizing confusion with distant categories while emphasizing local similarity. This synergy between local feature refinement and global consistency enables our model to capture nuanced patterns in the data while maintaining robust generalization. Consequently, our approach outperformed baseline models, achieving superior accuracy and error reduction, underscoring its effectiveness for ordinal regression tasks.
To further validate the superiority of our method, we conducted paired Student’s t-tests comparing the MAE performance of GNOOR against CE-CNN, OR-CNN, and CORAL-CNN across three widely used benchmark datasets: MORPH-2, AFAD, and CACD. The detailed results are presented in Table 4. For both CE-CNN and OR-CNN, the differences were highly significant across all datasets, with p-values well below the 0.05 threshold (e.g., ), confirming that GNOOR consistently outperforms these baselines. When compared to CORAL-CNN, GNOOR achieved statistically significant improvements on MORPH-2 (t = 2.77, p = 0.0121) and AFAD (t = 2.62, p = 0.0170). On the CACD dataset, although the improvement was not statistically significant (t = 1.40, p = 0.1775), GNOOR still demonstrated a lower average MAE. These statistical findings provide strong evidence of the robustness and effectiveness of GNOOR in improving ordinal regression performance across diverse datasets.
Table 4.
Paired Student’s t-test results comparing GNOOR to baseline models on MAE across 20 runs. Bold p-values indicate statistical significance at .
To evaluate the contributions of each component in our hybrid model, we conducted an ablation study by sequentially removing the neighbor penalty loss (GNOOR-) and the embedding network (GNOOR-). As shown in Figure 6, omitting the neighbor penalty loss resulted in a more significant performance decline, with higher MAE and RMSE values. This emphasizes the importance of the neighbor penalty in reducing adjacent category misclassification errors and preserving ordinal consistency. The embedding network (), which captures global ordinal relationships by embedding samples into a structured latent space, complements local feature refinements. While it enhances performance, it may risk overfitting, especially in datasets with limited samples. Our method improves the CORAL approach by addressing neighbor misclassification errors through the penalty loss, while the embedding network ensures robust learning of global ordinal features. This synergy enables our model to achieve superior ordinal regression performance.
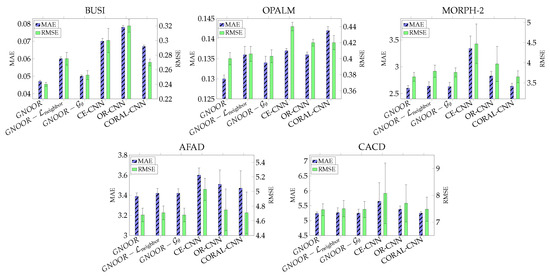
Figure 6.
Impact of prediction error performance (MAE and RMSE) by omitting neighbor penalty loss and embedding model in our hybrid models .
The computational efficiency and parameter complexity of the models are summarized in Table 5. As expected, GNOOR exhibits the highest average training time per epoch, primarily due to its more complex architecture and the inclusion of additional ordinal-embedding components. In comparison, CE-CNN, which employs a conventional CNN with a single classifier trained using categorical cross-entropy loss, achieves the shortest training time. This is attributed to its architectural simplicity and the absence of mechanisms that explicitly preserve ordinal relationships. OR-CNN increases computational cost by introducing multiple binary classifiers to model ordinal information, while CORAL-CNN further adds consistency-enforcing constraints to the loss function, resulting in a slightly higher computational burden than OR-CNN. All four baseline models have comparable parameter counts, ranging between 21.4 million and 21.6 million, indicating similar model complexities despite minor architectural variations.
Table 5.
Average training time per epoch (in seconds) for all evaluated models.
Although GNOOR is more computationally demanding, its total parameter count remains within a comparable range at approximately 22.1 million. This suggests that the longer training time arises more from the structure of its computation graph, particularly the use of the embedding network, rather than from the number of trainable parameters. During the main training phase, the embedding network () is frozen and thus does not contribute to gradient computations, making GNOOR’s training time competitive when the embedding phase is excluded. However, the embedding network requires separate pretraining, as indicated in the final column of Table 5. This phase incurs a substantial training cost due to the use of triplet loss and repeated triplet network evaluations. Despite the additional effort, the embedding module consists of 21.5 million parameters that are reusable and do not require retraining for downstream tasks. This design introduces a beneficial trade-off between training efficiency and ordinal modeling performance, offering advantages in scenarios where classification accuracy and ordinal consistency are more critical than training speed.
5. Limitations and Future Work
While the proposed method demonstrates improved performance in enforcing both global and local ordinal consistency, several limitations remain.
First, our approach relies on a two-stage training pipeline in which the embedding network is trained separately from the ordinal classification head. Although this separation simplifies the training of each module, it may lead to suboptimal feature alignment and increased overall training time. Future work could explore end-to-end joint optimization strategies to enable more efficient training and better feature integration.
Second, as clarified in the introduction, this study focuses specifically on image-based ordinal regression tasks. The backbone architecture, data augmentation strategies, and evaluation metrics are tailored to visual inputs. Consequently, the generalizability of the method to other data modalities, such as text or tabular data, has not been explored. Extending the framework by adapting the architecture to modality-appropriate encoders, such as transformers for text or multilayer perceptrons for tabular data, is a promising direction for future investigation.
Third, the neighbor-aware penalty used in the loss function assumes a uniform cost between neighboring ranks. In real-world applications, misclassification costs can vary depending on the severity or importance of ordinal differences. Future work may incorporate adaptive cost modeling that reflects task-specific priorities, thereby improving both robustness and practical relevance.
Finally, interpretability remains an important concern for deploying deep learning models in critical domains. Although our method emphasizes accuracy and ordinal structure, it does not provide interpretability tools. Future research could integrate explainable AI techniques to enhance transparency and support responsible use in areas such as healthcare, finance, and decision support systems.
6. Conclusions
Ordinal data are prevalent across fields, underpinning applications like ranking customer satisfaction, assessing product quality, diagnosing medical conditions, estimating facial age, and determining credit scores. As a problem bridging classification and regression, ordinal regression must balance accurate classification with maintaining category order. While existing methods often enforce global ordinal consistency, they tend to overlook adjacent-category misclassification errors. This study proposes a hybrid model combining ordinal metric learning to capture global relationships with a neighbor penalty in the loss function to reduce adjacent-category errors. The approach ensures robust ordinal consistency without compromising overall classification accuracy. Experiments on benchmark datasets showed that the proposed method outperformed CE-CNN, OR-CNN, and CORAL-CNN, effectively reducing both neighboring misclassification errors and global order inconsistencies. Despite these promising results, the current framework has several limitations. First, the embedding network is trained independently from the classifier, leading to increased training complexity and longer optimization cycles. Second, the current evaluation is limited to image-based datasets, and the generalizability of the method to other data modalities, such as tabular and textual ordinal data, remains unexplored. Third, the neighbor penalty requires careful tuning to avoid over-smoothing or under-penalizing misclassifications, which might limit its adaptability across varying datasets. In future work, we plan to explore joint training schemes that unify embedding learning and ordinal classification into a single end-to-end pipeline, reducing overhead and improving feature-label alignment. We also aim to extend the framework to non-visual domains, such as tabular and textual data, where ordinal relationships are equally critical but structurally different. Additionally, we will investigate adaptive penalty mechanisms that dynamically adjust local constraints based on data characteristics. Finally, incorporating interpretability modules would further enhance trust and usability in sensitive applications like healthcare and risk assessment.
Author Contributions
Conceptualization, I.M.K.; methodology, I.M.K.; validation, S.M. and L.N.; formal analysis, I.M.K. and S.M.; investigation, S.M. and L.N.; resources, S.M.; data curation, S.M.; writing—original draft preparation, I.M.K.; writing—review and editing, I.M.K. and S.M.; visualization, I.M.K.; project administration, S.M., A.N. and M.K.; funding acquisition, S.M. All authors have read and agreed to the published version of the manuscript.
Funding
This research was funded by Bumitama Innovation Center, PT. Bumitama Gunajaya Agro (BGAGroup) grant number 13/NDA/BGA/CD/6/2024.
Data Availability Statement
We use publicly available datasets in our experiments. The BUSI dataset can be downloaded at https://scholar.cu.edu.eg/?q=afahmy/pages/dataset (accessed on 22 May 2025), the OPALM dataset is available at https://data.mendeley.com/datasets/424y96m6sw/1 (accessed on 22 May 2025), the MORPH-2 dataset can be downloaded at https://www.kaggle.com/datasets/chiragsaipanuganti/morph/data (accessed on 22 May 2025), the AFAD dataset can be accessed at https://github.com/John-niu-07/tarball (accessed on 22 May 2025), and the CACD dataset can be obtained at https://bcsiriuschen.github.io/CARC/ (accessed on 22 May 2025). The implementation of the proposed model is publicly available at https://github.com/bscpnu/OrdinalRegression-GNOOR (accessed on 22 May2025).
Conflicts of Interest
The authors declare no conflicts of interest.
References
- Barbero-Gómez, J.; Cruz, R.; Cardoso, J.; Gutiérrez, P.; Hervás-Martínez, C. CNN explanation methods for ordinal regression tasks. Neurocomputing 2025, 615, 128878. [Google Scholar] [CrossRef]
- Zhu, X.; Chen, R.; Shao, Z.; Zhang, M.; Dai, Y.; Zhang, W.; Lang, C. MGScoliosis: Multi-grained scoliosis detection with joint ordinal regression from natural image. Alex. Eng. J. 2025, 111, 329–340. [Google Scholar] [CrossRef]
- Niu, Z.; Zhou, M.; Wang, L.; Gao, X.; Hua, G. Ordinal Regression with Multiple Output CNN for Age Estimation. In Proceedings of the 2016 IEEE Conference on Computer Vision and Pattern Recognition (CVPR), Las Vegas, NV, USA, 27–30 June 2016; pp. 4920–4928. [Google Scholar] [CrossRef]
- Zhu, H.; Shan, H.; Zhang, Y.; Che, L.; Xu, X.; Zhang, J.; Shi, J.; Wang, F.Y. Convolutional Ordinal Regression Forest for Image Ordinal Estimation. IEEE Trans. Neural Netw. Learn. Syst. 2022, 33, 4084–4095. [Google Scholar] [CrossRef] [PubMed]
- Chen, S.; Zhang, C.; Dong, M.; Le, J.; Rao, M. Using Ranking-CNN for Age Estimation. In Proceedings of the 2017 IEEE Conference on Computer Vision and Pattern Recognition (CVPR), Honolulu, HI, USA, 21–26 July 2017; pp. 742–751. [Google Scholar] [CrossRef]
- Polania, L.F.; Fung, G.M.; Wang, D. Ordinal Regression Using Noisy Pairwise Comparisons for Body Mass Index Range Estimation. In Proceedings of the 2019 IEEE Winter Conference on Applications of Computer Vision (WACV), Waikoloa Village, HI, USA, 7–11 January 2019; pp. 782–790. [Google Scholar] [CrossRef]
- Cao, W.; Mirjalili, V.; Raschka, S. Rank consistent ordinal regression for neural networks with application to age estimation. Pattern Recognit. Lett. 2020, 140, 325–331. [Google Scholar] [CrossRef]
- Lei, Y.; Zhu, H.; Zhang, J.; Shan, H. Meta Ordinal Regression Forest for Medical Image Classification With Ordinal Labels. IEEE/CAA J. Autom. Sin. 2022, 9, 1233–1247. [Google Scholar] [CrossRef]
- Gutiérrez, P.A.; Pérez-Ortiz, M.; Sánchez-Monedero, J.; Fernández-Navarro, F.; Hervás-Martínez, C. Ordinal Regression Methods: Survey and Experimental Study. IEEE Trans. Knowl. Data Eng. 2016, 28, 127–146. [Google Scholar] [CrossRef]
- Bellmann, P.; Schwenker, F. Ordinal Classification: Working Definition and Detection of Ordinal Structures. IEEE Access 2020, 8, 164380–164391. [Google Scholar] [CrossRef]
- Zhong, G.; Xiao, Y.; Liu, B.; Zhao, L.; Kong, X. Ordinal Regression With Pinball Loss. IEEE Trans. Neural Netw. Learn. Syst. 2024, 35, 11246–11260. [Google Scholar] [CrossRef] [PubMed]
- Liu, H.; Lu, J.; Feng, J.; Zhou, J. Ordinal Deep Learning for Facial Age Estimation. IEEE Trans. Circuits Syst. Video Technol. 2019, 29, 486–501. [Google Scholar] [CrossRef]
- Vargas, V.M.; Gutiérrez, P.A.; Hervás-Martínez, C. Unimodal regularisation based on beta distribution for deep ordinal regression. Pattern Recognit. 2022, 122, 108310. [Google Scholar] [CrossRef]
- Kong, C.; Wang, H.; Luo, Q.; Mao, R.; Chen, G. Deep Multi-Input Multi-Stream Ordinal Model for age estimation: Based on spatial attention learning. Future Gener. Comput. Syst. 2023, 140, 173–184. [Google Scholar] [CrossRef]
- Kook, L.; Herzog, L.; Hothorn, T.; Dürr, O.; Sick, B. Deep and interpretable regression models for ordinal outcomes. Pattern Recognit. 2022, 122, 108263. [Google Scholar] [CrossRef]
- Lei, Y.; Li, Z.; Li, Y.; Zhang, J.; Shan, H. CORE: Learning consistent ordinal representations with convex optimization for image ordinal estimation. Pattern Recognit. 2024, 156, 110748. [Google Scholar] [CrossRef]
- Zhang, Z.; Pun, C.M. Learning ordinal constraint binary codes for fast similarity search. Inf. Process. Manag. 2022, 59, 102919. [Google Scholar] [CrossRef]
- Ma, K.; Zeng, J.; Xiong, J.; Xu, Q.; Cao, X.; Liu, W.; Yao, Y. Fast Stochastic Ordinal Embedding With Variance Reduction and Adaptive Step Size. IEEE Trans. Knowl. Data Eng. 2021, 33, 2467–2478. [Google Scholar] [CrossRef]
- Kamal, I.M.; Bae, H. Angular Triangle Distance for Ordinal Metric Learning. arXiv 2022, arXiv:2211.15200. [Google Scholar] [CrossRef]
- Cruz, R.; Fernandes, K.; Pinto Costa, J.F.; Ortiz, M.P.; Cardoso, J.S. Ordinal Class Imbalance with Ranking. In Pattern Recognition and Image Analysis, Proceedings of the 8th Iberian Conference, IbPRIA 2017, Faro, Portugal, 20–23 June 2017; Alexandre, L.A., Salvador Sánchez, J., Rodrigues, J.M.F., Eds.; Springer: Cham, Switzerland, 2017; pp. 3–12. [Google Scholar]
- Fernandes, K.; Cardoso, J.S.; Astrup, B.S. A deep learning approach for the forensic evaluation of sexual assault. Pattern Anal. Appl. 2018, 21, 629–640. [Google Scholar] [CrossRef]
- Goh, C.K.; Liu, Y.; Kong, A.W.K. A Constrained Deep Neural Network for Ordinal Regression. In Proceedings of the 2018 IEEE/CVF Conference on Computer Vision and Pattern Recognition, Salt Lake City, UT, USA, 18–23 June 2018; pp. 831–839. [Google Scholar] [CrossRef]
- Ji, Y.; Wang, K.; Yuan, Y.; Wang, Y.; Liu, Q.; Wang, Y.; Sun, J.; Wang, W.; Wang, H.; Zhou, S.; et al. A knowledge-transfer-based approach for combining ordinal regression and medical scoring system in the early prediction of sepsis with electronic health records. Comput. Biol. Chem. 2024, 113, 108203. [Google Scholar] [CrossRef] [PubMed]
- Abraham, B.; Nair, M.S. Automated grading of prostate cancer using convolutional neural network and ordinal class classifier. Inform. Med. Unlocked 2019, 17, 100256. [Google Scholar] [CrossRef]
- Lin, Z.; Gao, Z.; Ji, H.; Zhai, R.; Shen, X.; Mei, T. Classification of cervical cells leveraging simultaneous super-resolution and ordinal regression. Appl. Soft Comput. 2022, 115, 108208. [Google Scholar] [CrossRef]
- Toledo-Cortés, S.; Useche, D.H.; Müller, H.; González, F.A. Grading diabetic retinopathy and prostate cancer diagnostic images with deep quantum ordinal regression. Comput. Biol. Med. 2022, 145, 105472. [Google Scholar] [CrossRef] [PubMed]
- Lee, J.C.; Byeon, K.; Song, B.; Kim, K.; Kwak, J.T. DIOR-ViT: Differential ordinal learning Vision Transformer for cancer classification in pathology images. Med. Image Anal. 2025, 105, 103708. [Google Scholar] [CrossRef] [PubMed]
- Albuquerque, T.; Cruz, R.; Cardoso, J.S. Quasi-Unimodal Distributions for Ordinal Classification. Mathematics 2022, 10, 980. [Google Scholar] [CrossRef]
- Al-Dhabyani, W.; Gomaa, M.; Khaled, H.; Fahmy, A. Dataset of breast ultrasound images. Data Brief 2020, 28, 104863. [Google Scholar] [CrossRef] [PubMed]
- Kamal, I.; Mochammad, S.; Nurahmi, L.; Natawijaya, A.; Kalili, M. An Ordinal Dataset for Ripeness Level Classification in Oil Palm Fruit Quality Grading. Mendeley Data, V1. 2024. Available online: https://data.mendeley.com/datasets/424y96m6sw/1 (accessed on 22 May 2025).
- Ricanek, K.; Tesafaye, T. MORPH: A longitudinal image database of normal adult age-progression. In Proceedings of the 7th International Conference on Automatic Face and Gesture Recognition (FGR06), Southampton, UK, 10–12 April 2006; pp. 341–345. [Google Scholar]
- Chen, B.; Chen, C.; Hsu, W. Cross-Age Reference Coding for Age-Invariant Face Recognition and Retrieval. In Proceedings of the European Conference on Computer Vision (ECCV), Zurich, Switzerland, 6–12 September 2014. [Google Scholar]
Disclaimer/Publisher’s Note: The statements, opinions and data contained in all publications are solely those of the individual author(s) and contributor(s) and not of MDPI and/or the editor(s). MDPI and/or the editor(s) disclaim responsibility for any injury to people or property resulting from any ideas, methods, instructions or products referred to in the content. |
© 2025 by the authors. Licensee MDPI, Basel, Switzerland. This article is an open access article distributed under the terms and conditions of the Creative Commons Attribution (CC BY) license (https://creativecommons.org/licenses/by/4.0/).