
Sylph: An Unsupervised APT Detection System Based on the Provenance Graph


Abstract
1. Introduction
- (1)
- We propose Sylph, an unsupervised APT detection system based on provenance graphs, which does not require prior knowledge or labeled training data, thereby demonstrating strong detection capabilities for unknown APTs.
- (2)
- We employ fine-grained partitioning of provenance graphs, processing them from a temporal perspective by dividing the provenance graph into smaller and more detailed subgraphs. This approach allows for a deeper and more accurate understanding and analysis of system events, while also enhancing the detection efficiency of Sylph.
- (3)
- We propose a subgraph partitioning method based on time slices and an integrated time forgetting rate. Sylph segments the provenance graph into multiple subgraphs in chronological order, analyzing each subgraph while incorporating a forgetting rate. This approach amplifies anomalous behaviors within the subgraphs, thereby facilitating a more effective detection of APT attacks.
2. Related Work
2.1. APT Detection
2.2. Detection Method Based on Provenance Graph
- S represents the set of subjects (processes or threads)—attributes include information such as PID;
- O represents the set of objects (e.g., files)—attributes include the name and type;
- E represents the set of system call event types, such as read, etc.;
- T represents the timestamps, indicating the access times between subjects and objects.
2.3. Graph Embedding Algorithm
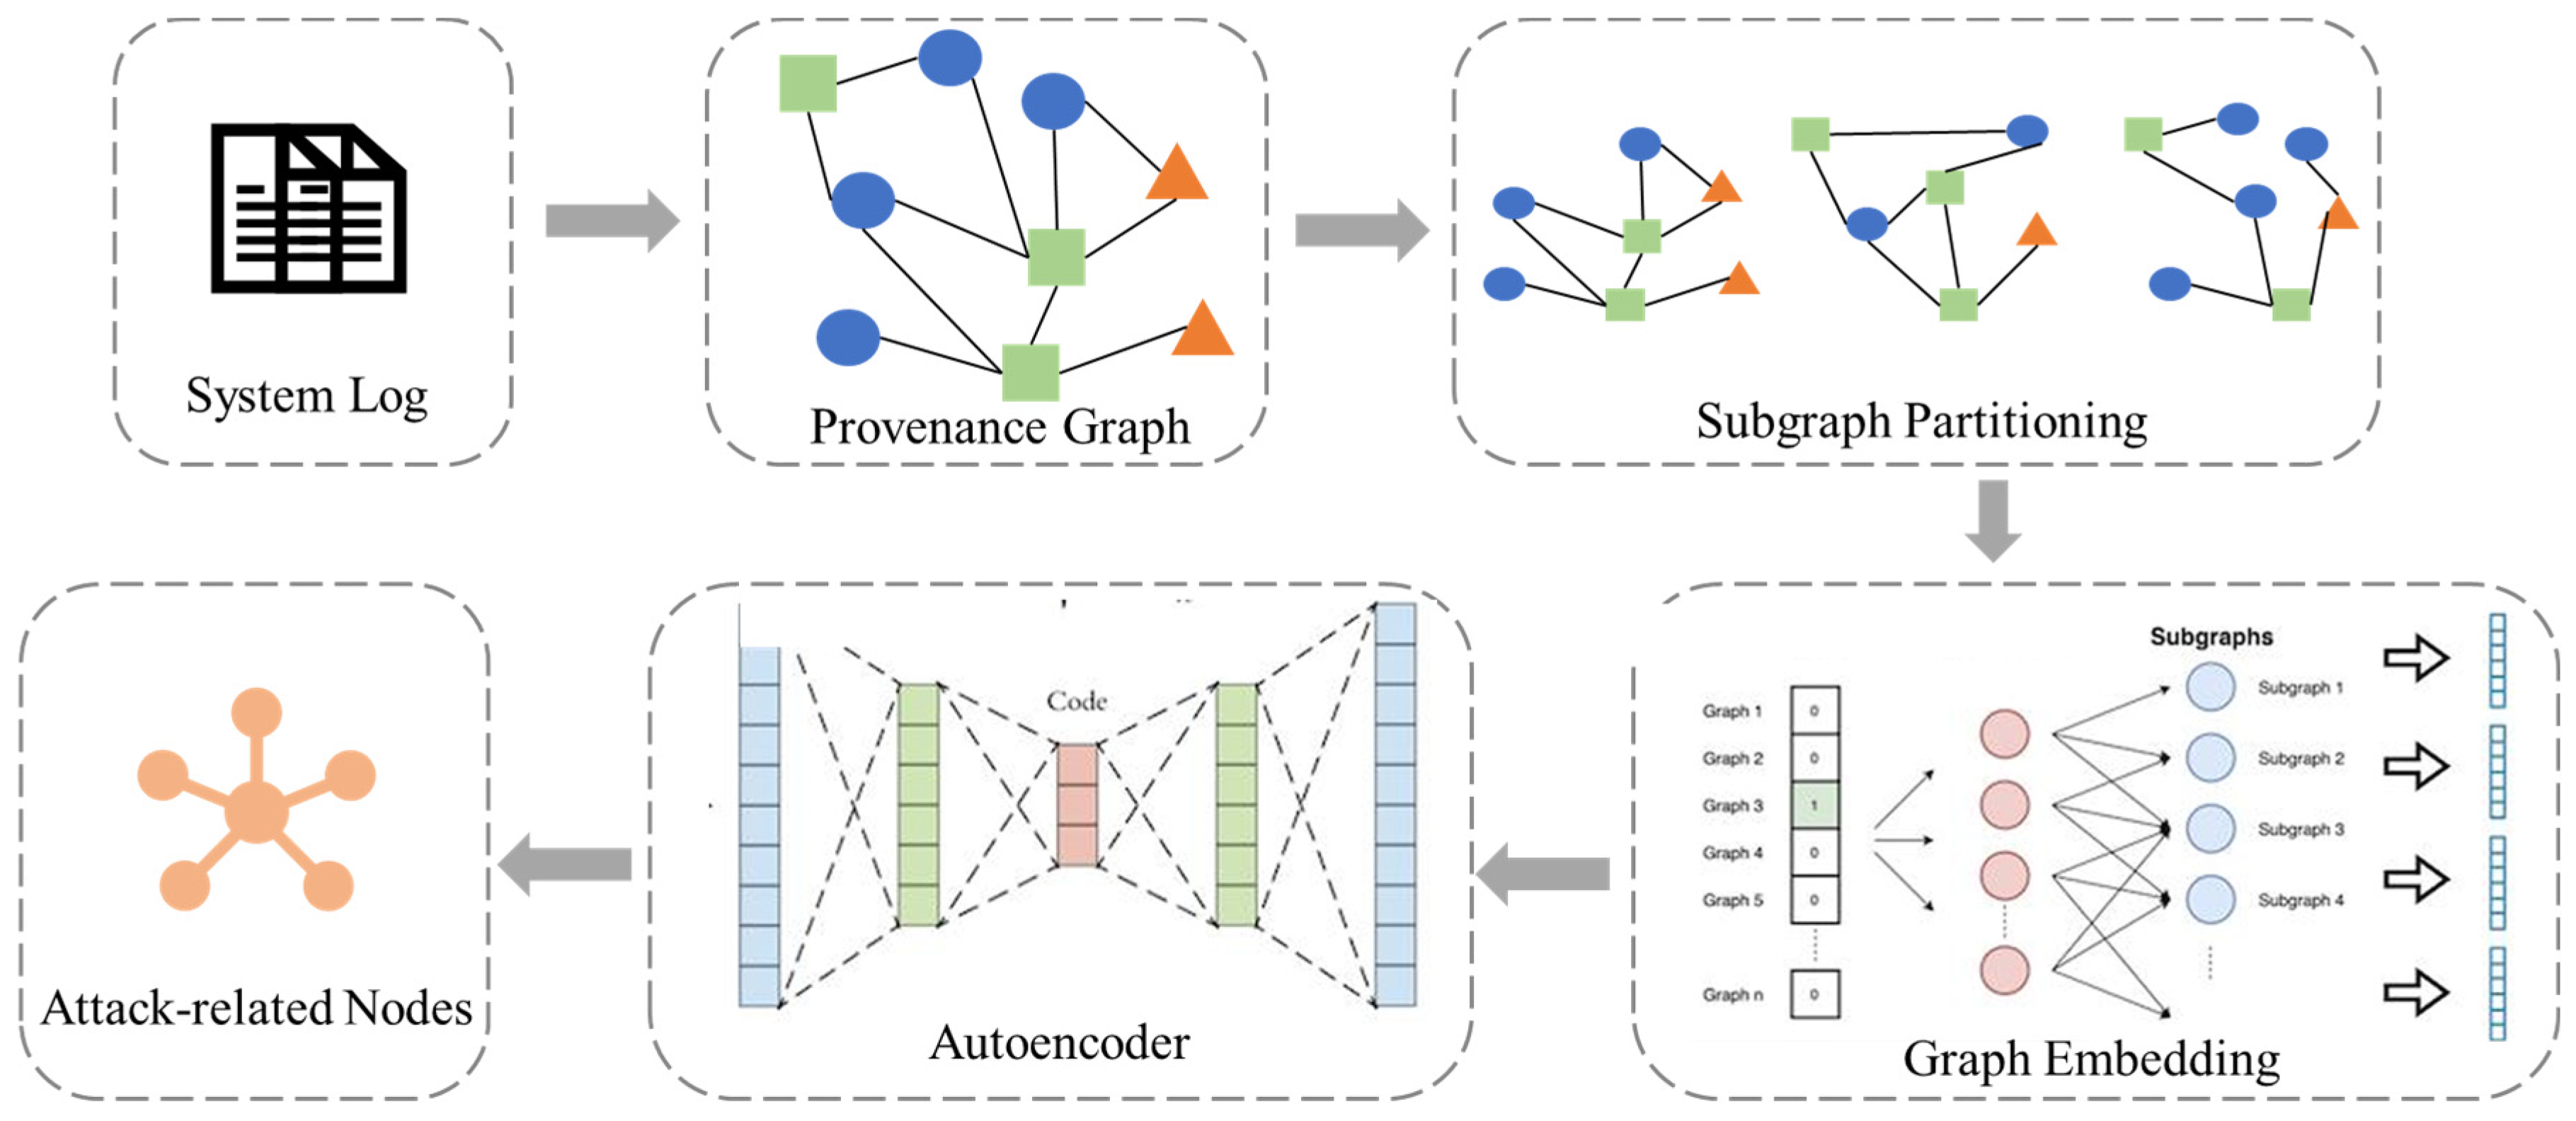
3. Sylph Method
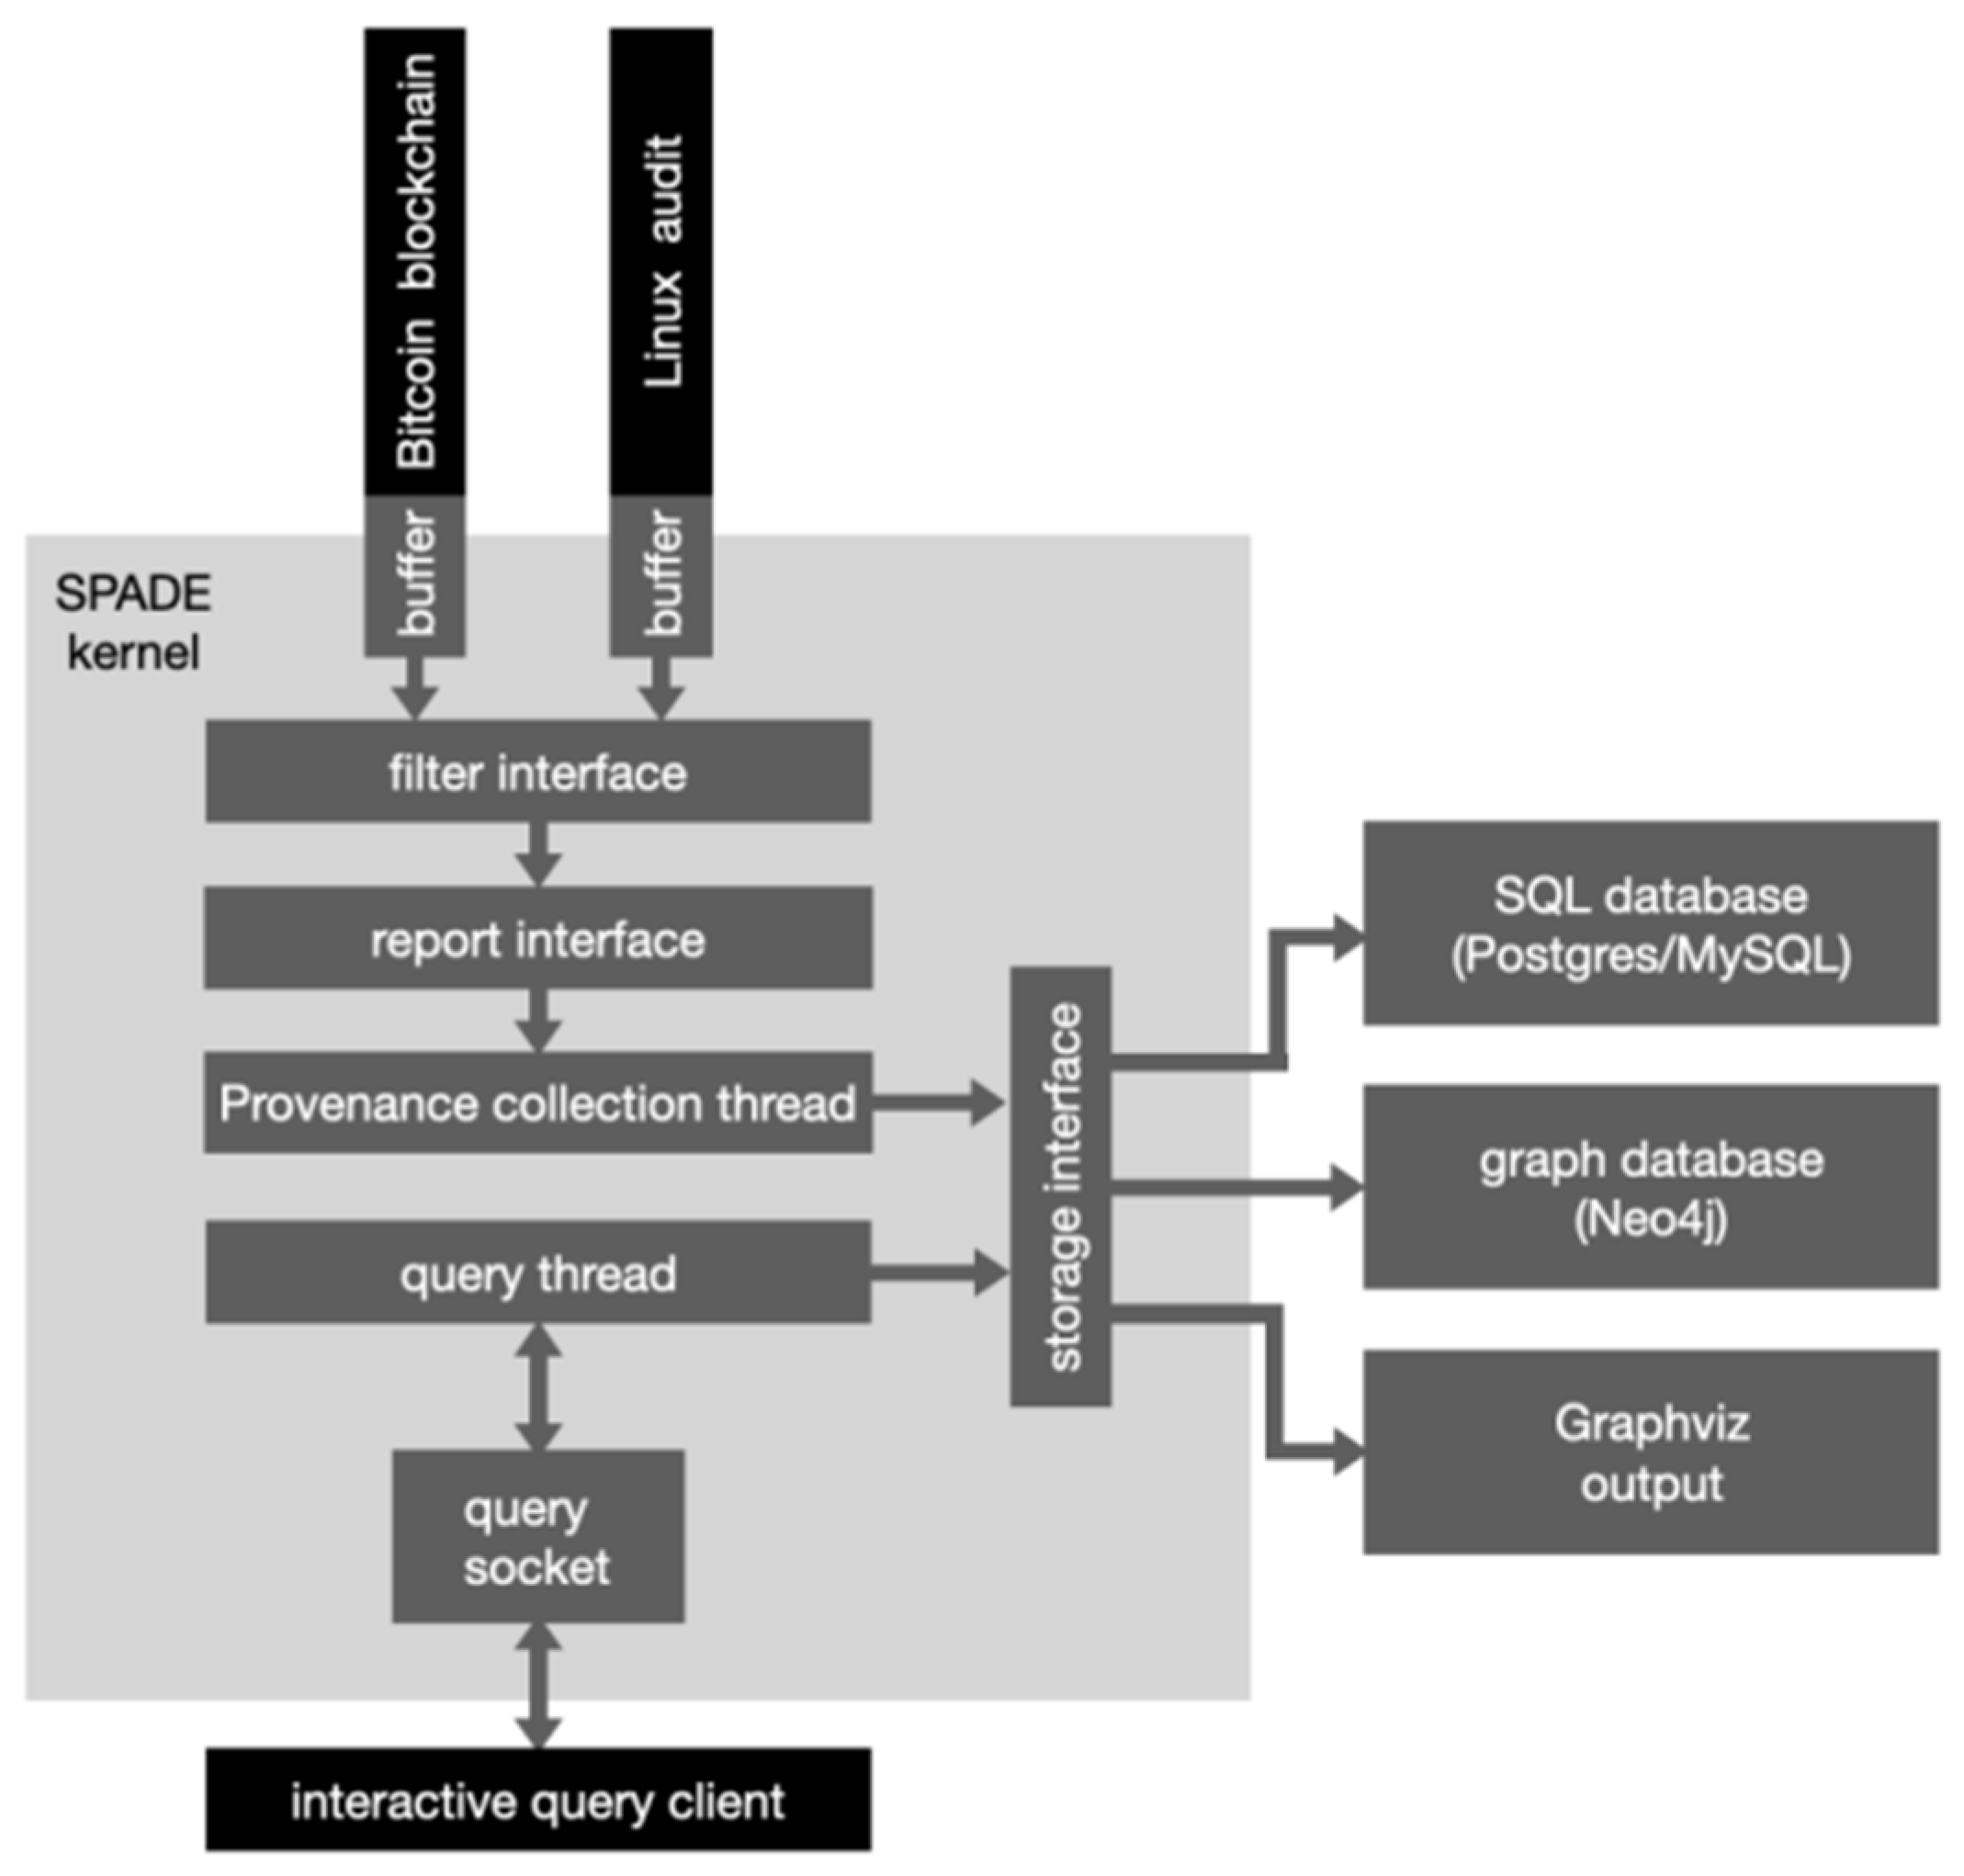
3.1. Provenance Graph Collection
| Algorithm 1 Reporter Module—Provenance Graph Construction |
| Input: Audit Log auditLog, Buffer internalBuffer, Arguments arguments Output: Buffer internalBuffer filled with vertices and edges |
| 1: Initialize internalBufer 2: while there are events in auditLog do 3: Event event ← readEventEromLog(auditLog) ▷Read when there is an event in the log 4: Graph graph ← processEvent(event) 5: for all Vertex verter in graph.get Vertices() do ▷Traversing the vertices in a graph 6: internalBuffer.putVertex(verter) ▷Putting vertices into the internal buffer 7: end for 8: for all Edge edge in graph.getEdges() do ▷Iterate over the edges in the graph 9: internalBuffer.putEdge(edge) ▷Putting edges into the internal buffer |
| 10: end for |
| Algorithm 2 Filter Module—time filter |
| Input: AbstractFilter nextFilter, Vertex vertex, Edge edge, Storage storage Output: Filtered events based on predefined rules and conditions |
| 1: Initialize filter with arguments 2: while events are coming into filter do ▷When an event enters the filter 3: if event is a vertex then ▷If it is a vertex, call the putVertex method 4: Call putVertex method with incoming vertex 5: else if event is an edge then ▷If it is an edge, call the putEdge method 6: Call putEdge method with incoming edge 7: end if 8: end while 9: Send vertices and edges to nextFilter using putInNextFilter method |
| 10: Increment storage.vertexCount and storage.edgeCount 11: Shutdown filter after processing all events ▷Send vertices and edges down and increase the number of both |
3.2. Subgraph Partitioning
- (a)
- The first event is used as the time reference, and the relative time of all events in the provenance graph, denoted as , is calculated.
- (b)
- The number of subgraphs n is determined using Equation (1).
- (c)
- The corresponding and for each subgraph are calculated. Events that satisfy the condition are written into the corresponding subgraph JSON file. The formulas for calculating and are given in Equations (2) and (3).
- (d)
- After the events are written into subgraph JSON files, they are converted to CSV files for subgraph partitioning, as described in Algorithm 3.
| Algorithm 3 Subgraph Partitioning |
| Input: Provenance graph in JSON format pgorigin.json, Time slot time_slot and Time forgetting rate time_forgot Output: A sequence of CSV files for the partitioned subgraphs |
| 1: while pgorigin.json do 2 time relative.append() ▷Generate relative time with respect to the first event 3: end while 4: n←{time_relative[len(time_relative)-1]-time_slot}/time_forgot+1 5: for i in range(n) do ▷Generate n subgraphs 6: time_min ← i*time_forgot 7: time_max ← time_min + time_slot 8: number_init ← 0 9: if time_min < <time_max then ▷Add events to a subgraph |
| 10: subi.json 11: number init++ 12: end if 13: if number_init ≠0 then ▷Delete a file if it is empty |
| 14: .json.close() |
| 15: os.remoe(.json) 16: else: 17: .csv ←.json |
| 18: end if |
| 19: end for |
3.3. Graph Embedding
3.3.1. Graph Structure Generation
| Algorithm 4 Graph Structure Generation |
| Input: Directory path containing OSV files Output: List of graph objects |
| 1: Initialize an empty list graph 2: for i = 0 to 999 do 3: Construct CSV file path as csv file 4: Read data from csv file into dataframe df 5: Create a new directed graph G 6: for each row in df do 7: Extract node and edge attributes from row ▷Extract features of nodes and edges 8: Add start node and end node to G with their types as attribute ▷Add start termination node 9: Add edge between start node and end node to G with time and type as attributes ▷Add edge |
| 10: end for 11: Append G to graphs 12: end for |
| 13: Convert node labels to integers in each graph in graphs |
| 14: return graphs |
3.3.2. Subgraph Embedding
- (1)
- Graph traversal serialization: The algorithm starts by traversing the input graph and generates traversal sequences of nodes. This sequence records the order of nodes visited during the traversal, akin to a local topological sort. This serialization process resembles performing a depth-first or breadth-first search on the graph.
- (2)
- Sequence embedding learning: The generated node traversal sequences are treated as sequential data. Graph2Vec employs word embedding models (such as Word2Vec) to learn embeddings of these node sequences. In this step, the node sequences are fed into the Word2Vec model for training, resulting in embedding vectors for each node.
- (3)
- Graph embedding aggregation: After obtaining embedding vectors for nodes, Graph2Vec utilizes an aggregation function to combine these node vectors into a single vector representation of the entire graph. This aggregation function can be a simple sum, average, or a more complex function.
3.4. AutoEncoder
4. Experiment and Analysis
4.1. The Dataset
4.2. Experimental Evaluation
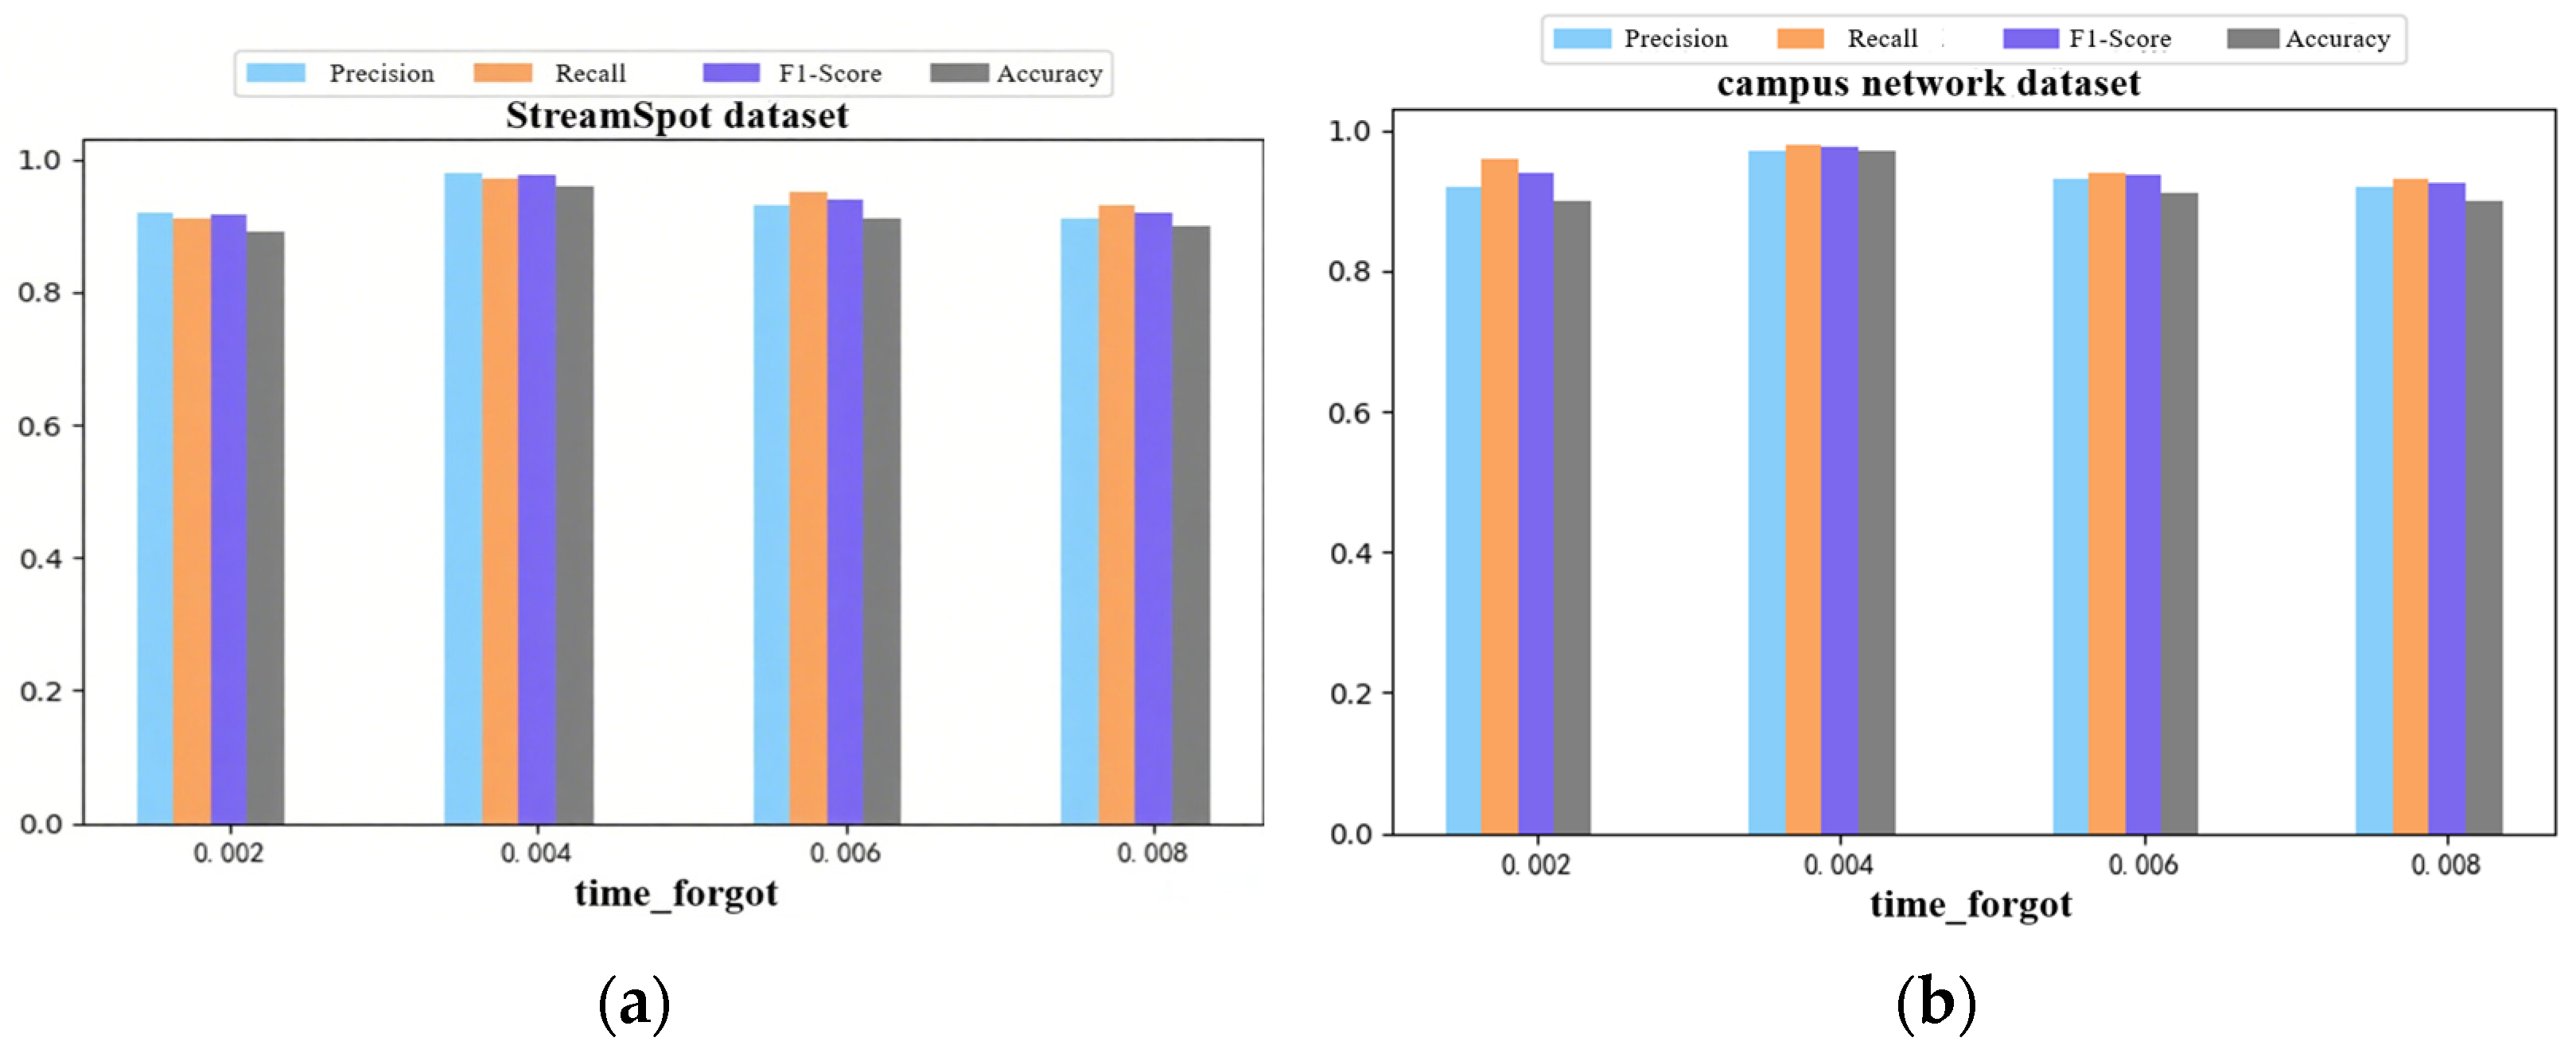
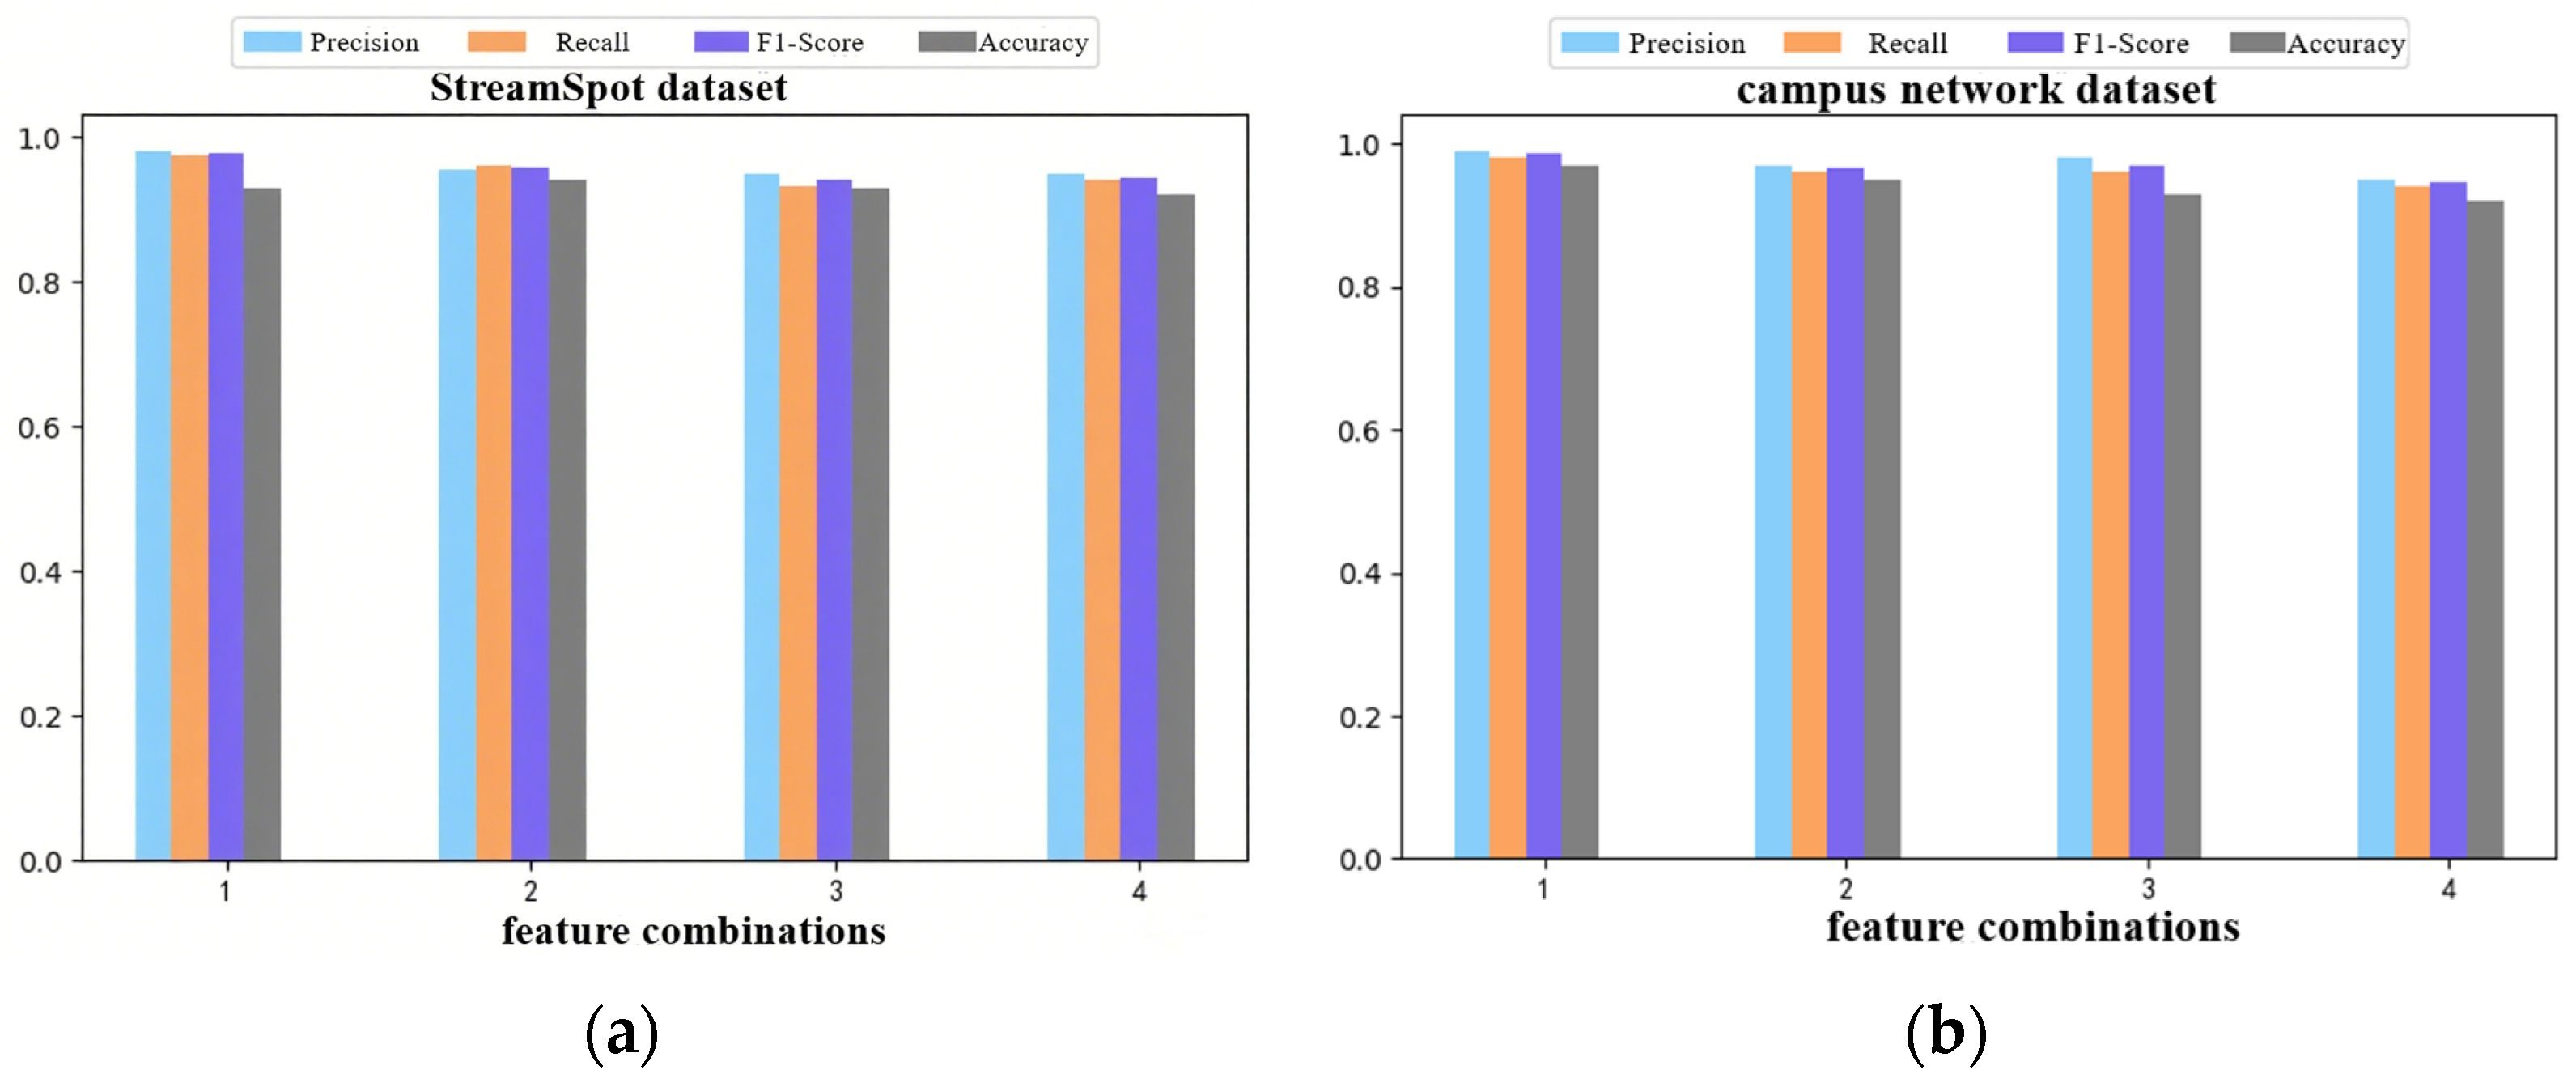
4.2.1. Impact of Time Forgetting Rate and Semantic Features on Detection Accuracy
4.2.2. Impact of System Parameters (ε, δ, ASI Threshold) on Sylph Detection Accuracy
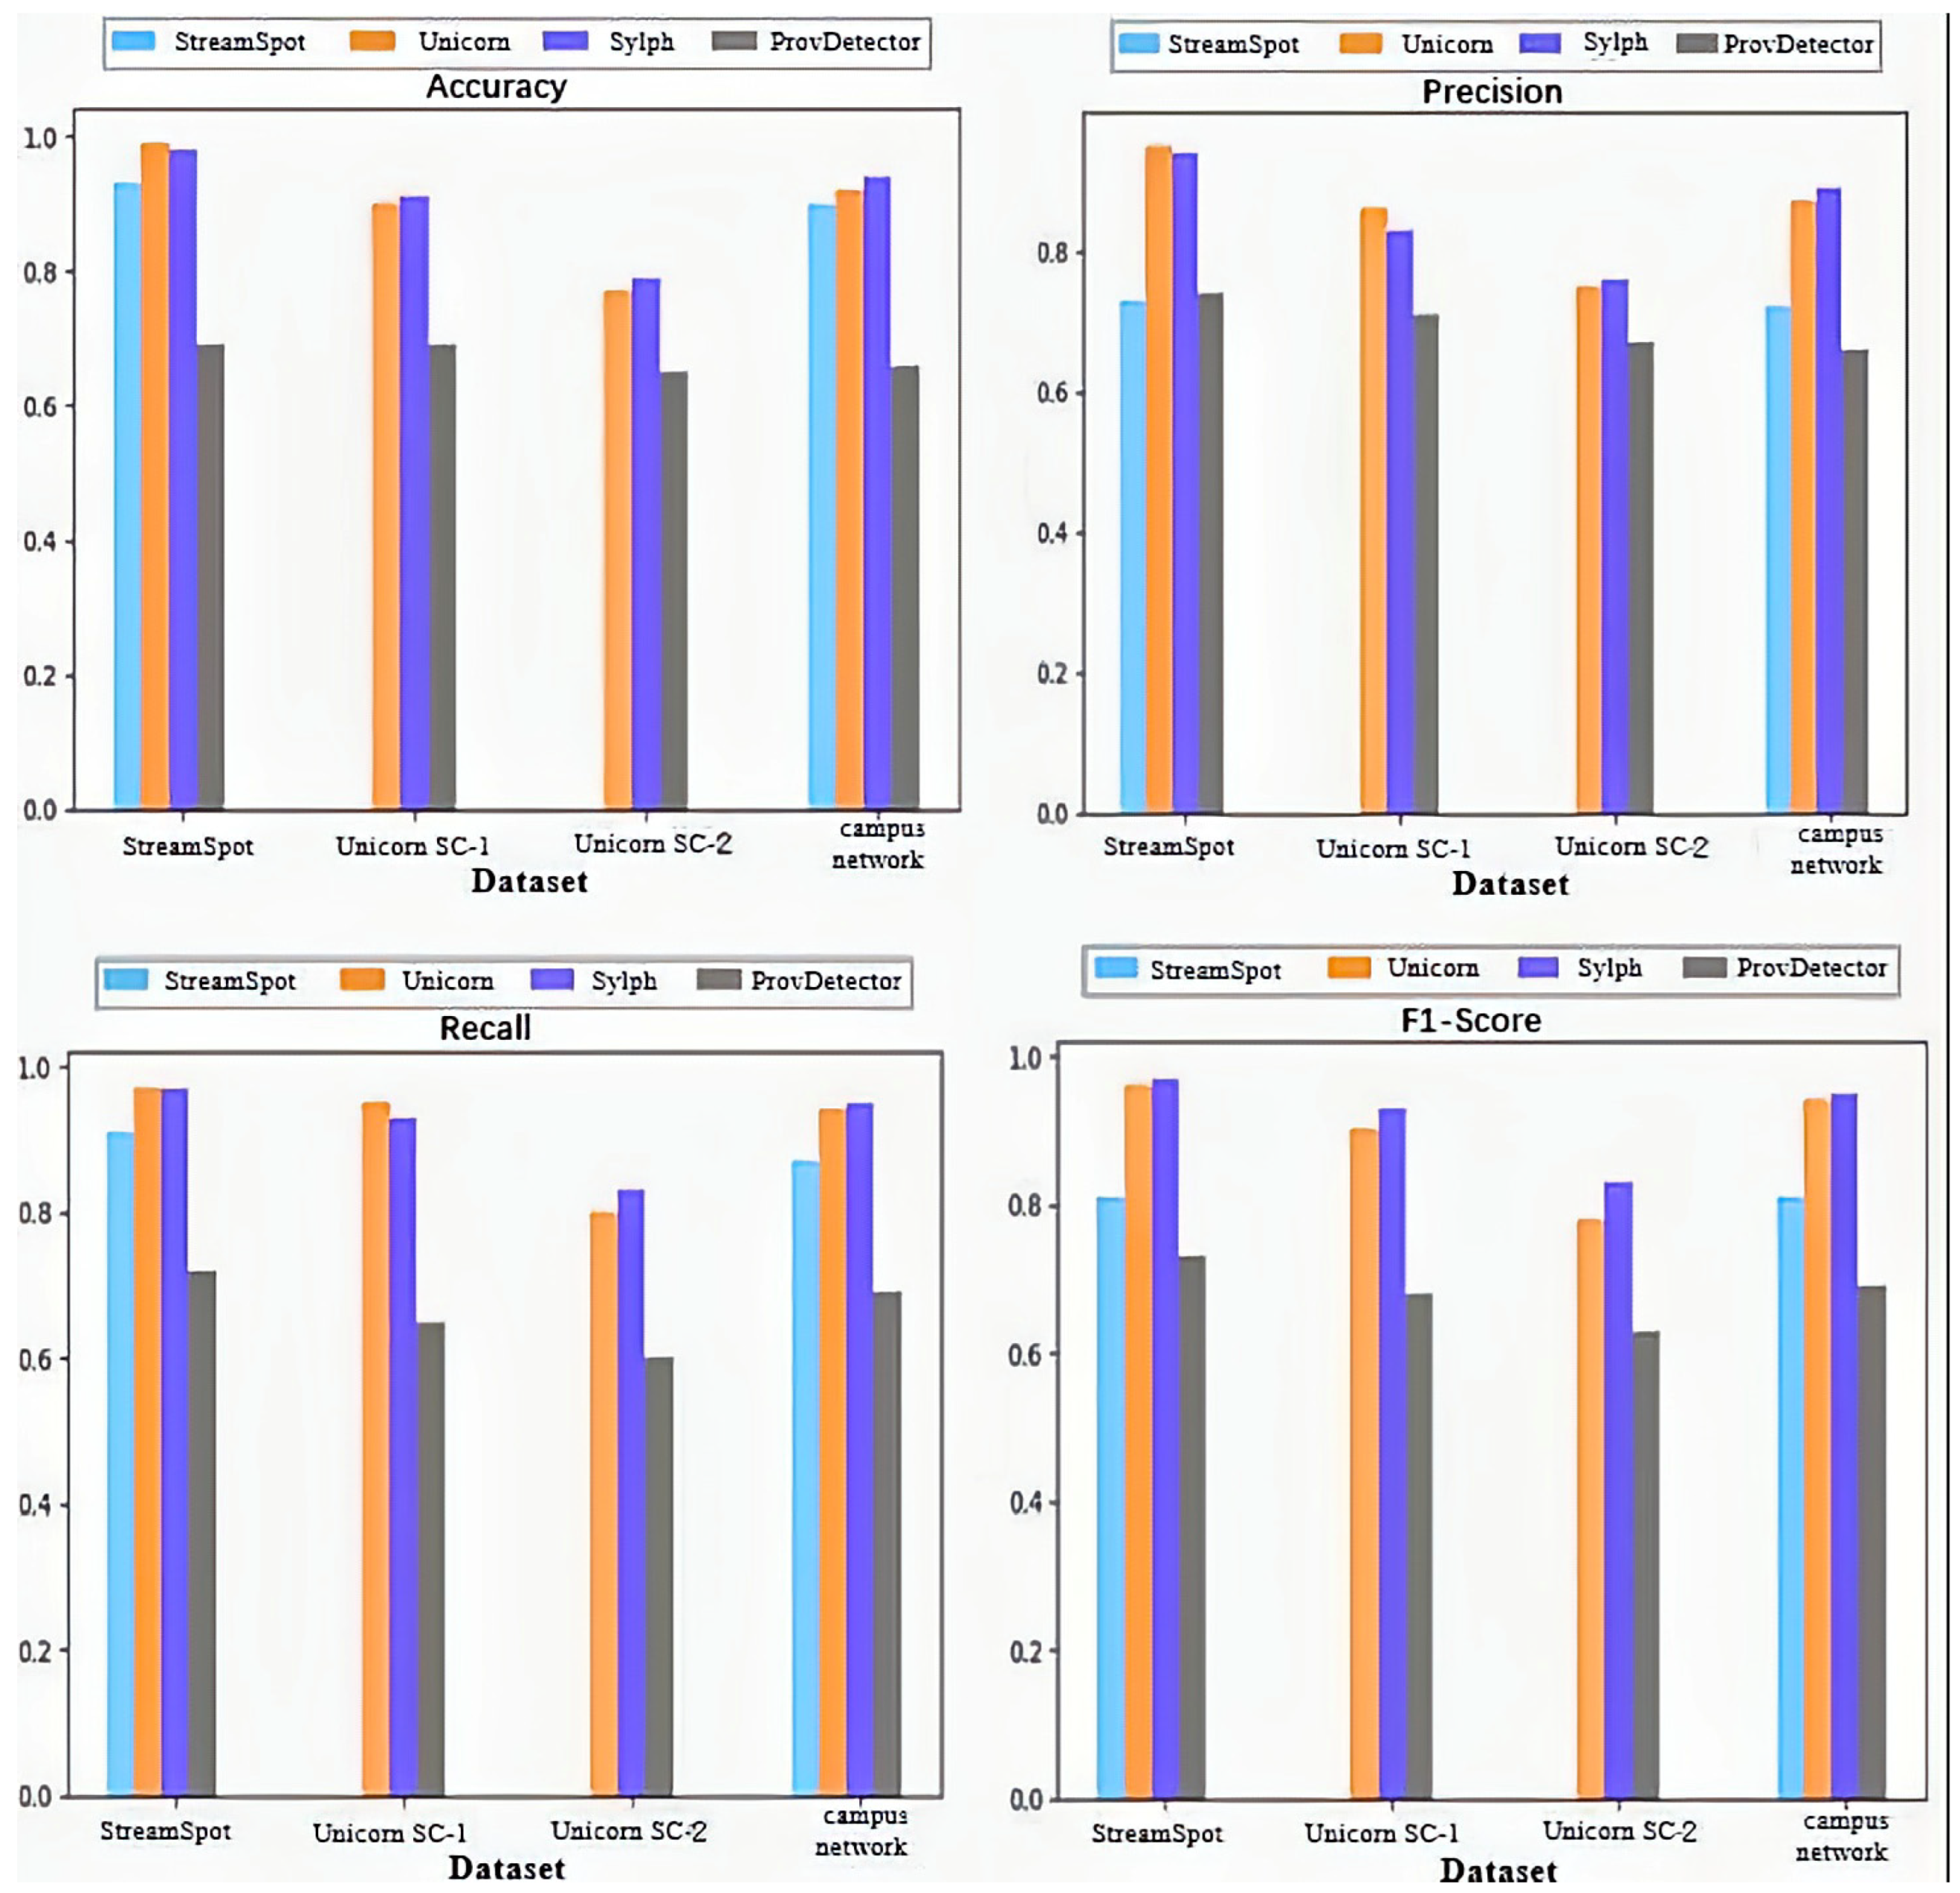
4.2.3. Sylph vs. Other APT Detection Methods
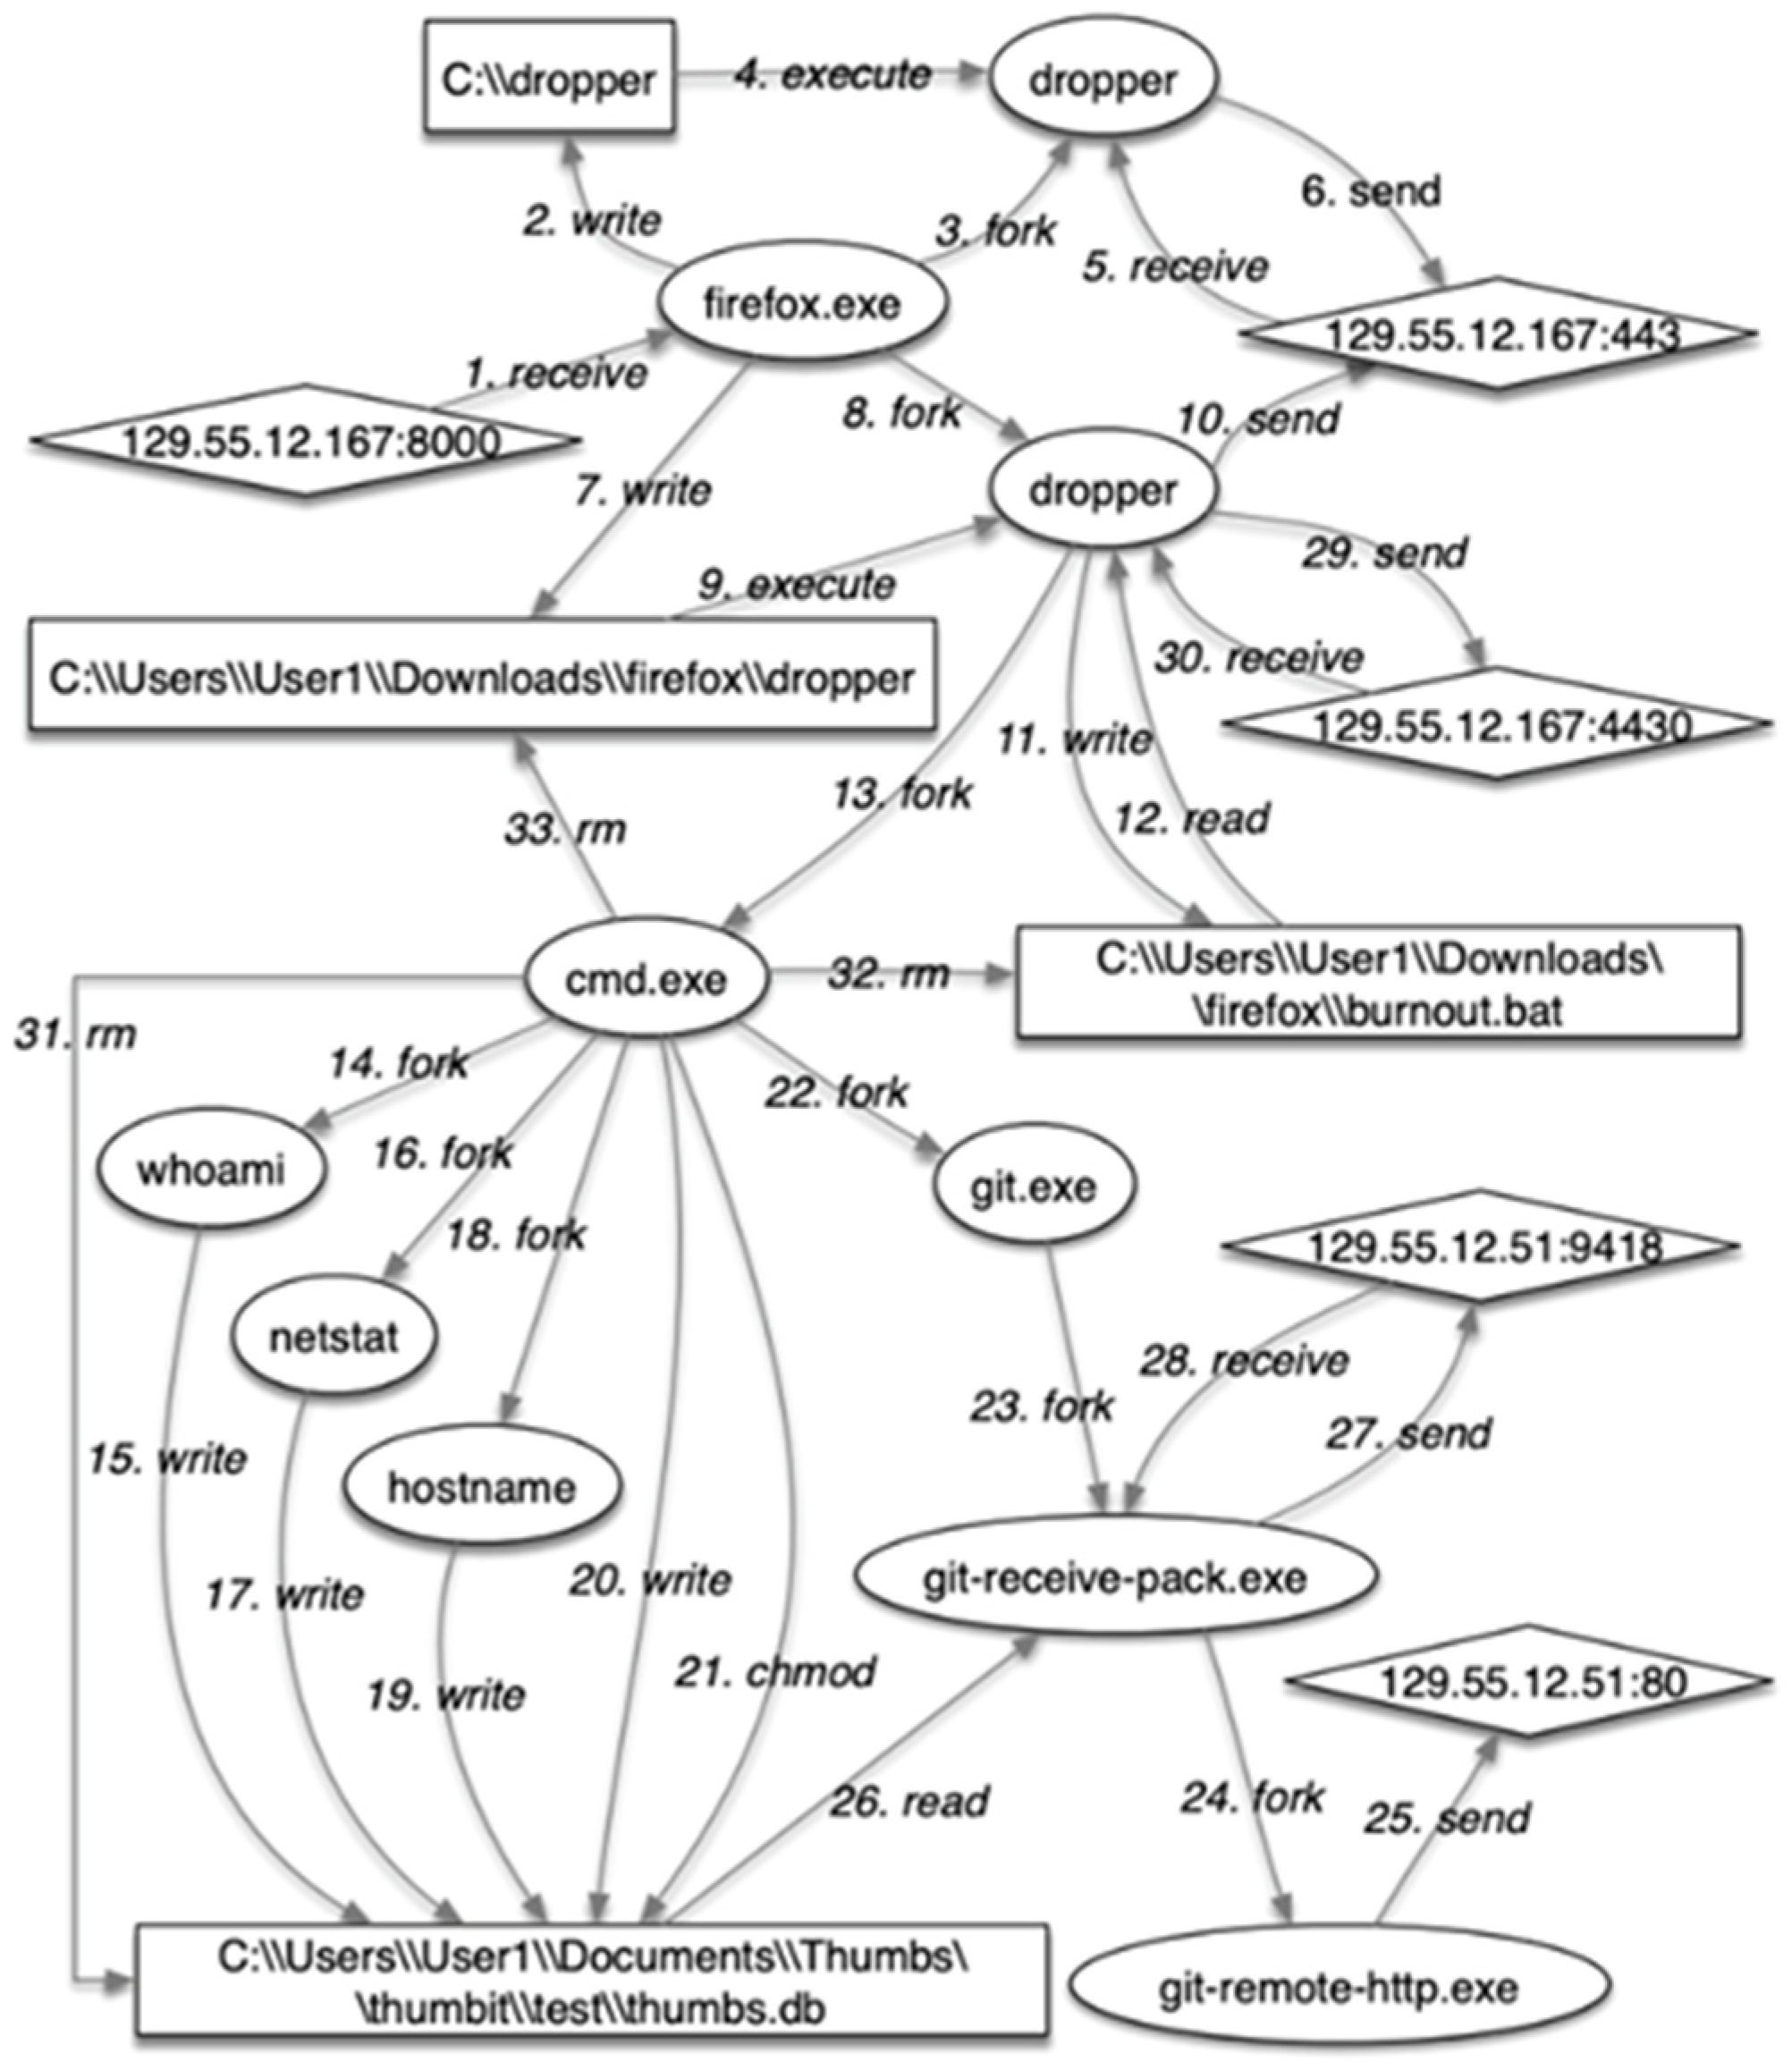
- StreamSpot Dataset: As shown in Table 5, the average number of nodes between malicious and benign samples is quite similar; however, the average number of edges in the malicious provenance graphs is significantly lower. This structural difference between malicious and benign provenance graphs is notable. Except for ProvDetector, all detection tools show good results. Sylph is able to embed the semantic attributes of malicious provenance graphs into its model, achieving detection performance similar to Unicorn. However, while Unicorn analyzes the entire provenance graph—which incurs high computational overhead—Sylph efficiently partitions the graph into subgraphs.
- Unicorn Dataset: In this dataset, attackers possess prior knowledge of the system, resulting in more stealthy behaviors compared to other datasets. In most attack graphs, the number of malicious nodes in the Unicorn dataset is fewer than ten, and the number of nodes and edges is similar to that of benign graphs. Sylph addresses this by utilizing time forgetting rates to partition the provenance graph into subgraphs, increasing the number of subgraphs that contain malicious nodes and thereby balancing the dataset, which leads to effective detection. Additionally, StreamSpot struggles with provenance graphs that contain too many edges, making it ineffective for the Unicorn dataset. In contrast, Sylph divides the provenance graph into smaller subgraphs, ensuring that even with many edges, the increase in detection time remains linear.
- Campus Network Dataset: The number of nodes and edges in the benign and malicious provenance graphs lies between those of the StreamSpot and Unicorn datasets. Since we introduced attacks that were not encountered in StreamSpot and Unicorn, the detection performance of those methods was lower. However, Sylph’s capability to detect previously unknown APT attacks resulted in the best detection outcomes in this case.
4.2.4. Sylph Efficiency Analysis
5. Discussion
6. Conclusions
Author Contributions
Funding
Institutional Review Board Statement
Informed Consent Statement
Data Availability Statement
Conflicts of Interest
References
- Ashraf, M.W.A.; Singh, A.R.; Pandian, A.; Rathore, R.S.; Bajaj, M.; Zaitsev, I. A hybrid approach using support vector machine rule-based system: Detecting cyber threats in internet of things. Sci. Rep. 2024, 14, 27058. [Google Scholar] [CrossRef] [PubMed]
- Hossain, M.N.; Sheikhi, S.; Sekar, R. Combating dependence explosion in forensic analysis using alternative tag propagation semantics. In Proceedings of the 2020 IEEE Symposium on Security and Privacy (SP), San Francisco, CA, USA, 18–20 May 2020; IEEE: New York, NY, USA, 2020; pp. 1139–1155. [Google Scholar]
- Rehman, M.U.; Ahmadi, H.; Hassan, W.U. Flash: A comprehensive approach to intrusion detection via provenance graph representation learning. In Proceedings of the 2024 IEEE Symposium on Security and Privacy (SP), San Francisco, CA, USA, 19–23 May 2024; IEEE: New York, NY, USA, 2024; pp. 3552–3570. [Google Scholar]
- Li, Z.; Chen, Q.A.; Yang, R.; Chen, Y.; Ruan, W. Threat detection and investigation with system-level provenance graphs: A survey. Comput. Secur. 2021, 106, 102282. [Google Scholar] [CrossRef]
- Lagraa, S.; Husák, M.; Seba, H.; Vuppala, S.; State, R.; Ouedraogo, M. A review on graph-based approaches for network security monitoring and botnet detection. Int. J. Inf. Secur. 2024, 23, 119–140. [Google Scholar] [CrossRef]
- Manzoor, E.; Milajerdi, S.M.; Akoglu, L. Fast memory-efficient anomaly detection in streaming heterogeneous graphs. In Proceedings of the 22nd ACM SIGKDD International Conference on Knowledge Discovery and Data Mining, San Francisco, CA, USA, 13–17 August 2016; pp. 1035–1044. [Google Scholar]
- Abdullayeva, F.J. Advanced persistent threat attack detection method in cloud computing based on autoencoder and softmax regression algorithm. Array 2021, 10, 100067. [Google Scholar] [CrossRef]
- Milajerdi, S.M.; Eshete, B.; Gjomemo, R.; Venkatakrishnan, V.N. Poirot: Aligning attack behavior with kernel audit records for cyber threat hunting. In Proceedings of the 2019 ACM SIGSAC Conference on Computer and Communications Security, London, UK, 11–15 November 2019; pp. 1795–1812. [Google Scholar]
- Milajerdi, S.M.; Gjomemo, R.; Eshete, B.; Sekar, R.; Venkatakrishnan, V.N. Holmes: Real-time apt detection through correlation of suspicious information flows. In Proceedings of the 2019 IEEE Symposium on Security and Privacy (SP), San Francisco, CA, USA, 19–23 May 2019; IEEE: New York, NY, USA, 2019; pp. 1137–1152. [Google Scholar]
- Han, X.; Pasquier, T.; Bates, A.; Mickens, J.; Seltzer, M. Unicorn: Runtime provenance-based detector for advanced persistent threats. arXiv 2020, arXiv:arXiv:2001.01525. [Google Scholar]
- Wang, Q.; Hassan, W.U.; Li, D.; Jee, K.; Yu, X.; Zou, K.; Rhee, J.; Chen, Z.; Cheng, W.; Gunter, C.A.; et al. You Are What You Do: Hunting Stealthy Malware via Data Provenance Analysis. In Proceedings of the Network and Distributed Systems Security (NDSS) Symposium 2020, San Diego, CA, USA, 23–26 February 2020. [Google Scholar]
- Hassan, W.U.; Bates, A.; Marino, D. Tactical provenance analysis for endpoint detection and response systems. In Proceedings of the 2020 IEEE Symposium on Security and Privacy (SP), San Francisco, CA, USA, 18–20 May 2020; IEEE: New York, NY, USA, 2020; pp. 1172–1189. [Google Scholar]
- Alsaheel, A.; Nan, Y.; Ma, S.; Yu, L.; Walkup, G.; Celik, Z.B.; Zhang, X.; Xu, D. ATLAS: A sequence-based learning approach for attack investigation. In Proceedings of the 30th USENIX Security Symposium, USENIX Security 2021, Vancouver, BC, Canada, 11–13 August 2021; USENIX Association: Berkeley, CA, USA, 2021; pp. 3005–3022. [Google Scholar]
- Perozzi, B.; Al-Rfou, R.; Skiena, S. Deepwalk: Online learning of social representations. In Proceedings of the 20th ACM SIGKDD International Conference on Knowledge Discovery and Data Mining, New York, NY, USA, 24–27 August 2014; pp. 701–710. [Google Scholar]
- Grover, A.; Leskovec, J. node2vec: Scalable feature learning for networks. In Proceedings of the 22nd ACM SIGKDD International Conference on Knowledge Discovery and Data Mining, San Francisco, CA, USA, 13–17 August 2016; pp. 855–864. [Google Scholar]
- Narayanan, A.; Chandramohan, M.; Venkatesan, R.; Chen, L.; Liu, Y.; Jaiswal, S. graph2vec: Learning distributed representations of graphs. arXiv 2017, arXiv:1707.05005. [Google Scholar]
- Zhang, M.; Chen, Y. Link prediction based on graph neural networks. Adv. Neural Inf. Process. Syst. 2018, 31, 5165–5175. [Google Scholar]
- Gehani, A.; Kazmi, H.; Irshad, H. Scaling SPADE to “Big provenance”. In Proceedings of the 8th USENIX Conference on Theory and Practice of Provenance, Washington, DC, USA, 8–9 June 2016; pp. 26–33. [Google Scholar]
- Gehani, A.; Tariq, D. SPADE: Support for provenance auditing in distributed environments. In Proceedings of the ACM/IFIP/USENIX International Conference on Distributed Systems Platforms and Open Distributed Processing, Beijing, China, 9–13 December 2013; Springer: Berlin/Heidelberg, Germany, 2013; pp. 101–120. [Google Scholar]
- Gehani, A.; Ahmad, R.; Irshad, H.; Zhu, J.; Patel, J. Digging into big provenance (with SPADE). Commun. ACM 2021, 64, 48–56. [Google Scholar] [CrossRef]
- Hagberg, A.A.; Schult, D.A.; Swart, P.J. Exploring network structure, dynamics, and function using NetworkX. In Proceedings of the 7th Python in Science Conference (SciPy2008), Pasadena, CA, USA, 19–24 August 2008; Varoquaux, G., Vaught, T., Millman, J., Eds.; pp. 11–15. [Google Scholar]
- Chen, Z.; Yeo, C.K.; Lee, B.S.; Lau, C.T. Autoencoder-based network anomaly detection. In Proceedings of the 2018 Wireless Telecommunications Symposium (WTS), Phoenix, AZ, USA, 17–20 April 2018; IEEE: New York, NY, USA, 2018; pp. 1–5. [Google Scholar]
- Han, X.M. Streamspot Data [Data Set]. GitHub. 2016. Available online: https://github.com/sbustreamspot/sbustreamspot-data (accessed on 1 January 2025).


| Process | Describe |
|---|---|
| cron | Timed task executed successfully, e.g., CRON [12345]: (root) CMD (command) |
| dhelient | DHCP client successfully obtains IP, e.g., DHCPREQUEST OI192.168.1.100 on etho to 255.255.255.255.255 port 67 |
| sshd | SSH login success, such as: Accepted password for user from192.168.1.100 port 12345 ssh2 |
| systemd | System service startup success, such as: started Sess1on 10 of user root |
| kernel | Kernel routing table changed, e.g., rt6_mtu_change:mtu update1gnored |
| postfix | Mail server successfully sent mail, e.g., postf1x/smtpd [12345]: disconnect from unknown [192.168.1.100] |
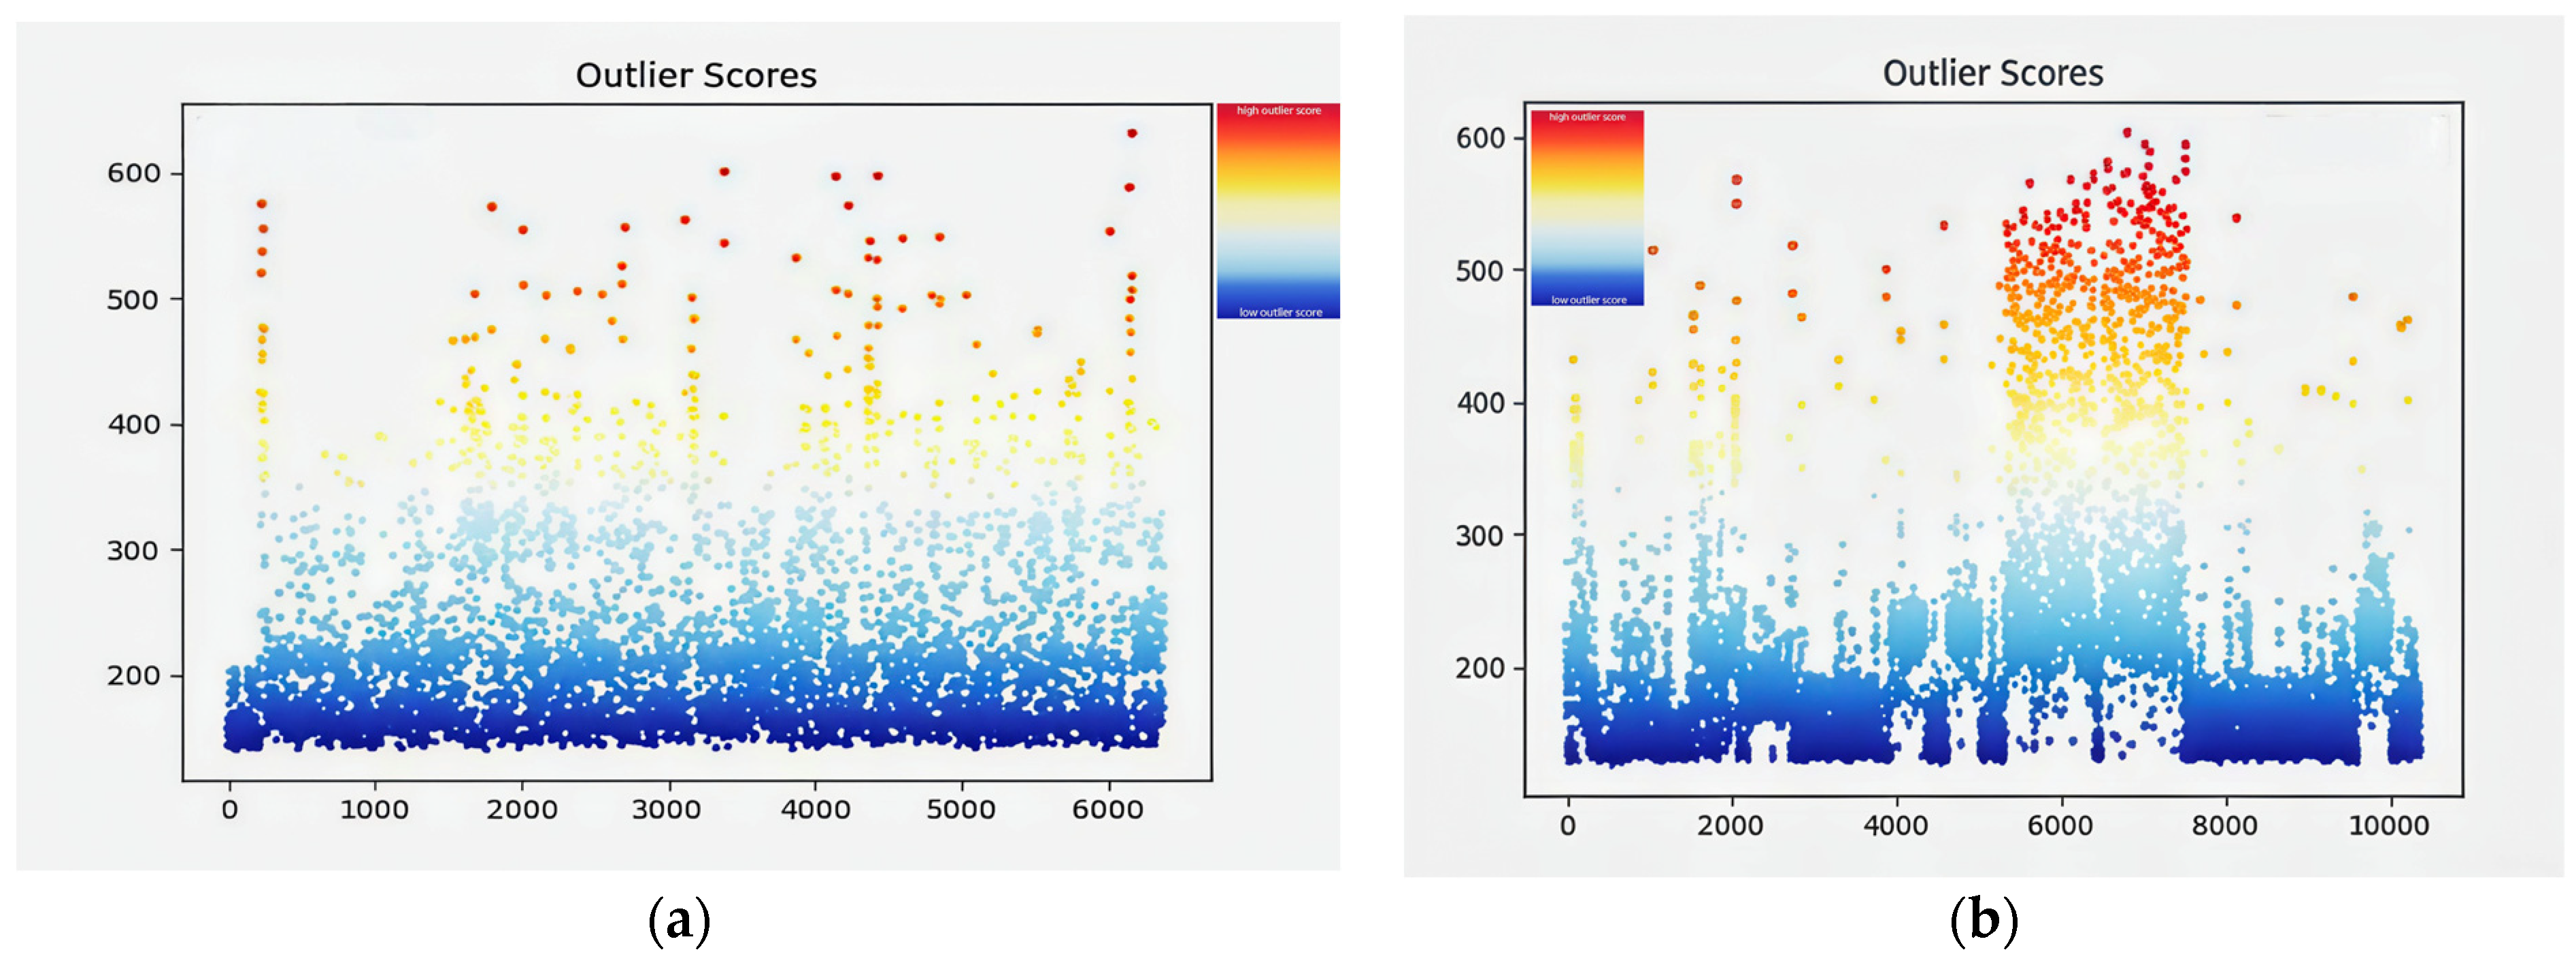
| Outlier Score Interval | (0, 200) | (200, 400) | (400, 500) | (500, 600) | |
|---|---|---|---|---|---|
| benign | Average number of subgraphs | 5684 | 9142 | 2676 | 1586 |
| Average subgraph percentage | 29.77% | 47.89% | 14.02% | 8.31% | |
| attack | Average number of subgraphs | 19132 | 27959 | 1579 | 171 |
| Average subgraph percentage | 39.17% | 57.24% | 3.23% | 0.35% |
| λ | 450 | 470 | 490 | 510 | 530 | |
|---|---|---|---|---|---|---|
| benign | Average number of subgraphs | 707 | 403 | 241 | 135 | 94 |
| Average subgraph percentage | 1.46% | 0.93% | 0.59% | 0.33% | 0.19% | |
| Percentage of smallest subgraphs | 2.84% | 1.51% | 0.87% | 0.42% | 0.21% | |
| attack | Average number of subgraphs | 2948 | 2561 | 2047 | 1458 | 863 |
| Average subgraph percentage | 15.47% | 13.44% | 10.74% | 7.65% | 4.53% | |
| Percentage of smallest subgraphs | 13.72% | 11.52% | 9.14% | 6.97% | 4.34% | |
| the variance in the number of subgraphs | 691 | 584 | 401 | 184 | 112 |
| ASI | Average Value | Maximum Value | Minimum Value |
|---|---|---|---|
| benign provenance graphs | 0.07 | 0.12 | 0.02 |
| malicious provenance graphs | 0.99 | 1 | 0.99 |
| Datasets | Labels | Number of Graphs | Average Number of Nodes per Graph | Average Number of Edges per Graph |
|---|---|---|---|---|
| StreamSpot | benign | 500 | 8315 | 173,857 |
| malicious | 100 | 8891 | 28,423 | |
| Unicorn SC-1 | benign | 125 | 265,424 | 975,226 |
| malicious | 25 | 257,156 | 957,968 | |
| Unicorn SC-2 | benign | 125 | 238,338 | 911,153 |
| malicious | 25 | 243,658 | 949,887 |
| Labels | Scenario | Number of Graphs | Average Number of Nodes per Graph |
|---|---|---|---|
| benign | Download | 12 | 15,986 |
| Livestream | 12 | 15,660 | |
| Music | 12 | 16,815 | |
| Webvideo | 12 | 17,304 | |
| Word | 12 | 16,119 | |
| Code | 12 | 15,428 | |
| malicious | Ares_mongo | 32 | 17,972 |
| Ares_flaski | 24 | 15,217 | |
| Byob_ssi | 32 | 17,753 | |
| Byob_obfuscated | 12 | 15,945 |
| Num | Node | Edge |
|---|---|---|
| 1 | start_node_type,end_node_type | edge_time.edge_type |
| 2 | start_node_type,end_node_type,start_node_description,end_node_description | edge_time,edge_type,edge_operation |
| 3 | start_node_type,end_node_type | dge_time,edge_type,edge_operation |
| 4 | start_node_type,end_node_type,start_node_description,end_node_description | edge_time.edge_type |
| Dataset | 0.004 | 0.005 | 0.006 | 0.008 | 0.06 |
|---|---|---|---|---|---|
| Benign Dataset 1 | 0.2689 | 0.1192 | 0.0474 | 0.0066 | 1.7588 × 10⁻²⁵ |
| Benign Dataset 2 | 0.2314 | 0.0997 | 0.0391 | 0.0054 | 1.44 × 10⁻²⁵ |
| Benign Dataset 3 | 0.1978 | 0.0831 | 0.0322 | 0.0044 | 1.179 × 10⁻²⁵ |
| Malicious Dataset 1 | 1 | 1 | 1 | 1 | 0.99999989 |
| Malicious Dataset 2 | 1 | 1 | 1 | 1 | 0.9999546 |
| Malicious Dataset 3 | 1 | 1 | 1 | 1 | 1 |
| Dataset | 0.0005 | 0.001 | 0.002 |
|---|---|---|---|
| Benign Dataset 1 | 0.01798 | 0.1192 | 0.2689 |
| Benign Dataset 2 | 0.01212 | 0.0997 | 0.2497 |
| Benign Dataset 3 | 0.0081 | 0.0831 | 0.2314 |
| Malicious Dataset 1 | 1 | 1 | 1 |
| Malicious Dataset 2 | 1 | 1 | 1 |
| Malicious Dataset 3 | 1 | 1 | 1 |
| System | StreamSpot | Unicorn SC-1 | Unicorn SC-2 | Campus Network |
|---|---|---|---|---|
| StreamSpot | 6.92 | 48.9 | ||
| Unicorn | 0.24 | 3.2 | 16.65 | 10.88 |
| Sylph | 0.44 | 3.48 | 4.67 | 8.47 |
| ProvDetector | 4.92 | 5.4 | 6.75 | 57.88 |
| Size of Provenance Graph | Average Time (s) | CPU Usage (%) | Memory Usage (MB) |
|---|---|---|---|
| 227.4 MB | 98 | 9.8 | 121 |
| 415.6 MB | 170 | 24.7 | 365 |
| 245.6 MB | 101 | 13.2 | 158 |
| 357.2 MB | 142 | 19.6 | 272 |
Disclaimer/Publisher’s Note: The statements, opinions and data contained in all publications are solely those of the individual author(s) and contributor(s) and not of MDPI and/or the editor(s). MDPI and/or the editor(s) disclaim responsibility for any injury to people or property resulting from any ideas, methods, instructions or products referred to in the content. |
© 2025 by the authors. Licensee MDPI, Basel, Switzerland. This article is an open access article distributed under the terms and conditions of the Creative Commons Attribution (CC BY) license (https://creativecommons.org/licenses/by/4.0/).
Share and Cite
Jiang, K.; Gao, Z.; Zhang, S.; Zou, F. Sylph: An Unsupervised APT Detection System Based on the Provenance Graph. Information 2025, 16, 566. https://doi.org/10.3390/info16070566
Jiang K, Gao Z, Zhang S, Zou F. Sylph: An Unsupervised APT Detection System Based on the Provenance Graph. Information. 2025; 16(7):566. https://doi.org/10.3390/info16070566
Chicago/Turabian StyleJiang, Kaida, Zihan Gao, Siyu Zhang, and Futai Zou. 2025. "Sylph: An Unsupervised APT Detection System Based on the Provenance Graph" Information 16, no. 7: 566. https://doi.org/10.3390/info16070566
APA StyleJiang, K., Gao, Z., Zhang, S., & Zou, F. (2025). Sylph: An Unsupervised APT Detection System Based on the Provenance Graph. Information, 16(7), 566. https://doi.org/10.3390/info16070566