Article

Sylph: An Unsupervised APT Detection System Based on the Provenance Graph

1
Network and Information Center, Shanghai Jiao Tong University, Shanghai 200240, China
2
School of Computer Science, Shanghai Jiao Tong University, Shanghai 200240, China
*
Author to whom correspondence should be addressed.
Information 2025, 16(7), 566; https://doi.org/10.3390/info16070566
Submission received: 30 March 2025 / Revised: 27 June 2025 / Accepted: 29 June 2025 / Published: 2 July 2025
(This article belongs to the Special Issue Emerging Research on Neural Networks and Anomaly Detection)

Abstract

Traditional detection methods and security defenses are gradually insufficient to cope with evolving attack techniques and strategies, and have coarse detection granularity and high memory overhead. As a result, we propose Sylph, a lightweight unsupervised APT detection method based on a provenance graph, which not only detects APT attacks but also localizes APT attacks with a fine event granularity and feeds possible attacks back to system detectors to reduce their localization burden. Sylph proposes a whole-process architecture from provenance graph collection to anomaly detection, starting from the system audit logs, and dividing subgraphs based on time slices of the provenance graph it transforms into to reduce memory overhead. Starting from the system audit logs, the provenance graph it transforms into is divided into subgraphs based on time slices, which reduces the memory occupation and improves the detection efficiency at the same time; on the basis of generating the sequence of subgraphs, the full graph embedding of the subgraphs is carried out by using Graph2Vec to obtain their feature vectors, and the anomaly detection based on unsupervised learning is carried out by using an autoencoder, which is capable of detecting new types of attacks that have not yet appeared. After the experimental evaluation, Sylph can realize the APT attack detection with higher accuracy and achieve an accuracy rate.

1. Introduction

Advanced Persistent Threats (APTs) refer to a category of highly dangerous cyberattacks typically initiated by professional hacker organizations or state-sponsored espionage agencies. Compared to traditional cyberattacks, APT attacks are more covert, complex, persistent, and targeted, aiming to quietly obtain sensitive information from the target systems and organizations over extended periods. APT attacks often employ a variety of techniques, including social engineering, malware, and phishing, to breach the defenses of the target systems as effectively as possible. Attackers also exploit zero-day vulnerabilities and utilize advanced attack technologies, such as remote access tools, to ensure the success and continuity of their operations. The targets of APT attacks are often critical institutions, such as government agencies, military organizations, financial institutions, and large corporations, with attackers typically emphasizing confidentiality during the process to avoid detection and tracking by the targeted organizations.
Currently, mainstream APT detection technologies primarily consist of traditional detection methods based on rules and artificial intelligence approaches. Rule-based detection [1] relies on experts describing APT characteristics based on prior knowledge, which results in poor detection capabilities for unknown APTs [2]. Algorithms employing artificial intelligence techniques have emerged as a popular research direction, with provenance graphs becoming a common method for detecting threats based on system logs [3,4]. However, current provenance graph-based attack detection methods exhibit slow detection speeds, low accuracy, and a dependence on labeled data or other prior knowledge [5].
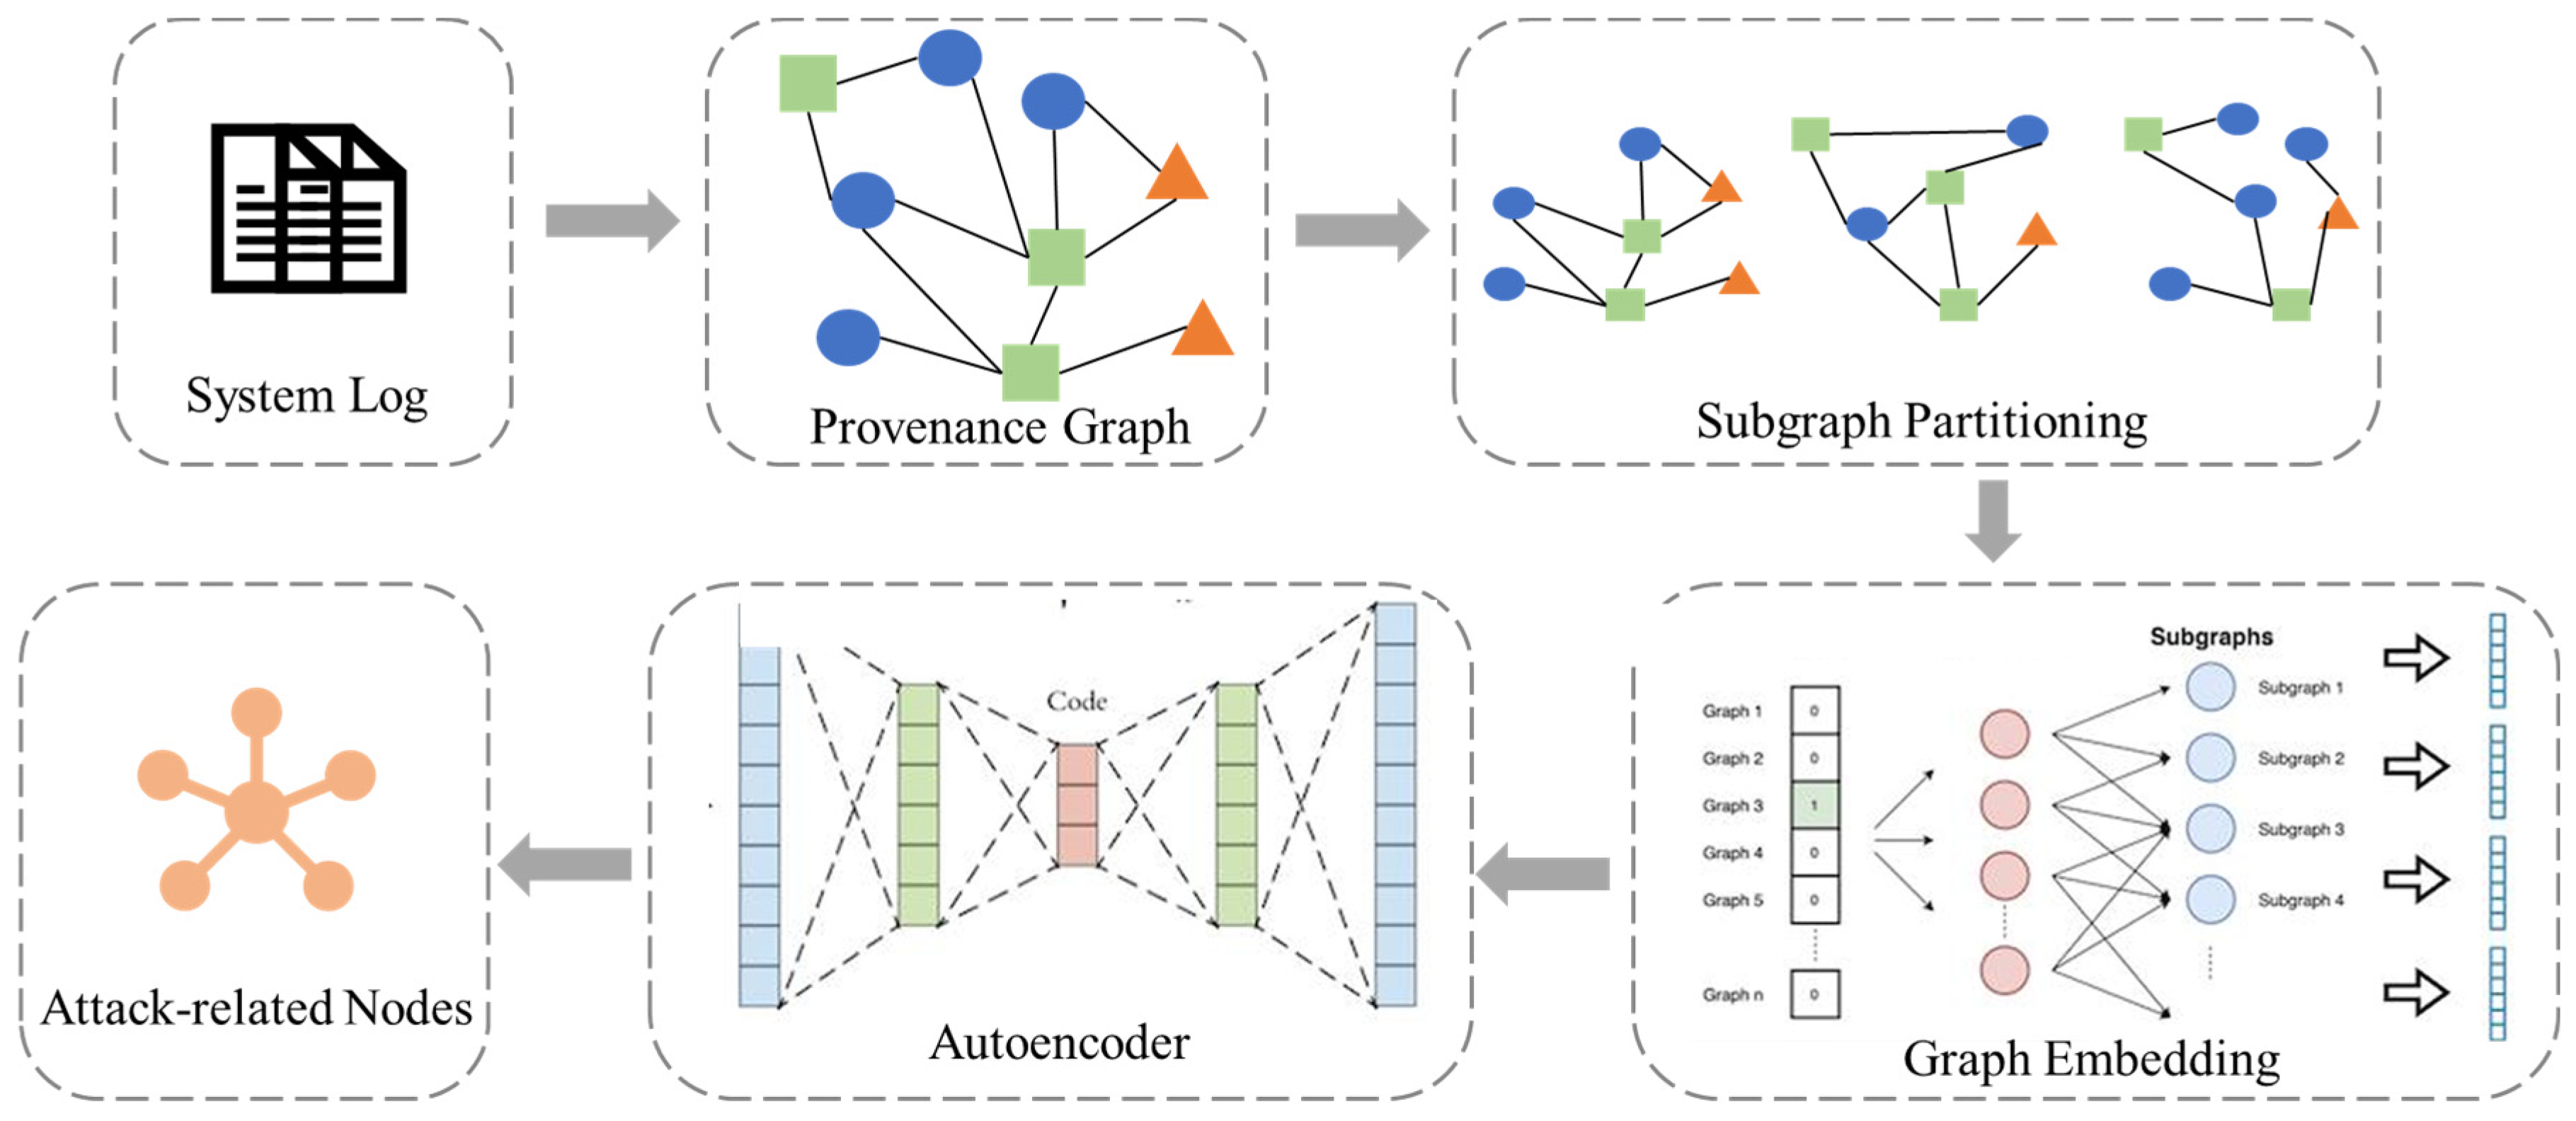
To address the aforementioned issues, we propose Sylph, a comprehensive attack detection architecture based on log provenance graphs. Sylph collects system audit logs, transforms them into provenance graphs, and subsequently performs subgraph partitioning. Based on the generated subgraph sequences, we utilize Graph2Vec for full graph embedding, obtaining feature vectors, which are then analyzed for anomaly detection using an autoencoder. The main contributions of this study are as follows:
(1)
We propose Sylph, an unsupervised APT detection system based on provenance graphs, which does not require prior knowledge or labeled training data, thereby demonstrating strong detection capabilities for unknown APTs.
(2)
We employ fine-grained partitioning of provenance graphs, processing them from a temporal perspective by dividing the provenance graph into smaller and more detailed subgraphs. This approach allows for a deeper and more accurate understanding and analysis of system events, while also enhancing the detection efficiency of Sylph.
(3)
We propose a subgraph partitioning method based on time slices and an integrated time forgetting rate. Sylph segments the provenance graph into multiple subgraphs in chronological order, analyzing each subgraph while incorporating a forgetting rate. This approach amplifies anomalous behaviors within the subgraphs, thereby facilitating a more effective detection of APT attacks.

2. Related Work

2.1. APT Detection

One of the conventional approaches is manual rule-writing, i.e., rule-based detection. This method relies on experts describing APT characteristics based on prior knowledge and developing rule-based strategies for known attacks. For example, SLEUTH [1] combines the attacker’s motives and techniques, utilizing a label-based method where any data or code with an unknown label are deemed an untrusted source. Traditional algorithms also include anomaly-based detection methods, which establish a baseline of normal activities and flag behaviors that deviate from this baseline as anomalies. SteamSpot [6], for instance, models the host-level APT detection problem as a clustering-based anomaly detection task in a streaming heterogeneous graph. However, such methods employ conventional graph algorithms that exhibit limited adaptability and struggle to respond quickly to new environments.
Beyond traditional detection methods, algorithms utilizing artificial intelligence (AI) technologies have become a popular research direction. The ProGrapher [3] anomaly detection model, proposed by the Chinese University of Hong Kong, is a learning-based system that detects abnormal activities from system logs using data provenance. Autoencoders have also been widely applied in APT detection. Abdullayeva et al. [7] discussed a method for detecting APTs in cloud environments using autoencoders, with their proposed framework achieving an accuracy of 98.32%.

2.2. Detection Method Based on Provenance Graph

A provenance graph is a graph structure that represents the relationships between system entities, and its standard definition is as follows:
Let the provenance graph be defined as G = <S,O,E,T>, where
  • S represents the set of subjects (processes or threads)—attributes include information such as PID;
  • O represents the set of objects (e.g., files)—attributes include the name and type;
  • E represents the set of system call event types, such as read, etc.;
  • T represents the timestamps, indicating the access times between subjects and objects.
The subjects and objects in a provenance graph are represented as vertices, while event types are represented as edges. At different times, there can be multiple edges between two vertices. If we map the elements of the provenance graph G to a real system, an instance of a provenance graph is illustrated in Figure 1. The figure describes the provenance graph of an attack scenario.
In this scenario, the initial entry point of the attack is the Firefox browser. When Firefox accesses the web server at 129.55.12.167, it is compromised. Once the browser is breached, a malicious program named “dropper” is downloaded and executed. The dropper provides a remote interactive shell that connects to port 443 of the attacker’s machine and subsequently connects to port 4430. Through this connection, various data collection tasks are executed using the cmd.exe program. Tools such as whoami, hostname, and netstat are used as substitutes for these data collection applications. The collected data are written to the file path C:\users\user1\Documents\Thumbs\thumbit\test\thumbs.db. Finally, the gathered intelligence is exfiltrated via git to the remote host at 129.55.12.51:9418.
In 2019, Milajerdi et al.’s research team introduced Poirot [8] at the CCS conference, which detects APT attacks by leveraging Cyber Threat Intelligence (CTI) correlations. Poirot uses audit logs and models threat detection as an inexact Graph Pattern Matching (GPM) problem, where it searches for subgraphs in a large graph that match a specific pattern. The approach also employs similarity measures to align attack behaviors with kernel audit logs. At S&P 2019, the same team proposed Holmes [9], a method that integrates the Kill Chain and ATT&CK frameworks. Furthermore, in EurS&P 2021, they presented Extrator [5], which incorporates external knowledge to enrich the provenance graph’s training sources, thereby enhancing detection capabilities.
Another research team from the University of Illinois at Urbana-Champaign has also made significant contributions to provenance graph-based detection. At NDSS 2020, they introduced UNICORN [10] and ProvDetector [11], followed by RapSheet [12] at S&P 2020, which integrates the ATT&CK framework. UNICORN is a runtime APT detection method based on provenance graphs, designed specifically to capture the characteristics of APTs. It achieves high accuracy and low false positive rates without requiring prior knowledge of the attack. Notably, it is the first APT intrusion detection system capable of runtime analysis for a complete local system. UNICORN’s summary graphs can effectively counter long-term stealthy poisoning attacks. However, the system may generate false positives when normal behaviors change and does not account for heterogeneous behaviors [13].
In summary, prior APT detection approaches face several notable limitations. Rule-based systems such as Sleuth [1,2] depend on predefined signatures and expert knowledge, which hinder their adaptability to unknown or evolving threats. AI-based methods [3,4,7] generally require labeled training data, which are difficult to obtain in real-world APT scenarios. Provenance graph-based techniques represent a promising direction but still face trade-offs. For instance, Poirot [8] and Holmes [9] rely on inexact graph pattern matching and external threat models, making them less effective against novel attack paths. Unicorn [10] and ProvDetector [11] aim to perform real-time detection based on runtime provenance, yet their accuracy may degrade under noisy environments or complex system behaviors. RapSheet [12] introduces tactical provenance analysis with ATT&CK mapping, but it requires detailed action-level annotation and incurs non-trivial overhead in enterprise deployment. In contrast, Sylph is designed to address these challenges by adopting an unsupervised anomaly detection framework, incorporating a time-aware subgraph partitioning strategy, and leveraging semantic and structural graph embeddings. These innovations enhance Sylph’s ability to detect stealthy and unknown APT activities with low overhead and no reliance on prior knowledge or labeled data.

2.3. Graph Embedding Algorithm

Graph embedding is a technique that converts graph data into low-dimensional vectors, mapping complex graph structures into vector space, allowing computers to better understand and analyze these data. Graph embeddings can be applied to various machine learning tasks such as node classification, graph classification, and link prediction.
The Graph2Vec algorithm captures graph-level features by traversing substructures within a graph. In Graph2Vec, each graph is represented as a collection of substructures, where each substructure consists of a set of nodes and edges. The order of nodes and their relative positions within the context influence the representation of the substructures.
Compared to traditional graph feature extraction methods, Graph2Vec is better equipped to handle graph structures of varying scales and forms, and it can capture higher-level semantic information. It is particularly effective for tasks that require classification or comparison of entire graphs, such as in social network analysis or molecular chemistry. In the context of APT detection, where the goal is to assess whether a provenance subgraph exhibits malicious behavior, graph-level representation becomes essential.
Unlike node-centric embedding methods such as DeepWalk [14] and Node2Vec [15], which rely on random walks and are optimized for node-level tasks (e.g., node classification or link prediction), Graph2Vec [16] generates fixed-length vectors for entire graphs by extracting rooted subgraphs and modeling their distribution. This enables it to preserve both local substructures and global topological features, making it more suitable for whole-graph anomaly detection. Based on these embeddings, an autoencoder module is used to compress and reconstruct subgraphs, enabling Sylph to identify outliers indicative of APT activity. Prior work [16,17] has demonstrated that Graph2Vec consistently outperforms node-level embeddings in tasks requiring global graph semantics, which further supports our choice.

3. Sylph Method

This paper presents a system named Sylph, an unsupervised APT detection system based on provenance graphs. The overall architecture of Sylph is illustrated in Figure 2 and comprises four main components: the provenance graph collection module, the subgraph partitioning module, the subgraph embedding module, and the autoencoder detection module. Sylph takes system audit logs as input and outputs subgraphs containing APT attacks along with node information related to the APT attacks.

3.1. Provenance Graph Collection

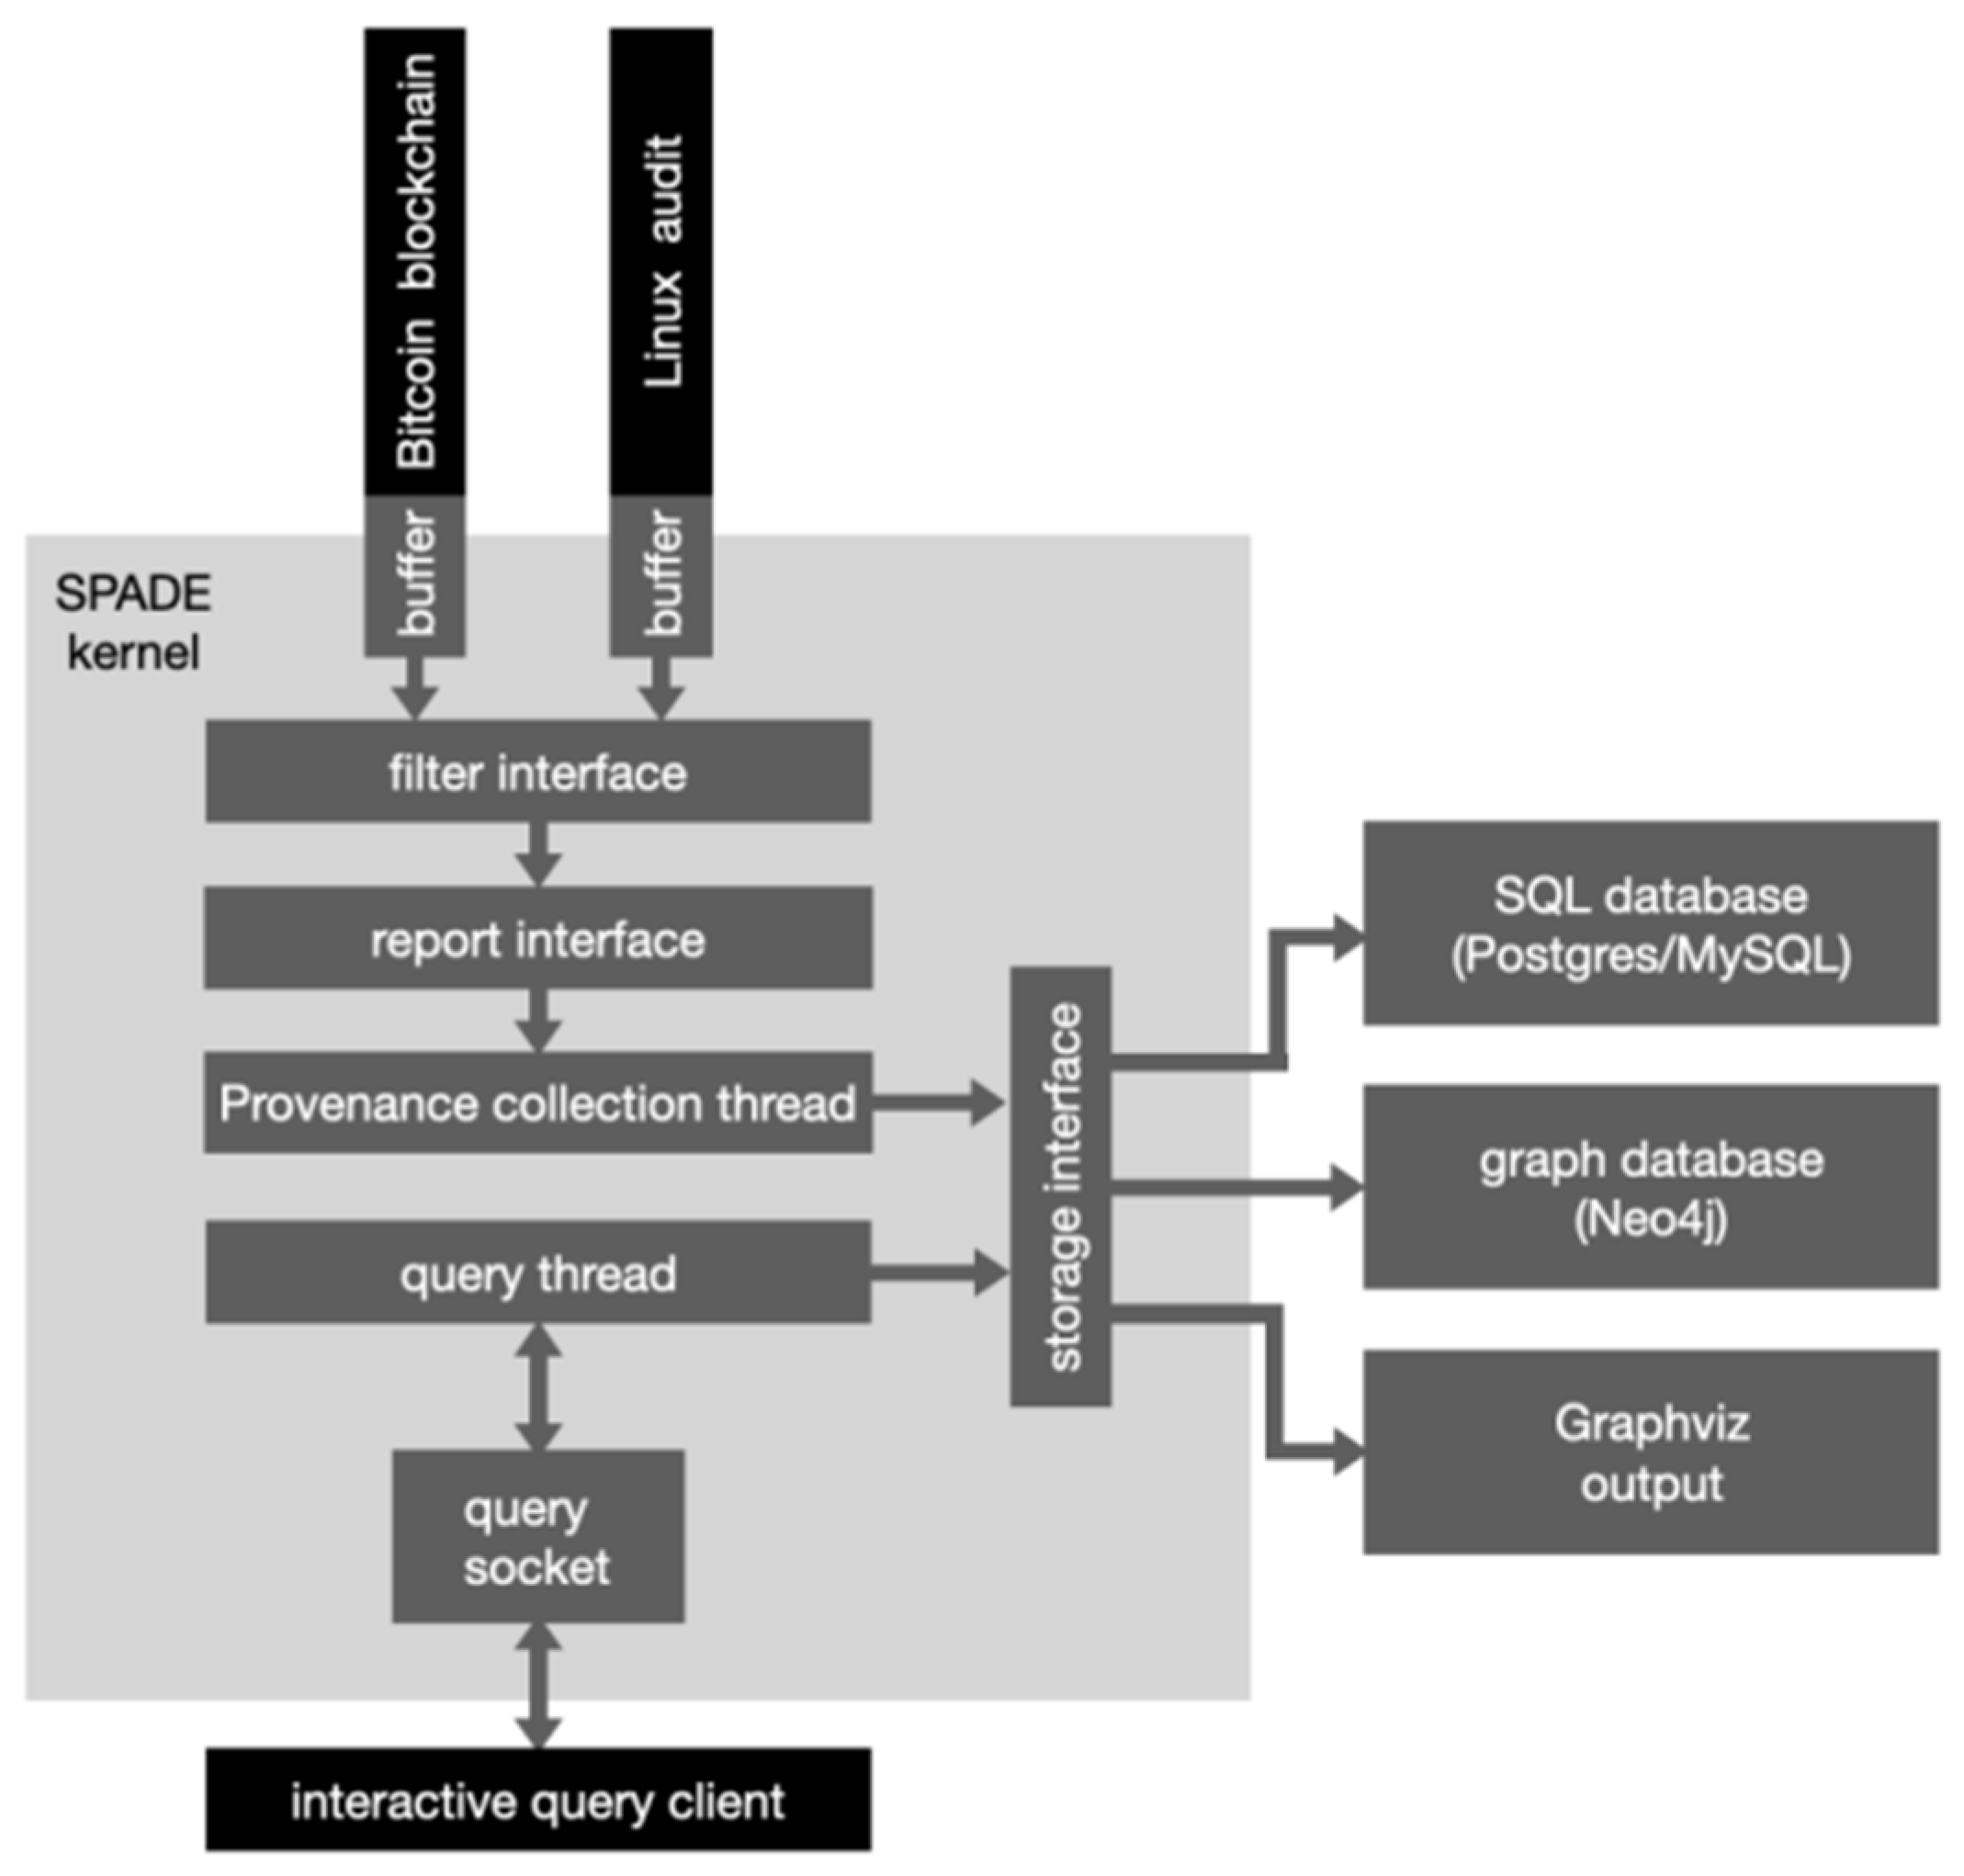
Through our research, we have found that constructing provenance graphs with strong abstract expressive capabilities from system audit log data for causal analysis effectively conveys the causes, attack paths, and impacts of threat events. This, in turn, provides higher detection efficiency and robustness for the discovery and forensic analysis of APT attacks. To extract provenance graph information from system audit logs, we modified SPADE (Security Provenance Analysis of Data Events) to achieve this goal. SPADE is a provenance auditing system that supports distributed environments. The process of generating provenance graphs using SPADE is illustrated in Figure 3 [18]. It begins with system logs, undergoes filtering and provenance algorithms, and ultimately generates the provenance graph, which is stored in a database.
The process of generating provenance graphs based on SPADE is divided into two main phases: reading and storing system logs, and generating and storing the provenance graph. In the phase of reading and storing system logs, we utilize various auditing tools provided by different operating systems. For Linux systems, we implement the Audit tool. The Audit tool can record various events in the system, such as user logins and logouts, file accesses, system calls, network activities, and system startups and shutdowns. It captures various system calls and kernel events by invoking Linux kernel modules, records them, and sends them to the Audit daemon, which then writes these logs to /tmp/audit.log. Additionally, for Windows systems, we use the Process Monitor tool, while for macOS systems, we employ the MacFUSE tool.
In the phase of generating and storing the provenance graph, we first invoke the Reporter module of SPADE to receive and process the event stream from the system audit logs. This module constructs the vertices and edges of the provenance graph by parsing and extracting key information (such as event type, timestamp, and resource identifier). The algorithm’s pseudocode for this process is presented in Algorithm 1.
Algorithm 1 Reporter Module—Provenance Graph Construction
Input: Audit Log auditLog, Buffer internalBuffer, Arguments arguments
Output: Buffer internalBuffer filled with vertices and edges
1: Initialize internalBufer
2: while there are events in auditLog do
3:   Event event ← readEventEromLog(auditLog)          ▷Read when there is an event in the log
4:   Graph graph ← processEvent(event)
5:   for all Vertex verter in graph.get Vertices() do                   ▷Traversing the vertices in a graph
6:     internalBuffer.putVertex(verter)                               ▷Putting vertices into the internal buffer
7:   end for
8:   for all Edge edge in graph.getEdges() do                           ▷Iterate over the edges in the graph
9:     internalBuffer.putEdge(edge)                                         ▷Putting edges into the internal buffer
10:  end for
Then, we customize the Filter module to select, filter, and transform the event streams generated by the Reporter module to match the pre-set rules and conditions. Based on conditions such as event types, attribute constraints, or time windows, the Filter module can filter events that meet specific requirements and generate accurate traceability graph data [19], whose algorithmic pseudo-code is shown in Algorithm 2.
Algorithm 2 Filter Module—time filter
Input: AbstractFilter nextFilter, Vertex vertex, Edge edge, Storage storage
Output: Filtered events based on predefined rules and conditions
1: Initialize filter with arguments
2: while events are coming into filter do                                        ▷When an event enters the filter
3:   if event is a vertex then                                            ▷If it is a vertex, call the putVertex method
4:     Call putVertex method with incoming vertex
5:   else if event is an edge then                                             ▷If it is an edge, call the putEdge method
6:     Call putEdge method with incoming edge
7:   end if
8: end while
9: Send vertices and edges to nextFilter using putInNextFilter method
10: Increment storage.vertexCount and storage.edgeCount
11: Shutdown filter after processing all events     ▷Send vertices and edges down and increase the number of both
Among them, we implement specific filtering rules in the putVertex and putEdge methods, and blocklist some default safe behaviors to reduce the traceability graph size and memory consumption. Some of the Linux blocklists currently set up are shown in Table 1.
Finally, we use the graph database Neo4j for storage to convert Linux Audit records into Provenance Graphs represented as Open Provenance Models, which are generated in real-time in the /tmp/provenance.json file, and store the final results in spade.graph to produce provenance graphs that can be used for subsequent analysis [20].

3.2. Subgraph Partitioning

In large-scale log processing, effectively handling incoming logs is a crucial task. Once the provenance graph is obtained, subgraph partitioning is necessary for subsequent processing. The purposes of subgraph partitioning are as follows:
Load Reduction: By partitioning the larger provenance graph into a series of smaller subgraphs, we can reduce the system’s load, making the processing tasks more efficient.
Control Granularity: Adjusting the granularity of subgraph partitioning allows us to control the number of edges and nodes within each subgraph. This is beneficial for subsequent graph embedding tasks (e.g., Graph2Vec). Fine-tuning the granularity ensures that each subgraph contains an appropriate amount of information, avoiding sparsity or excessive density.
Dataset Balancing: In our system, we employ a fine-grained partitioning strategy. After partitioning, the ratio of benign to malicious nodes in the dataset can be improved. This is helpful for subsequent model training, as a balanced dataset can enhance the accuracy and generalization capabilities of the model.
We use the timestamp attribute of edges for partitioning the provenance graph. The timestamp attribute records the time at which events occur. By using timestamps as a basis for subgraph partitioning, we can localize anomalous events to specific time slots. This allows security analysts to easily identify malicious nodes within the corresponding subgraphs. Specifically, we define two important parameters as follows:
time_slot: Represents the time slot corresponding to the subgraph partitioning. By dividing the provenance graph based on the timestamp attribute, each subgraph corresponds to a distinct time slot.
time_forgot: Represents the time forgetting rate for subgraph partitioning. It characterizes the degree of overlap between adjacent subgraphs. A higher time forgetting rate indicates that there is less redundant information between adjacent subgraphs, while a lower rate suggests more redundancy.
The subgraph partitioning module takes a provenance graph in JSON format ( p g o r i g i n . j s o n ) as input and outputs a sequence of CSV files corresponding to the partitioned subgraphs: { s u b 1 . c s v , s u b 2 . c s v , , s u b n . c s v } , where n is the number of subgraphs after partitioning. The overall approach to subgraph partitioning is as follows:
(a)
The first event is used as the time reference, and the relative time of all events in the provenance graph, denoted as t i m e _ r e l a t i v e s u b , is calculated.
(b)
The number of subgraphs n is determined using Equation (1).
(c)
The corresponding t i m e m i n and t i m e m a x for each subgraph are calculated. Events that satisfy the condition t i m e m i n t i m e _ r e l a t i v e s u b t i m e m a x are written into the corresponding subgraph JSON file. The formulas for calculating t i m e m i n and t i m e m a x are given in Equations (2) and (3).
(d)
After the events are written into subgraph JSON files, they are converted to CSV files for subgraph partitioning, as described in Algorithm 3.
n = t i m e r e l a t i v e l e n t i m e r e l a t i v e 1 t i m e s l o t t i m e f o r g o t + 1
t i m e m i n = i × t i m e f o r g o t
t i m e m a x = t i m e m i n + t i m e s l o t
Algorithm 3 Subgraph Partitioning
Input: Provenance graph in JSON format pgorigin.json, Time slot time_slot and Time forgetting rate time_forgot
Output: A sequence of CSV files for the partitioned subgraphs { s u b 1 . c s v , s u b 2 . c s v , , s u b n . c s v }
1: while pgorigin.json do
2  time relative.append( t i m e _ r e l a t i v e s u b )                  ▷Generate relative time with respect to the first event
3: end while
4: n←{time_relative[len(time_relative)-1]-time_slot}/time_forgot+1
5: for i in range(n) do                           ▷Generate n subgraphs
6:   time_min ← i*time_forgot
7:   time_max ← time_min + time_slot
8:  number_init ← 0
9:   if time_min < t i m e _ r e l a t i v e s u b <time_max then                 ▷Add events to a subgraph
10:    subi.json t i m e _ r e l a t i v e s u b
11:    number init++
12:  end if
13:  if number_init ≠0 then                         ▷Delete a file if it is empty
14:     s u b i .json.close()
15:    os.remoe( s u b i .json)
16:  else:
17:     s u b i .csv ← s u b i .json
18:  end if
19: end for

3.3. Graph Embedding

After obtaining the subgraph sequence, it is necessary to perform full graph embedding, which transforms the high-dimensional graph structure into low-dimensional feature vectors that are easier to understand and process, facilitating subsequent model training. The subgraph embedding process consists of two components: graph structure generation and subgraph embedding. The goal of graph structure generation is to convert the CSV-format graphs, produced during sub-graph partitioning, into a format compatible with the Graph2Vec algorithm. The subgraph embedding component then transforms the directed graphs (which include the graph structure, node attributes, and edge attributes) into low-dimensional feature vectors.
Existing APT detection methods, when embedding provenance graphs, typically focus only on the graph’s structural features and disregard the semantic attributes of nodes and edges (e.g., the start_node_description attribute). These attributes may contain critical information about the APT attack, which often gets lost during graph embedding. The key advantage and innovation of Sylph’s graph embedding algorithm lie in its use of the Graph2Vec algorithm to transform both the semantic attributes of nodes and edges, along with the graph structure, into feature vectors. This preserves semantic information, and by embedding different combinations of semantic attributes (e.g., edge_category + start_node_description + …), Sylph seeks to identify the optimal model for APT detection.

3.3.1. Graph Structure Generation

The graph structure generation component utilizes the NetworkX [21] to create graphs by extracting the structure and features from CSV files, where each row represents an edge. NetworkX is a Python library used for creating, manipulating, and studying complex networks. For the n subgraphs produced by the subgraph partitioning process, this component uses a loop to sequentially read each edge’s start and end node IDs, along with the node and edge attributes. The pseudocode for graph structure generation is shown in Algorithm 4.
Algorithm 4 Graph Structure Generation
Input: Directory path containing OSV files
Output: List of graph objects
1: Initialize an empty list graph
2: for i = 0 to 999 do
3:  Construct CSV file path as csv file
4:   Read data from csv file into dataframe df
5:   Create a new directed graph G
6:   for each row in df do
7:     Extract node and edge attributes from row             ▷Extract features of nodes and edges
8:     Add start node and end node to G with their types as attribute       ▷Add start termination node
9:     Add edge between start node and end node to G with time and type as attributes ▷Add edge
10:  end for
11:  Append G to graphs
12: end for
13: Convert node labels to integers in each graph in graphs
14: return graphs

3.3.2. Subgraph Embedding

Graph embedding in Sylph utilizes the Graph2Vec [16] algorithm for full-graph embedding. It takes a sequence of CSV files representing subgraphs as input and outputs feature vectors corresponding to each subgraph. The overall approach is as follows:
(1)
Graph traversal serialization: The algorithm starts by traversing the input graph and generates traversal sequences of nodes. This sequence records the order of nodes visited during the traversal, akin to a local topological sort. This serialization process resembles performing a depth-first or breadth-first search on the graph.
(2)
Sequence embedding learning: The generated node traversal sequences are treated as sequential data. Graph2Vec employs word embedding models (such as Word2Vec) to learn embeddings of these node sequences. In this step, the node sequences are fed into the Word2Vec model for training, resulting in embedding vectors for each node.
(3)
Graph embedding aggregation: After obtaining embedding vectors for nodes, Graph2Vec utilizes an aggregation function to combine these node vectors into a single vector representation of the entire graph. This aggregation function can be a simple sum, average, or a more complex function.

3.4. AutoEncoder

After completing the subgraph embedding, we utilize an autoencoder [22] for anomaly detection. We implement a symmetrical autoencoder to encode and reconstruct the embedded graph vectors. The encoder consists of three hidden layers with 64, 32, and 16 neurons, respectively, followed by a bottleneck layer of 8 neurons with a linear activation. The decoder mirrors the encoder with hidden layers of 16, 32, and 64 neurons. All hidden layers use the ReLU activation function, and the output layer uses a sigmoid function to ensure bounded reconstruction. To prevent overfitting and accelerate convergence, batch normalization and LeakyReLU are applied after each layer. The autoencoder is trained using the Adam optimizer and a mean squared error (MSE) loss function. We set the batch size to 60 and train the model for 20 epochs. This architecture is lightweight and effective for reconstructing low-dimensional representations of graph embeddings and has been validated in prior studies on network anomaly detection.
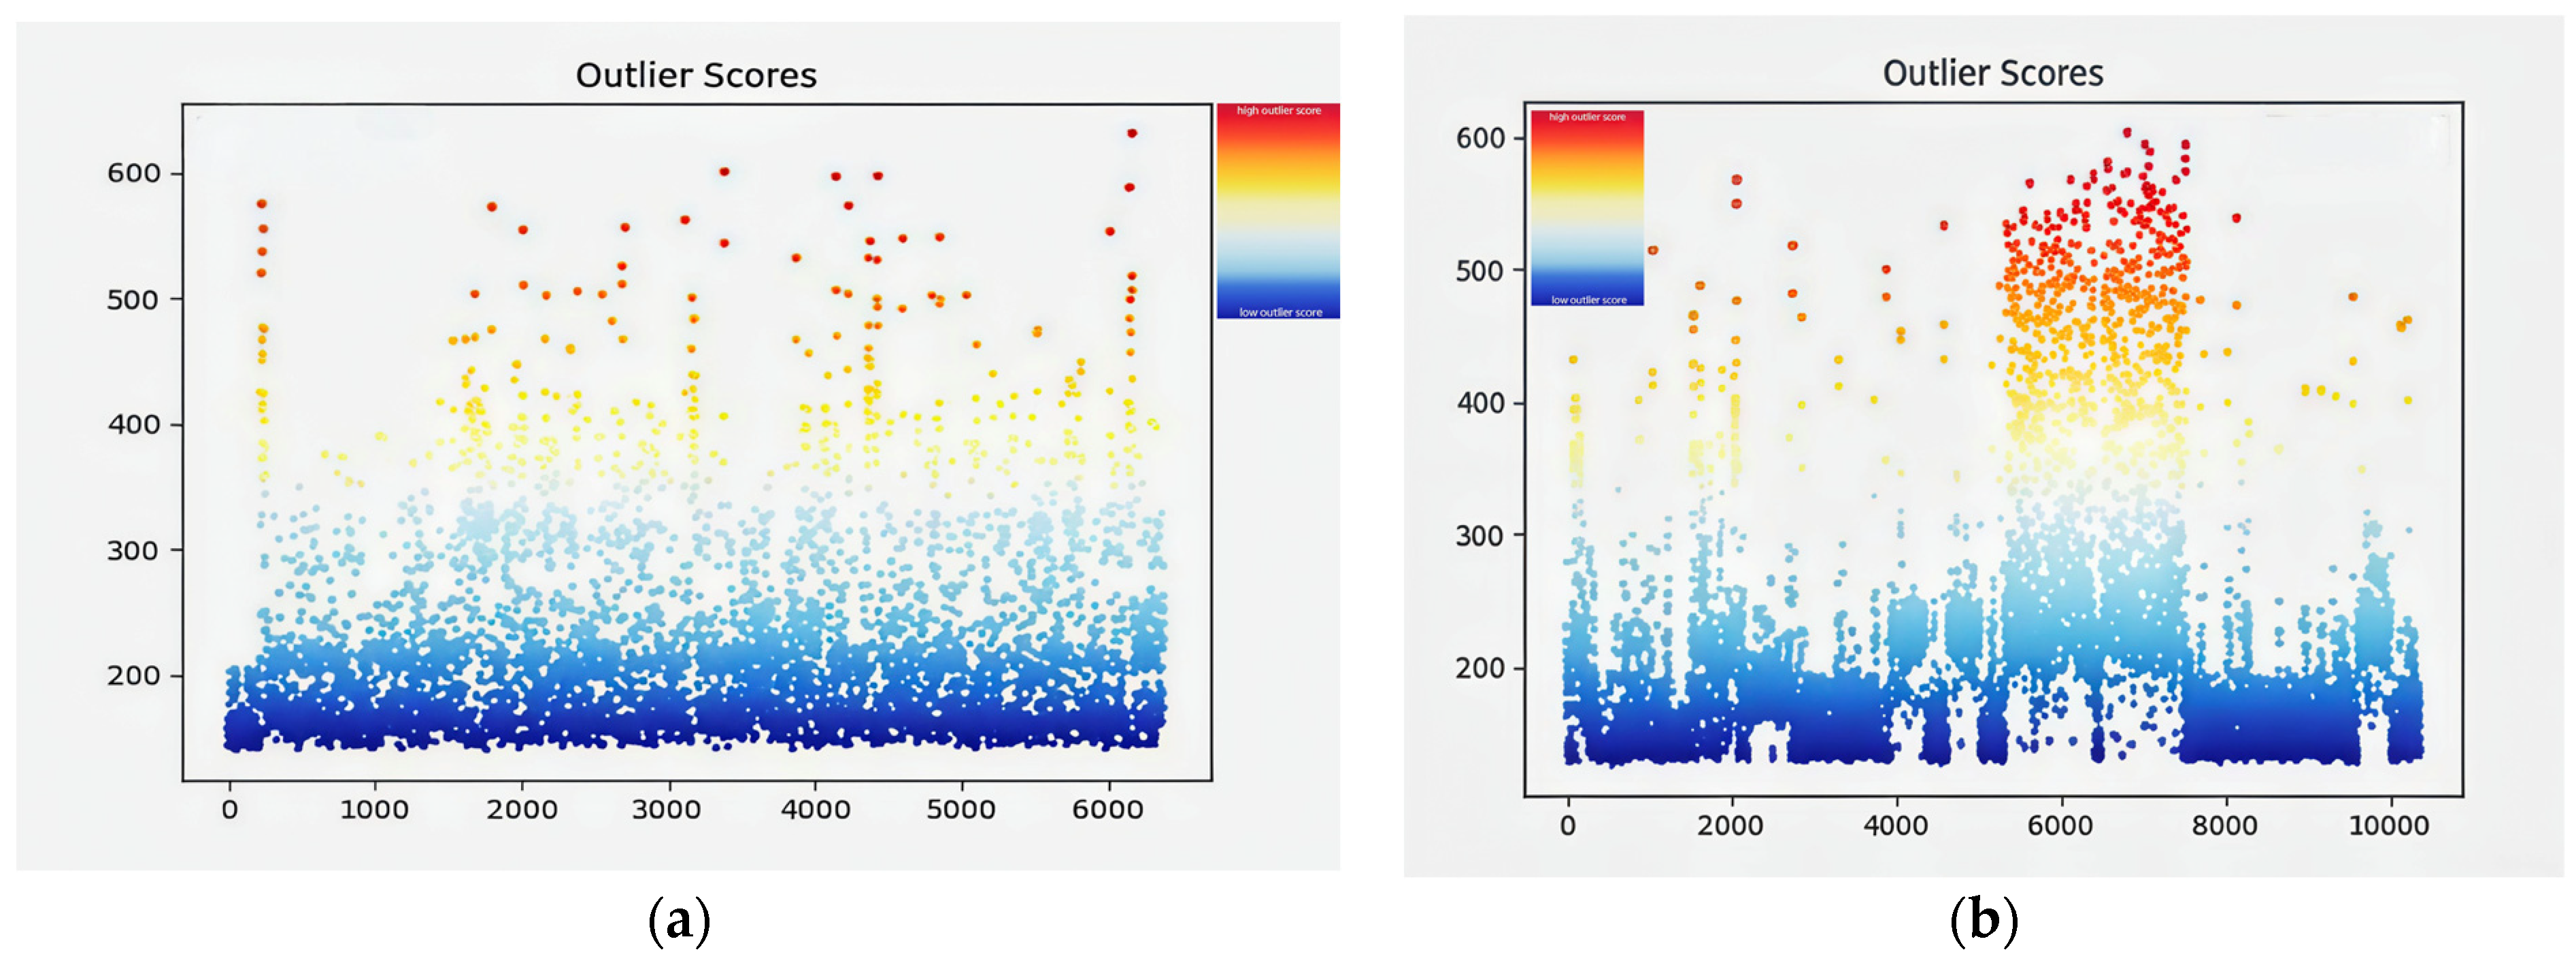
The autoencoder encodes the subgraph embedding vectors, and the loss value is defined as the outlier score, which represents the root mean square error between the encoded and original data: R M S E X , Y = i = 1 n x i y i 2 n , where X is the original vector before encoding, and Y is the vector after encoding. The outlier score quantifies how much a subgraph deviates from the subgraphs within the training data. In benign provenance graphs, the outlier score for subgraphs should result in discrete, sparsely distributed outliers, with very few in number. However, in the case of malicious provenance graphs, the outliers should be numerous and continuously distributed. By detecting the number of outliers exceeding a certain threshold, we can determine whether a provenance graph contains APT attacks.
To capture such clustering information, we define an APT Attack Suspected Indicator (ASI), whose calculation is presented in Formula 4. ASI serves as the basis for determining whether the entire provenance graph is suspected of being attacked by APTs. The intuition behind this design is as follows: each subgraph may contain a portion of an attack sequence, and even weak or subtle anomalies—if distributed consistently—can indicate malicious behavior at a higher level.
The ASI thus integrates all subgraph anomaly scores using a softmax-like weighted sum, where higher outlier values contribute more strongly to the final score. This formulation ensures that both the intensity and density of anomalies are considered, providing a normalized, interpretable indicator ranging from 0 to 1.
A S I = 1 1 + exp N N t o t a l ε δ
where N is the number of outliers exceeding the outlier score threshold λ, N t o t a l is the total number of subgraphs, ε is the predefined anomaly threshold, and δ is the sensitivity parameter. The ASI value ranges between 0 and 1, with higher values indicating a greater likelihood of an APT attack.
We first collect benign log data from a server operating without APT attacks for three days, generating a benign provenance graph that was subsequently divided into 48,841 subgraphs for graph embedding and autoencoder training. After the model is trained, we test both the benign provenance graph and two malicious provenance graphs from the StreamSpot dataset [23]. The detection results are shown in Figure 4. The results indicate that no clustered anomalies are found in the benign provenance graph, whereas the malicious provenance graphs exhibit distinct clusters of anomalous results.
The next step involves determining the value of λ in the ASI formula and establishing the ASI threshold for identifying an APT attack. First, we analyze the distribution of outlier scores in the subgraphs of the benign provenance graph used to train the model, as shown in Table 2. Then, we calculate the average distribution of outlier scores in the subgraphs of 30 malicious provenance graphs, as shown in Table 2.
From Table 2, it can be observed that the number of subgraphs with outlier scores above 400 significantly increases in malicious provenance graphs compared to benign ones. This allows us to preliminarily narrow the range of λ between 400 and 600. Next, we assume different λ values and again count the number of subgraphs in the same benign and malicious provenance graphs with outlier scores above the chosen λ value. The results are shown in Table 3.
From Table 3, we observe that as λ increases, the distribution of subgraphs’ outlier scores in both benign and malicious provenance graphs decreases. The chosen λ should meet two criteria: (1) there must be a significant difference in the average subgraph ratio between benign and malicious provenance graphs, and (2) the variance in the number of subgraphs in malicious provenance graphs should be small (to increase detection adaptability). After further narrowing down the range, we ultimately determine that λ = 506, meaning that points with outlier scores greater than 506 are considered abnormal. The parameters ε and δ are used to control the range of ASI values for benign and malicious provenance graphs. To ensure that the ASI of benign provenance graphs approaches 0 and that of malicious provenance graphs approaches 1, we set ε = 0.005 and δ = 0.001.
With λ determined, we can calculate the ASI values for both benign and malicious provenance graphs, as shown in Table 4.
From the table, we can observe a significant difference between the ASI values of benign and malicious provenance graphs. To ensure that benign and malicious provenance graphs are not misclassified, we set the ASI threshold for determining whether a provenance graph contains an APT attack to the average value between the maximum ASI of benign graphs (0.12) and the minimum ASI of malicious graphs (0.99), which is 0.55. Therefore, when the ASI of a provenance graph exceeds 0.55, we determine that it contains an APT attack.

4. Experiment and Analysis

4.1. The Dataset

It is important to note that applying Sylph directly to real-world APT data presents substantial challenges. APT attacks are highly covert, long-term, and targeted, often launched by well-resourced adversaries. As such, real-world APT traces are extremely difficult to obtain, and even when available, they are rarely labeled or released due to legal, privacy, and security constraints. Moreover, the absence of ground-truth labels in real environments makes it challenging to evaluate detection performance objectively. Therefore, we adopt publicly available datasets and construct simulated attack scenarios in controlled environments to ensure accurate labeling, reproducibility, and sufficient diversity for performance evaluation.
Our datasets are carefully constructed to simulate realistic, diverse environments. The public datasets (e.g., StreamSpot and Unicorn) emulate various benign and malicious behaviors in different operational contexts, while our custom campus network dataset covers multiple host platforms (Linux and Windows), includes a wide range of user activities, and simulates advanced attack techniques using tools such as Metasploit, Ares, and Byob across different CVE vulnerabilities. Although these datasets are generated in controlled environments, they are designed to reflect heterogeneous and dynamic characteristics commonly found in real-world scenarios, thereby providing meaningful insight into Sylph’s practical applicability.
The datasets used for testing in this paper are three public datasets and one dataset from the lab’s own network. The three public datasets are StreamSpot, Unicorn SC-1, and Unicorn SC-2, which are summarized in Table 5. The dataset from the lab’s own network is summarized in Table 6.
StreamSpot [23] is a publicly available dataset collected by the StreamSpot detection tool itself. It consists of 600 provenance graphs from five benign scenarios and one attack scenario. Each scenario is run 100 times, generating 100 graphs using system logs recorded from a Linux system. The benign scenarios involve different benign activities: checking Gmail, browsing CNN.com, downloading files, watching YouTube, and playing video games, while the attack scenario includes a drive-by download attack.
The Unicorn dataset [10] was generated in a lab environment modeled after a typical network kill chain. Each graph captured by CamFlow contains the entire system logs of a host running for three days. Both the benign and attack graphs contain background benign activities.
The custom-built network dataset is generated from simulated APT attack environments on both Windows 10 and Linux hosts, with SPADE used to collect logs and generate provenance graphs. For malicious samples, we employed various C&C tools (e.g., Metasploit, Ares, Byob) to exploit different CVE vulnerabilities (e.g., MongoDB database, Flask framework, SSI), simulating multiple APT attack scenarios. For benign samples, six types of activities were carried out, including downloading files, watching online videos, live streaming, coding, listening to music, and writing Word documents. Additionally, in multiple scenarios, we obfuscated the payloads of the tools to evade defenses such as antivirus software or intrusion detection systems. In all datasets, the number of edges was determined based on the total number of logs, and the number of nodes was calculated based on the count of unique entities within all the logs.
Furthermore, considering the inherent imbalance in the distribution of benign and malicious events in APT detection scenarios, we adopted a design that indirectly mitigates this issue at both the dataset and model processing levels. During dataset construction, we selected and synthesized sufficient malicious activity instances to ensure that each dataset contains distinguishable abnormal behaviors. At the model level, our subgraph partitioning strategy—based on time slicing and the time forgetting rate—allows malicious behavior to appear in multiple overlapping subgraphs, effectively increasing the density of abnormal data in the input sequence. Although this approach does not fall under classical supervised data balancing techniques, it serves as a practical solution for enhancing anomaly visibility in an unsupervised context without altering the natural distribution of the original data.

4.2. Experimental Evaluation

4.2.1. Impact of Time Forgetting Rate and Semantic Features on Detection Accuracy

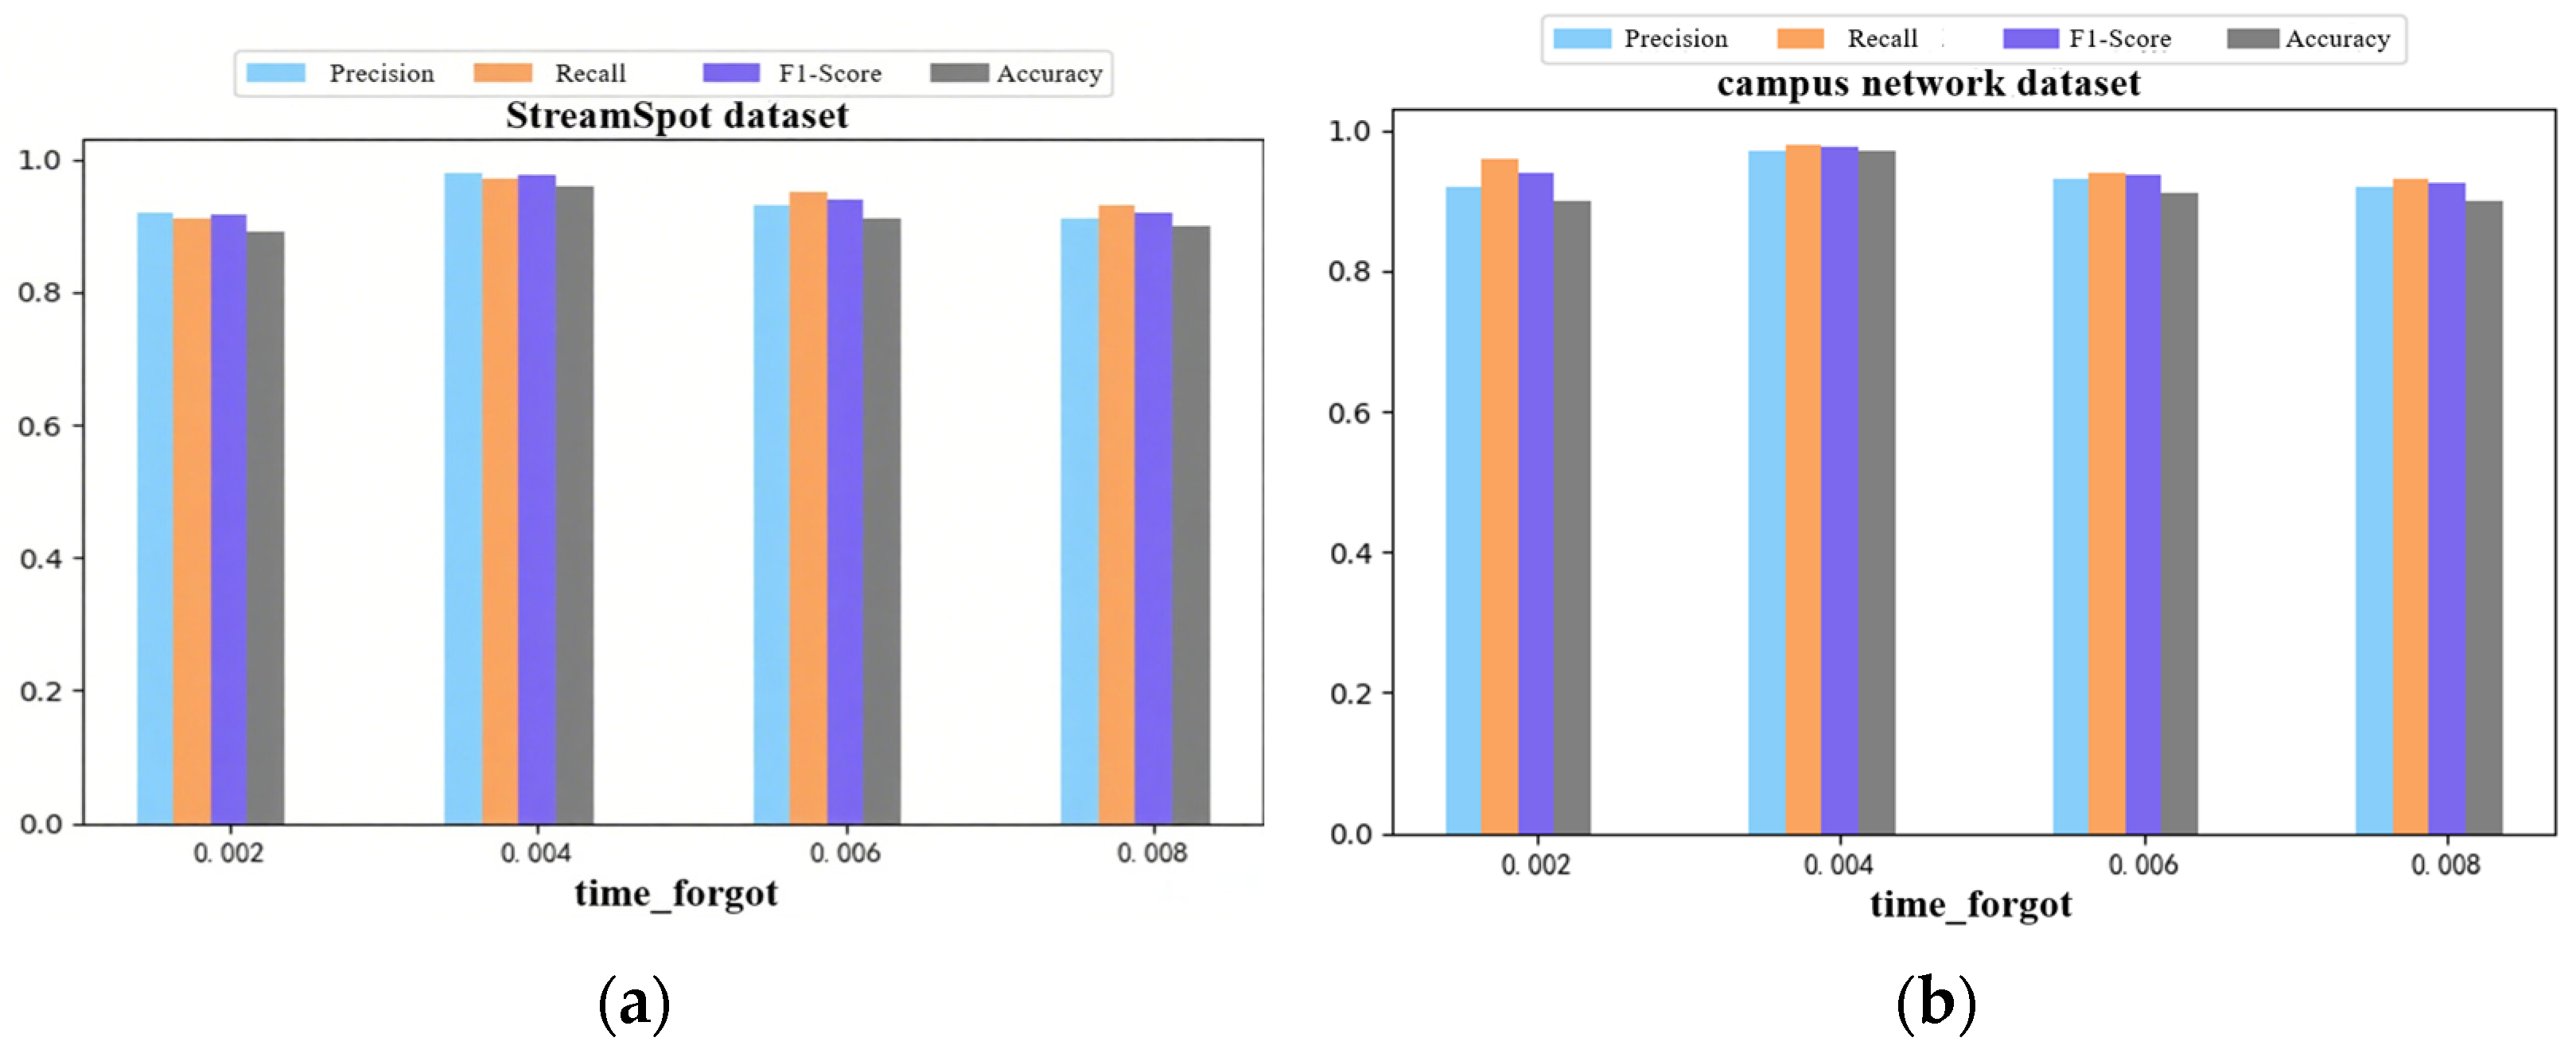
The time forgetting rate (time_forgot) is a key parameter in subgraph partitioning that reflects the degree of overlap between adjacent subgraphs. We set the semantic features to node = (start_node_type, end_node_type) and edge = (edge_time, edge_type), keeping other conditions constant. Tests were conducted on both the StreamSpot dataset and the campus network dataset to evaluate Sylph’s performance under different time forgetting rates, measuring precision, recall, accuracy, and F1-score. The results for the StreamSpot dataset are shown in Figure 5a, while those for the campus network dataset are presented in Figure 5b.
The results indicate that when the time forgetting rate is set to 0.004, Sylph achieves the highest precision, recall, F1-score, and accuracy on both datasets, suggesting optimal performance. A lower time forgetting rate causes adjacent subgraphs to be more similar, blurring temporal patterns and resulting in suboptimal detection. Conversely, a higher time-to-forget rate leads to the loss of valuable contextual information, also negatively impacting the model’s performance.
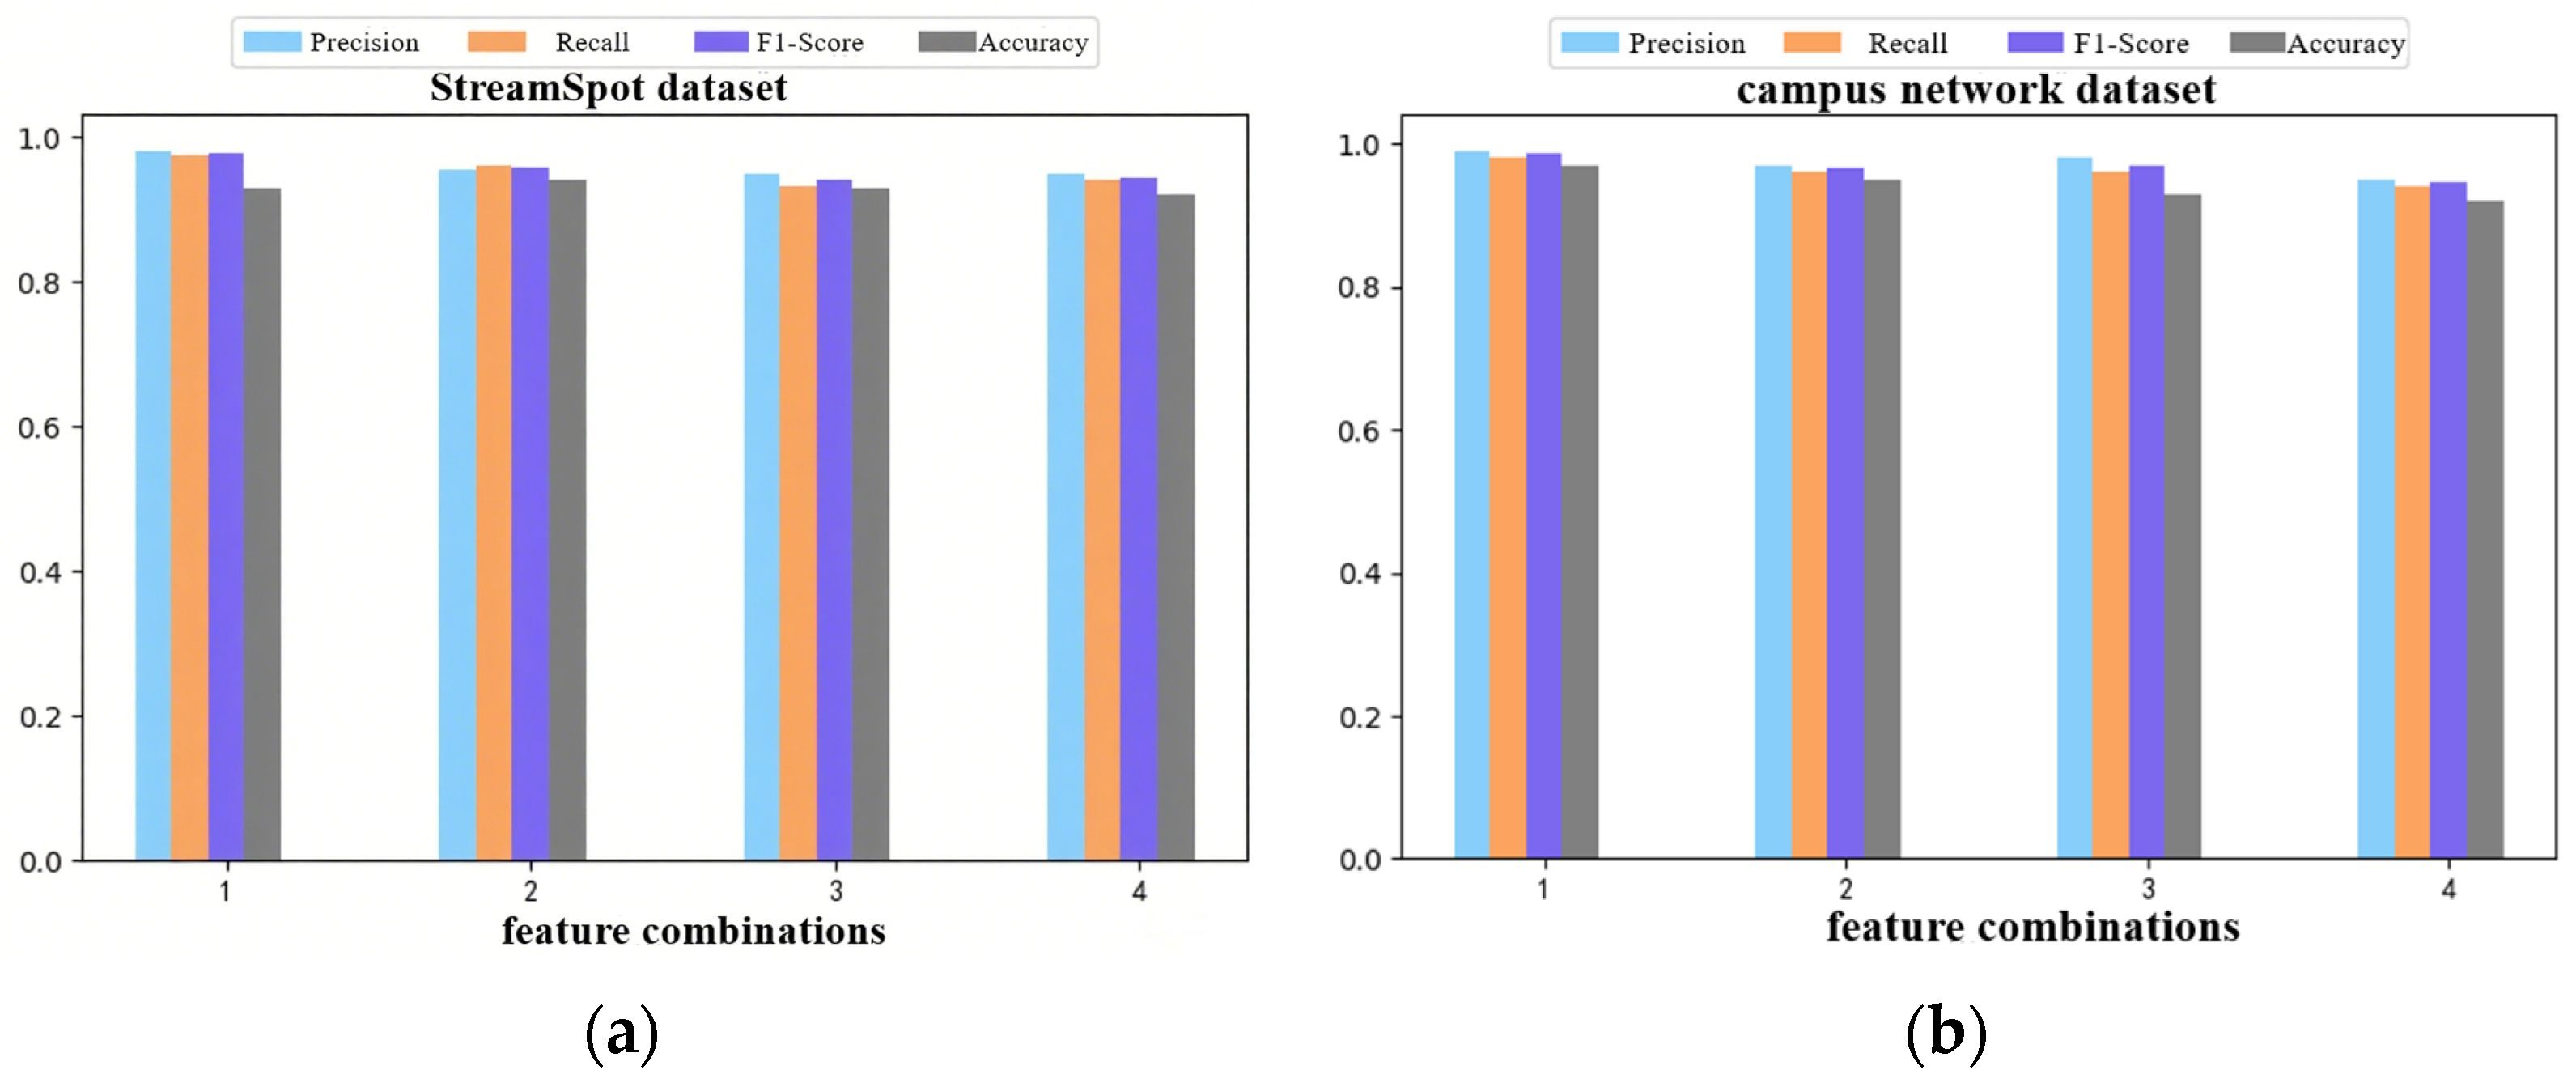
Similarly to the time forgetting rate, we conducted experiments on semantic features. With the time-to-forget rate set at 0.004 and all other conditions held constant, we tested various combinations of semantic features on the StreamSpot and campus network datasets. The evaluation metrics included Precision, Recall, F-score, and Accuracy for Sylph. Given the numerous graph embedding features, the number of possible feature combinations was extensive. Here, we present the metrics corresponding to the four best-performing feature combinations, as shown in Table 7.
The results for the StreamSpot dataset are shown in Figure 6a, while those for the campus network dataset are presented in Figure 6b. The findings indicate that the best performance was achieved with Combination 1, where the node features are set as node = (start_node_type,end_node_type) and the edge features as edge = (edge_time.edge_type). Analysis reveals that these features encapsulate the most critical attributes of APT attacks, such as process names. Conversely, introducing additional features tended to dilute the model’s effectiveness by including irrelevant attributes, which led to a decrease in performance. This underscores the significance of carefully selecting features to enhance detection accuracy in the Sylph model.

4.2.2. Impact of System Parameters (ε, δ, ASI Threshold) on Sylph Detection Accuracy

This section of the experiment is aimed at evaluating the system parameters. The parameter ε represents the anomaly threshold, reflecting the judgment criterion for N / N t o t a l , where events are considered anomalous if they exceed the specified threshold. The parameter δ is the sensitivity, which controls the shape of the ASI curve. We conduct tests on the first three benign datasets and the last three malicious datasets fromthe campus network dataset to adjust the value of ε, while keeping the sensitivity δ fixed at 0.001. The results of the ASI for these datasets are shown in Table 8.
Based on the experimental results, it is found that both ε = 0.005 and ε = 0.006 are effective in completing the detection task. However, setting the threshold either too high or too low led to unsatisfactory outcomes. A threshold that is too low may result in false positives, while a threshold that is too high could cause the system to miss anomalies. Therefore, we select ε = 0.005 as the optimal anomaly threshold.
The influence of sensitivity δ on the ASI curve is demonstrated as follows. Under the condition where ε = 0.005, we test various N / N t o t a l values to assess their effect. In our actual experiments, we conduct tests on the first three benign datasets and the last three malicious datasets from the campus network dataset, and plots of the ASI curve within this range. The resulting shape of the ASI curve is shown in Figure 7. In addition to the visual representation of the ASI curve, we measured the corresponding ASI values, which are presented in Table 9.
In fact, when the ASI threshold is set to 0.55, the sensitivity δ does not significantly impact the final detection results. The role of sensitivity is mainly to determine whether the ASI values around the anomaly threshold provide a stronger reference value. Therefore, based on the comprehensive analysis, we select ε = 0.005 and δ = 0.001, and an ASI anomaly threshold of 0.55 for the subsequent experiments. This configuration ensures that the system can effectively detect anomalies while maintaining a balance between sensitivity and accuracy in distinguishing benign and malicious provenance graphs.

4.2.3. Sylph vs. Other APT Detection Methods

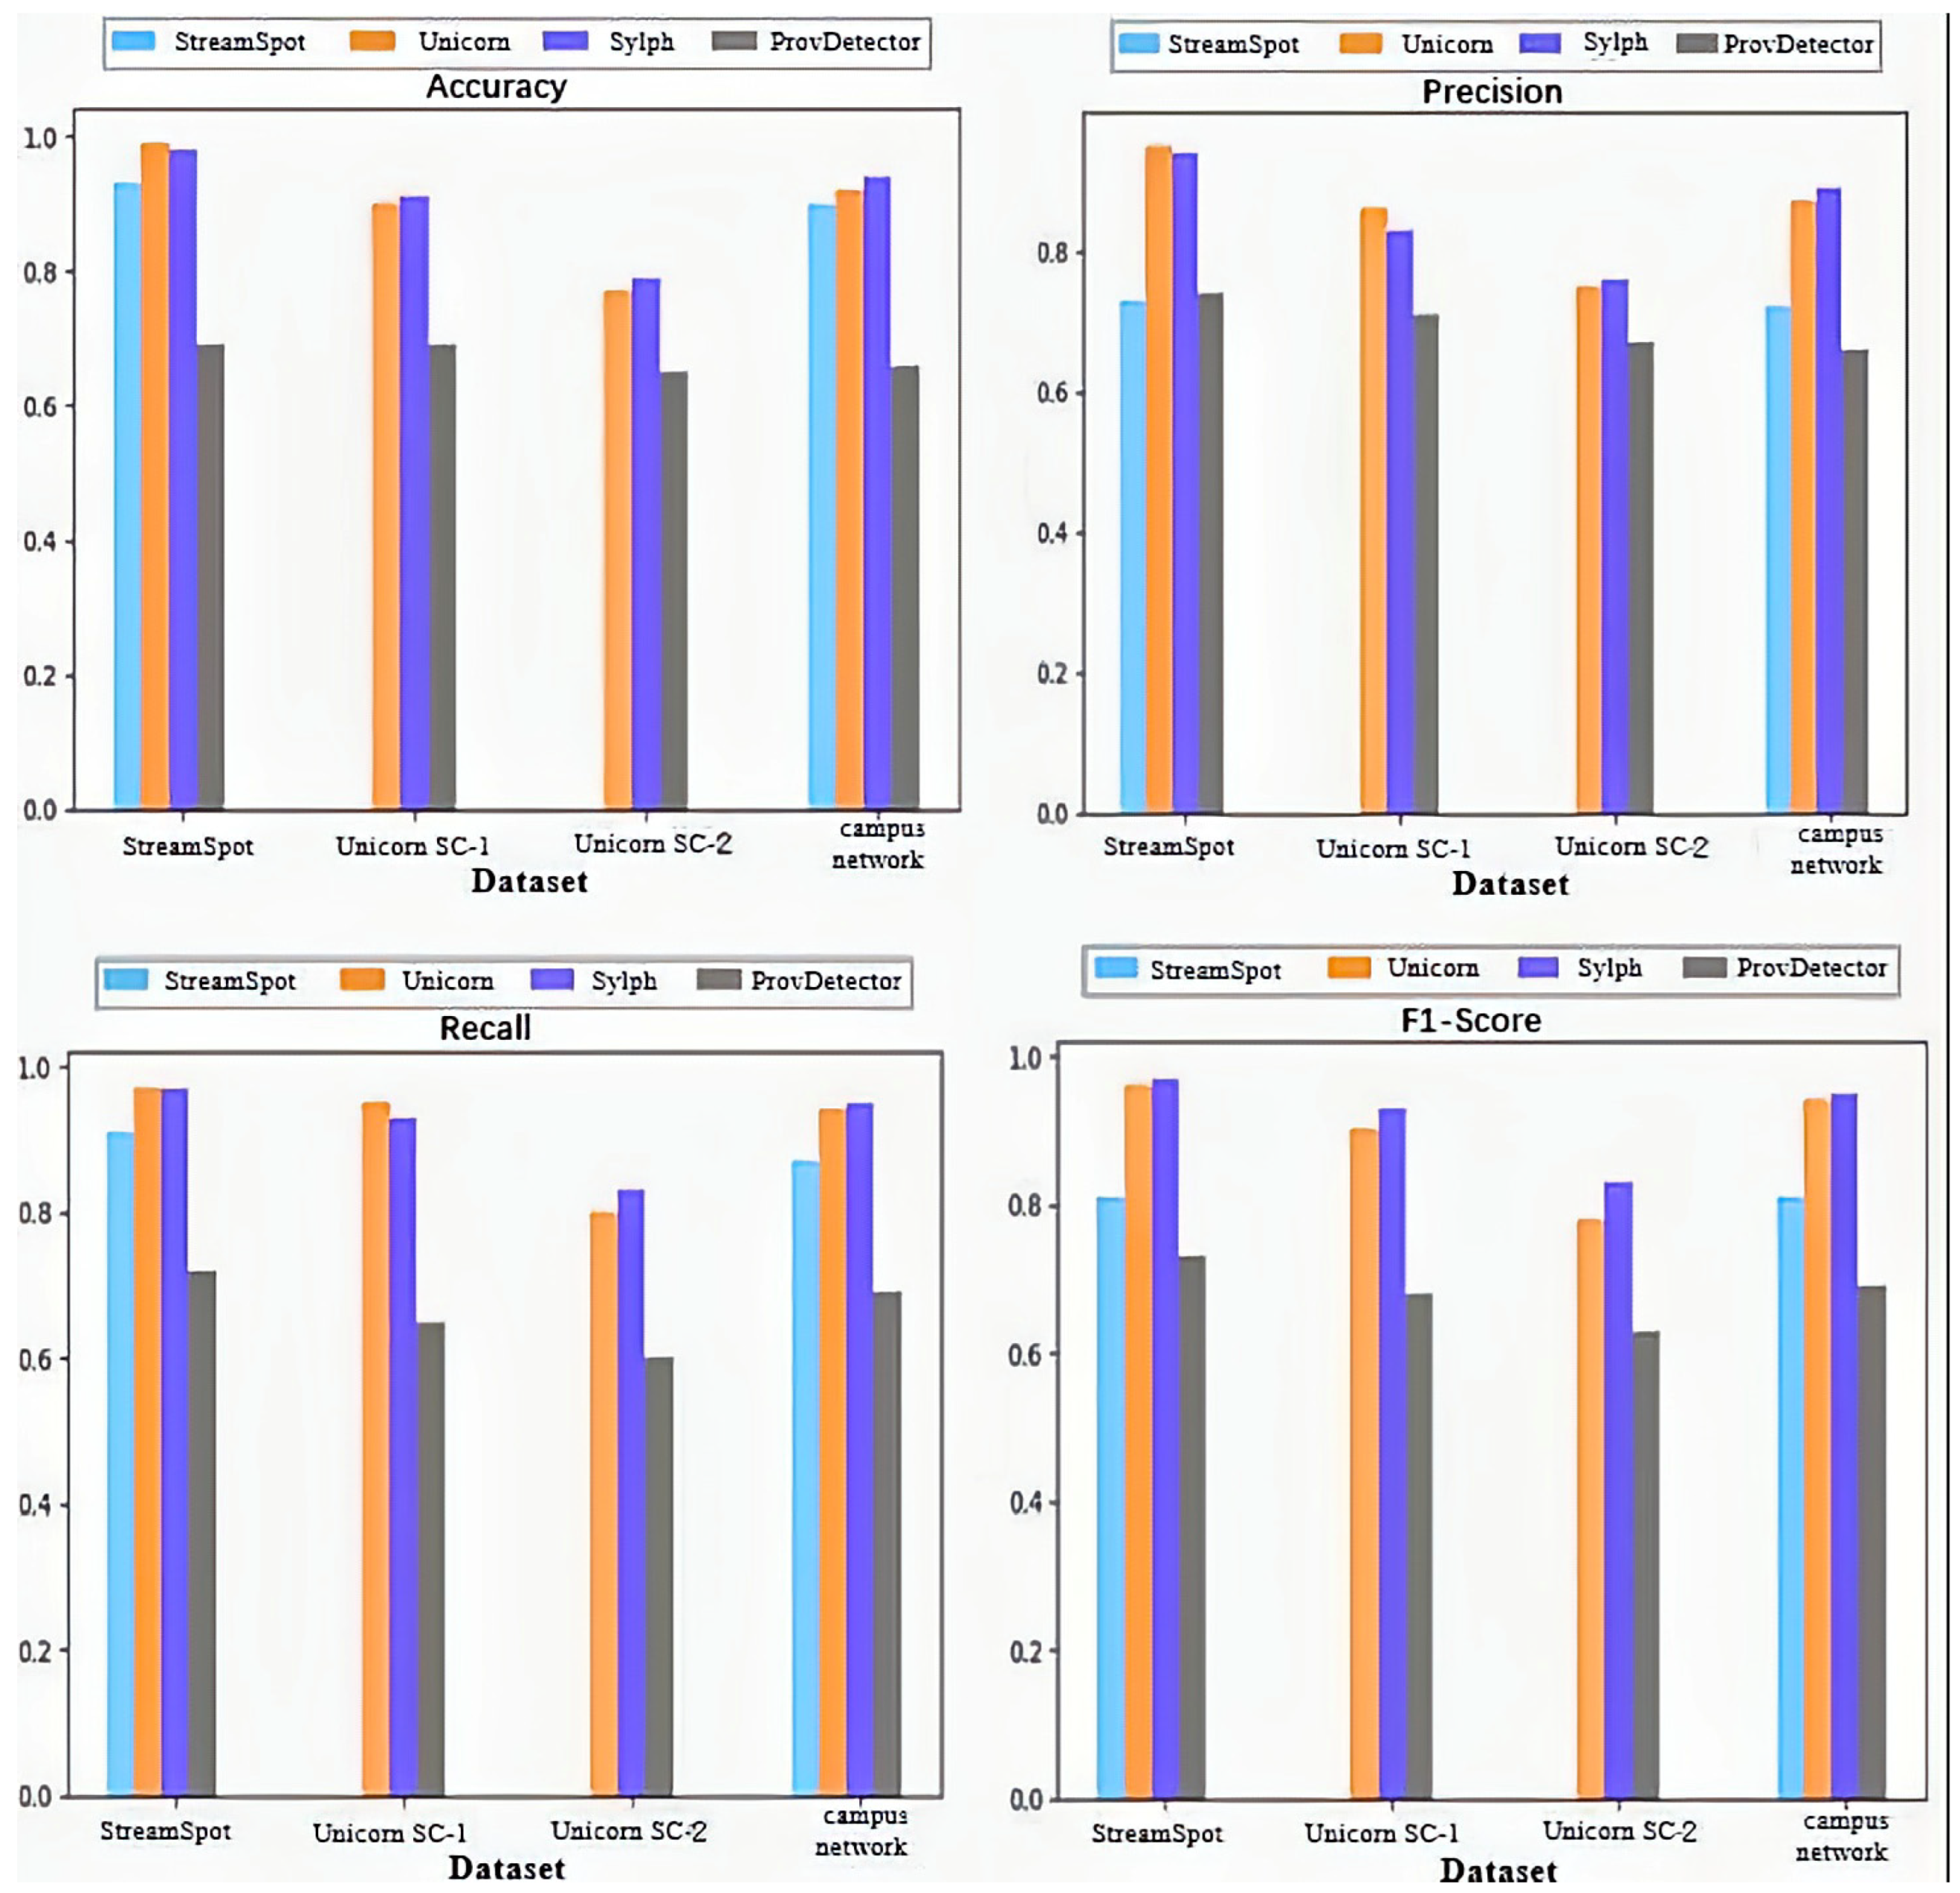
We test the accuracy and precision of four detection methods across four datasets, with the results shown in Figure 8. From the figure, it is evident that Sylph performs well on all four datasets, achieving accuracy rates of 0.98, 0.91, 0.79, and 0.94. The reasons for this performance, analyzed in conjunction with the datasets, are as follows:
  • StreamSpot Dataset: As shown in Table 5, the average number of nodes between malicious and benign samples is quite similar; however, the average number of edges in the malicious provenance graphs is significantly lower. This structural difference between malicious and benign provenance graphs is notable. Except for ProvDetector, all detection tools show good results. Sylph is able to embed the semantic attributes of malicious provenance graphs into its model, achieving detection performance similar to Unicorn. However, while Unicorn analyzes the entire provenance graph—which incurs high computational overhead—Sylph efficiently partitions the graph into subgraphs.
  • Unicorn Dataset: In this dataset, attackers possess prior knowledge of the system, resulting in more stealthy behaviors compared to other datasets. In most attack graphs, the number of malicious nodes in the Unicorn dataset is fewer than ten, and the number of nodes and edges is similar to that of benign graphs. Sylph addresses this by utilizing time forgetting rates to partition the provenance graph into subgraphs, increasing the number of subgraphs that contain malicious nodes and thereby balancing the dataset, which leads to effective detection. Additionally, StreamSpot struggles with provenance graphs that contain too many edges, making it ineffective for the Unicorn dataset. In contrast, Sylph divides the provenance graph into smaller subgraphs, ensuring that even with many edges, the increase in detection time remains linear.
  • Campus Network Dataset: The number of nodes and edges in the benign and malicious provenance graphs lies between those of the StreamSpot and Unicorn datasets. Since we introduced attacks that were not encountered in StreamSpot and Unicorn, the detection performance of those methods was lower. However, Sylph’s capability to detect previously unknown APT attacks resulted in the best detection outcomes in this case.
To further evaluate the performance of Sylph, we calculated its False Positive Rate (FPR) across four datasets and compared it with three state-of-the-art APT detection systems: StreamSpot, Unicorn, and ProvDetector. The results are summarized in Table 10.
As shown in the table, Sylph achieves consistently low FPRs across most datasets. In particular, it achieves a 0.44% FPR on the StreamSpot dataset, which is comparable to Unicorn (0.24%) and significantly lower than StreamSpot’s own baseline (6.92%) and ProvDetector (4.92%). On the Unicorn SC-2 and Campus Network datasets, Sylph also shows improved performance with FPRs of 4.67% and 8.47%, respectively—lower than Unicorn’s 16.65% and 10.88%, and considerably better than ProvDetector’s 6.75% and 57.88%. These results demonstrate that Sylph not only maintains high detection accuracy but also effectively reduces false alarms, making it a more practical and analyst-friendly solution for real-world APT detection scenarios.

4.2.4. Sylph Efficiency Analysis

The time required for our method to process each network event is a critical metric for evaluating efficiency. Processing speed determines the number of events handled within a given timeframe and directly impacts detection sensitivity. During system operation, resource usage remains negligible when idle, but significant resource consumption occurs during model training.
We conduct tests on a server with the following specifications: Intel(R) Xeon(R) CPU E5-2670 v3 @ 2.30GHz, 16 cores, 32 threads; total memory capacity of 64 GB, DDR4 type, 2133 MHz frequency, with 4 memory channels. We test four different sizes of provenance graphs, performing multiple identical detections for each graph, with average detection times recorded in Table 11. The results indicate that as the size of the system logs increases, the processing time correspondingly increases. This is due to the system needing to handle a larger volume of data, which extends the model training time.
To address this issue, Sylph controls the graph sampling time, ensuring that each provenance graph does not exceed 300 MB in size. This approach allows Sylph to respond to APT attacks in a timely manner while maintaining efficiency.
Additionally, to further assess Sylph’s scalability in large-scale environments, we measured CPU utilization and memory consumption during detection. As listed in Table 11, Sylph exhibits low system overhead across all graph sizes. Specifically, even when processing graphs over 400 MB, CPU usage remains below 25%, and memory consumption does not exceed 400 MB. These results demonstrate that Sylph can efficiently operate in real-world deployment settings with constrained computational resources.

5. Discussion

The experimental results in Section 4 demonstrate that Sylph achieves superior detection performance across multiple metrics. Compared to StreamSpot, ProvDetector, and Unicorn, Sylph consistently outperforms in accuracy, precision, recall, F1-score, and FPR on almost all datasets. These results validate the effectiveness of Sylph’s semantic-aware embedding and time-sensitive subgraph partitioning strategy. Moreover, efficiency analysis shows that Sylph maintains high detection throughput with manageable resource consumption, making it practical for deployment.
Beyond quantitative metrics, Sylph offers several qualitative advantages. Unlike ProvDetector and Unicorn, which require labeled training data or manual rule configuration, Sylph operates in a fully unsupervised manner and does not rely on prior knowledge of attack patterns. This reduces deployment overhead and enhances adaptability in unknown or evolving threat environments.
More importantly, Sylph captures attack features that are often missed by ProvDetector. ProvDetector primarily identifies deviations in short-term system behavior based on runtime provenance graph structures. However, many APT attacks manifest as low-frequency, stealthy actions spread across long time windows and multiple processes. For example, lateral movement and delayed privilege escalation often appear benign when viewed in isolation but become suspicious when analyzed in temporal context. Sylph addresses this by incorporating time-aware subgraph slicing and semantic graph embedding, allowing it to reconstruct the behavioral chain across time and detect weak but persistent indicators of compromise. This makes Sylph particularly effective at recognizing multi-stage APT campaigns that evade local anomaly scoring.
Sylph’s fine-grained detection approach also has practical implications in real-world forensic analysis. By slicing system behavior into semantically meaningful subgraphs, Sylph enables security analysts to focus their investigation on specific time windows or behavior patterns, thereby narrowing the scope of manual inspection and reducing analysis workload. Each detected anomalous subgraph can be interpreted as a self-contained behavioral unit, aiding in attack chain reconstruction and threat attribution.
However, real-world deployments may involve challenges not fully captured in our test environment. For instance, encrypted network traffic and process obfuscation techniques may hide critical activity or distort provenance traces, potentially reducing detection accuracy. Additionally, noise in large-scale systems and incomplete logging may affect the completeness of the generated graphs. In future work, we plan to incorporate host-level signals, lightweight behavior tracing, and contextual enrichment to enhance Sylph’s resilience in noisy and adversarial settings. We also aim to explore adaptive slicing mechanisms and incremental learning to improve scalability and robustness over time.

6. Conclusions

We propose Sylph, a lightweight unsupervised APT detection method based on provenance graphs. By employing unsupervised learning, the system can automatically learn and identify threat patterns and anomalous behaviors. The fine-grained partitioning enhances the system’s detection accuracy and efficiency, enabling a deeper and more precise understanding and analysis of network events. The time-based subgraph partitioning allows the system to observe the temporal evolution of network events, providing insights into the dynamics of threat development and facilitating real-time or near-real-time threat detection. Experimental evaluations demonstrate that Sylph exhibits high accuracy and reliability.

Author Contributions

Conceptualization, K.J.; methodology, K.J. and Z.G.; software, K.J., S.Z. and Z.G.; validation, Z.G.; formal analysis, S.Z. and Z.G.; investigation, K.J.; resources, F.Z.; data curation, S.Z. and Z.G.; writing—original draft preparation, K.J.; writing—reviewing and editing, Z.G.; visualization, S.Z. and Z.G.; supervision, F.Z. and K.J.; project administration, F.Z.; funding acquisition, F.Z. All authors have read and agreed to the published version of the manuscript.

Funding

This research was funded by the National Key Research and Development Program of China (No. 2020YFB1807500).

Institutional Review Board Statement

Not applicable.

Informed Consent Statement

Not applicable.

Data Availability Statement

The data presented in this study are available on request from the corresponding author.

Conflicts of Interest

The authors declare no conflict of interest.

References

  1. Ashraf, M.W.A.; Singh, A.R.; Pandian, A.; Rathore, R.S.; Bajaj, M.; Zaitsev, I. A hybrid approach using support vector machine rule-based system: Detecting cyber threats in internet of things. Sci. Rep. 2024, 14, 27058. [Google Scholar] [CrossRef] [PubMed]
  2. Hossain, M.N.; Sheikhi, S.; Sekar, R. Combating dependence explosion in forensic analysis using alternative tag propagation semantics. In Proceedings of the 2020 IEEE Symposium on Security and Privacy (SP), San Francisco, CA, USA, 18–20 May 2020; IEEE: New York, NY, USA, 2020; pp. 1139–1155. [Google Scholar]
  3. Rehman, M.U.; Ahmadi, H.; Hassan, W.U. Flash: A comprehensive approach to intrusion detection via provenance graph representation learning. In Proceedings of the 2024 IEEE Symposium on Security and Privacy (SP), San Francisco, CA, USA, 19–23 May 2024; IEEE: New York, NY, USA, 2024; pp. 3552–3570. [Google Scholar]
  4. Li, Z.; Chen, Q.A.; Yang, R.; Chen, Y.; Ruan, W. Threat detection and investigation with system-level provenance graphs: A survey. Comput. Secur. 2021, 106, 102282. [Google Scholar] [CrossRef]
  5. Lagraa, S.; Husák, M.; Seba, H.; Vuppala, S.; State, R.; Ouedraogo, M. A review on graph-based approaches for network security monitoring and botnet detection. Int. J. Inf. Secur. 2024, 23, 119–140. [Google Scholar] [CrossRef]
  6. Manzoor, E.; Milajerdi, S.M.; Akoglu, L. Fast memory-efficient anomaly detection in streaming heterogeneous graphs. In Proceedings of the 22nd ACM SIGKDD International Conference on Knowledge Discovery and Data Mining, San Francisco, CA, USA, 13–17 August 2016; pp. 1035–1044. [Google Scholar]
  7. Abdullayeva, F.J. Advanced persistent threat attack detection method in cloud computing based on autoencoder and softmax regression algorithm. Array 2021, 10, 100067. [Google Scholar] [CrossRef]
  8. Milajerdi, S.M.; Eshete, B.; Gjomemo, R.; Venkatakrishnan, V.N. Poirot: Aligning attack behavior with kernel audit records for cyber threat hunting. In Proceedings of the 2019 ACM SIGSAC Conference on Computer and Communications Security, London, UK, 11–15 November 2019; pp. 1795–1812. [Google Scholar]
  9. Milajerdi, S.M.; Gjomemo, R.; Eshete, B.; Sekar, R.; Venkatakrishnan, V.N. Holmes: Real-time apt detection through correlation of suspicious information flows. In Proceedings of the 2019 IEEE Symposium on Security and Privacy (SP), San Francisco, CA, USA, 19–23 May 2019; IEEE: New York, NY, USA, 2019; pp. 1137–1152. [Google Scholar]
  10. Han, X.; Pasquier, T.; Bates, A.; Mickens, J.; Seltzer, M. Unicorn: Runtime provenance-based detector for advanced persistent threats. arXiv 2020, arXiv:arXiv:2001.01525. [Google Scholar]
  11. Wang, Q.; Hassan, W.U.; Li, D.; Jee, K.; Yu, X.; Zou, K.; Rhee, J.; Chen, Z.; Cheng, W.; Gunter, C.A.; et al. You Are What You Do: Hunting Stealthy Malware via Data Provenance Analysis. In Proceedings of the Network and Distributed Systems Security (NDSS) Symposium 2020, San Diego, CA, USA, 23–26 February 2020. [Google Scholar]
  12. Hassan, W.U.; Bates, A.; Marino, D. Tactical provenance analysis for endpoint detection and response systems. In Proceedings of the 2020 IEEE Symposium on Security and Privacy (SP), San Francisco, CA, USA, 18–20 May 2020; IEEE: New York, NY, USA, 2020; pp. 1172–1189. [Google Scholar]
  13. Alsaheel, A.; Nan, Y.; Ma, S.; Yu, L.; Walkup, G.; Celik, Z.B.; Zhang, X.; Xu, D. ATLAS: A sequence-based learning approach for attack investigation. In Proceedings of the 30th USENIX Security Symposium, USENIX Security 2021, Vancouver, BC, Canada, 11–13 August 2021; USENIX Association: Berkeley, CA, USA, 2021; pp. 3005–3022. [Google Scholar]
  14. Perozzi, B.; Al-Rfou, R.; Skiena, S. Deepwalk: Online learning of social representations. In Proceedings of the 20th ACM SIGKDD International Conference on Knowledge Discovery and Data Mining, New York, NY, USA, 24–27 August 2014; pp. 701–710. [Google Scholar]
  15. Grover, A.; Leskovec, J. node2vec: Scalable feature learning for networks. In Proceedings of the 22nd ACM SIGKDD International Conference on Knowledge Discovery and Data Mining, San Francisco, CA, USA, 13–17 August 2016; pp. 855–864. [Google Scholar]
  16. Narayanan, A.; Chandramohan, M.; Venkatesan, R.; Chen, L.; Liu, Y.; Jaiswal, S. graph2vec: Learning distributed representations of graphs. arXiv 2017, arXiv:1707.05005. [Google Scholar]
  17. Zhang, M.; Chen, Y. Link prediction based on graph neural networks. Adv. Neural Inf. Process. Syst. 2018, 31, 5165–5175. [Google Scholar]
  18. Gehani, A.; Kazmi, H.; Irshad, H. Scaling SPADE to “Big provenance”. In Proceedings of the 8th USENIX Conference on Theory and Practice of Provenance, Washington, DC, USA, 8–9 June 2016; pp. 26–33. [Google Scholar]
  19. Gehani, A.; Tariq, D. SPADE: Support for provenance auditing in distributed environments. In Proceedings of the ACM/IFIP/USENIX International Conference on Distributed Systems Platforms and Open Distributed Processing, Beijing, China, 9–13 December 2013; Springer: Berlin/Heidelberg, Germany, 2013; pp. 101–120. [Google Scholar]
  20. Gehani, A.; Ahmad, R.; Irshad, H.; Zhu, J.; Patel, J. Digging into big provenance (with SPADE). Commun. ACM 2021, 64, 48–56. [Google Scholar] [CrossRef]
  21. Hagberg, A.A.; Schult, D.A.; Swart, P.J. Exploring network structure, dynamics, and function using NetworkX. In Proceedings of the 7th Python in Science Conference (SciPy2008), Pasadena, CA, USA, 19–24 August 2008; Varoquaux, G., Vaught, T., Millman, J., Eds.; pp. 11–15. [Google Scholar]
  22. Chen, Z.; Yeo, C.K.; Lee, B.S.; Lau, C.T. Autoencoder-based network anomaly detection. In Proceedings of the 2018 Wireless Telecommunications Symposium (WTS), Phoenix, AZ, USA, 17–20 April 2018; IEEE: New York, NY, USA, 2018; pp. 1–5. [Google Scholar]
  23. Han, X.M. Streamspot Data [Data Set]. GitHub. 2016. Available online: https://github.com/sbustreamspot/sbustreamspot-data (accessed on 1 January 2025).
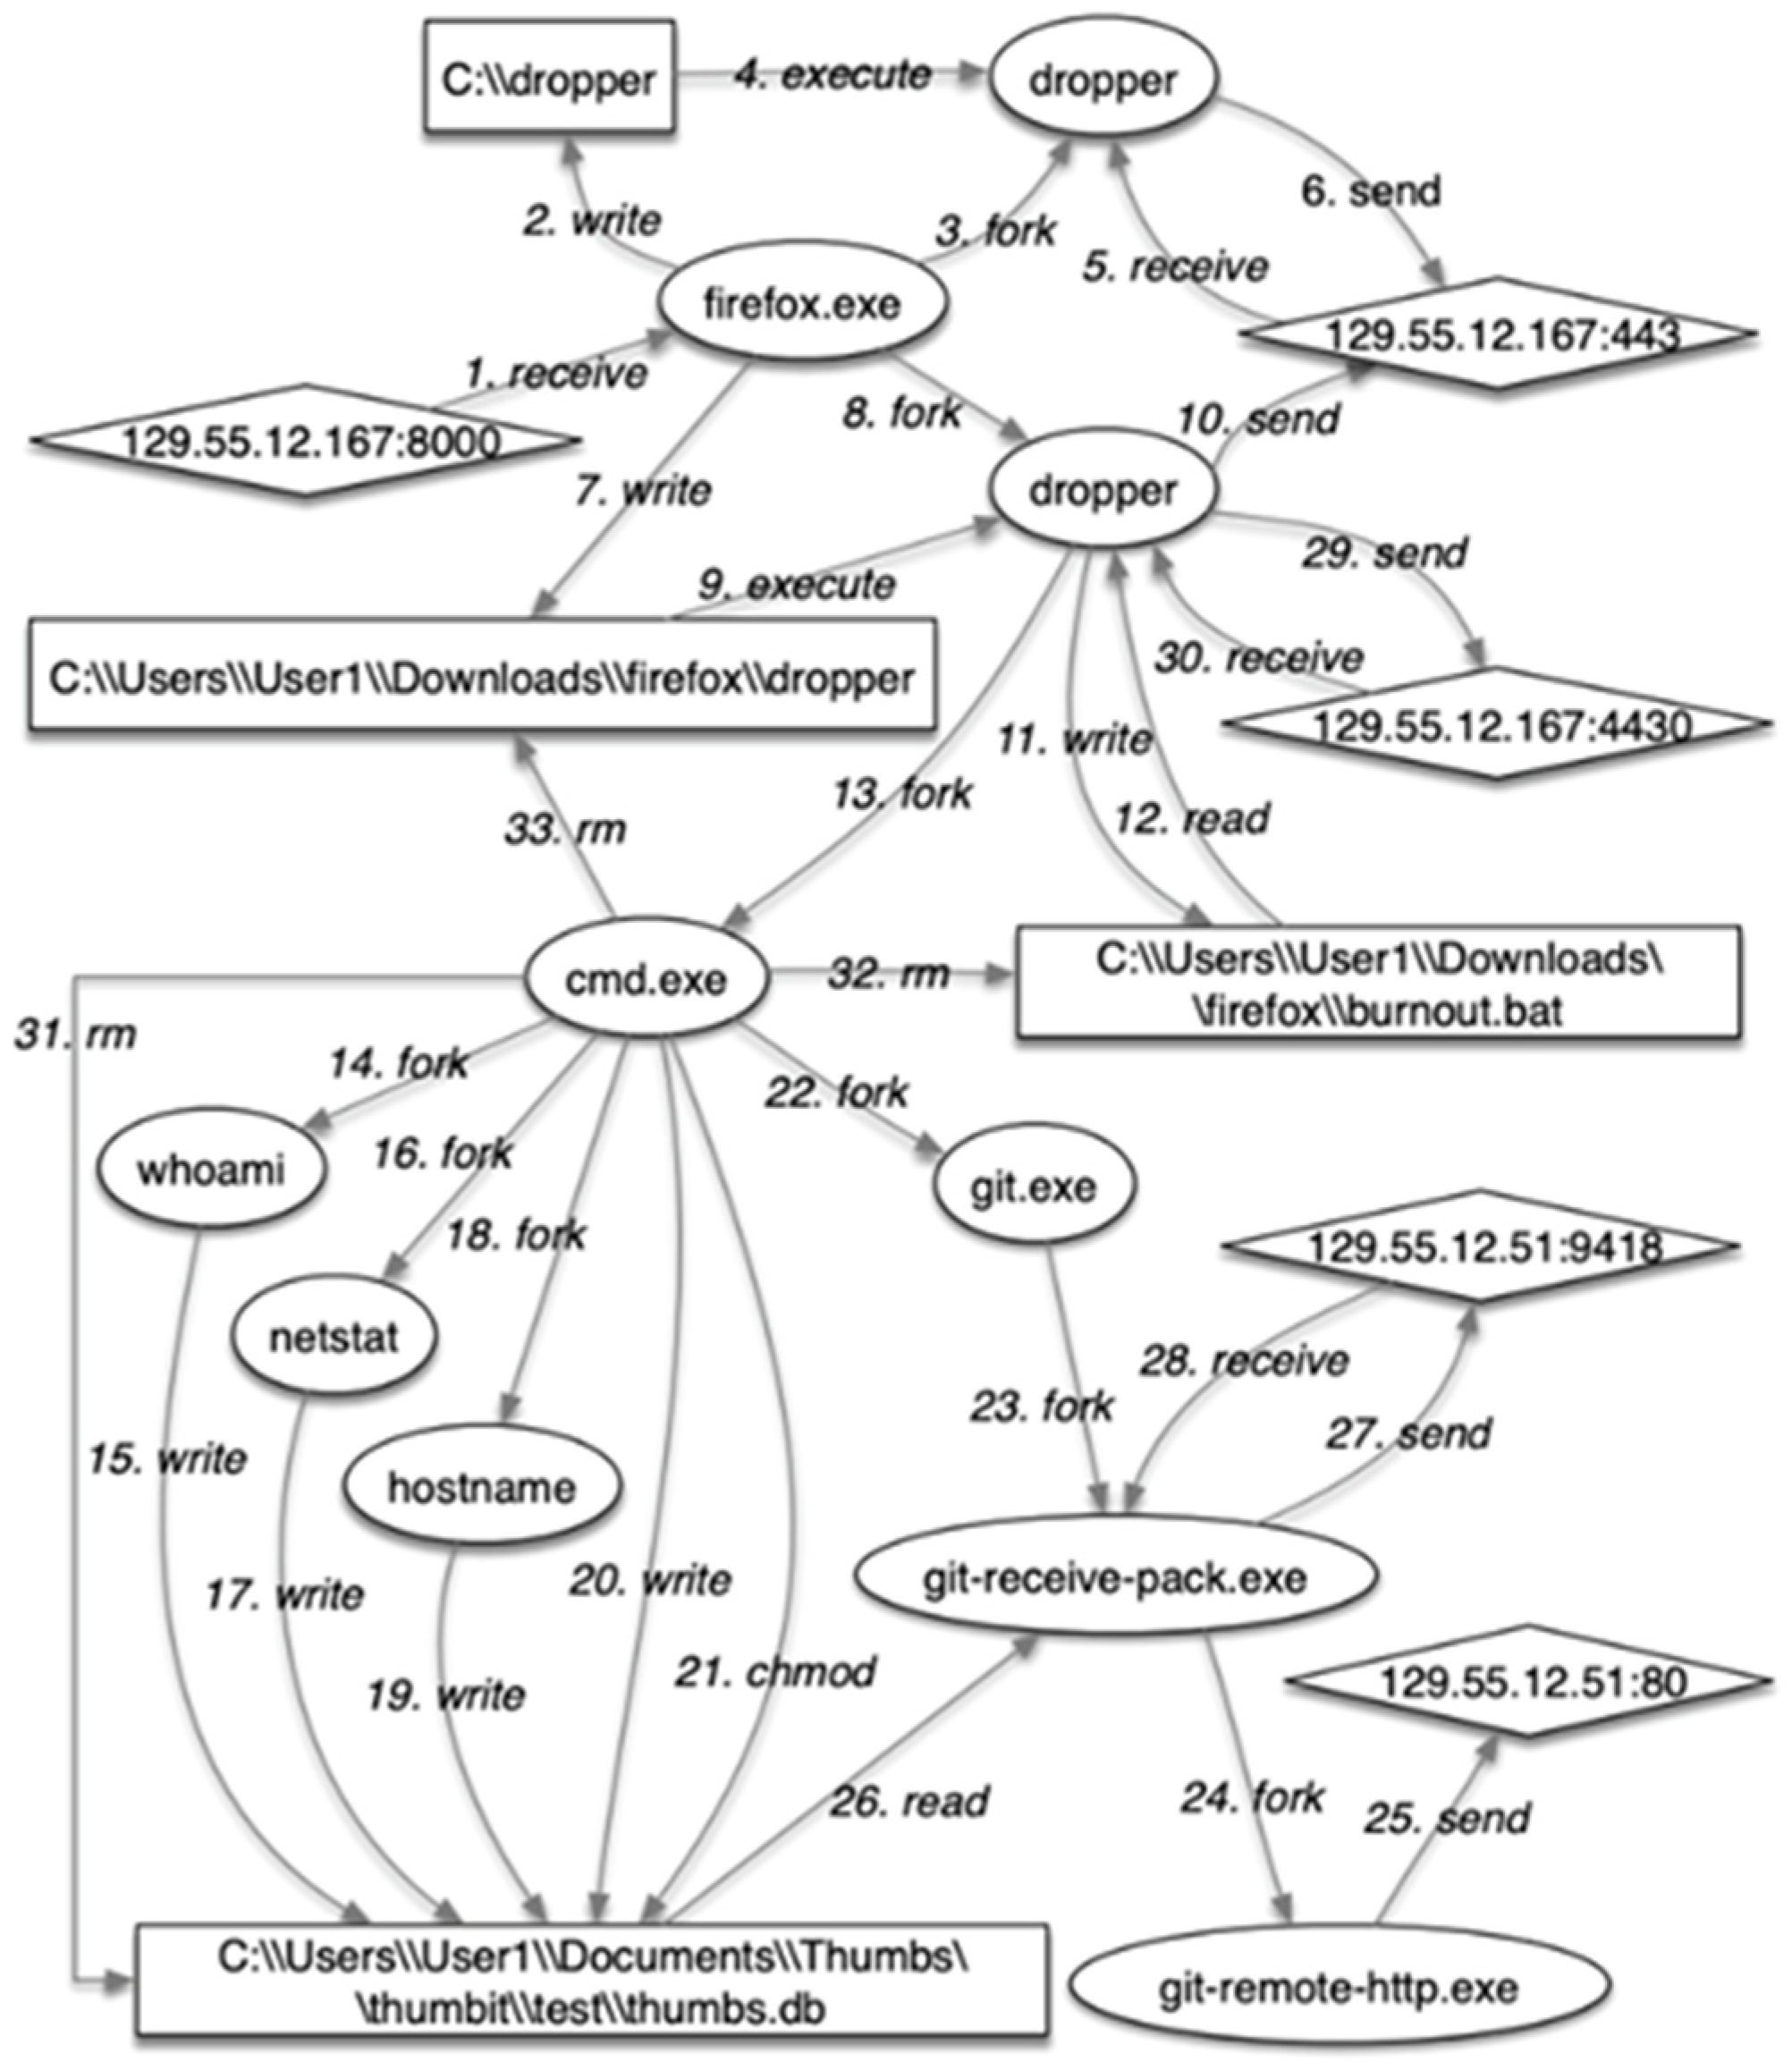
Figure 1. Example of a Provenance Graph.
Information 16 00566 g001
Figure 2. Sylph Architecture.
Information 16 00566 g002
Figure 3. SPADE Architecture.
Information 16 00566 g003
Figure 4. The detection results, where (a) is for a benign provenance graph and (b) is for a provenance graph with APT Attacks.
Information 16 00566 g004
Figure 5. Impact of time_forgot on metrics, where (a) for the StreamSpot dataset and (b) for the campus network dataset.
Information 16 00566 g005
Figure 6. Impact of feature combinations on metrics, where (a) for the StreamSpot dataset and (b) for the campus network dataset.
Information 16 00566 g006
Figure 7. Effect of sensitivity on ASI curves.
Information 16 00566 g007
Figure 8. Comparison of Sylph’s accuracy with three other APT detection tools.
Information 16 00566 g008
Table 1. Part Of Linux Audit Log Event Blacklist.
ProcessDescribe
cronTimed task executed successfully, e.g., CRON [12345]: (root) CMD (command)
dhelientDHCP client successfully obtains IP, e.g., DHCPREQUEST OI192.168.1.100 on etho to 255.255.255.255.255 port 67
sshdSSH login success, such as: Accepted password for user from192.168.1.100 port 12345 ssh2
systemdSystem service startup success, such as: started Sess1on 10 of user root
kernelKernel routing table changed, e.g., rt6_mtu_change:mtu update1gnored
postfixMail server successfully sent mail, e.g., postf1x/smtpd [12345]: disconnect from unknown [192.168.1.100]
Table 2. Distribution of subgraph outlier scores for the benign provenance graph and the provenance graph with an APT attack.
Outlier Score Interval(0, 200)(200, 400)(400, 500)(500, 600)
benignAverage number of subgraphs5684914226761586
Average subgraph percentage29.77%47.89%14.02%8.31%
attackAverage number of subgraphs19132279591579171
Average subgraph percentage39.17%57.24%3.23%0.35%
Table 3. Variation with λ of the number of subgraphs of the provenance graph with outlier score greater than λ.
λ450470490510530
benignAverage number of subgraphs70740324113594
Average subgraph percentage1.46%0.93%0.59%0.33%0.19%
Percentage of smallest subgraphs2.84%1.51%0.87%0.42%0.21%
attackAverage number of subgraphs2948256120471458863
Average subgraph percentage15.47%13.44%10.74%7.65%4.53%
Percentage of smallest subgraphs13.72%11.52%9.14%6.97%4.34%
the variance in the number of subgraphs691584401184112
Table 4. ASI values for the benign provenance graph and the provenance graph with APT attack.
ASIAverage ValueMaximum ValueMinimum Value
benign provenance graphs0.070.120.02
malicious provenance graphs0.9910.99
Table 5. Overview of the used dataset.
DatasetsLabelsNumber of GraphsAverage Number of Nodes per GraphAverage Number of Edges per Graph
StreamSpotbenign5008315173,857
malicious100889128,423
Unicorn SC-1benign125265,424975,226
malicious25257,156957,968
Unicorn SC-2benign125238,338911,153
malicious25243,658949,887
Table 6. Overview of the laboratory dataset.
LabelsScenarioNumber of GraphsAverage Number of Nodes per Graph
benignDownload1215,986
Livestream1215,660
Music1216,815
Webvideo1217,304
Word1216,119
Code1215,428
maliciousAres_mongo3217,972
Ares_flaski2415,217
Byob_ssi3217,753
Byob_obfuscated1215,945
Table 7. Top Semantic Feature Combinations under Fixed Forget Rate.
NumNodeEdge
1start_node_type,end_node_typeedge_time.edge_type
2start_node_type,end_node_type,start_node_description,end_node_descriptionedge_time,edge_type,edge_operation
3start_node_type,end_node_typedge_time,edge_type,edge_operation
4start_node_type,end_node_type,start_node_description,end_node_descriptionedge_time.edge_type
Table 8. Evaluation of the anomaly threshold ε.
Dataset0.0040.0050.0060.0080.06
Benign Dataset 10.26890.11920.04740.00661.7588 × 10−25
Benign Dataset 20.23140.09970.03910.00541.44 × 10−25
Benign Dataset 30.19780.08310.03220.00441.179 × 10−25
Malicious Dataset 111110.99999989
Malicious Dataset 211110.9999546
Malicious Dataset 311111
Table 9. Evaluation of the sensitivity.
Dataset0.00050.0010.002
Benign Dataset 10.017980.11920.2689
Benign Dataset 20.012120.09970.2497
Benign Dataset 30.00810.08310.2314
Malicious Dataset 1111
Malicious Dataset 2111
Malicious Dataset 3111
Table 10. Comparison of Sylph’s FPR with three other APT detection tools.
SystemStreamSpotUnicorn SC-1Unicorn SC-2Campus Network
StreamSpot6.92 48.9
Unicorn0.243.216.6510.88
Sylph0.443.484.678.47
ProvDetector4.925.46.7557.88
Table 11. Evaluation of the efficiency.
Size of Provenance GraphAverage Time (s)CPU Usage (%)Memory Usage (MB)
227.4 MB989.8121
415.6 MB17024.7365
245.6 MB10113.2158
357.2 MB14219.6272
Disclaimer/Publisher’s Note: The statements, opinions and data contained in all publications are solely those of the individual author(s) and contributor(s) and not of MDPI and/or the editor(s). MDPI and/or the editor(s) disclaim responsibility for any injury to people or property resulting from any ideas, methods, instructions or products referred to in the content.