Article

A Student-Centric Evaluation Survey to Explore the Impact of LLMs on UML Modeling

1
Department of Computer Information Systems, The University of Jordan, Aqaba 77110, Jordan
2
Department of Computing, Informatics, and Data Science, Saint Cloud State University, St Cloud, MN 56301, USA
3
Information Technology Faculty, Southern Illinois University, Carbondale, IL 62901, USA
4
Computer Science Faculty, University of Wisconsin-Green Bay, Green Bay, WI 54311, USA
*
Authors to whom correspondence should be addressed.
Information 2025, 16(7), 565; https://doi.org/10.3390/info16070565
Submission received: 23 May 2025 / Revised: 20 June 2025 / Accepted: 27 June 2025 / Published: 1 July 2025

Abstract

Unified Modeling Language (UML) diagrams serve as essential tools for visualizing system structure and behavior in software design. With the emergence of Large Language Models (LLMs) that automate various phases of software development, there is growing interest in leveraging these models for UML diagram generation. This study presents a comprehensive empirical investigation into the effectiveness of GPT-4-turbo in generating four fundamental UML diagram types: Class, Deployment, Use Case, and Sequence diagrams. We developed a novel rule-based prompt-engineering framework that transforms domain scenarios into optimized prompts for LLM processing. The generated diagrams were then synthesized using PlantUML and evaluated through a rigorous survey involving 121 computer science and software engineering students across three U.S. universities. Participants assessed both the completeness and correctness of LLM-assisted and human-created diagrams by examining specific elements within each diagram type. Statistical analyses, including paired t-tests, Wilcoxon signed-rank tests, and effect size calculations, validate the significance of our findings. The results reveal that while LLM-assisted diagrams achieve meaningful levels of completeness and correctness (ranging from 61.1% to 67.7%), they consistently underperform compared to human-created diagrams. The performance gap varies by diagram type, with Sequence diagrams showing the closest alignment to human quality and Use Case diagrams exhibiting the largest discrepancy. This research contributes a validated framework for evaluating LLM-generated UML diagrams and provides empirically-grounded insights into the current capabilities and limitations of LLMs in software modeling education.

1. Introduction

The rapid advancement of Large Language Models (LLMs) has profoundly influenced various domains within software engineering [1]. These models have demonstrated remarkable capabilities in code generation [2,3], software architecture design [4], and testing automation [5]. As a fundamental aspect of software engineering, Unified Modeling Language (UML) diagrams have long served as the standard visual notation for capturing both structural and behavioral aspects of software systems [6]. The integration of LLMs into UML modeling processes represents a significant opportunity to enhance software design practices and education. UML modeling encompasses both syntactic and semantic dimensions [7,8]. The syntactic dimension defines the structure and rules governing UML elements [9], while the semantic dimension explains their intended behavior and meaning, such as how generalization implies inheritance or how messages in sequence diagrams represent method calls. This dual nature of UML modeling presents unique challenges for automation through LLMs, which must accurately capture both the structural correctness and the semantic meaning of the diagrams they generate.
Recent advancements in prompt engineering have significantly enhanced the effectiveness of LLMs for software engineering tasks. Research by Chen et al. [10] introduced the concept of promptware engineering—a systematic approach for integrating LLMs into various phases of the software development lifecycle. Additional studies have demonstrated how combining fine-tuning and optimized prompting can improve automation in code generation [11], support safety-critical software development [12], and generate test cases using intelligent prompt-guided frameworks [13].
Several studies have explored the capabilities of LLMs in generating UML diagrams [14,15]. Despite their impressive ability to convert textual descriptions into UML code, these models continue to struggle with fully understanding all the required system elements and constraints. To address these limitations, researchers have focused on tuning models with domain-specific scenarios [16,17], integrating validation techniques, and refining prompt engineering approaches to improve diagramming accuracy. Other studies have investigated improving LLM-assisted UML diagram accuracy through fine-tuning techniques [18,19,20] and integrating domain-specific knowledge into the LLM training process [21,22,23,24,25]. Despite these advancements, significant research gaps remain in the evaluation of LLM-generated UML diagrams: Most existing studies focus primarily on basic correctness, neglecting comprehensive metrics that address both completeness and constraint satisfaction. There is insufficient exploration of different prompt engineering approaches, particularly rule-based frameworks that incorporate UML-specific constraints. Few studies have conducted large-scale, multi-university assessments of LLM-generated UML diagrams from a student-centric perspective.
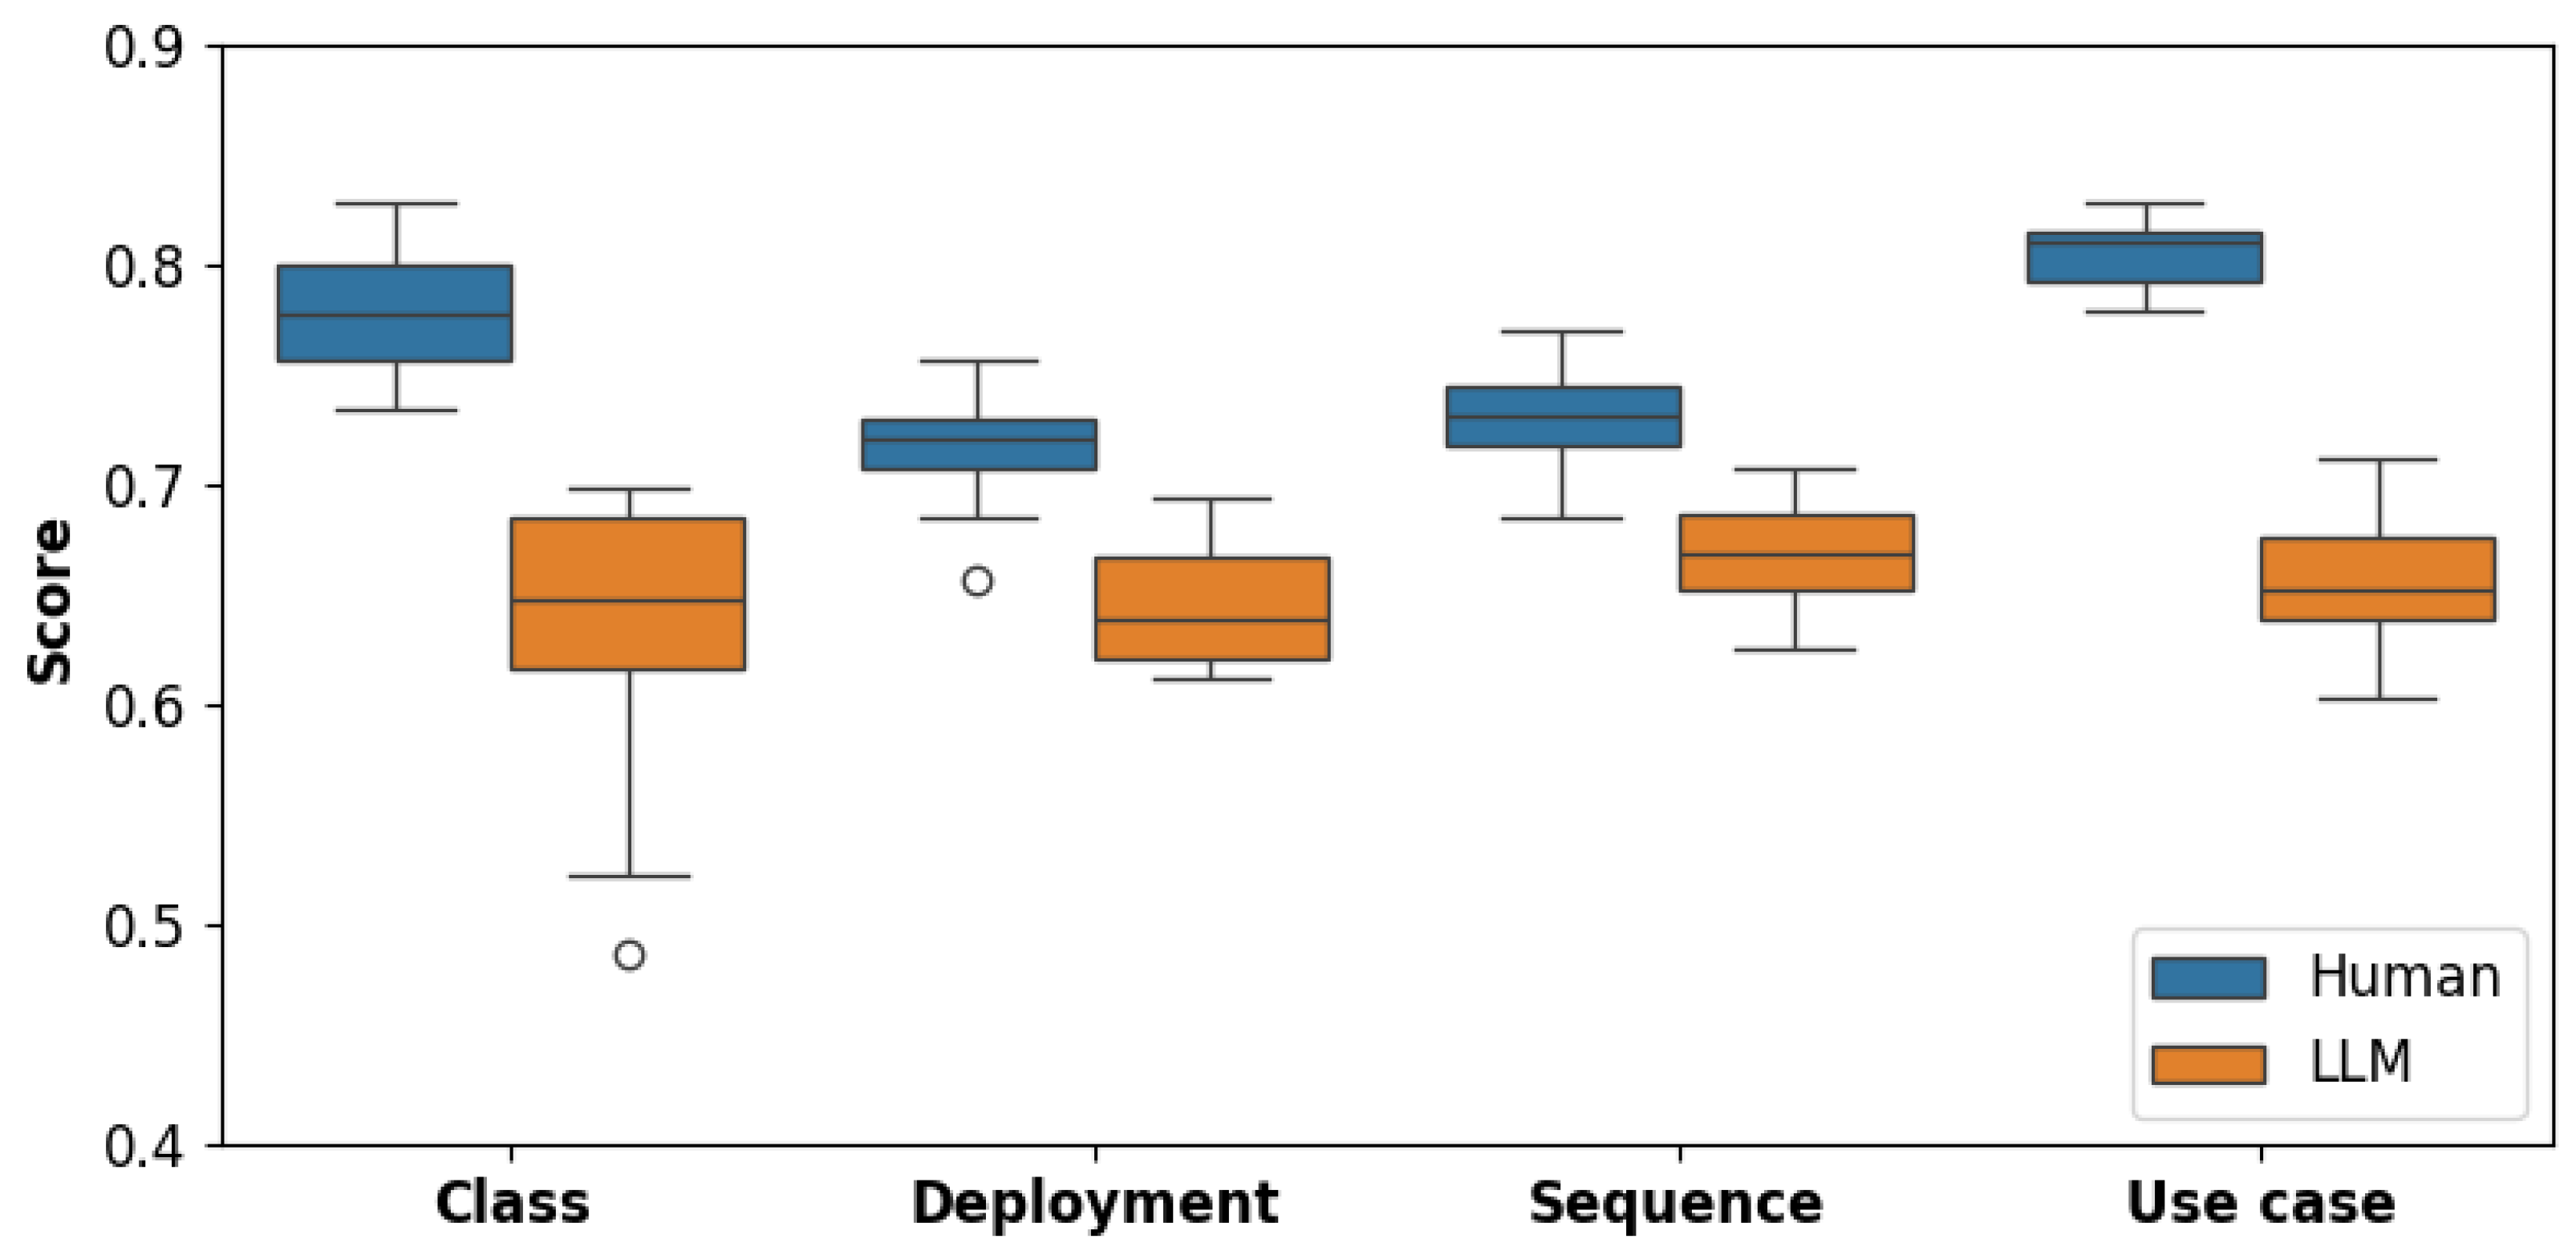
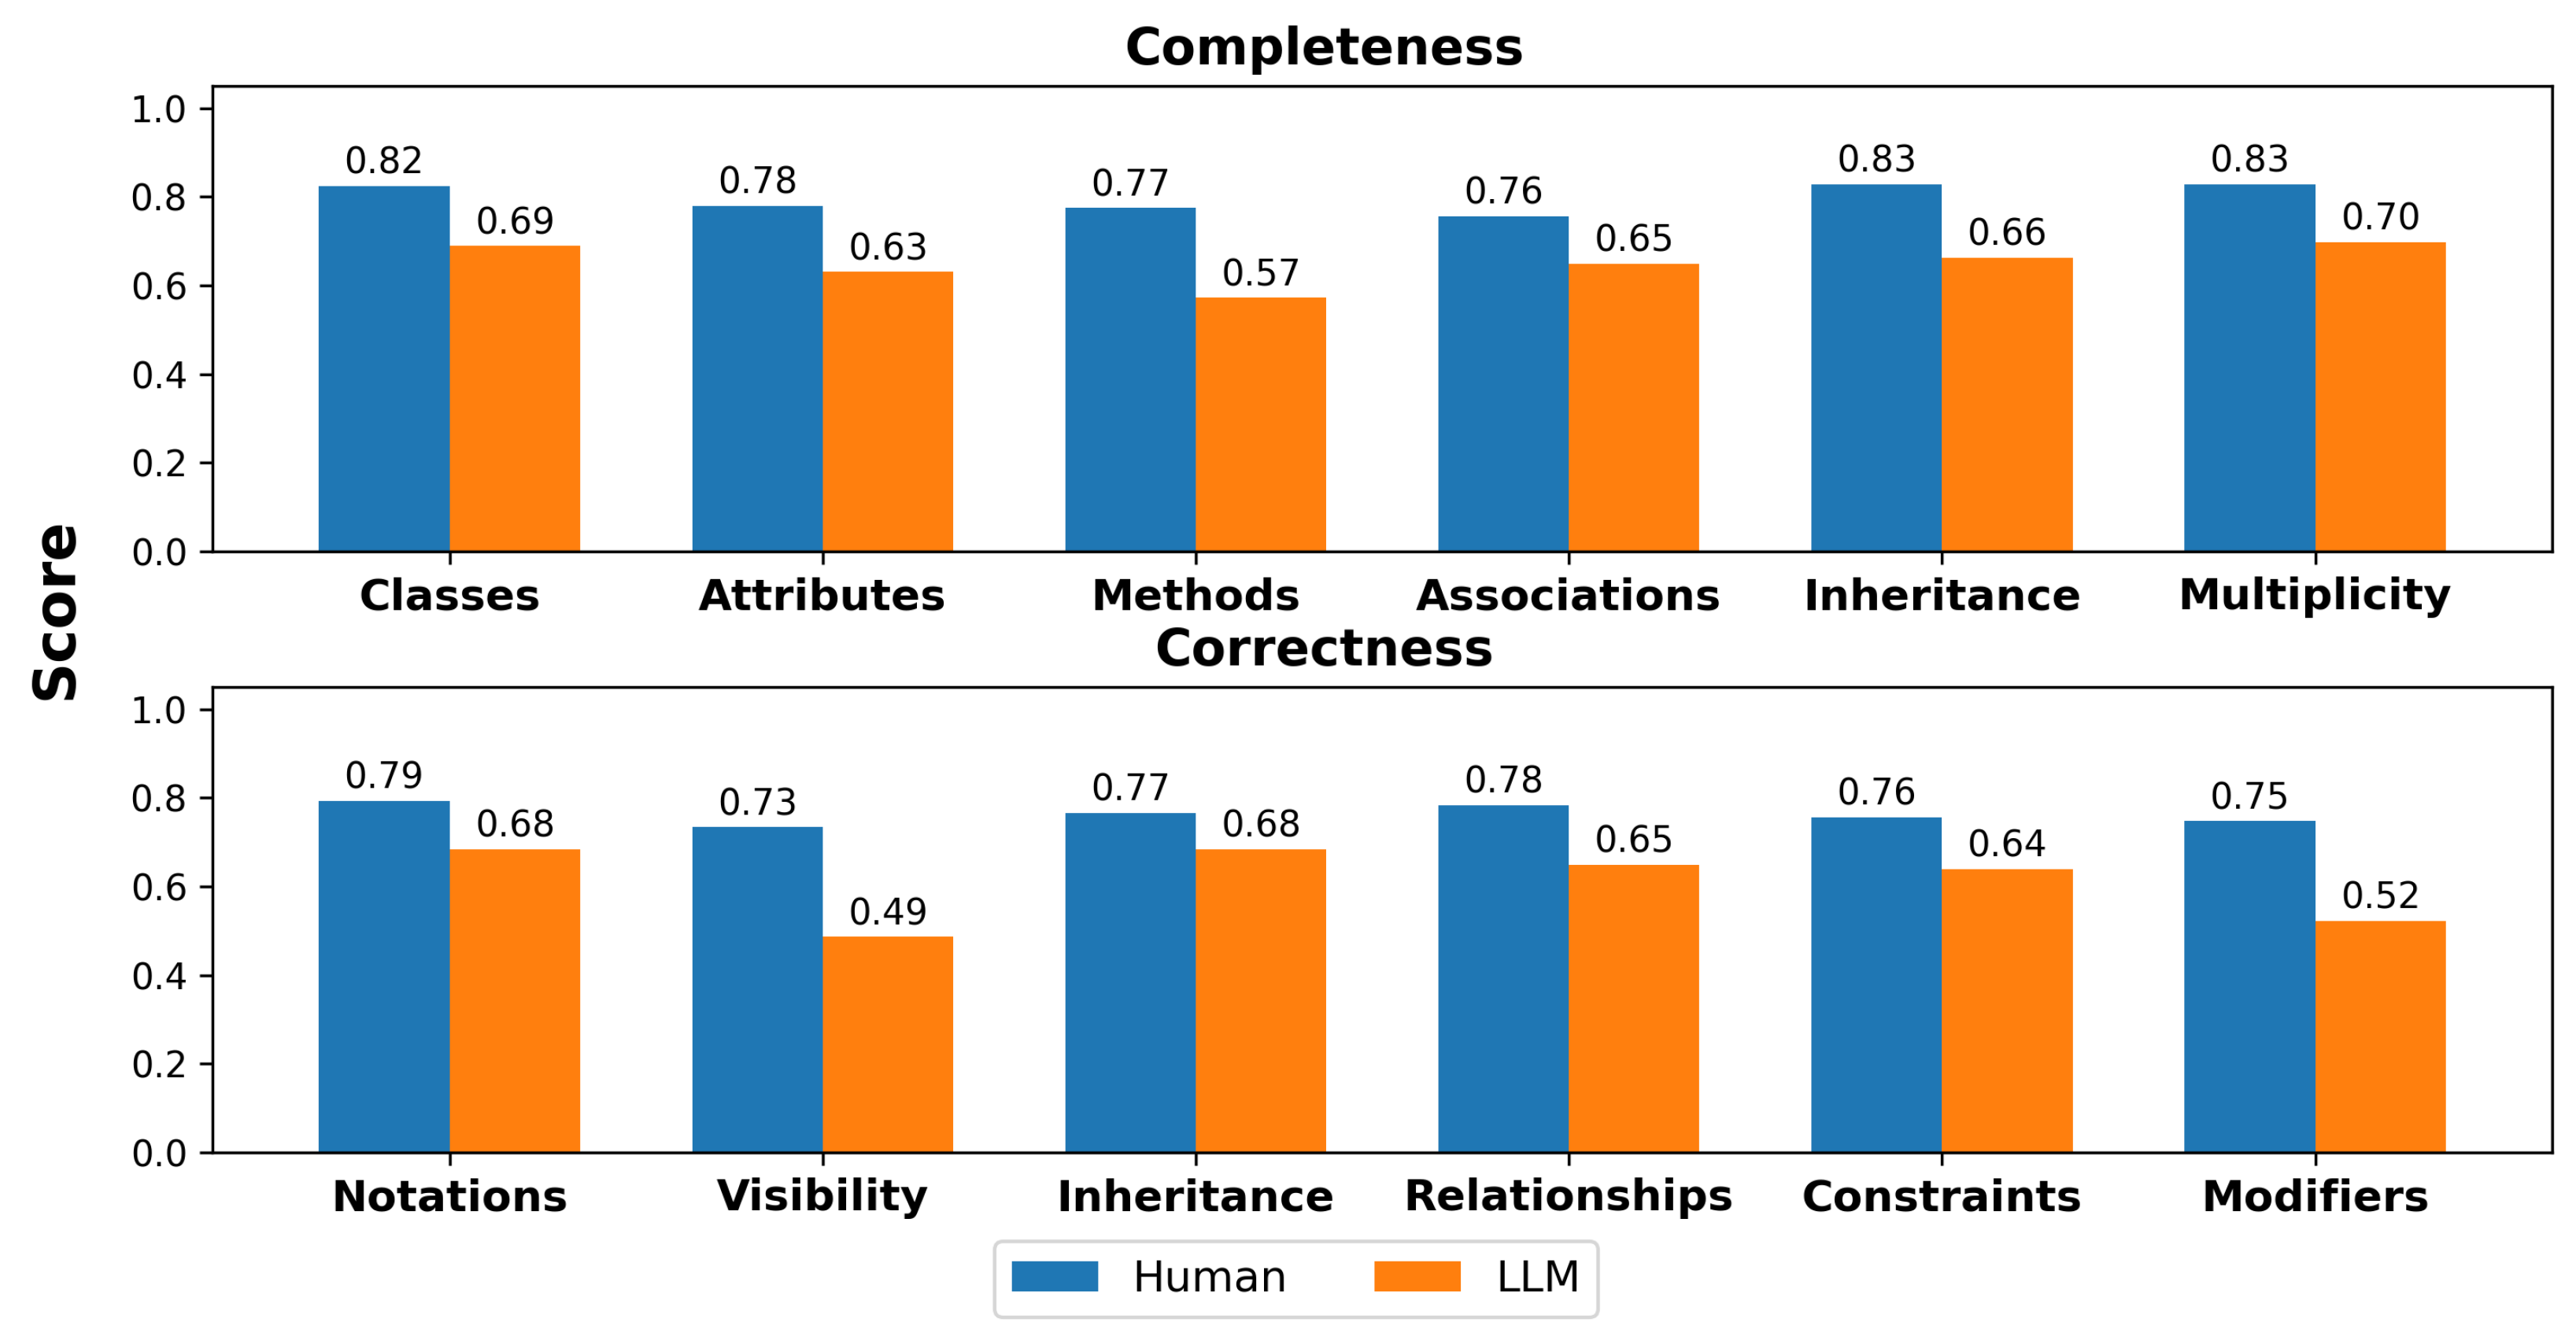
This study addresses these gaps by introducing an empirical evaluation framework for assessing the effectiveness of LLM-assisted UML generation. We integrate scenario-based prompt engineering with cross-diagram evaluation through a survey of 121 computer science and software engineering students from three U.S. institutions: Saint Cloud State University, Southern Illinois University Carbondale, and the University of Wisconsin—Green Bay. Our approach captures student-centric perspectives on both completeness and correctness when comparing LLM-assisted UML diagrams (Class, Deployment, Use Case, and Sequence) with human-created models. The term student-centric refers to an evaluation approach that actively involves students as the primary evaluators of UML diagrams, allowing them to apply their domain knowledge to assess these UML diagrams. This approach aligns with learner-centered educational practices, which emphasize student engagement in the learning process. The study addresses the following research questions:
  • RQ1: To what extent does an LLM-assisted class diagram match a human-created diagram in terms of completeness and correctness?
  • RQ2: To what extent does an LLM-assisted deployment diagram match a human-created diagram in terms of completeness and correctness?
  • RQ3: To what extent does an LLM-assisted use case diagram match a human-created diagram in terms of completeness and correctness?
  • RQ4: To what extent does an LLM-assisted sequence diagram match a human-created diagram in terms of completeness and correctness?
Our contributions include the following:
  • A novel rule-based validation framework for evaluating LLM-generated UML diagrams, incorporating both completeness ratio (CR) and constraint satisfaction (CS) metrics.
  • A comprehensive empirical evaluation methodology involving students from multiple universities, providing diverse perspectives on diagram quality.
  • Statistically validated insights into the current capabilities and limitations of LLMs in generating different types of UML diagrams.
  • A generalizable model for educational UML assessment with LLMs that can be extended to other modeling contexts and educational settings.
The remainder of this paper is organized as follows: Section 2 reviews related work on LLMs in software modeling and UML diagram generation. Section 3 details our methodology, including the rule-based prompt engineering framework and validation algorithms. greenSection 3describes our experimental setup and data collection process. Section 4 presents our results and statistical analyses. Section 5 discusses the implications of our findings for software engineering education and practice. Section 6 addresses threats to validity, and Section 7 concludes with a summary of contributions and directions for future research.

2. Related Work

LLMs have significantly influenced software modeling, particularly through their ability to automate the generation of UML diagrams.
Recent work has begun to assess the role of LLMs in software modeling tasks. Cámara et al. [15] investigated ChatGPT 4.1’s effectiveness in generating class diagrams and highlighted limitations in identifying relationships and multiplicities. Unlike our study, their evaluation was limited to one structural diagram type, and lacked a systematic prompt engineering approach. De Vito et al. [16] introduced ECHO, a co-prompting technique designed to guide ChatGPT in generating Use Case diagrams. While their method improved diagram quality, it focused on a single diagram type, and did not evaluate structural diagrams like Class or Deployment, nor did it include correctness metrics, like we propose. Moreover, Recent advances in ensemble modeling approaches combining CNNs, Bi-LSTM, and transformers have demonstrated significant improvements in text classification tasks, especially in socially sensitive domains [26].
Herwanto [17] expanded the application of LLMs beyond UML by automating Data Flow Diagram generation from user stories, illustrating LLMs’ general potential in early software modeling tasks. Our study complements this line of research by focusing on standard UML diagrams and introducing dual evaluation metrics (correctness and completeness).
Chen et al. [10] evaluated domain modeling performance using different prompt strategies (zero-, one-, and two-shot) across GPT-3.5 and GPT-4. Their analysis found that few-shot methods improved attribute and relationship generation, whereas zero-shot had the lowest recall—a pattern consistent with our findings and prompting strategy. We differ in that we apply prompt engineering rules and evaluate across multiple diagram types, not just entity relationships.
Wang et al. [27] focused on correctness scoring of Class, Use Case, and Sequence diagrams using few-shot prompting. As discussed in Section 4.3, their higher Sequence diagram correctness score (74.8%) compared to ours (68.3%) likely results from their iterative refinement process. However, we included completeness as an additional metric, offering a broader assessment than correctness-only analysis.
Conrardy and Cabot [28] proposed a vision-to-model approach using GPT-4V and Gemini to convert UI screenshots to UML. They reported that GPT-4V outperformed Gemini on this image-to-UML task.
Compared to these prior efforts, our study makes several distinct contributions: (1) we evaluate both structural and behavioral UML diagrams; (2) we introduce automated correctness and completeness validation; and (3) we use a large-scale, student-centered survey across multiple universities to assess human judgments. Many previous studies have focused on one diagram type, used qualitative assessments, or lacked cross-population evaluation—limitations we aim to address.
From the perspective of UML structural diagrams, one study [28] explored the usage of GPT-4V and Gemini to generate a UML Class model from given images of hand-drawn UML diagrams. Their study compared GPT-4, Gemini Pro, and Gemini Ultra. Based on their findings, GPT-4 provided the best results. The research conducted in [29] aimed to provide Class diagrams from NL descriptions using GPT-3.5 and GPT-4. Also, the study in [29] evaluated fully automated domain modeling using GPT-3.5/GPT-4 by exploring three types of shots: zero-shot (no examples), N-shot (1–2 labeled examples), and chain-of-thought (CoT) (step-by-step rationale). The results showed that GPT-4 with one-shot prompting performed best for classes and relationships, while two-shot improved attribute generation. Zero-shot had the lowest recall values (missing elements), and CoT was ineffective for domain modeling. Their findings reveal that LLMs struggle with relationships and modeling. Another research study by [15] aimed to explore the current capabilities of ChatGPT in performing modeling tasks and help software designers to identify the syntactic and semantic gaps in UML. Nevertheless, these studies captured only the Class diagram.
In terms of UML behavioral diagrams, one study [14] applied a qualitative approach by investigating how ChatGPT could assist in producing sequence diagrams from 28 Software Requirements Specifications (SRSs) in various problem domains. In addition, the research work in [16] proposed a co-prompt engineering approach, ECHO, that helped software engineers to efficiently use ChatGPT as an essential LLM to improve the quality of generated Use Case diagrams. Nevertheless, these studies are limited to Sequence or Use Case diagrams.
Considering the exploration of both structural and behavioral UML diagrams, the authors of [27] designed an experiment involving 45 undergraduate students enrolled in a required modeling course. The findings showed how GPT-3.5 and GPT-4 were able to significantly assist the students in producing three UML models: Class diagrams, Use Case diagrams, and Sequence diagrams. This study addressed only correctness evaluation, and it involved students’ feedback from a single university.
This study attempted to capture both completeness and correctness evaluation for structural (Class and Deployment) and behavioral (Use Case and Sequence) UML diagrams. We used a survey designed to compare LLM-assisted UML diagrams with human-created diagrams based on students perspectives across three different U.S. universities. The proposed approach employs zero-shot prompts with explicit UML constraints and algorithmic validation, which essentially aims to test the ability of GPT-4-turbo in assisting the visualization of the investigated diagrams.

3. Materials and Methods

This section outlines the proposed methodology, it presents a rule-based prompt engineering framework used to generate UML diagrams from problem domain scenarios, details the validation algorithms applied to ensure the quality of prompts, and explains the empirical-data collection process.
Our approach is structured as a pipeline design to evaluate the effectiveness of GPT-4-turbo in generating complete and correct UML diagrams given natural language scenarios, as illustrated in Figure 1. We selected GPT-4-turbo because it is designed to handle longer natural language text (i.e., problem domain scenarios) compared to GPT 3.5 and GPT 4.

3.1. Generating UML Diagrams Using GPT-4-Turbo and PlantUML

The iCoot Car Rental System has been chosen to represent a real-world system, for which it’s scenarios (i.e., natural language) have been taken from one of the most popular object-oriented design textbooks [30], as described in Appendix A. The iCoot Car Rental System was selected due to its moderate complexity and relevance as a representative scenario in software modeling education. This allowed for controlled comparisons across different UML diagram types and ensured consistent participant interpretation during the evaluation. In future work, we plan to extend our evaluation to multiple domains with varying levels of complexity (e.g., healthcare, e-commerce, and financial systems) to assess whether our framework and the performance of LLMs generalize across diverse software scenarios. Due to survey limitations, it is hard to cover more than one problem domain.
To generate a UML diagram from scenarios is a complex process that we formulated into a series of prompts for LLMs. We started with rule-based prompt engineering, where natural language scenarios were converted into prompts. The developed prompting strategy guides LLMs through identifying relevant elements and gathering them into a diagram description (i.e., UML code). The element extraction was implemented to detect all relevant components in the investigated diagrams. We define required elements as the set of domain-relevant UML components explicitly mentioned or implied in the scenario descriptions used to generate the diagrams. These include classes, relationships, actors, use cases, methods, nodes, artifacts, and message sequences, depending on the diagram type. Constraints refer to UML-specific syntactic and semantic rules (e.g., multiplicities, inheritance, associations, stereotype usage, interaction order) that govern the correct structuring of these elements. These were identified using a combination of UML 2.5 specification guidelines and textbook-derived modeling rules. The thresholds for validation, set at θ 1 = 0.5 for the completeness ratio (CR) and θ 2 = 0.5 for constraint satisfaction (CS), were chosen based on empirical inspection and pilot testing, ensuring that the diagrams met at least half of the required specifications before being considered valid. These conservative thresholds balanced inclusivity and rigor, allowing imperfect yet pedagogically relevant LLM-generated diagrams to be meaningfully assessed while still differentiating between low- and high-quality outputs. To develop structured prompts that direct LLMs in creating UML diagrams from plain-language requirements, we formalize this work using a set of connected algorithms, including extraction, mapping, constraint enforcement, optimization, and validation.

3.2. Prompt Engineering Rules

We begin with a high-level overview of the pipeline through Algorithm 1. It describes the scenario requirements, target UML diagram type, and model elements for the diagrams to be identified in the domain of software analysis. This procedure encapsulates the transformation from unstructured text to a well-formed UML diagram prompt, which orchestrates the entire pipeline and ensures that the final prompt is both structurally complete and semantically valid before it is used for UML generation. Let SR denote the NLP description of a software system, T { Class , UseCase , Sequence , Deployment } be the target UML diagram type, and P be the resulting prompt structure.
Algorithm 1 Generate UML Prompt
Require: 
System requirements SR , diagram type T, complexity level L
Ensure: 
Structured prompt P
  1:
Initialize empty sets: C (elements), R (relationships), K (constraints)
  2:
C ExtractElements( SR )
  3:
R MapRelationships( C )
  4:
K DefineConstraints( C , R )
  5:
if complexity level L is specified then
  6:
     C OptimizeElements( C , L )
  7:
     R OptimizeRelationships( R , L )
  8:
end if
  9:
P ComposePrompt( T , C , R , K )
10:
if prompt passes completeness and correctness validation then
11:
    return  P
12:
else
13:
    return “Invalid Prompt: Failed Validation”
14:
end if
Algorithm 1 is responsible for transforming raw natural language into a structured prompt format suitable for LLM input, using grammar-driven chunking and diagram-specific instructions. It defines a set of sequential computational steps that extract modeling elements, identify relationships, enforce constraints, and validate prompt quality. Each step, as described in the following subsections, ensures that the final prompts are aligned with UML syntactic rules and domain semantics before UML diagrams are created.
Element Extraction. The first step involves identifying the core entities and actions from the requirement specification, which can identify all relevant entities, actors, nodes, functional elements, etc., from the scenarios. These become the foundational elements for modeling UML diagrams. In our example, Algorithm 2 extracts entities such as “Customer”, “CarModel”, and “Rental” from the Car Rental scenario. This ensures that all relevant objects and functionalities mentioned in the textual description are captured and formalized as potential diagram elements, as shown in Algorithm 2. For example, given a scenario involving vehicle reservations, this algorithm extracted “Customer” and “CarModel” as key class entities.
Algorithm 2 Extract Elements
1:
function ExtractElements( SR )
2:
     E ← Identify all domain entities (e.g., classes, actors, nodes)
3:
     A ← Identify actions or behaviors (e.g., methods, use cases)
4:
    return  E A
5:
end function
Relationship Mapping. Once the elements have been identified, the interactions or dependencies among them are mapped to define structural or behavioral relationships, such as associations, generalizations, message flows, or deployment links, depending on the diagram type. These relationship types vary based on the type of diagram, either behavioral or structural, as shown in Algorithm 3.
Algorithm 3 Map Relationships
1:
function MapRelationships( C )
2:
    Initialize empty relationship set R
3:
    for all component pairs ( c i , c j ) C  do
4:
        if a logical or functional interaction exists between c i and c j  then
5:
           Add directional relationship c i c j to R
6:
        end if
7:
    end for
8:
    return  R
9:
end function
Constraint Definition. Each element and relationship is then annotated with UML-specific constraints, such as multiplicity, types, role, attributes, aggregation, composition, inheritance rules, association, extends, includes, deploys, manifest, artifact mapping, and message sequences and types. These constraints ensure that the generated prompts yield diagrams that adhere to valid UML syntax and semantics, reducing ambiguity, as shown in Algorithm 4. This algorithm adds multiplicity constraints, such as “a Customer can have multiple Rentals”, to ensure relationship completeness.
Algorithm 4 Define Constraints
  1:
function DefineConstraints( C , R )
  2:
    Initialize K
  3:
    for all  c C  do
  4:
        for all  r R  do
  5:
           Add constraints for attributes and methods to K
  6:
           Add constraints for relationships and multiplicity to K
  7:
        end for
  8:
    end for
  9:
    return  K
10:
end function

Prompt Example for the Car Rental System

To concretely illustrate how our prompt engineering framework operates, we present a real example from the Car Rental System scenario. This example was used to generate a Class diagram.
The scenario included key entities such as Customer, CarModel, Rental, and Payment. From this, we derived a structured prompt that instructed GPT-4-turbo to carry out the following:
“Generate a UML Class Diagram for the following Car Rental scenario. Ensure the diagram includes all relevant classes, class names, attributes, and relationships. Relationships should reflect cardinalities/multiplicities. Use proper UML syntax in the textual output.”
This prompt, formatted as part of our prompt pipeline, reflects the rules described in Algorithms 1–6. The full version of the prompt is included in Appendix A for transparency.

3.3. Validation Functions

To prevent the generation of incomplete or incorrect UML prompts, we propose two scoring functions that evaluate prompt quality based on completeness and constraint satisfaction. Algorithms 5 and 6 describe the essential validation functions for completeness and correctness, respectively. They provide the empirical basis for rejecting poorly designed prompts and ensure the reliability of the generated UML diagrams according to the previously defined rules described in Algorithms 2–4.
Completeness Validation: This checks whether the prompts include all the required elements expected from the scenarios; it computes a completeness ratio ( C R ) and rejects prompts below a predefined threshold θ 1 .
Algorithm 5 Validate Completeness
1:
function ValidateCompleteness( P )
2:
     N required ← Count the number of expected UML elements
3:
     N included ← Count elements covered by P
4:
     CR N included N required × 100
5:
    return True if CR θ 1 , else False
6:
end function
C R measures how fully a generated diagram covers the required UML elements extracted during prompt formulation. It is calculated as the proportion of implemented elements, such as classes, actors, relationships, etc., compared to the total expected elements for a given diagram type. Mathematically, C R is defined as shown in Equation (1).
C R = | ImplementedElements | | RequiredElements | × 100 %
where ImplementedElements represents the number of required UML components correctly generated, and RequiredElements forms the total number of UML components expected according to the prompt.
Correctness Validation: This checks each constraint in the prompt. If any constraint is violated—such as incorrect attribute types or mismatched relationships—the prompt is rejected.
Algorithm 6 Validate Correctness
1:
function ValidateCorrectness( P )
2:
    for all  κ P . Constraints  do
3:
        if  P violates κ  then
4:
           return False
5:
        end if
6:
    end for
7:
    return True
8:
end function
The constraint satisfaction score ( C S ) measures adherence to UML syntactic and semantic rules embedded within the prompt, such as multiplicity constraints; relationship types, for example, aggregation vs. composition; and behavioral accuracy, such as message sequencing in Sequence diagrams. It is calculated as indicated in Equation (2). Furthermore, a prompt is deemed acceptable if both scores exceed defined thresholds: θ 1 and θ 2 , which were empirically set to 0.5 in our evaluation.
The thresholds θ 1 = 0.5 (completeness) and θ 2 = 0.5 (constraint satisfaction) were determined based on empirical pilot testing. During preliminary experiments, we evaluated model-generated diagrams across multiple prompt iterations and compared them to human intuition of minimal adequacy. We found that a 50% threshold balanced strictness and tolerance—filtering out grossly incomplete or incorrect diagrams while not being overly punitive. Conceptually, it aligns with a minimal sufficiency criterion: a diagram that includes at least half of the required elements or satisfies half the constraints can be considered marginally acceptable for educational feedback or iterative refinement.
C S = | SatisfiedConstraints | | TotalConstraints | × 100 %
where SatisfiedConstraints shows the number of rules that the prompt required and the LLM respected correctly in the diagram as all correct relationships, multiplicities, actor–use connections, Sequence message types, etc., while TotalConstraints represents the total number of all the required rules that the prompt expected the LLM to satisfy. The CR (completeness ratio) and CS (correctness score) metrics were designed generally by exploring the essential elements of any modeling framework. This general definition could be adapted to UML modeling, and the underlying principles measuring element coverage and rule compliance can be adapted to other modeling languages or graphical tools (e.g., BPMN, ER diagrams). All the calculations for the validation functions (CR and CS), for both human-created and LLM-assisted UML diagrams, have been explained in the Appendix A.

3.4. Generating UML-Assisted Diagrams

After applying the prompt development strategy, this study constructed textual prompts for all UML diagrams using scenario descriptions from the textbook. These prompts were processed using GPT-4 turbo, which then generated the corresponding UML code for each diagram. The generated code was copied into the PlantUML tool (https://plantuml.com/ accessed on 22 May 2025) to visualize the diagrams, alongside human-created UML diagrams that were extracted from the same textbook to ensure consistency with the associated scenarios. The LLM-assisted diagrams were then extracted and included in our survey. All details regarding the prompt descriptions are provided in Appendix A.

3.5. Data Collection

The methodology adopted an empirical evaluation through a survey that collected responses from about 121 computer science and software engineering students across three different public universities. The survey includes eight diagrams: four diagrams for LLM-assisted and four for human-created diagrams. The survey captures (6, 6), (4, 4), (5, 4), and (4, 4) elements of (completeness, correctness) for Class, Deployment, Use Case, and Sequence diagrams, respectively. The same identical questions are given for each single LLM-assisted and human-created diagram, and each question captures a single investigated element. To collect and analyze the responses, we used Qualtrics (https://www.qualtrics.com/ accessed on 22 May 2025). Figure 2 displays the number of participating students from all universities. In total, there were 80 undergraduate students and 41 graduate students across all universities. The majority of undergraduate students were Juniors and Seniors. In terms of their UML modeling skills, the majority of participants had taken software engineering courses, such as Introduction to Software Engineering, Software Design, and Software Analysis.
The survey was distributed during the final week of the semester to all students enrolled in the participating software engineering courses. The survey was administered as part of the final assessment in these courses, with a strict time limit of 120 min for completion. Additionally, throughout the course, students engaged in daily quizzes and formative exercises on UML topics during regular learning hours, which prepared them for the final evaluation. Responses were collected anonymously using institutional survey tools, and later analyzed using quantitative and statistical methods.

4. Results

This section presents the empirical findings derived from the student evaluation of LLM-assisted and human-created UML diagrams. It includes descriptive and inferential statistical analyses that compare performance across diagram types, highlighting differences in completeness and correctness.

4.1. Statistical Analysis

To enable more robust statistical analysis, we mapped the categorical survey responses, assigning 0 for incomplete and incorrect elements and 1 for complete and correct elements. We then calculated the average score for each element to obtain a value between 0 and 1 that reflected the completeness or correctness score for the element being measured. As shown in Table 1, the completeness scores of LLM-assisted UML diagrams consistently fall short of those of their human-created counterparts across all four diagram types. This gap is most evident for the Class and Use Case diagrams. The human-created Class diagrams achieved a mean ( x ¯ ) score of 0.7988 ( σ = 0.0322), while the LLM-assisted versions scored notably lower, at 0.6502 ( σ = 0.0457). Similarly, the human-created Use Case diagrams recorded the highest mean completeness score, at 0.8072 ( σ = 0.0087), whereas the LLM-assisted counterparts attained a mean of 0.6712 ( σ = 0.0300).

4.1.1. Descriptive Statistics

In the remaining two diagram types—Deployment and Sequence—LLM-assisted diagrams came somewhat closer to human performance, but still underperformed. For the Deployment diagram, the human-created diagrams had a mean score of 0.7005 ( σ = 0.0372), compared to 0.6486 ( σ = 0.0362) for the LLM-assisted diagrams. The Sequence diagrams had the narrowest margin between the two sources, with human-created diagrams averaging 0.7320 ( σ = 0.0358) and LLM-assisted ones achieving 0.6768 ( σ = 0.0174).
While the gaps in mean scores ranged from roughly 5 to 15 percentage points, LLM-assisted diagrams also exhibited greater variability in three of the four diagram types. Specifically, the Class diagrams generated by LLMs had a wide score range, from 0.5721 to 0.6982, indicating inconsistent levels of completeness. In contrast, human-created diagrams not only scored higher, but also showed tighter clustering of scores, particularly in the Use Case diagrams, where scores ranged narrowly between 0.7928 and 0.8153.
As shown in Table 2, LLM-assisted UML diagrams also trailed behind human-created diagrams in terms of correctness scores for the four types of diagram. This disparity is most apparent in the Class and Use Case diagrams. The human-created Class diagrams received a mean ( x ¯ ) score of 0.7635 ( σ = 0.0220), while the LLM-assisted versions scored lower, at 0.6111 ( σ = 0.0854). Similarly, the Use Case diagrams produced by human participants achieved the highest correctness mean at 0.8041 ( σ = 0.0222), in contrast to the LLM-assisted counterparts, which had a mean score of 0.6419 ( σ = 0.0298).
In the Deployment and Sequence diagrams, the performance gap narrowed slightly, but still favored the human-created diagrams. For the Deployment diagrams, human-created versions attained a mean correctness score of 0.7309 ( σ = 0.0174), whereas LLM-assisted diagrams scored a mean of 0.6430 ( σ = 0.0279). The Sequence diagrams showed the smallest difference, with human-created diagrams averaging 0.7264 ( σ = 0.0245) and LLM-assisted ones scoring 0.6622 ( σ = 0.0337).
LLM-assisted diagrams also exhibited greater inconsistency in correctness scores—similar to what was observed in the completeness scores—particularly in the class diagram category, where scores ranged from 0.4865 to 0.6847, a considerably wider spread than the human-created range of 0.7342 to 0.7928. Human-created diagrams also consistently showed tighter clustering, with smaller standard deviations and more stable minimum and maximum values. For example, the correctness scores for the human-generated Deployment diagrams ranged narrowly from 0.7207 to 0.7568, while the LLM equivalents varied more broadly, from 0.6126 to 0.6802.

4.1.2. Inferential Statistics

To assess how differently participants evaluated LLM-assisted diagrams compared to human-created ones, we conducted both paired t-tests and Wilcoxon signed-rank tests. These tests compared human and LLM scores given by the same group of participants for each UML diagram type. Although our survey collected 121 individual responses, the aggregated scores were calculated for each element (e.g., Methods, Notations, Classes, Inheritance, etc.). Since the number of elements per diagram was relatively small ( N = 4 –6), we combined the correctness and completeness scores to increase power and perform an overall comparison between human-created and LLM-assisted diagrams. The resulting sample sizes still remained modest ( N = 8 –12), limiting the reliability of the t-test alone due to the assumption of normality. To address this, we included a supplementary test—the Wilcoxon signed-rank test. This is a nonparametric alternative that does not assume normality, and is therefore more robust for small samples or in cases where the normality assumption may be violated.
Table 3 and Table 4 show the results of these tests. We also include the standardized effect sizes (Cohen’s d) to assess the size of the difference between the human and LLM completeness and correctness scores. The larger the value, the greater the difference between their standardized means.
Across the four types of UML diagrams, LLM-assisted diagrams received significantly lower scores than their human-created counterparts. The most pronounced difference appeared in the Use Case diagrams. The average completeness and correctness scores for the LLM-assisted versions were considerably lower, with a very large effect size ( d = 4.68 ) and a Wilcoxon test result of W = 0.0000 ( p = 0.0039 ), meaning that almost every participant rated the LLM version lower than the human one.
A similar pattern was found in the Class diagrams, where LLM-assisted UML output received lower average scores and had higher variability. The paired t-test indicated a strong effect ( d = 2.96 , p < 0.001), while the Wilcoxon test again yielded W = 0.0000 (p < 0.001), reflecting unanimous lower scores for the LLM-assisted diagrams.
In the case of the Deployment diagrams, the LLM version was also consistently scored lower ( d = 3.04 , p < 0.001), though the magnitude of difference was slightly less than that for the previous two types. The Wilcoxon test still confirmed this pattern (p = 0.0078), indicating a clear preference for the human-created version.
Even in the Sequence diagram, where the performance gap was smallest, the LLM-assisted diagram was unable to match the quality of the human one. The effect size remained large ( d = 2.17 ), and the Wilcoxon test again reported W = 0.0000 (p = 0.0078), showing that all participants favored the human diagram.
These results are visually summarized in Figure 3. In each UML diagram type, the scores for the LLM-assisted diagrams are lower and more spread out. This pattern is most evident in the Class and Use Case diagrams, where a large visual difference can be observed and the box plots for the LLM-assisted diagrams have much longer tails.

4.2. Comparing LLM-Assisted Diagrams with Human-Created Diagrams

To further explore how LLM-assisted diagrams underperformed, and to more comprehensively answer our research questions, we visualized the completeness and correctness scores for each UML diagram. Figure 4, Figure 5, Figure 6 and Figure 7 show a side-by-side comparison of the completeness and correctness scores for each element for each UML diagram type. The x-axis represents the elements, and the y-axis represents the completeness or correctness score for all diagrams in this section.

4.2.1. Class Diagrams

Addressing RQ1, Figure 4 shows that LLM-assisted Class diagrams demonstrated moderately close performance to that of human-created diagrams, particularly in representing basic classes and inheritance. However, noticeable gaps emerged in methods (0.77 vs. 0.57) and visibility (0.73 vs. 0.49), suggesting that while LLMs could model structural elements reasonably well, they had greater difficulty in capturing functional behaviors and access control. Overall, the results show that LLMs can approximate human-created Class diagrams to a meaningful degree, but still fall short in terms of more nuanced features.

4.2.2. Deployment Diagrams

Figure 5 answers RQ2 and shows that LLMs achieved relatively strong performance in Deployment diagrams. Scores for core elements such as nodes and artifacts were only 5–6 percentage points below those of human-created diagrams, indicating that the LLMs could effectively replicate the main architectural aspects of this type of diagram. Some differences remained in modeling relationships and communication paths, where correctness scores were lower (0.64 and 0.61, respectively), suggesting that while LLMs closely approximate human deployment modeling in terms of static elements, further improvements are needed to holistically capture dynamic elements.

4.2.3. Use Case Diagrams

To answer RQ3, Figure 6 shows that the Use Case diagram posed the greatest challenge for LLMs. Although they were able to approximate basic actor and use case labeling to some extent, larger discrepancies appeared in links (0.78 vs. 0.60) and generalized relationship structures (0.82 vs. 0.64). These results suggest that LLMs have more difficulty modeling hierarchical relationships and interaction flows.

4.2.4. Sequence Diagrams

As relating to RQ4, the Sequence diagram results (Figure 7) showed the highest degree of alignment between LLM-assisted and human-created diagrams. Completeness scores for key elements like actors and messages differed by as little as 5 percentage points, suggesting that LLMs were highly capable of capturing the basic interaction structure. Minor gaps remained in correctness, particularly in message order (0.73 vs. 0.63) and notations (0.75 vs. 0.66). The results demonstrate that LLMs can closely replicate human-created Sequence diagrams better than other types of diagrams.
Importantly, from the structural perspective of UML modeling, the consistent patterns in student feedback imply that Deployment diagrams are interpreted as architectural manifestations of the class structure. This relationship is pedagogically relevant and statistically supported, emphasizing that effective UML modeling requires coherence between the internal structure of a system, the Class diagram, and its physical realization, the Deployment diagram. Furthermore, from the behavioral perspective of UML modeling, these findings indicate that learners inherently recognize the functional linkage between use case scenarios and their realization in Sequence diagrams, as they concretize the temporal interactions and message flows required to fulfill the abstract functionalities captured in the Use Case diagram. Thus, Sequence diagrams serve as operational extensions of Use Case diagrams, and this relationship is both learning-centered and grounded in statistical data.

4.3. Validation of the Proposed Approach

To validate the proposed approach, we benchmark our findings against those reported in a recent study by Wang et al. [27], which involved 45 undergraduate students, in one institution, using GPT-3.5/GPT-4 to generate UML diagrams for a predefined scenario. Notably, their study was limited to assessing correctness. In contrast, our study aimed to evaluate both completeness and correctness through a survey conducted with 121 undergraduate and graduate students, across three universities, who had completed one or more software engineering courses. With respect to the adapted type of shots in training the LLMs, study [27] used few-shot example-based prompting (three examples for each modeling task) for GPT-3.5/GPT-4, combined with template-based dynamic prompting for iterative refinement by students. In contrast, this study considers a single zero-shot prompt that was fed into GPT-4-turbo to visualize a single problem domain (iCoot Car Rental System). The observed differences in correctness values stem from the variation in the number of shots for prompts and the evaluation method. Compared with the approach in [27], our findings show correctness scores of 61.1% vs. 64.4% for Class diagrams, 66.2% vs. 74.8% for Sequence diagrams, and 64.2% vs. 59.4% for Use Case diagrams. While our original comparison with Wang et al. [30] focused on raw performance percentages, we now expand this discussion to highlight key methodological divergences. Wang et al. employed few-shot prompting, where students refined prompts iteratively based on intermediate outputs. In contrast, our study used zero-shot prompting with no student intervention. This difference likely contributed to their higher correctness score for Sequence diagrams (74.8% vs. our 68.3%), as iterative feedback and prompt tuning could help to refine model outputs.
Another distinction lies in the evaluation metrics. Wang et al. assessed only correctness, whereas our study introduced an additional metric, completeness, which captures whether all essential elements were generated. This dual-metric approach provides a broader assessment of model performance. Notably, our correctness score for Use Case diagrams (64.2%) slightly outperformed that of Wang et al. (61.7%), possibly due to our emphasis on completeness enforcement and a more constrained scenario specification.
These differences underscore a critical point: LLM performance evaluations are highly sensitive to prompt design, scenario framing, and evaluation criteria. Our results suggest that completeness validation and strict prompt engineering can lead to more holistic, but not necessarily higher, correctness scores. Therefore, future work should carefully consider these methodological levers when benchmarking LLM performance in software engineering tasks.

5. Discussion

This study introduces an empirical evaluation to investigate the capabilities of GPT-4-turbo in assisting with UML modeling with the involvement of students in an educational environment. The survey results reflect subjective student evaluations based on their prior UML modeling skills and background. The use of zero-shot prompts along within the problem domain influenced the evaluation results of the UML diagrams. As both types of diagrams were provided for students in the survey, students only evaluated these diagrams without any involvement in the prompt. This approach increased cognitive load by requiring them to assess LLM-assisted diagrams without prior examples, depending on their existing UML knowledge and skills. Such evaluation eliminated variability from the iterative refinements, and also highlighted gaps in their evaluation. This aligns with [31] findings on the effectiveness of integrating AI tools into software engineering education to support defect prediction and analytical skill development.
The findings provide critical insights into the current and potential drawbacks of LLM-assisted UML modeling. The results clearly demonstrate that GPT-4-turbo exhibits superior ability to translate the textual descriptions into UML codes. Nevertheless, after converting such codes to visual models, the resulting diagrams vary in matching the completeness and correctness of human-created UML diagrams. This can be attributed to differences in diagram type and the complexity of system requirements. For example, the LLM-created Class and Use Case diagrams showed less similarity to human-created ones because they require deeper domain logic modeling, as well as involving complex relationships—inheritance, aggregation, composition, and multiplicities in Class diagrams, and the inclusion and extension of relationships in Use Case diagrams. Consequently, LLMs struggle with such precise relationships, leading to them miscapturing them or even providing incorrect representations. In contrast, Deployment and Sequence diagrams show stronger alignment, since such diagrams focus more on flow-based structure, and they show linear interactions among objects in Sequence diagrams, or mapping between software artifacts and hardware nodes in Deployment diagrams. Quantitatively, such gaps were validated through statistical differences in the completeness and correctness scores for the LLM-assisted and human-created diagrams, as proved by both the paired t-test and Wilcoxon signed-rank test. The significant findings carry notable academic and practical significance in the era of software engineering. In educational contexts, LLMs can act as essential learning tool to help learners in understanding basic UML modeling. But, this requires post-generation validation of the intended prompts. Consequently, this emphasizes the essential need of hybrid human–LLM collaboration in educational and practical applications. This student-centered engagement model mirrors the ’AI as a Partner in Learning’ framework, where students are treated as active co-learners in AI-augmented education environments [32]. It is also important to note that the evaluation of UML diagram quality was subjective and potentially influenced by the varying UML proficiency levels among students. Participants with stronger UML backgrounds may have applied stricter evaluation criteria or more easily identified semantic or syntactic errors, while less experienced students might have overlooked certain issues. This variation introduces the possibility of evaluator bias that could affect the reliability of the ratings and the observed scores across diagrams.

6. Limitations and Future Work

This study exclusively focused on GPT-4-turbo, due to its wide accessibility, strong general reasoning performance, and familiarity to most students participating in the evaluation. While this model provides a robust baseline for evaluating LLM-driven UML diagram generation, we recognize that its single-model scope is a significant limitation. Notably, other leading Large Language Models (LLMs), such as Google Gemini and GitHub 3.4.21 Copilot, offer different capabilities that may influence modeling outcomes.
Another key limitation of our study is its reliance on a single problem domain—the iCoot Car Rental System. While this domain is widely used in software engineering education and familiar to most students, focusing exclusively on it restricts the generalizability of our findings. LLMs may exhibit different behavior when tasked with UML modeling for other domains such as healthcare systems, educational platforms, or e-commerce services. As a result, future research should replicate this study across multiple problem domains to assess the consistency of completeness and correctness metrics and to strengthen the external validity of the findings. Cross-domain testing will help to determine whether the performance patterns observed here are model-specific
This study did not include interactive learning tasks. However, we agree that allowing students to refine prompts or correct LLM-generated diagrams could promote deeper learning. We see strong potential in designing future experiments where students actively engage in improving or validating outputs. Also, this study did not explicitly analyze prompt complexity for different UML diagram types, but it offers valuable insights into how varying diagram complexities affect LLM-assisted generation performance. Future research could explore metrics like constraint counts, prompt length, and error types to more systematically measure prompt complexity. An important direction for future research involves the integration of feedback loops and self-correction mechanisms into LLM-based UML diagram generation. Current models like GPT-4-turbo lack the ability to autonomously detect and revise constraint violations, which contributes to the correctness gaps observed in our study.
A further limitation concerns the evaluator population. Our assessment relied on student participants with heterogeneous levels of UML expertise. This diversity introduced potential bias in the evaluation process, as more knowledgeable students may have judged diagrams more rigorously than their less-experienced peers. The inclusion of expert evaluations would deepen the analysis of syntactic and semantic issues in LLM-generated UML diagrams. The current study focuses on student-centric perspectives to assess the pedagogical utility of LLMs in educational settings. However, we acknowledge the value of professional modelers’ insights for a more comprehensive evaluation. To address this, future work will incorporate evaluations from industry professionals and domain experts to establish a more stable benchmark for LLM-generated UML quality. This will also allow us to examine how evaluation criteria vary across levels of UML proficiency.
GitHub Copilot, which is derived from OpenAI’s Codex and optimized for code completion, may handle syntactic structures and technical keywords in UML modeling prompts differently from GPT-4-turbo. In contrast, Gemini is designed to compete directly with GPT-4 across multimodal and reasoning tasks, potentially yielding more accurate or semantically rich outputs. In future work, we plan to replicate this study using Gemini and Copilot to compare their performance across the same UML diagram types and task formulations. A cross-model comparative evaluation will help to clarify whether the trends observed in this study, especially in completeness and correctness metrics, hold across LLMs or are specific to GPT-4-turbo’s architecture and training data.
Finally, GPT-4-turbo was chosen, in part, because it is readily available via open access channels (e.g., ChatGPT) and familiar to most students participating in the evaluation. However, this choice may have inadvertently biased the results in favor of a model that students had had prior exposure to. This trade-off underscores the need for broader LLM benchmarking in future empirical studies.
Automating prompt generation based on requirement documents would enhance scalability. In our future work, we plan to develop a semi-automated or fully automated mechanism using NLP and machine learning techniques. This will help to streamline prompt creation while maintaining completeness and correctness through our existing validation framework. Also, since students evaluated the diagrams without participating in the prompt construction or having access to intermediate steps, it is worthy to measure the cognitive load for participating students. Further, exploring sentiments and attitudes toward LLM-generated diagrams is an important future direction. This evaluation framework holds potential for broader adoption in both educational and industrial contexts.

7. Conclusions

In conclusion, this study provides a comprehensive evaluation of the capability of LLMs, particularly GPT-4-turbo, in generating UML diagrams. Empirical findings, supported by participant surveys and rigorous statistical analyses, highlight the pedagogical potential of LLMs as supplementary tools in software engineering education, but emphasize the need for human intervention to address such limitations. Particularly, LLM-assisted generated diagrams achieved completeness and correctness scores of 65%, 61.1% for Class diagrams, 65.9%, 64.3% for Deployment diagrams, 67.1%, 64.2% for Use Case diagrams, and 67.7%, 66.2% for Sequence diagrams. Across all the explored diagram types, LLM-assisted diagrams underperformed compared to human-created diagrams, with statistically significant differences confirmed by paired t-tests and Wilcoxon signed-rank tests p < 0.001, and effect sizes > 2.0. While the findings offer valuable insights into the use of LLMs for UML diagram generation, this study is limited by its focus on a single domain, a single model (GPT-4-turbo), and the use of student evaluators. These factors constrain the generalizability of the results and highlight the need for further validation in broader and more professional contexts. We note that the inferential statistical tests (paired t-test and Wilcoxon signed-rank) were conducted on aggregated correctness and completeness scores. This decision was made to increase the effective sample size per diagram type, given the limited number of elements per category (typically 4–6). However, we acknowledge that this approach combines distinct aspects of UML quality and may introduce confounding effects. Therefore, the reported effect sizes, while statistically valid, should be interpreted with caution, as they represent an amalgamation of structural (correctness) and content (completeness) dimensions.

Author Contributions

Conceptualization, B.A.-A., A.A. and O.M.; Methodology, B.A.-A., A.A. and O.M.; Software, N.S.; Validation, B.A.-A. and A.A.; Formal analysis, B.A.-A., A.A., O.M. and N.S.; Investigation, B.A.-A. and O.M.; Resources, O.M.; Data curation, B.A.-A., A.A., O.M. and N.S.; Writing—original draft, B.A.-A., A.A. and N.S.; Writing—review & editing, N.S.; Supervision, B.A.-A. All authors have read and agreed to the published version of the manuscript.

Funding

This research received no external funding.

Institutional Review Board Statement

The study was conducted according to the guidelines of the Declaration of Helsinki, and approved by the Institutional Review Board of Office of Research and Sponsored Programs St. Cloud State University (70631957 2025-05-29).

Informed Consent Statement

Informed consent was obtained from all subjects involved in the study.

Data Availability Statement

The survey that is associated with this research is publicly available at the following link: https://stcloudstate.co1.qualtrics.com/jfe/preview/previewId/dfc5d925-2ad5-45a5-bb15-58fdddf1a726/SV_5nnytbBTaEYlaKi?Q_CHL=preview&Q_SurveyVersionID=current accessed on 22 May 2025.

Acknowledgments

We gratefully acknowledge the valuable participation of the students who contributed their time and insights to this survey. Their input was instrumental in advancing our research. We also extend our sincere appreciation to the academic staff at Saint Cloud State University, Southern Illinois University Carbondale, and University of Wisconsin—Green Bay for their support, whose collaboration and encouragement made this work possible.

Conflicts of Interest

The authors declare no conflicts of interest.

Abbreviations

LLMsLarge Language Models
UMLUnified Modeling Language
GPTGenerative Pre-trained Transformer
SDLCSoftware Development Lifecycle
NLPNatural Language Processing
CRCompleteness Ratio
CSConstraint Satisfaction
SRSystem Requirement
SRSSoftware Requirements Specification

Appendix A. Class Diagram

Figure A1. Human-created Class diagram.
Information 16 00565 g0a1
Figure A2. LLM-assisted Class diagram.
Information 16 00565 g0a2
Class Diagram Prompt: iCoot Car Rental System
Instruction: Generate a complete and correct UML Class Diagram for the iCoot Car Rental System.
You are a software analyst. From the following domain description, extract all relevant UML Class Diagram components. Ensure the diagram includes:
  • All relevant classes (e.g., entities and domain objects),
  • All relationships between classes (associations, generalizations, aggregations),
  • Explicit multiplicities on each relationship (e.g., 1..*, 0..1),
  • Class attributes and operations where appropriate.
Use correct UML notation. Apply inheritance for specialization (e.g., Member, NonMember), and use aggregation where appropriate (e.g., between CarModel and Car).
System Description:
The iCoot Car Rental System revolves around Customer, who may be either Member or NonMember.
  • Members have an InternetAccount, CreditCard, and Address, and they can reserve and rent cars.
  • NonMembers do not have InternetAccounts but can still make rentals and reservations.
  • Rental represents agreements involving one or more Car instances. Each Car links to CarDetails (e.g., Make).
  • CarModel represents a type of car, associated with many Car instances, and connects to CarModelDetails, Category, and Vendor.
  • Reservations are created by Members for CarModels.
    UML Modeling Rules Followed
    Inheritance: CustomerMember, NonMember
    Aggregation/Composition: CarModelCar; MemberCreditCard, Address, InternetAccount
    Associations:
    CustomerRental
    ReservationCarModel
    RentalCar
    CarModelCategory, Vendor, CarModelDetails
    Multiplicities: A CarModel has many Cars; a Member may have one or more CreditCards
    Attributes and Methods: Include fields like ReservationDate, RentalDuration, Make; methods such as reserveCar(), cancelReservation()
Rule-Based Validation
To assess the effectiveness of prompt-engineered UML Class diagrams, we applied ( C R ) and ( C S ) validation metrics, as described in Section 3.2. Below are the detailed evaluations for both LLM-assisted and human-created diagrams based on the iCoot Car Rental scenario.
  • LLM-Generated UML Class Diagram
  • Implemented Elements: 19 out of 29
  • Observed Coverage: Included major domain classes such as Customer, Member, Car, and Rental.
  • Missing Elements: Vendor, Category, CarModelDetails, and Make.
  • Satisfied Constraints: 22 out of 33.
  • Strengths: Correct usage of inheritance and multiplicity annotations.
  • Limitations: Lacked precise naming conventions, omitted some aggregations and compositions.
Scores:
CR L L M = 19 29 × 100 = 65.52 %
CS L L M = 22 33 × 100 = 66.67 %
Table A1. Validation of prompt based on rule-based framework.
Rule StepApplied Output
ExtractCriteriaIdentified core classes: Customer, Member, NonMember, Car, CarModel, Reservation, Rental, CreditCard, Address, InternetAccount, Category, Vendor, CarModelDetails.
MapRelationshipsDefined generalization, aggregation, and associations based on domain semantics. Mapped actions like reserve/rent/cancel to operations.
DefineConstraintsAdded multiplicities, role labels, and semantic constraints on class-to-class relationships.
ValidatePromptSatisfied completeness and correctness criteria based on coverage and UML alignment.
  • Human-Generated UML Class Diagram
  • Implemented Elements: 24 out of 29.
  • Observed Coverage: Included nearly all expected elements, including Vendor, Make, CarModelDetails, and Category.
  • Satisfied Constraints: 27 out of 33.
  • Strengths: Correct use of inheritance, composition, aggregation, and multiplicity; improved naming and semantic precision.
Scores:
CR H u m a n = 24 29 × 100 = 82.76 %
CS H u m a n = 27 33 × 100 = 81.82 %
The figures in Table A2 reveal a comparable performance difference between human-generated and LLM-generated UML Class diagrams in terms of both completeness and correctness metrics.
Table A2. Evaluation summary: LLM vs. human UML Class diagrams.
SourceImplemented ElementsCR (%)Satisfied ConstraintsCS (%)
LLM-Generated19/2965.52%22/3366.67%
Human-Generated24/2982.76%27/3381.82%
The LLM-generated diagram achieved a completeness score of 65.52%, indicating that it contained approximately two-thirds of the domain-sound elements defined in the prompt. While it successfully modeled central concepts such as Customer, Member, Rental, and Car, it left out important supporting entities such as Vendor, Make, CarModelDetails, and Category. These omissions significantly affect the semantic coverage of the generated diagram, constraining its capability to represent the true business domain of the iCoot Car Rental System.

Appendix B. Deployment Diagram

Figure A3. Human-created Deployment diagram.
Information 16 00565 g0a3
Deployment Diagram Prompt: iCoot Car Rental System
Generate a UML Deployment Diagram for the iCoot Car Rental System that:
  • Focuses on the physical deployment architecture of the system across clients, application servers, and database servers.
  • Shows relationships between nodes (CootHTMLClient, CootServer, DBServer), deployed artifacts (cootschema.ddl, icoot.ear, iCoot folder), and runtime components (WebServer, CootBusinessServer, DBMS).
  • Includes:
    • Two DBServer nodes hosting DBMS and cootschema.ddl.
    • Two CootServer nodes hosting WebServer and CootBusinessServer, with deployment of icoot.ear and iCoot folder.
    • Web-based access from CootHTMLClient nodes to WebServer via HTTP.
    • Internal communication between WebServer and CootBusinessServer.
    • Communication between CootBusinessServer and DBMS.
  • Follows UML 2.5 deployment diagram conventions with proper node-artifact and node-component mappings.
  • Emphasizes modularity, fault tolerance (via duplication), and clarity in deployment layers (presentation, application, and data tiers).
Additional requirements:
  • Notation: PlantUML or UML 2.5-compliant tools.
  • Detail level: Fully detailed, including all deployment artifacts and communication paths.
  • Special considerations:
    Show all nodes (CootHTMLClient, CootServer1/2, DBServer1/2) distinctly.
    Include multiplicity (* for clients).
    Omit low-level protocol specifications unless explicitly defined.
Follow-up Instructions:
  • Expand the diagram to include fault tolerance annotations.
  • Add a LoadBalancer node between clients and WebServers.
  • Show communication types (e.g., HTTP, internal/proprietary).
  • Verify deployment relationship correctness between artifacts and nodes/components.
  • Optimize layout for a horizontal three-tier architecture.
Rule-Based Validation
To assess the effectiveness of both human and LLM-assisted UML Deployment diagrams, we applied the validation metrics of completeness rate (CR) and correctness score (CS). Below are the detailed results based on the iCoot deployment architecture.
  • LLM-Generated UML Deployment Diagram
  • Implemented Elements: 18 out of 18.
  • Observed Coverage: All major nodes, execution environments, and artifacts included.
  • Missing Constraints: Lacked full UML stereotypes (e.g., «device», «execution environment»), no «manifest» usage.
  • Satisfied Constraints: 21 out of 26.
  • Strengths: Clear three-tier layout, full redundancy modeling, artifact deployment clarity.
  • Limitations: Missing UML annotations (e.g., stereotypes), minor layout inconsistency.
Figure A4. LLM-assisted Deployment diagram.
Information 16 00565 g0a4
Table A3. Validation of Deployment diagrams based on rule-based framework.
Rule StepApplied Output
ExtractComponentsIdentified nodes and environments: CootHTMLClient, CootServer, and DBServer, with execution environments like WebServer, CootBusinessServer, and DBMS.
MapRelationshipsMapped inter-node communication (e.g., HTTP, internal links), deployment of artifacts (e.g., icoot.ear, cootschema.ddl), and WebServer → BusinessServer interactions.
DefineConstraintsIncluded deployment semantics, replicated nodes for reliability, layered structure (client → app → data), and use of artifacts per UML standard.
ValidatePromptCompared against UML 2.5 structure; evaluated for completeness (elements, relationships) and correctness (notation, stereotypes).
  • Scores:
CR L L M = 18 18 × 100 = 100 %
CS L L M = 21 26 × 100 = 80.77 %
  • Human-Generated UML Deployment Diagram
  • Implemented Elements: 14 out of 18.
  • Observed Coverage: Core layers present, but no node redundancy; partial client-side representation.
  • Satisfied Constraints: 24 out of 26.
  • Strengths: Accurate UML stereotypes, manifest usage, well-formed internal structure.
  • Limitations: Missing replicated nodes (no DBServer2 or CootServer2), lacks scalability representation.
Scores:
CR H u m a n = 14 18 × 100 = 77.78 %
CS H u m a n = 24 26 × 100 = 92.31 %
The results in Table A4 reveal a complementary contrast between the LLM and human outputs. The LLM-generated diagrams achieved perfect completeness by including all deployment artifacts, replicated servers, and client tiers. However, they fell short in formal UML syntax, missing critical stereotypes and semantic decorators. Their correctness score reflects these syntactic gaps.
Table A4. Evaluation summary: LLM vs. human UML Deployment diagrams.
SourceImplemented ElementsCR (%)Satisfied ConstraintsCS (%)
LLM-Generated18/18100.00%21/2680.77%
Human-Generated14/1877.78%24/2692.31%
In contrast, the human-generated diagram attained a very high correctness score, emphasizing adherence to the UML 2.5 specification with appropriate stereotypes, manifest blocks, and well-structured component packaging. However, the absence of redundancy nodes like CootServer2 and DBServer2 penalized its completeness score.
The discrepancy in Table A4 arises from the different strengths of LLMs and human modelers. The LLM-generated Deployment diagrams achieved 100% completeness because it included all required elements, including redundancy and artifacts. However, it scored lower on correctness due to missing UML-specific syntax and stereotypes (e.g., «device», «execution environment»). In contrast, the human-created diagrams prioritized notational accuracy and semantic precision, resulting in a higher correctness score (92%) but lower completeness (78%) due to omitted elements like duplicated nodes. Humans apply deeper syntactic and semantic precision, highlighting the complementary nature of LLM–human collaboration in educational contexts. Additionally, justification is provided in the Appendix, as it appears in equations for the completeness ratio and correctness—CR and CS. These findings illustrate that while LLMs excel in structural breadth and layout generation, human modelers outperform them in semantic precision and notational discipline. A combined workflow using LLM-generated scaffolding followed by human UML review may yield the best modeling outcomes.

Appendix C. Use Case Diagram

Use Case Diagram Prompt: iCoot Car Rental System
Instruction: Generate a complete and correct UML Use Case Diagram for the iCoot Car Rental System, based on the functional description provided below.
Requirements:
  • Include all relevant actors: Customer, Member, NonMember, Assistant.
  • Apply generalization between actors (e.g., CustomerMember, NonMember).
  • Include all use cases, including:
    • Public services: dex (U1), Search CarModels (U4), View CarModel Results (U2), View CarModel Details (U3)
    • Member-only services: Log On (U5), Log Off (U12), Make Reservation (U7), Cancel Reservation (U11), Check Membership Details (U6), Change Password (U9), View Reservations (U10), View Rentals (U8)
    • Other: Look for CarModels (U13), Move Cars (Assistant only)
  • Represent all relationships between use cases:
    • Use «include» for shared sub-behaviors (e.g., U1 and U4 include U2)
    • Use «extend» for optional or conditional behavior (e.g., U3 extends U2)
    • Use generalization (e.g., U13 generalizes U1 and U4)
    • Use constraints and preconditions when relevant (e.g., reservation must follow viewing CarModel details)
  • Enclose all use cases in a system boundary labeled iCoot.
  • Follow UML 2.5 notation conventions: actors outside boundary, use cases as ovals, arrows for relationships.
Scenario Description: Any Customer can look for CarModels by browsing the CarModel Index (U1) or by Searching (U4). The search filters by categories, makes, or engine sizes. Both browsing and searching include a shared result view (U2), after which the customer may optionally view detailed information about specific CarModels (U3). These actions are all forms of Looking for CarModels (U13).
A Customer who logs in as a Member (via U5) gains access to services including: Make Reservation (U7), Cancel Reservation (U11), Check Membership Details (U6), Change Password (U9), View Reservations (U10), View Rentals (U8), and Log Off (U12).
To perform Make Reservation (U7), the Member must be viewing CarModel details. To cancel a reservation (U11), the Member must be viewing outstanding reservations. NonMembers cannot reserve, even if they view model details. Assistants help manage physical Car movement related to reservations.
Additional Requirements:
  • Notation: UML 2.5 compliant; arrows labeled with «include», «extend», and generalization as needed.
  • Detail Level: High-level use case interaction and specialization logic.
  • Special Considerations: Use conditional arrows only where system rules enforce sequencing (e.g., Reservation requires prior detail viewing).
Figure A5. Human-created Use Case diagram.
Information 16 00565 g0a5
Figure A6. LLM-assisted Use Case diagram.
Information 16 00565 g0a6
Rule-Based Validation
  • LLM-Generated UML Use Case Diagram
  • Implemented Elements: 16 out of 18.
  • Observed Coverage: Covered all key actors and most use cases.
  • Missing Elements: Omitted abstraction of “Look for Car Models” (U13); fewer «extend» relations used.
  • Satisfied Constraints: 22 out of 28.
  • Strengths: Accurate actor generalization, proper naming, and most core use cases shown.
  • Limitations: Lacked a system boundary, missed include/extend richness, and scenario abstraction.
Scores:
CR L L M = 16 18 × 100 = 88.89 %
CS L L M = 22 28 × 100 = 78.57 %
Table A5. Validation of Use Case diagrams based on rule-based framework.
Rule StepApplied Output
ExtractComponentsIdentified actors: Customer, Member, NonMember, Assistant. Identified use cases: Log On, Make Reservation, Cancel Reservation, Browse, Search, View Results, View CarModel Details, etc.
MapRelationshipsModeled associations between actors and use cases. Applied generalization between Customer, Member, and NonMember. Defined includes («include») and extends («extend») relationships.
DefineConstraintsApplied system boundary, actor–use case mapping constraints, logical grouping, and interaction coverage per domain. Checked for overlapping actor responsibilities and goal-oriented behavior.
ValidatePromptEvaluated based on UML completeness (actors, use cases, relationships) and syntactic correctness (notation, use of stereotypes, boundary box).
  • Human-Generated UML Use Case Diagram
  • Implemented Elements: 18 out of 18.
  • Observed Coverage: All actors, use cases, and abstract/generalized goals (e.g., U13: Look for Car Models).
  • Satisfied Constraints: 26 out of 28.
  • Strengths: Rich use of «include» and «extend», clear boundary, correct generalization, scenario modularity.
  • Limitations: Minor clutter in layout (non-impacting correctness).
Scores:
CR H u m a n = 18 18 × 100 = 100.00 %
CS H u m a n = 26 28 × 100 = 92.86 %
The results in Table A6 highlight the comparative strengths of human diagramming for scenario abstraction and modeling fluency. The LLM-generated diagrams scored well in core use case and actor coverage, achieving 88.89% completeness, but lacked structural abstraction and semantic enrichment through «extend» relations and boundary usage.
Table A6. Evaluation summary: LLM vs. human UML Use Case diagrams.
SourceImplemented ElementsCR (%)Satisfied ConstraintsCS (%)
LLM-Generated16/1888.89%22/2878.57%
Human-Generated18/18100.00%26/2892.86%
The human diagrams performed near-perfectly in completeness (100%) and scored higher in correctness (92.86%) by applying generalized actions like Look for Car Models (U13), and explicitly modeling use case reuse through «include» and scenario variants through «extend». Their careful actor–role mapping and detailed modularity demonstrate a stronger understanding of use case semantics and system behavior modeling.
These results again suggest that while LLMs can scaffold functional diagrams reliably, human expertise currently remains superior in translating complex textual scenarios into high-fidelity UML representations.

Appendix D. Sequence Diagram

Figure A7. Human-created Sequence diagram.
Information 16 00565 g0a7
Figure A8. LLM-assisted Sequence diagram.
Information 16 00565 g0a8
Sequence Diagram Prompt: Log Off Functionality
Instruction: Generate a complete and correct UML Sequence Diagram for the Log Off Use Case in the iCoot Car Rental System.
Requirements:
  • Include all relevant actors and objects involved in the scenario: Member, Browser, AuthenticationServlet, AuthenticationServer, MemberHome, Member, InternetAccount.
  • Represent all lifelines and activation bars where applicable.
  • Capture all interaction types, including:
    • Method calls (e.g., logoff(), setSessionId(0))
    • Data transfers (e.g., passing Member ID)
    • Synchronous messages
    • Return messages (e.g., acknowledgment or return values)
  • Ensure the ordering of interactions reflects system behavior accurately.
  • Follow UML 2.5 sequence diagram notation, using arrows, activation rectangles, and dashed return messages where appropriate.
Scenario Description: When a Member actor elects to log off, their Browser sends a logoff() request to the AuthenticationServlet. The servlet retrieves the Member ID from the session and forwards a logoff(id) message to the AuthenticationServer. The server uses the ID to locate the corresponding Member object by querying MemberHome. Once found, the server invokes setSessionId(0) on the Member, which forwards the same request to its associated InternetAccount to store session ID = 0. This signals that the user has logged off. Finally, the Browser redirects the Member to the home page for further interaction.
Additional Requirements:
  • Notation: UML 2.5 or PlantUML-compatible syntax
  • Detail Level: Mid to high-level granularity (no protocol detail)
  • Special Considerations: Clearly separate control and data messages, show message flow left-to-right and activation scopes correctly.
Rule-Based Validation
  • LLM-Generated UML Sequence Diagram
  • Implemented Elements: 12 out of 14.
  • Observed Coverage: Included major objects and messages for the logoff scenario.
  • Missing Elements: Some unclear labels (e.g., “store session as 0”), absent activation bars.
  • Satisfied Constraints: 19 out of 24.
  • Strengths: Good message ordering, full lifeline inclusion, and coverage of all involved actors.
  • Limitations: Mixed semantic annotations (textual labels vs. methods), lacks activation semantics, missing interaction fragment constructs.
Scores:
CR L L M = 12 14 × 100 = 85.71 %
CS L L M = 19 24 × 100 = 79.17 %
Table A7. Validation of Sequence diagrams based on rule-based framework.
Rule StepApplied Output
ExtractComponentsIdentified lifelines: Member, Browser, AuthenticationServlet, AuthenticationServer, MemberHome, InternetAccount.
MapRelationshipsModeled message flows such as logoff(), retrieveMember(), setSessionId(0). Captured synchronous and return messages between components.
DefineConstraintsValidated ordering of messages, logical grouping of synchronous vs. asynchronous calls, inclusion of return messages, and correct use of activation bars.
ValidatePromptAssessed for proper UML 2.x notation, completeness of flow, and coverage of the "logoff" use case scenario based on system description.
  • Human-Generated UML Sequence Diagram
  • Implemented Elements: 14 out of 14.
  • Observed Coverage: Full logoff interaction sequence modeled clearly.
  • Satisfied Constraints: 22 out of 24.
  • Strengths: Clear lifelines, activation bars, correct synchronous calls, consistent use of UML notation.
  • Limitations: Slight diagram compactness (layout), missing guard or alt fragments for edge cases (e.g., failed session retrieval).
Scores:
CR H u m a n = 14 14 × 100 = 100.00 %
CS H u m a n = 22 24 × 100 = 91.67 %
The results in Table A8 highlight the strengths and weaknesses of LLM-generated vs. human-generated sequence diagrams. While the LLM successfully covered the core system flow and participants for the logoff interaction, it fell short in applying proper UML activation bars and reusing clear method call syntax throughout. Human-generated diagrams scored better in correctness, particularly due to full compliance with sequence diagram semantics and consistent visual structure.
Table A8. Evaluation summary: LLM vs. human UML Sequence diagrams.
SourceImplemented ElementsCR (%)Satisfied ConstraintsCS (%)
LLM-Generated12/1485.71%19/2479.17%
Human-Generated14/14100.00%22/2491.67%
These observations suggest that LLMs are effective in approximating communication flows, but still require refinement in expressing formal interaction constructs such as fragments, alt conditions, and execution focus markers. In high-assurance modeling tasks, human refinement remains essential for achieving high-fidelity UML specifications.

References

  1. Gao, C.; Hu, X.; Gao, S.; Xia, X.; Jin, Z. The Current Challenges of Software Engineering in the Era of Large Language Models. Acm Trans. Softw. Eng. Methodol. 2024, 34, 1–30. [Google Scholar] [CrossRef]
  2. Liu, J.; Xia, C.S.; Wang, Y.; Zhang, L. Is your code generated by chatgpt really correct? rigorous evaluation of large language models for code generation. Adv. Neural Inf. Process. Syst. 2023, 36, 21558–21572. [Google Scholar]
  3. Vaithilingam, P.; Zhang, T.; Glassman, E.L. Expectation vs. experience: Evaluating the usability of code generation tools powered by large language models. In Proceedings of the Chi Conference on Human Factors in Computing Systems Extended Abstracts, New Orleans, LA, USA, 29 April–5 May 2022; pp. 1–7. [Google Scholar]
  4. Ahmad, A.; Waseem, M.; Liang, P.; Fahmideh, M.; Aktar, M.S.; Mikkonen, T. Towards human-bot collaborative software architecting with chatgpt. In Proceedings of the 27th International Conference on Evaluation and Assessment in Software Engineering, Oulu, Finland, 14–16 June 2023; pp. 279–285. [Google Scholar]
  5. Zimmermann, D.; Koziolek, A. Automating gui-based software testing with gpt-3. In Proceedings of the 2023 IEEE International Conference on Software Testing, Verification and Validation Workshops (ICSTW), Dublin, Ireland, 16–20 April 2023; IEEE: Piscataway, NJ, USA, 2023; pp. 62–65. [Google Scholar]
  6. Ozkaya, M.; Erata, F. A survey on the practical use of UML for different software architecture viewpoints. Inf. Softw. Technol. 2020, 121, 106275. [Google Scholar] [CrossRef]
  7. Gamage, M.Y.L. Automated Software Architecture Diagram Generator Using Natural Language Processing. Bachelor’s Thesis, University of Westminster, Westminster, UK, 2023. [Google Scholar]
  8. Carvalho, G.; Dihego, J.; Sampaio, A. An integrated framework for analysing, simulating and testing UML models. In Formal Methods: Foundations and Applications, Proceedings of the Brazilian Symposium on Formal Methods, Vitória, Brazil, 4–6 December 2024; Springer: Berlin/Heidelberg, Germany, 2024; pp. 86–104. [Google Scholar]
  9. Ambler, S.W. The Elements of UML (TM) 2.0 Style; Cambridge University Press: Cambridge, UK, 2005. [Google Scholar]
  10. Chen, Z.; Wang, C.; Sun, W.; Yang, G.; Liu, X.; Zhang, J.M.; Liu, Y. Promptware Engineering: Software Engineering for LLM Prompt Development. arXiv 2025, arXiv:2503.02400. [Google Scholar]
  11. Pornprasit, C.; Tantithamthavorn, C. Fine-tuning and prompt engineering for large language models-based code review automation. Inf. Softw. Technol. 2024, 175, 107523. [Google Scholar] [CrossRef]
  12. Liu, M.; Wang, J.; Lin, T.; Ma, Q.; Fang, Z.; Wu, Y. An empirical study of the code generation of safety-critical software using llms. Appl. Sci. 2024, 14, 1046. [Google Scholar] [CrossRef]
  13. Boukhlif, M.; Kharmoum, N.; Hanine, M.; Kodad, M.; Lagmiri, S.N. Towards an Intelligent Test Case Generation Framework Using LLMs and Prompt Engineering. In Proceedings of the International Conference on Smart Medical, IoT & Artificial Intelligence; Springer: Berlin/Heidelberg, Germany, 2024; pp. 24–31. [Google Scholar]
  14. Ferrari, A.; Abualhaija, S.; Arora, C. Model Generation from Requirements with LLMs: An Exploratory Study. arXiv 2024, arXiv:2404.06371. [Google Scholar]
  15. Cámara, J.; Troya, J.; Burgueño, L.; Vallecillo, A. On the assessment of generative AI in modeling tasks: An experience report with ChatGPT and UML. Softw. Syst. Model. 2023, 22, 781–793. [Google Scholar] [CrossRef]
  16. De Vito, G.; Palomba, F.; Gravino, C.; Di Martino, S.; Ferrucci, F. Echo: An approach to enhance use case quality exploiting large language models. In Proceedings of the 2023 49th Euromicro Conference on Software Engineering and Advanced Applications (SEAA), Durres, Albania, 6–8 September 2023; IEEE: Piscataway, NJ, USA, 2023; pp. 53–60. [Google Scholar]
  17. Herwanto, G.B. Automating Data Flow Diagram Generation from User Stories Using Large Language Models. In Proceedings of the 7th Workshop on Natural Language Processing for Requirements Engineering, Winterthur, Switzerland, 8 April 2024. [Google Scholar]
  18. Hou, X.; Zhao, Y.; Liu, Y.; Yang, Z.; Wang, K.; Li, L.; Luo, X.; Lo, D.; Grundy, J.; Wang, H. Large language models for software engineering: A systematic literature review. ACM Trans. Softw. Eng. Methodol. 2024, 33, 1–79. [Google Scholar]
  19. Hussein, D. Usability of LLMs for Assisting Software Engineering: A Literature Review. Bachelor’s Thesis, Universität Bonn, Bonn, Germany, 2024. [Google Scholar]
  20. Lorenzo, C. Integrating large language models for real-world problem modelling: A comparative study. In Proceedings of the INTED2024 Proceedings, IATED, Valencia, Spain, 4–6 March 2024; pp. 3262–3272. [Google Scholar]
  21. Nifterik, S.v. Exploring the Potential of Large Language Models in Supporting Domain Model Derivation from Requirements Elicitation Conversations. Master’s Thesis, Utrecht University, Utrecht, The Netherlands, 2024. [Google Scholar]
  22. Buchmann, R.; Eder, J.; Fill, H.G.; Frank, U.; Karagiannis, D.; Laurenzi, E.; Mylopoulos, J.; Plexousakis, D.; Santos, M.Y. Large language models: Expectations for semantics-driven systems engineering. Data Knowl. Eng. 2024, 152, 102324. [Google Scholar] [CrossRef]
  23. Hemmat, A.; Sharbaf, M.; Kolahdouz-Rahimi, S.; Lano, K.; Tehrani, S.Y. Research directions for using LLM in software requirement engineering: A systematic review. Front. Comput. Sci. 2025, 7, 1519437. [Google Scholar] [CrossRef]
  24. Umar, M.A. Automated Requirements Engineering Framework for Model-Driven Development. Ph.D. Thesis, King’s College, London, UK, 2024. [Google Scholar]
  25. Vega Carrazan, P.F. Large Language Models Capabilities for Software Requirements Automation. Ph.D. Thesis, Politecnico di Torino, Torino, Italy, 2024. [Google Scholar]
  26. Al-Shawakfa, E.M.; Alsobeh, A.M.R.; Omari, S.; Shatnawi, A. RADAR#: An Ensemble Approach for Radicalization Detection in Arabic Social Media Using Hybrid Deep Learning and Transformer Models. Information 2025, 16, 522. [Google Scholar] [CrossRef]
  27. Wang, B.; Wang, C.; Liang, P.; Li, B.; Zeng, C. How LLMs Aid in UML Modeling: An Exploratory Study with Novice Analysts. arXiv 2024, arXiv:2404.17739. [Google Scholar]
  28. Conrardy, A.; Cabot, J. From Image to UML: First Results of Image Based UML Diagram Generation Using LLMs. arXiv 2024, arXiv:2404.11376. [Google Scholar]
  29. Chen, K.; Yang, Y.; Chen, B.; López, J.A.H.; Mussbacher, G.; Varró, D. Automated Domain Modeling with Large Language Models: A Comparative Study. In Proceedings of the 2023 ACM/IEEE 26th International Conference on Model Driven Engineering Languages and Systems (MODELS), Västerås, Sweden, 1–6 October 2023; IEEE: Piscataway, NJ, USA, 2023; pp. 162–172. [Google Scholar]
  30. O’docherty, M. Object-Oriented Analysis & Design; John Wiley & Sons: Hoboken, NJ, USA, 2005. [Google Scholar]
  31. Alhazeem, E.; Alsobeh, A.; Al-Ahmad, B. Enhancing Software Engineering Education through AI: An Empirical Study of Tree-Based Machine Learning for Defect Prediction. In Proceedings of the 25th Annual Conference on Information Technology Education (SIGITE ’24), Atlanta, GA, USA, 9–12 October 2024; pp. 153–156. [Google Scholar]
  32. Alsobeh, A.; Woodward, B. AI as a Partner in Learning: A Novel Student-in-the-Loop Framework for Enhanced Student Engagement and Outcomes in Higher Education. In Proceedings of the 24th Annual Conference on Information Technology Education (SIGITE ’23), Wilmington, NC, USA, 11–14 October 2023; pp. 171–172. [Google Scholar]
Figure 1. The proposed methodology.
Information 16 00565 g001
Figure 2. Number of participating students across universities.
Information 16 00565 g002
Figure 3. Score distribution by UML diagram.
Information 16 00565 g003
Figure 4. Human and LLM scores for the Class diagrams.
Information 16 00565 g004
Figure 5. Human and LLM scores for the Deployment Diagrams.
Information 16 00565 g005
Figure 6. Human and LLM scores for the Use Case diagrams.
Information 16 00565 g006
Figure 7. Human and LLM scores for the Sequence diagrams.
Information 16 00565 g007
Table 1. Summary statistics for completeness scores across UML diagrams.
UML DiagramSourceSample Size (N)Mean ( x ¯ )Std. Dev. ( σ )MinMax
ClassHuman60.79880.03220.75680.8288
LLM60.65020.04570.57210.6982
DeploymentHuman40.70050.03720.65770.7432
LLM40.64860.03620.61710.6937
Use CaseHuman50.80720.00870.79280.8153
LLM50.67120.03000.63510.7117
SequenceHuman40.73200.03580.68470.7703
LLM40.67680.01740.65320.6937
Table 2. Summary statistics for correctness scores across UML diagrams.
UML DiagramSourceSample Size (N)Mean ( x ¯ )Std. Dev. ( σ )MinMax
ClassHuman60.76350.02200.73420.7928
LLM60.61110.08540.48650.6847
DeploymentHuman40.73090.01740.72070.7568
LLM40.64300.02790.61260.6802
Use CaseHuman40.80410.02220.77930.8288
LLM40.64190.02980.60360.6757
SequenceHuman40.72640.02450.69370.7523
LLM40.66220.03370.62610.7072
Table 3. Paired t-test results across UML diagram types.
UML DiagramSample Size (N)Degrees of Freedom ( df )t-Statistic (t)p-ValueCohen’s d
Class121110.2576<0.0012.9617
Deployment878.5979<0.0013.0393
Use Case9814.0198<0.0014.6764
Sequence876.3026<0.0012.1703
Table 4. Wilcoxon signed-rank test results across UML diagram types.
UML DiagramSample Size (N)Wilcoxon T-Statistic (W)p-Value
Class120.0000<0.001
Deployment80.00000.0078
Use Case90.00000.0039
Sequence80.00000.0078
Disclaimer/Publisher’s Note: The statements, opinions and data contained in all publications are solely those of the individual author(s) and contributor(s) and not of MDPI and/or the editor(s). MDPI and/or the editor(s) disclaim responsibility for any injury to people or property resulting from any ideas, methods, instructions or products referred to in the content.

