Article

Detection of Wild Mushrooms Using Machine Learning and Computer Vision

by
Christos Chaschatzis
1,
Chrysoula Karaiskou
1,
Chryssanthi Iakovidou
1,
Panagiotis Radoglou-Grammatikis
1,*,
Stamatia Bibi
1,
Sotirios K. Goudos
2 and
Panagiotis G. Sarigiannidis
1
1
Department of Electrical and Computer Engineering, University of Western Macedonia Kozani, 50100 Kozani, Greece
2
Department of Physics, Aristotle University of Thessaloniki, 54006 Thessaloniki, Greece
*
Author to whom correspondence should be addressed.
Information 2025, 16(7), 539; https://doi.org/10.3390/info16070539
Submission received: 13 May 2025 / Revised: 18 June 2025 / Accepted: 18 June 2025 / Published: 25 June 2025

Abstract

The increasing global demand for sustainable and high-quality agricultural products has driven interest in precision agriculture technologies. This study presents a novel approach to wild mushroom detection, particularly focusing on Macrolepiota procera as a focal species for demonstration and benchmarking. The proposed approach utilises unmanned aerial vehicles (UAVs) equipped with multispectral imaging and the YOLOv5 object detection algorithm. A custom dataset, the wild mushroom detection dataset (WOES), comprising 907 annotated aerial and ground images, was developed to support model training and evaluation. Our method integrates low-cost hardware with advanced deep learning and vegetation index analysis (NDRE) to enable real-time identification of mushrooms in forested environments. The proposed system achieved an identification accuracy exceeding 90% and completed detection tasks within 30 min per field survey. Although the dataset is geographically limited to Western Macedonia, Greece, and focused primarily on a morphologically distinctive species, the methodology is designed to be extendable to other wild mushroom types. This work contributes a replicable framework for scalable, cost-effective mushroom monitoring in ecological and agricultural applications.

1. Introduction

The primary production sector has made significant progress in automating and streamlining manufacturing, harvesting, and processing operations in the current industrial era. This has led to improvements in efficiency and reductions in expenses. Furthermore, mushrooms are highly valued for their nutritional properties, including their high levels of vitamins, dietary fibres, and proteins. These properties have been shown to boost the immune system and protect against various forms of cancer [1]. Due to these benefits, there is a growing demand for high-yield, safe harvesting of wild mushrooms. By utilising wild mushroom cultivation techniques, the primary sector can address the challenges of producing and harvesting agricultural goods in a more sustainable manner [2,3].
Despite the abundance of food available in modern society, the sustainability of food production remains a pressing concern. Factors such as limited arable land, inadequate access to water resources, energy consumption, and the impact of climate change, as well as overpopulation, all contribute to this challenge. In particular, the cultivation of mushrooms requires optimal conditions in terms of temperature and humidity, which can be energy-intensive to maintain. As a result, many mushroom growers resort to collecting wild mushrooms from open fields. However, this process can be complex and time-consuming, as correctly identifying mushrooms in forested areas is challenging. To achieve the desired rate of production [4] and level of quality for end customers, new techniques and methods are introduced to implement creative improvements in agricultural practices and reform conventional operations.
The agricultural sector has made significant advancements in automating and enhancing production and processing procedures in the contemporary industrial era. The primary sector has undergone a significant upgrade to new quality standards as a result of the ongoing penetration of high-tech technologies [5], such as unmanned aerial vehicles (UAVs) [6], Robots [7], optimized supply chains, the continuous evolution of computer vision (CV) [8], and the continuous improvement of artificial intelligence (AI) [9] and ensemble learning (EL) [10]. As new approaches are necessary to maintain product quality and sustainability, this problem has grown increasingly widespread in agriculture.
Several cutting-edge AI-enabled technologies and specific implementations based on machine learning (ML) [11], deep learning (DL) [12], and CV paradigms have impacted the agricultural business in terms of product quality assurance. It is crucial to use these modern technologies to identify mushroom cultivations in natural habitats [13].
This study aims to investigate the difficulty of effectively recognising wild mushrooms in forest environments using CV, a combination of AI-based techniques and UAV platforms equipped with RGB and multispectral imaging systems. An updated dataset of Macrolepiota procera mushrooms [14,15] and other wild mushroom species is introduced, along with AI-trained and CV identification methods. The updated mushroom Macrolepiota procera detection dataset (OMPES) [16] is now named the wild mushroom detection dataset (WOES) dataset. The difference between the OMPES dataset and WOES is the increase in ground photographs of Macrolepiota procera mushrooms and other mushroom species.
This study focuses on the detection of Macrolepiota procera mushrooms. However, it acknowledges the significance of identifying other wild mushroom species using probabilistic methods to accomplish a more comprehensive approach to wild mushroom detection. By conducting a thorough examination of the mushrooms’ morphological characteristics, it is possible to accurately identify the species. The primary goal of this research is to identify regions with the greatest potential for wild mushroom proliferation, in addition to detecting individual mushrooms within forested environments. The time and labour necessary for mushroom foraging can be substantially reduced by a comprehensive comprehension of these potential habitats. Furthermore, the proposed methodology facilitates the probabilistic inference of species presence within a specific region by examining the spatial and distributional patterns of natural mushrooms.
This research makes three significant contributions to the field of wild mushroom foraging and detection research.
  • Contribution 1: The introduction and use of a structured, multispectral-image dataset (WOES) that enables the training and benchmarking of object detection models for wild mushroom identification. While the dataset is not publicly released due to ongoing data protection and field study constraints, this work demonstrates how tailored annotations, spectral alignment, and probabilistic spatial mapping techniques can significantly enhance the detection of Macrolepiota procera in natural environments. The dataset supports the verifiable development of our UAV-based detection pipeline, and the design principles (e.g., class distribution, multispectral preprocessing, vegetation index integration) are fully described for reproducibility. As neither OMPES nor WOES are publicly available, access requests should be directed to the corresponding author.
  • Contribution 2: The introduction of a cutting-edge approach for locating wild mushrooms using UAVs and multispectral cameras. This technique combines real-time UAV surveillance with multispectral photos, enabling the identification of wild mushroom cultivation using the WOES dataset.
  • Contribution 3: A proposed architecture for real-time monitoring with low-cost equipment. The ML models developed and presented in this work can be applied to images or videos acquired by either UAVs or mobile devices, enabling the detection of wild mushrooms from both ground and aerial imagery. These models can be evaluated in the present study’s evaluation of models to determine the most reliable model configuration and technique for the dataset.
The subsequent sections of this work are structured as follows: Section 2 presents a literature overview, emphasising current advancements in deep learning applications for mushroom detection and smart agriculture. Section 3 defines the suggested methodology, specifying the data collection process, annotation strategy, and structure of the custom-trained YOLOv5 models. Section 4 outlines the experimental set-up, including training setups, hyperparameter optimisation via evolutionary algorithms, and model evaluation metrics. Section 5 presents an analysis and discussion of the data, supported by performance comparisons, confusion matrices, and qualitative insights. The Conclusions Section ultimately concludes the paper by summarising major findings, highlighting the contributions of this research, and proposing potential paths for future research in the domain of precision agriculture.

2. Related Work

Although significant technological progress has been made in multiple areas, the incorporation of artificial intelligence (AI) techniques in agriculture has faced specific constraints. The adoption and execution of AI in this field have been notably limited, leading to a significant disparity in its extensive utilisation. The utilisation of machine learning (ML) and deep learning (DL) methodologies in mushroom identification can improve both the volume and quality of harvested mushrooms, while also optimising the extraction of future wild mushroom resources. However, the intricacy of this task poses inherent difficulties. Mushrooms frequently develop in natural settings where they are surrounded by multiple visually analogous components, such as weeds or stones of similar hues, considerably augmenting the volume and complexity of data requiring processing.

2.1. Related Work on Mushroom Cultivation

Figure 1 depicts various wild mushroom species growing in the forest. Notably, some noteworthy work has been performed on mushroom detection. Regarding mushroom detection and recognition, the authors in [17] aimed to build an object recognition algorithm that could be operated with industrial cameras to detect the development state of edible mushrooms in real time. This algorithm can be deployed in future autonomous picking equipment. Moreover, in large resolution, small targets (edible mushrooms) have been detected with 98% accuracy. However, with the processing power available today and the rapid expansion of cloud computing, this trade-off of computational power for accuracy is cost-effective. Their study produced significant results in recognising edible mushrooms. An inevitable drawback of this method is the impact on the aspect ratio and size of the image (see Figure 1).
Furthermore, the study in [18] examined the application of deep learning models—SVM, ResNet50, YOLOv5, and AlexNet—to categorise mushrooms as harmful or non-toxic utilising image data. The support vector machine (SVM) achieved the highest accuracy of 83%. The objective is to assist farmers and exporters by enhancing mushroom safety and increasing agricultural productivity in India.
Similarly, the work in [19] focused on classifying oyster mushroom spawn quality using image processing and machine learning methods. Spawn images were analysed with trivariate colour histograms and evaluated using classifiers like DNN, SVM, KNN, NCC, and decision trees. DNN achieved the highest accuracy of 98.8%, demonstrating the potential for automated, non-invasive quality control in mushroom farming.
Moreover, the study in [20] presents “Mushroom-YOLO”, an advanced YOLOv5-based deep learning model designed for the detection of shiitake mushroom growth in indoor agricultural settings. The approach tackles issues like background noise and diminutive object size, attaining a mean average precision of 99.24%. A prototype system, termed “iMushroom”, was developed for real-time yield monitoring and environmental regulation.
Recently, the research in [21] evaluated classification techniques (Naive Bayes, C4.5, SVM, Logistic Regression) for distinguishing between edible and harmful mushrooms utilising datasets from Kaggle. C4.5 exhibited the greatest accuracy (93.34%) and processing efficiency. The project highlights secure mushroom consumption via automated classification utilising WEKA software
Last but not least, the study in [22] offered a thorough examination of the contemporary applications of computer vision and machine learning technology throughout all phases of mushroom production, encompassing cultivation, harvesting, categorisation, and disease detection. It rigorously evaluated current systems, finds constraints such as inadequate datasets and scalability issues, and explores prospective future avenues, including real-time monitoring, robotics, and automated yield forecasting.

2.2. Related Work on the Use of YOLOv5 in Precision Farming

A significant contribution to the field of mushroom detection and identification was made by [23], in which the authors employed a deep learning-based solution utilising the attention mechanism, convolution block attention module (CBAM), multi-scale fusion, and an anchor layer. To improve recognition accuracy, the proposed model incorporated hyperparameter evolution during its training. Results indicate that this approach classifies and identifies wild mushrooms more effectively than traditional single-shot detection (SSD), Faster R-CNN, and YOLO series methods. Specifically, the revised YOLOv5 model improved the mean average precision (MAP) by 3.7% to 93.2%, accuracy by 1.3%, recall by 1.0%, and model detection time by 2.0%. Notably, the SSD method lagged behind in terms of MAP by 14.3%. Additionally, the model was subsequently simplified and made available on Android mobile devices to enhance its practicality, addressing the issue of mushroom poisoning caused by difficulties in identifying inedible wild mushrooms.
In a separate study, [24] compared various machine learning algorithms, including YOLOv5 with ResNet50, YOLOv5, Fast RCNN, and EfficientDet, for the task of discovering chest anomalies in X-ray images. Utilising VinBigData’s web-based platform, the authors compiled a dataset containing 14 significant radiographic findings and 18,000 images. Through the evaluation of the trained models, it was found that the combination of YOLOv5 and Resnet-50 architecture yielded the optimal metric values of Mean Average Precision (MAP) at 0.6 and precision equal to 0.254 and 0.512.
Numerous related studies [25,26,27,28,29,30,31] demonstrate that YOLOv5 remains essential in smart agriculture and precision farming, underscoring its significance and applicability in current research. Every study modifies YOLOv5 to tackle distinct agricultural difficulties, utilising its rapidity, versatility, and precision. In [25], the TIA-YOLOv5 model is introduced for effective crop and weed recognition, utilising transformer encoders and feature fusion techniques to enhance small object detection and address class imbalance—vital challenges in real-time agricultural settings. Likewise, the study in [26] employs YOLOv5 in a sophisticated robotic system tailored for accurate herbicide application in rice cultivation, minimising chemical consumption and fostering ecologically sustainable practices.
In [28], the authors provide YOLOv5s-pest, a pest detection model augmented with innovative modules, including the hybrid spatial pyramid pooling fast (HSPPF) and Soft-NMS, which markedly improves multi-scale feature extraction and detection precision in densely populated agricultural settings. Additionally, research in [28,29,30,31] broadens the applicability of YOLOv5 to encompass crop health monitoring and leaf classification, specifically focusing on the detection and classification of cowpea leaves through transfer learning. These works also incorporate approaches like attention modules and data augmentation to enhance performance in varied and intricate agricultural contexts.
These studies collectively illustrate that, despite the emergence of newer detection frameworks, YOLOv5 continues to be a competitive, versatile, and highly adaptable algorithm. Its sustained significance is bolstered by ongoing enhancements and its shown capacity to achieve high precision with minimal computational requirements—elements that are particularly advantageous in resource-limited agricultural environments. Current research continuously demonstrates that YOLOv5 is relevant and continues to be a fundamental element of smart agricultural technology.
Table 1 provides a comparative overview of recent and relevant studies related to mushroom detection, smart agriculture, and YOLOv5-based object detection methods. It summarises the focus areas, techniques used, key limitations, and the specific research gaps addressed.

3. Materials and Methods

3.1. Data Collection

The WOES (Wild Mushroom Observation and Exploration System) dataset is a comprehensive collection of examples of wild mushrooms in various stages of development. This dataset aims to facilitate the training of machine learning and deep learning techniques for the identification and classification of wild mushroom species.
A data acquisition system (DAQ) is employed as the primary means of data collection. The DAQ captures environmental signals and converts them into machine-readable data, while software is used to process and store the acquired data. It is crucial to collect data during a specific time window, with the optimal period for the majority of mushroom species being September and October. During this time, meteorological assessments of the search area should be conducted periodically. Additionally, it is important to note that environmental factors such as temperature and relative humidity play a crucial role in the development of wild mushrooms. Ideal conditions for mushroom growth are typically formed when high temperatures are preceded by heavy precipitation in the same region. This is because mushrooms require a warm, humid habitat for optimal growth.
It is noteworthy that the geographic place of data collection in the OMPES and WOES datasets is in Western Macedonia, Greece. The location of the study has a latitude of “40.155903863645534” and a longitude of “21.434814591442194”—these coordinates were provided by Google Maps, which utilises the World Geodetic System (WGS) 84 format. The Keyhole Markup Language (KML) file presents the research area in Figure 2.

3.2. Hardware and Software Setup

In the context of this work, we utilised a multi-copter drone equipped with an RGB and multispectral camera. Figure 3 demonstrates the creation and assembly of a customised multi-copter UAV using low-cost materials. The main objective is to gather photographs and videos of the defined region and analyse them to be embedded in the WOES dataset. The secondary goal is to participate in a scenario that involves detecting wild mushroom cultivations in a large forest. For the purpose of this study, a mid-to-high-end testbed was utilised for training the detection model. Specifically, a Linux workstation running Ubuntu 20.04, equipped with an Intel Core i7 processor, 64 GB of RAM, and an NVIDIA RTX 3080 GPU with 10 GB of GPU memory, was employed.
The essential components of the drone are the OpenPilot CC3D Revolution (Revo) flight controller, four BR2205 2300 KV motors, a BN-880 GPS Module U8 with a Flash HMC5883 compass, MPL3115A2-I2C Barometric Pressure/Altitude/Temperature sensor board, a WiFi antenna 2.4 GHz 5 dBi 190 mm, Parrot Sequoia+, and the Tattu FunFly 1800 mAh 14.8 V Lipo battery pack.
Moreover, the flight controller is configured using Cleanflight, an open-source program that supports a range of current flight boards. In addition, the 2.4 GHz FlySky FS-i6 is used to transmit the control signal. We utilise a Raspberry Pi Zero 2 with an RPi camera board version 2 that supports 8 MP image resolution and FHD quality for video as the central processing unit for streaming to the base station.
It is worth noting that the primary function of the U.FL connector is to mount external antennas on boards. Furthermore, the Raspberry Pi Zero 2 does not have a U.FL connector on its board. The connector must be manually installed on the board, as it is not commercially available as a pre-integrated component.
In this work, the proposed solution employs a field-based base station in proximity to the drone’s operational area. The base station utilised in this study is a laptop computer that communicates with the Raspberry Pi on the drone via WiFi. It is well-known within the research community that WiFi technology offers a high packet transmission rate, but has a limited communication range. To mitigate this limitation, the drone is equipped with a live footage broadcasting capability, which can be enhanced through the deployment of external antennas on both the drone and the base station. Specifically, an Alfa AWUS036ACH external antenna is utilised on the base station to extend the WiFi range.

3.3. Data Preprocessing and Annotation

Upon concluding image acquisition, our proposed system advances through five primary stages to process and analyse the multispectral data.
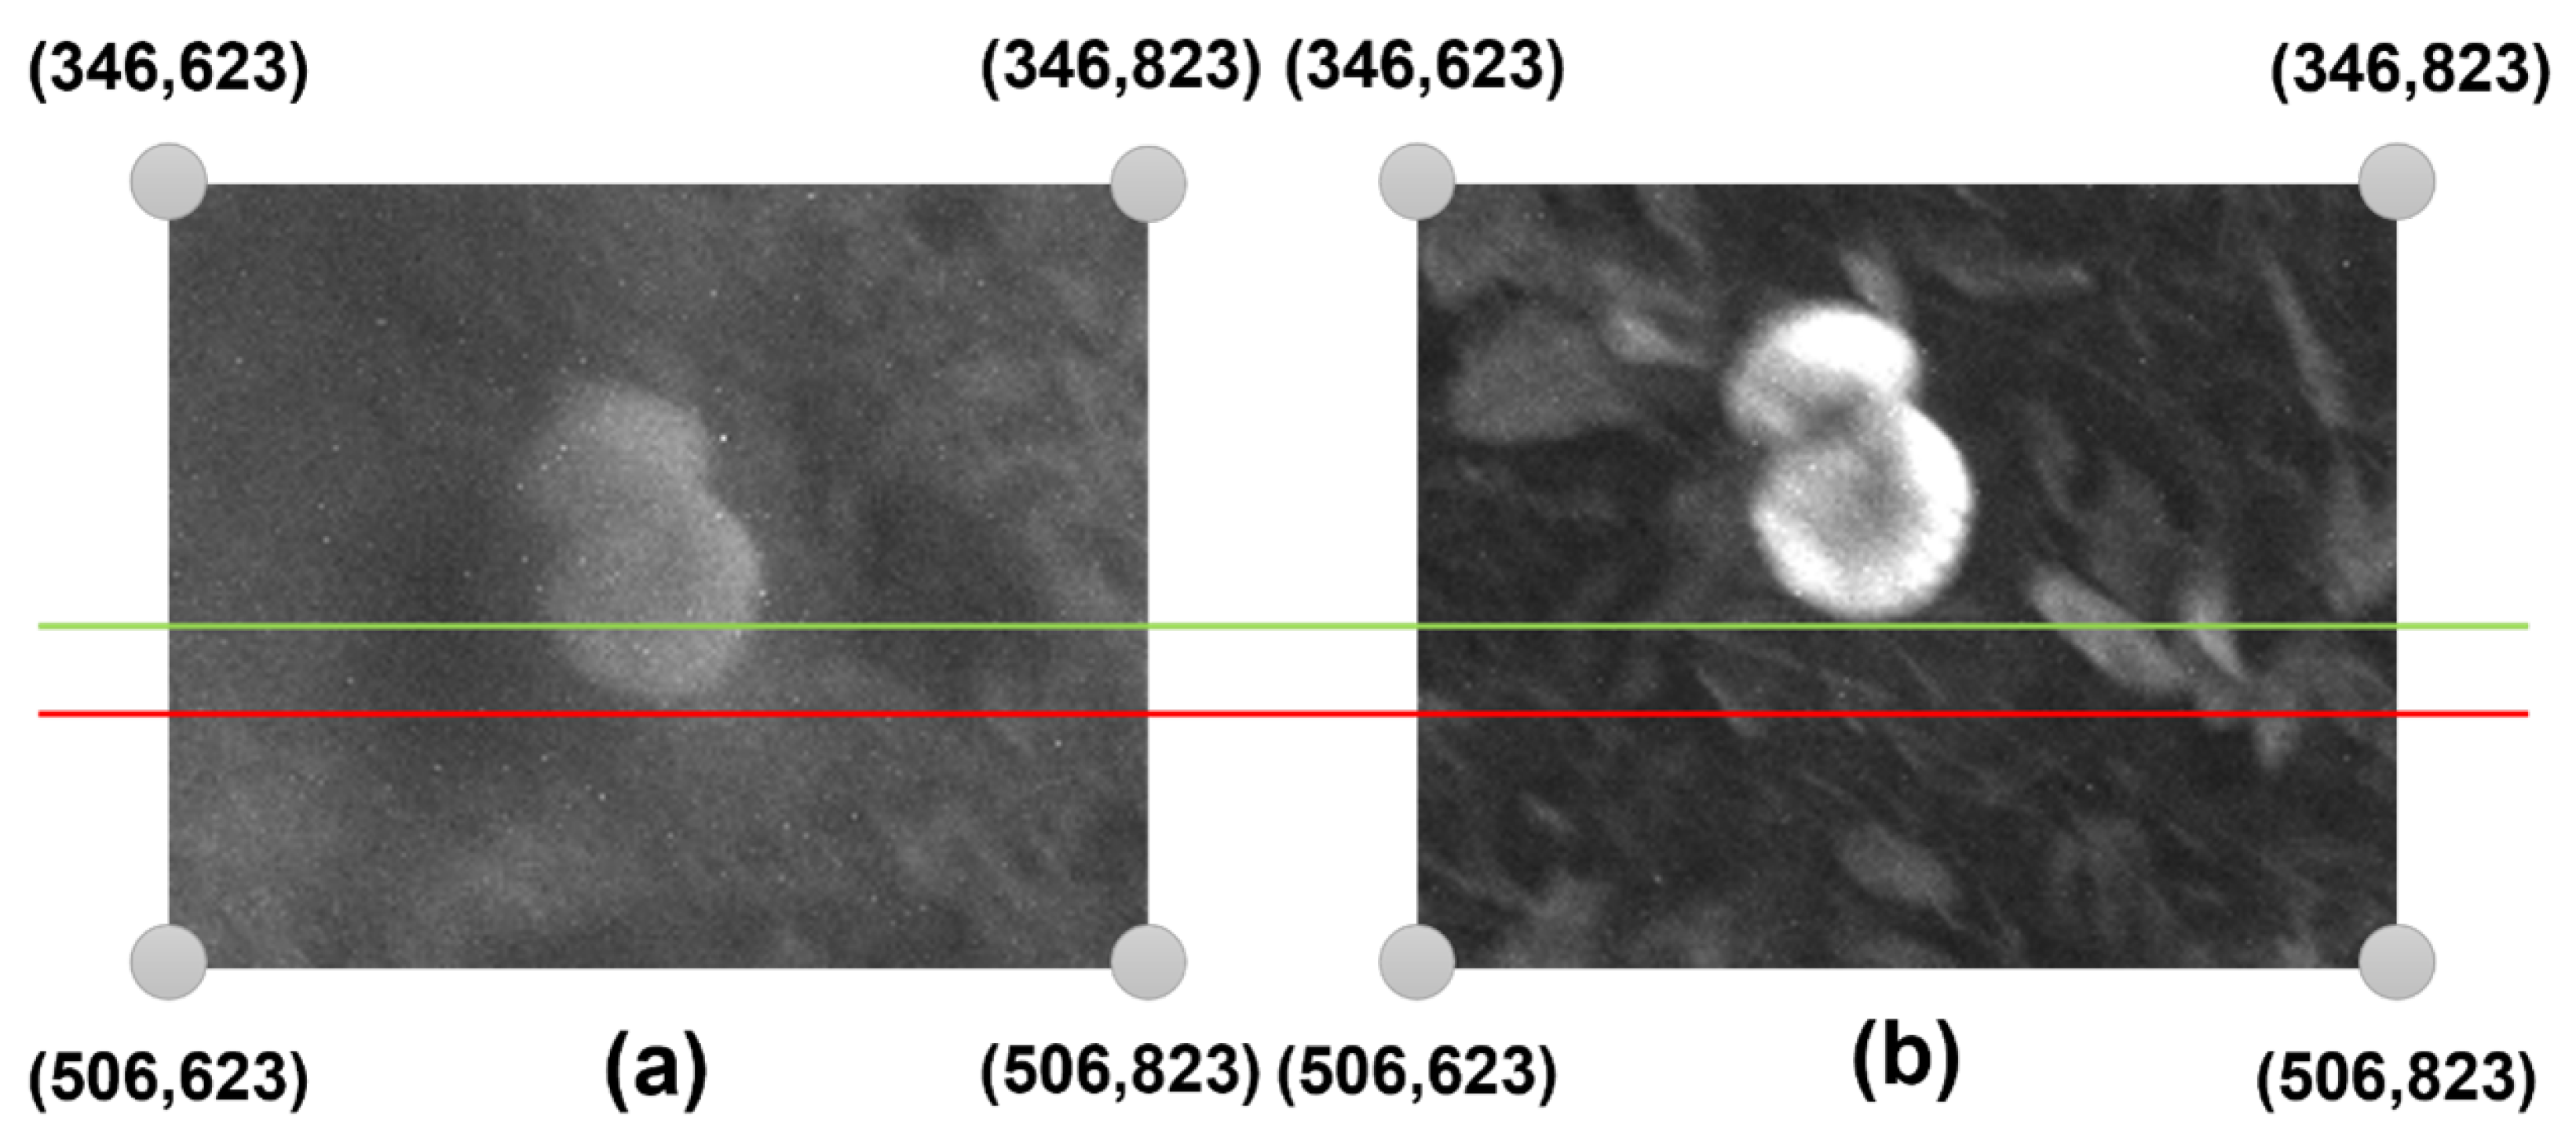
  • Stage 1: The collected band pictures are geometrically aligned to a common reference spectrum, specifically the REDEDGE band, to achieve precise spatial matching.
  • Stage 2: The Normalised Difference Red Edge Index (NDRE) is then computed to emphasise regions with elevated chlorophyll concentration, potentially signifying favourable conditions for wild mushroom growth.
  • Stage 3: The technique finds possible mushroom locations within the studied area based on NDRE values.
  • Stage 4: A probability score is assigned to each identified location, assessing the possibility of mushroom existence.
  • Stage 5: The processed RGB image, featuring bounding boxes and corresponding probability scores, is delivered as a PNG file over WiFi to the ground-based control station for visualisation and decision-making.
The WOES dataset comprises annotated images of mushrooms, each labelled with its respective class. The files comprise a single class and include aerial and ground images. The OMPES dataset has 535 photos, while WOES has 907. It is worth noting that two machine learning models will be trained from the WOES dataset, of which the first utilises all the photos in the dataset while the second uses only 44.55% (404 photos). In summary, the WOES dataset consists of the following:
  • Images of mixed-pixel resolutions (907, regular cameras).
  • Mushroom class, with 543 labels.
  • Annotations were initially performed manually until a high level of accuracy was achieved, after which the preliminary results were used to assist the remaining annotation process.
The proposed methodology’s most innovative part is aerial multispectral imagery. Using the Parrot Sequoia+ camera, multispectral pictures are obtained. This camera has five spectral bands: RED, REDEDGE, GREEN, Near-InfraRed (NIR), and RGB. The wavelength of each spectrum, except RGB, is 660 nm (RED), 735 nm (REDEDGE), 550 nm (GREEN), and 790 nm (NIR).
These spectra are depicted in Figure 4, which shows a part of the study area. Each region of interest (ROI) consists of four corners corresponding to the image’s Cartesian coordinates. For instance, if the height and width of an image are 100 pixels (100 × 100), the ROI may contain 25 pixels for height and 40 pixels for width (25 × 40). It may have a lower left corner at (10, 10), an upper left corner at (35, 10), a lower right corner at (10, 50), and an upper right corner at (35, 50).
Notably, the RED, REDEDGE, GREEN, and NIR spectra have pixel sizes of 1200 by 960. Figure 5 illustrates a typical difference between the RED and NIR bands. In this scenario, an ROI of 140 pixels in height and 200 pixels in width (140 × 200) was selected, in which the red line is tangent to the mushroom in the NIR spectrum and the green line is tangent to the mushroom in the RED spectrum. Therefore, the difference between the two bands is noticeable along the horizontal axis. Variations on the vertical and horizontal axes are also found in the remaining spectra. Therefore, it is imperative to modify all the spectra, as their proper processing will require a one-to-one matching of all the spectra.
Consequently, all multispectral images must be suitably adjusted. The bands must initially be adjusted to the desired band. In this work, the RED, GREEN, RGB, and NIR bands were adjusted in reference to the REDEDGE band. Python 3.13 libraries for computer vision were used throughout the transformation procedure.
The most important libraries are PIL, NumPy, and OpenCV (Open Computer Vision). Before developing the script, the proper parameters must be determined. Geographic Information System (GIS) applications may be used to locate these variables. Essentially, the RED, NIR, REDEGE, and GREEN bands are rotated to the right by ninety degrees, while the RGB spectrum is rotated to the left by ninety degrees.
Furthermore, the dimensions of the RGB band image should be changed from 3456 × 4608 to 960 × 1280. Table 2 depicts the transformations for each spectrum concerning the REDEDGE band. The final step is to crop all multispectral images to 925 × 1165 pixels. Notably, a deviation of two pixels was observed when the above method was used on a hundred multispectral images. Conclusively, the imagery conversion process is described as challenging yet vital for its utilisation.
As previously stated, the drone utilised in this study was equipped with a multispectral camera. The multispectral camera captures data based on the reflection frequencies of objects when taking photos. Furthermore, at a low altitude of 3 to 15 m above the ground, several bands in multispectral images reveal the presence of wild mushrooms. The frequency range of mushrooms can be determined using GIS applications.
In this project, the GIS tool employed was QGIS 3.40, a free software. This manual process applies to all species and regions of wild mushrooms. Table 3 depicts the optimal frequencies in multispectral images for identifying wild mushrooms. Additionally, Figure 6 illustrates the application of the thresholds from Table 3 to the multispectral images of each spectrum.

3.4. Calculation of the Normalised Difference Red Edge Index

Vegetation indices (VIs) derived from remote sensing-based canopies are simple and practical methods for quantitative and qualitative assessments of vegetation cover, vigour, and growth dynamics, among other uses. These indices have been extensively utilised in remote-sensing applications via various satellites and UAVs [32].
NDRE measures the chlorophyll content in plants. The optimal period to apply NDRE is between the middle and end of the growing season when plants are fully developed and ready to be harvested. At this time, it would be less beneficial to employ alternative indexes. NDRE is a remote-sensing vegetation indicator that measures the chlorophyll content of plants [33]. The NDRE equation, as showcased in [34], is:
NDRE = NIR REDEDGE NIR + REDEDGE
The normalised difference vegetation index (NDVI) evaluates the greenness and density of vegetation in satellite and UAV imagery in the simplest terms possible. The healthy plants’ spectral reflectance curve determines the difference between the visible RED and NIR bands. This difference is represented numerically by the NDVI, which ranges from −1 to 1.
Consistently calculating the NDVI of a crop or plant over time may disclose a great deal about environmental changes. In other words, the NDVI may be used to evaluate plant health remotely [35]. The NDVI equation, as showcased in [32], is:
NDVI = NIR RED NIR + RED
The optimisation of soil adjusted vegetation index (OSAVI) considers reflectance in the NIR and RED bands. The fundamental difference between the two indices is that OSAVI considers the traditional value of the canopy backdrop adjustment factor (0.16) [36]. The OSAVI equation, as showcased in [32], is:
OSAVI = NIR RED NIR + RED + 0.16
This research used vegetation indices to detect locations yielding wild mushrooms. Considered vegetation indicators included NDVI, OSAVI, and NDRE. Figure 7 illustrates the vegetation indices that were generated using the QGIS application.
It is essential to understand that the QGIS software exports the vegetation indices as TIF files to be utilised in other applications. Moreover, Figure 7 reveals that the NDRE vegetation index has a more satisfactory result than NDVI and OSAVI because there are areas with elevated value changes compared to the overall image.

3.5. Model Architecture and Training Setup

In this work, an architecture will be followed, which includes a drone, a base station, and a drone operator. WiFi Direct is used for communication between the drone and the base station, while a 2.4 GHz transmitter handles the drone’s telemetry. The architecture is depicted in Figure 8.
As a first step, the pilot operates the drone at a high altitude of 40 to 100 m over an area devoid of thick tree cover. The pilot establishes a connection with the multispectral camera Parrot Sequoia+. The base station connects to the camera’s hotspot, allowing it to access its IP address.
Correspondingly, the operator establishes a connection between the Raspberry Pi and the multispectral camera. The Raspberry Pi transmits live video with the RPi camera board to the base station through the camera hotspot. The transmission is conducted with the libcamera library. In more detail, the libcamera library is a new software library designed to provide direct support for complicated camera systems from the Linux operating system.
Furthermore, the operator establishes a wireless connection between the Parrot Sequoia+ camera and the base station before executing the command to capture a multispectral image. Capturing a multispectral image takes approximately five seconds, making it crucial for the drone to maintain a constant posture throughout this period. The camera archives the picture locally. After the completion of picture capture, the processing of band images described in Section 3.3 and the calculation of the normalised difference red edge (NDRE) vegetation index described in Section 3.4, follows the identification of potential locations with wild mushrooms.
Figure 7. Example of vegetation index maps derived from multispectral UAV imagery captured at an altitude of 60 m over a forested area. (a) NDVI index: highlights general vegetation density and greenness, using reflectance in the RED and NIR bands. (b) OSAVI index: similar to NDVI but adjusted to minimise the influence of bare soil, making it suitable for sparse vegetation environments. (c) NDRE index: sensitive to chlorophyll content in mid-to-late growth stages, and particularly effective for identifying wild mushroom habitats beneath vegetation cover. (d) RGB spectrum image: standard visible light image used for reference and annotation. These vegetation indices enable spatial inference of potential mushroom-rich areas by detecting subtle variations in canopy reflectance patterns, which guide the object detection algorithm.
Information 16 00539 g007
In the premise of this task, computer vision is used for locating mushroom patches within the NDRE vegetation index. Initially, the script utilises the NDRE and the PIL library to analyse the TIF file. Then, a new image is constructed with a white background. This is followed by two FOR loops that access every pixel in the imported image. Those pixels with a value higher than or equal to 0.7 are then colored red (255, 0, 0); otherwise, they are colored black (0, 0, 0). The resulting image is depicted in Figure 9a; it will be referred to as HighValueSpots, and will be a PIL image object.
The HighValueSpots image is then blurred using the cv.filter2D function with arguments (a) the image, (b) −1, and (c) a kernel. The initial value of the first parameter is the HighValueSpots image, while the required depth of the target image is specified by parameter −1. The number −1 indicates that the resultant image’s depth will be the same as the source image’s.
Figure 8. System architecture for the proposed wild mushroom detection framework using UAV-based multispectral imaging and real-time data processing. (a) Phase One: aerial survey initiated by the UAV equipped with a Parrot Sequoia+ multispectral camera and Raspberry Pi unit; the drone captures raw spectral data while maintaining stable flight over forested terrain. (b) Phase Two: onboard preprocessing begins, including band alignment and vegetation index computation (e.g., NDRE), followed by wireless transmission of processed data to the base station. (c) Base Station: a field-deployed laptop receives data via extended WiFi, visualises potential mushroom zones, and manages the detection pipeline. (d) Drone Operator: responsible for piloting the UAV, initiating imaging protocols, and coordinating live data feedback loops.
Information 16 00539 g008
The kernel is a short, two-dimensional table holding values that indicate how much of the surrounding pixel values should be used to determine the intensity value of the current pixel. Kernels are typically odd-length square arrays, such as 3 × 3, 5 × 5, and 7 × 7. The 80 × 80 matrix recommended for this study is constructed with the function np.ones((80,80),np.float32)/25.
Choosing large values, such as 80, is primarily motivated by the need to prevent minor gaps between the groups. Figure 9b displays the result, the BlurredHighValueSpots image, and a PIL image object with the name BlurredHighValueSpots. Furthermore, the K-means algorithm divides the BlurredHighValueSpots image into two colour groups, the background and the red colour. K-means clustering is initially a method for categorising data points or vectors based on their proximity to their respective mean points. This leads to dividing the data points or vectors into cells. When applied to an image, the K-means clustering algorithm considers each pixel as a vector point and generates k-clusters of pixels [37].
The K-means algorithm is directly called using the function cv.kmeans, which requires five parameters:
  • Samples: The data type should be np.float32, and each feature should be placed in a separate column.
  • Nclusters (K): Number of clusters required.
  • Criteria: The condition for terminating an iteration. When these conditions are met, the algorithm stops iterating.
  • Attempts: Specifies the number of times the algorithm is conducted with different beginning labellings. The method returns the labels that result in the highest degree of compactness. This density is returned as the output.
  • Flags: This flag specifies how initial centres are obtained.
Figure 9. Image processing pipeline for identifying probable wild mushroom zones from NDRE vegetation index maps. (a) HighValueSpots: binary thresholded image highlighting pixels with NDRE values larger than 0.7, representing areas with high chlorophyll content, potentially indicating mushroom presence. (b) BlurredHighValueSpots: image smoothed using an 80 × 80 kernel convolution to merge nearby high-value pixels, reducing noise and enhancing region continuity. (c) GroupedBlurredHighValueSpots: result of applying K-means clustering (K = 2) to segment red-highlighted vegetation clusters from background pixels. (d) ContourGroupedBlurredHighValueSpots: application of contour detection (via OpenCV’s findContours and drawContours) to delineate distinct clusters identified in (c), enabling spatial grouping. (e) MushroomLocations: final annotated map showing inferred mushroom patch locations, used to guide YOLOv5 object detection and validate multispectral cues. This stepwise visual pipeline demonstrates how vegetation indices are transformed into actionable spatial predictions for autonomous mushroom detection.
Information 16 00539 g009
Therefore, the cv.kmeans function is executed with the following parameters: np.float32(), 2, cv.TERM_CRITERIA_EPS + cv.TERM_CRITERIA_MAX_ITER, 10, and cv.KMEANS_RANDOM_CENTERS.
The cv.TERM_CRITERIA_EPS criterion refers to stopping the algorithm iteration when a given level of accuracy is achieved, while the cv.TERM_CRITERIA_MAX_ITER criterion refers to stopping the algorithm after the specified number of iterations. Figure 9c displays the result, the modified BlurredHighValueSpots image, as a PIL image object named GroupedBlurredHighValueSpots.
Using the cv.findContours and drawContours functions, each red region of the GroupedBlurredHighValueSpots image is accessible. Initially, explanations for contours may be as simple as a line connecting all continuous points (along the border) with the same colour or intensity. Contours are a valuable tool for form analysis and item identification and detection.
The cv.findContours function locates the red regions in the GroupedBlurredHighValueSpots picture using three parameters: cv2.Canny (image, 140, 210);, cv2.RETR LIST; and cv2.CHAIN APPROX NONE.
The image parameter accepts the image GroupBlurredHighValueSpots as its value. In addition, the cv2.RETR LIST argument returns all contours without establishing any parent–child connection. Under this concept, parents and children are equal and serve as a guideline—lastly, the cv2.CHAIN APPROX NONE argument eliminates all unnecessary points and compresses the contour.
The drawThe contours function is responsible for drawing contours on an image. This function has as parameters: (a) the image to draw the contours on; (b) the contours in tabular form; (c) the colour of the contour line; and (d) the thickness of the line. The program has been given as follows: image;, contours;, (0, 255, 0); and 5.
Figure 9d portrays the outcome, the modified GroupBlurredHighValueSpots image, as a PIL image object documented as ContourGroupedBlurredHighValueSpots.
The last stage is calculating the probability of finding wild mushrooms in each area. A formula that calculates this probability will need to be created to attain this purpose. Initially, two successive FOR iterations will access all pixels of each contour in the TIF image file of the NDRE vegetation index. Simultaneously, each contour’s average of the NDRE values (avg) and the maximum NDRE value (max) will be determined.
At the completion of the entire access to all pixels in each area, the probability of finding mushrooms is computed using the following formula:
Probability = max avg max + avg × 100
Notably, the probability and contours are rendered in the RGB spectrum, as shown in Figure 9e, and the picture (MushroomLocations) is sent to the base station using the socket library.

3.6. Training and Evaluation

After evaluating the MushroomLocations image with the potential locations, as depicted in Figure 9e, the drone operator subsequently flies the drone at a lower altitude to the targeted areas to verify the presence of wild mushrooms, as seen in Figure 8b.
It is important to note that the drone includes an altimeter sensor, which helps measure the drone’s altitude. In real-time, the drone sends its location (longitude and latitude) and altitude (meters) relative to the ground to the base station. This allows the base station to execute machine-learning models for mushroom identification through the live broadcast outlined in subsection Phase One. In this study, the YOLOv5 algorithm is applied for object identification, capable of live stream recognition.
For this purpose, two distinct machine learning models were developed: one for the general recognition of mushroom entities and another specifically for identifying a morphological feature unique to Macrolepiota procera. The latter model is designed to accurately distinguish Macrolepiota procera from Agaricus campestris, a commonly occurring species in the Grevena region. The annotation of the dataset was conducted using an online platform [38], with the resulting labels exported in YOLOv5-compatible text format.
The data were then segregated into training and validation sets and batches. The training data was utilised to feed the model, while the validation set, comprising unrevealed data, was used for the self-evaluation of the trained model. The distribution of labels in the OMPES and WOES datasets is depicted in Figure 10.
The first WOES model is referred to as “Wild mushrooms” and the second one, which detects one of the main characteristics of the mushrooms, Macrolepiota procera, will be referred to as the “Macrolepiota procera characteristic”. The reduced abundance of the “Macrolepiota procera characteristic” model is due to the fact that the dataset does not include only mushrooms of Macrolepiota procera.
In addition, the number of labels used to train the AI models is depicted in the upper-left corner of Figure 10. The lower-left corner of Figure 10b serves as the origin for the normalised target location map, which is generated using a right-angle coordinate system. The relative values of the horizontal and vertical coordinates x and y are used to determine the relative locations of the targets. Furthermore, the target size distribution is relatively concentrated, as seen by the normalised target size map in Figure 10c.
The following command provides a sample example: python detect.py –source url_stream. The base station begins detecting wild mushrooms in the live stream as soon as the drone descends below 20 m in altitude. In addition, if the drone operator is uncertain about the existence of wild mushrooms, he may take a picture with the multispectral camera to determine whether or not mushrooms are present. Section 3.3 provides a comprehensive examination of multispectral image processing.
As illustrated in Figure 6c, the RED band outperforms the other bands. After acquiring and processing the multispectral image, the Raspberry Pi onboard the drone transmits the processed RED band image to the Base Station over WiFi.
Two YOLOv5 ML models are applied at the base station for mushroom detection. The first model identifies wild mushroom specimens, while the second recognises a feature of Macrolepiota procera mushrooms. The algorithm generates an ROI containing the recognised objects for each spotted mushroom. The system then performs a second detection at each ROI to identify wild mushroom species.
If it identifies an object inside the ROI, the wild mushroom is a member of the Macrolepiota procera species. Alternately, it may be Agaricus Campestris if it does not distinguish any objects inside the ROI. Figure 11 depicts the pipeline of the training and evaluation process.
Additionally, after running the first model for the broader search for wild mushrooms, the ROIs are saved as jpg files. These images can be saved by adding the –crop-img flag to the detection command. OnlyWildMushrooms refers to the images subjected to machine vision processing to effectively highlight the characteristics of Macrolepiota procera mushrooms. The script adjusts the brightness and contrast of the mushroom images in order to highlight the dark mottling in the centres of the mushrooms. The libraries OpenCV, NumPy, and PIL are used for image processing. The function ImageEnhance.Brightness(image).enhance(factor) modifies the image’s brightness, while the ImageEnhance.Contrast(image).enhance(factor) modifies the image’s contrast.
Image and factor are the two parameters for each of these functions. The Image argument initially contains the OnlyWildMushrooms images, while the factor parameter is a floating point number that controls the augmentation. Furthermore, the value 1.0 always returns a duplicate of the original image; lower numbers indicate less colour (brightness, contrast, etc.), while higher values indicate more. This value is not restricted in any way. In this study, the factor value for adjusting brightness is 0.1, while the factor parameter for adjusting contrast is 10. These images will be named ProcessedOnlyWildMushrooms and saved in jpg files. The second model will then be executed to detect the distinctive feature of the wild mushroom Macrolepiota procera in the photos of ProcessedOnlyWildMushrooms. Figure 11 depicts the proposed pipeline’s outcome and operational procedures.
For the evaluation of the proposed approach, two machine learning models, “Wild Mushrooms” and “Characteristic Procera”, were trained using the YOLOv5 library.
The training dataset characteristics are visually summarised in Figure 10, which offers an overview of image annotations and class distributions critical for model development. The training utilised the pre-trained YOLOv5 architecture from the official YOLOv5 library as a basis for transfer learning. Initial trials, however, indicated that the default training parameters were insufficient for the particular task of mushroom detection. The built-in hyperparameter evolution algorithm of the YOLOv5 library was employed to improve model performance. This program utilises a genetic algorithm (GA), a subset of evolutionary algorithms (EAs) derived from natural selection, to iteratively enhance training parameters.
Genetic algorithms are esteemed for their efficacy in addressing complex optimisation and search challenges, and in this regard, they were important in identifying improved hyperparameter configurations that enhanced detection precision and training efficiency. It is important to note that machine learning hyperparameters can affect various training elements, and determining their optimal values can be challenging. Traditional methods such as grid searches may become infeasible due to (a) the high dimensionality of the search space, (b) the unknown correlations between the dimensions, and (c) the costly nature of evaluating the fitness at each point, making GA a suitable candidate for hyperparameter searches.
In this study, both customised YOLOv5 models underwent hyperparameter evolution for 1000 iterations, much beyond the minimum of 300 iterations advised by the YOLOv5 developers to guarantee a comprehensive exploration of the hyperparameter space. Table 4 compares the standard YOLOv5 hyperparameter configurations with the refined values derived from the evolutionary method. This comparison underscores significant alterations that enhanced the models’ performance.
The table highlights the initial five hyperparameters, commonly considered the most impactful in determining model behaviour. The “lr0” parameter establishes the initial learning rate, determining the speed of parameter updates at the beginning of training, whilst the “lrf” parameter signifies the final learning rate, affecting the conclusion of the learning process. The “momentum” parameter, which regulates the degree to which prior gradients affect the current update, requires careful calibration, especially in intricate tasks like mushroom detection, to ensure stability in the learning process.
Additionally, “weight decay” functions as a regularisation technique, mitigating overfitting by imposing penalties on excessive weights. The parameters “warmup epochs” and “warmup momentum” are essential in the initial phases of training, since they incrementally elevate the learning rate and stabilise initial updates, thus reducing error spikes. All models were trained with these optimised parameters for 1200 epochs and a batch size of 8, ensuring enough learning depth while preserving computational efficiency. The hyperparameter evolution procedure, as demonstrated by the variations in Table 4, was crucial in improving model convergence and overall accuracy.
The study involved training four models: two with the default YOLOv5 hyperparameters and two with optimised parameters obtained from the Evolve script. The performance of these models is comprehensively summarised in Table 5, which outlines the outcomes of four principal evaluation metrics employed to evaluate and contrast model performance: precision, mean average precision (mAP), recall, and F1 score. These measures were chosen for their capacity to deliver a comprehensive and balanced assessment of object detection accuracy.
Precision quantifies the model’s accuracy in accurately identifying and classifying mushroom instances in the input photos, hence reducing false positives. Recall assesses the model’s capacity to identify any relevant items, maximising true positives and minimising false negatives. The F1 score integrates these two measurements into a singular harmonic mean, providing a balanced evaluation that considers both false positives and false negatives. Mean average precision (mAP) functions as a holistic metric by averaging precision across all classes at several intersection over union (IoU) criteria. In this study, average precision (AP) was computed for each class separately and subsequently combined to derive the overall mean average precision (mAP) value.
These AP scores are added together to form the measure mAP, and thus, the mean AP score across all classes. The F1 score may be seen as the harmonic mean of accuracy and recall, with the highest score being one and the worst score being zero. Precision and recall contribute the same proportion to the F1 score. Equation (5) depicts the F1 scoring formula [39]. Several hyperparameters must be modified for the CNN to classify objects inside images accurately. Notably, the enhanced script developed in the context of this research was applied to the Wild Mushrooms model and demonstrated a 2% improvement over the original model, while the Characteristic Procera model showed a 5% improvement. Despite the tiny percentages, the improvement is considerable.
F 1 Score = 2 × Precision × Recall Precision + Recall
Table 5 indicates that although all four models provide satisfactory performance, those trained with the optimised hyperparameters show significant enhancements, especially in recall and F1 score. These enhancements illustrate the effectiveness of the hyperparameter optimisation procedure. The findings indicate that although differences in precision among the models are minimal, the enhanced models attain a superior balance between precision and recall, essential for reliable, real-world mushroom identification. This assessment highlights the significance of quantitative measurements and meticulous model optimisation in choosing the most resilient architecture for implementation.
The confusion matrix, depicted in Figure 12, offers a comprehensive visual representation of the classification performance of the two trained models when assessed against a dataset with established ground truth labels. The confusion matrix serves as a fundamental diagnostic tool in machine learning, facilitating a precise evaluation of the accuracy of class predictions by comparing actual class labels (indicated by the matrix rows) with predicted class labels (denoted by the columns). In these normalised matrices, each column sums to one, and the cell values indicate the percentage of forecasts for a specific class.
Figure 12 especially illustrates the confusion matrices of the models trained with evolved and default hyperparameters, emphasising the comparative accuracy of their predictions. Increased diagonal values signify strong agreement between actual and predicted classifications, demonstrating high model precision and recall.
Key performance metrics extracted from the confusion matrix encompass true positives (TPs), indicating instances where the model accurately classified an object as belonging to a certain class, and true negatives (TNs), where the model properly excluded an object from a class. Conversely, false positives (FPs) happen when the model erroneously gives a class label to an item that is not a member, whilst false negatives (FN) denote situations where the model fails to recognise an object that is a member of a class.
The matrices in Figure 12 demonstrate that the bulk of predictions align with the diagonal, signifying that most classifications were accurate, and misclassifications were negligible. This validates the models’ effectiveness in identifying mushroom categories, with the optimised hyperparameter configuration demonstrating a marginal advantage in predictive confidence and class distinction. The examination of the confusion matrix confirms the accuracy of the training technique and validates the dependability of the models in practical mushroom detection applications.

4. Results and Discussion

The results obtained from the experimental process highlight the effectiveness and reliability of the proposed YOLOv5-based approach for wild mushroom detection, specifically targeting Macrolepiota procera. The systematic development and assessment of two customised models, one for general mushroom identification and the other for distinguishing Macrolepiota procera from Agaricus campestris, illustrate that both precision and recall can be significantly enhanced through strategic hyperparameter optimisation employing evolutionary algorithms. The performance measurements, supported by confusion matrix analyses and comparative assessments, demonstrate that the optimised models possess strong generalisation abilities and minimal mistake rates in practical scenarios.
In particular, the primary innovation of our methodology is the integration of vegetation index-based spatial inference (NDRE) with deep learning to direct and limit item detection to areas of high probability. This integration significantly diminishes redundant inference on extraneous terrain, thus enhancing computational efficiency while maintaining accuracy.
In contrast to prior research in mushroom detection, which frequently depended on handheld imaging or RGB-only datasets, our methodology is among the few that employs airborne multispectral data and implements real-time analysis on embedded systems. In the research conducted in [23], mushroom detection was executed utilising deep neural networks in a controlled setting with little variability and without spectral augmentation. Likewise, other plant classification studies utilising YOLOv5 or YOLOv4, as referenced in [25,28], attained commendable accuracy, although they failed to tackle spatial inference or implement models on lightweight hardware in practical settings. Conversely, our advanced YOLOv5 models attained mAP scores over 90% for Macrolepiota procera, with end-to-end inference durations appropriate for real-time application (under 30 min from image capture to result visualisation).
This performance entails trade-offs. The enhanced YOLOv5 model increases accuracy and resilience but also necessitates greater training duration and computing expense during development. Furthermore, the highly optimised system, although rapid and efficient in its intended setting, is presently designed for a specific species emphasis and may necessitate modification to apply broadly across several ecosystems or mushroom varieties. In addition, despite the introduction of recent versions of the YOLO architecture, such as YOLOv7 and YOLOv8, we opted for YOLOv5 due to its stability, established open-source support, and widespread utilisation in embedded and resource-constrained applications. YOLOv5 provides comprehensive hyperparameter tuning capabilities, which were essential for our evolutionary optimisation approach. Moreover, its interoperability with PyTorch and edge devices rendered it more appropriate for real-time, field-based inference within our system limitations. This compromise between state-of-the-art precision and operational efficiency corresponds with the practical objectives of our research.
The superior performance of the Characteristic Procera model underscores the benefits of species-specific training in terms of accuracy and generalisability. Nonetheless, this accuracy incurs a sacrifice in wider applicability. The algorithm excels at identifying Macrolepiota procera, a morphologically unique species, but would likely necessitate retraining or fine-tuning to recognise similarly analogous or less distinctive mushrooms.
Moreover, our approach exhibits efficient end-to-end processing by integrating NDRE-based region filtering with streamlined YOLOv5 inference. This segmented methodology minimises computational requirements and facilitates real-time feedback. Consequently, precise spectrum preprocessing is essential, necessitating calibration for novel settings or camera configurations.
Notwithstanding these accomplishments, some restrictions require attention. Regarding geographical bias, it is a fact that the WOES dataset is limited to the Western Macedonia region of Greece. The vegetation traits, spectral reflectance, and biological circumstances are not indicative of other places, potentially impacting model transferability.
In addition, the dataset primarily concentrates on Macrolepiota procera, which enhances accuracy for this specific target but restricts broader applicability. Extending research to other species, especially those with analogous morphology (both consumable and poisonous), is crucial for future endeavours.
A significant practical and ethical issue relates to the possible misidentification of toxic species, such as Amanita phalloides, as safe edible counterparts. This is not solely a technological constraint but a matter of public safety. Macrolepiota procera, although physically distinct in certain circumstances, may exhibit characteristics similar to certain immature or degraded specimens of dangerous species. Our approach currently lacks the capability for toxic/non-toxic classification and does not do species verification at either the biochemical or genetic level. This model should be regarded as a supplementary detection instrument rather than a conclusive identification method. Human expertise and ecological understanding must remain crucial to any practical foraging or decision-making process reliant on this technology.
Furthermore, the WOES dataset is not available for public release due to privacy concerns, ecological protection, and continuing field research limitations. Although the publication offers detailed accounts of the dataset architecture, preparation methodology, and model configuration for reproducibility, the absence of free access constrains external evaluation. Restricted access may be contemplated within research agreements.
Last but not least, another key advantage of our work is that the total estimated expense of the proposed system, comprising a custom-built UAV platform, a Parrot Sequoia+ multispectral sensor, a Raspberry Pi Zero 2 W for onboard processing, and requisite communication modules, varies from EUR 712 to EUR 1038. This estimate is based on the pricing of open-source, commercially available, and recycled components accessible within academic and maker communities. Commercial UAV multispectral systems, such as the DJI Matrice 300 RTK paired with a MicaSense RedEdge-MX sensor, typically retail in the range of EUR 11,000–16,000, according to official manufacturer listings and confirmed by academic implementations in precision agriculture research [40]. On the other hand, custom UAVs designed for real-time AI processing using Nvidia Jetson TX2 have been built for approximately EUR 2600, indicating a more budget-friendly alternative in the EUR 2300–3700 range [41]. The significant decrease in costs is attained by utilising 3D-printed frames, lightweight microcontrollers, and complimentary, open-source software libraries (YOLOv5 v7.0, PyTorch 2.7.1, QGIS 3.40, OpenCV 4.11.0), thereby removing license costs and minimising infrastructure needs. The system’s cost-efficiency renders it accessible to research laboratories, conservation projects, and resource-limited agricultural applications, substantiating its designation as a low-cost and scalable solution for real-time mushroom identification in natural settings.
Overall our study presents several significant advancements: (1) it broadens YOLOv5’s applicability to species-specific mushroom detection in natural forest settings, (2) it incorporates an evolutionary training strategy to optimise model parameters beyond default configurations, and (3) it highlights the importance of spatial and morphological differentiation in enhancing classification accuracy. These findings collectively underscore the model’s potential as an efficient tool for precision foraging and ecological monitoring, while also providing a transferable framework for similar applications in agricultural and environmental object detection tasks.

5. Conclusions

This study emphasises the necessity of implementing a cohesive and strategic approach to tackle the emerging difficulties in the agricultural sector. The implementation of deep learning (DL) solutions has been demonstrated to be an essential tool for improving production and sustaining product quality, especially in precision agriculture. The experimental results of this study clearly indicate that the proposed method can efficiently locate wild mushrooms and precisely identify Macrolepiota procera, with an excellent accuracy rate over 90%. The identification procedure is highly efficient, taking only 30 min to complete, hence validating the viability of the method for real-world applications.
This research’s contributions present numerous interesting opportunities for future advancement. One method is expanding the WOES dataset to include additional wild mushroom species and their distinct morphological characteristics, hence enhancing the versatility and resilience of the detection models. A complementary dataset has recently been released by our team, derived from similar research endeavours, as outlined in [42]. Moreover, the adaptability of the WOES dataset for implementation on mobile platforms and unmanned aerial vehicles (UAVs) amplifies its capacity for extensive, automated surveillance. Integrating with cloud computing services could enhance this process, facilitating remote operation and real-time decision-making without necessitating human presence in the field.
This discovery signifies a substantial advancement in the utilisation of deep learning-based techniques for environmental and agricultural monitoring. It underscores the revolutionary impact of artificial intelligence in modernising conventional processes and establishes the basis for more autonomous, precise, and sustainable methodologies in precision agriculture.

Author Contributions

Conceptualization, C.C. and P.G.S.; methodology, C.C.; software, S.B.; validation, C.C., S.B. and S.K.G.; formal analysis, C.C.; investigation, C.K.; resources, S.B.; data curation, C.K.; writing—original draft preparation, C.I.; writing—review and editing, S.K.G.; visualization, C.C.; supervision, P.R.-G.; project administration, P.G.S.; funding acquisition, P.G.S. All authors have read and agreed to the published version of the manuscript.

Funding

This research was co-funded by the European Regional Development Fund of the European Union and Greek national funds through the Operational Program Western Macedonia 2014–2020, under the call “Collaborative and networking actions between research institutions, educational institutions and companies in priority areas of the strategic smart specialization plan of the region”, project ”Smart Mushroom fARming with internet of Things-SMART”, project code: DMR-0016521.

Institutional Review Board Statement

The study did not require ethical approval.

Informed Consent Statement

Not applicable.

Data Availability Statement

The data presented in this study are available on request from the corresponding author because the mushrOom Macrolepiota Procera dEtection dataSet (OMPES) and the Wild mushrOom dEtection dataSet (WOES) dataset are not publicly available.

Acknowledgments

We would like to take this opportunity to thank all the anonymous reviewers who contribute to the peer-review process. Their voluntary contributions, based on their experiences in the field, help us to maintain a high standard in our published papers.

Conflicts of Interest

The authors declare no conflicts of interest.

References

  1. Park, H.J. Current Uses of Mushrooms in Cancer Treatment and Their Anticancer Mechanisms. Int. J. Mol. Sci. 2022, 23, 10502. [Google Scholar] [CrossRef] [PubMed]
  2. Garibay-Orijel, R.; Córdova, J.; Cifuentes, J.; Valenzuela, R.; Estrada-Torres, A.; Kong, A. Integrating Wild Mushrooms Use into a Model of Sustainable Management for Indigenous Community Forests. For. Ecol. Manag. 2009, 258, 122–131. [Google Scholar] [CrossRef]
  3. Agrahar-Murugkar, D.; Subbulakshmi, G. Nutritional Value of Edible Wild Mushrooms Collected from the Khasi Hills of Meghalaya. Food Chem. 2005, 89, 599–603. [Google Scholar] [CrossRef]
  4. Rózsa, S.; Andreica, I.; Poșta, G.; Gocan, T.M. Sustainability of Agaricus blazei Murrill Mushrooms in Classical and Semi-Mechanized Growing System, through Economic Efficiency, Using Different Culture Substrates. Sustainability 2022, 14, 6166. [Google Scholar] [CrossRef]
  5. Moysiadis, V.; Sarigiannidis, P.; Vitsas, V.; Khelifi, A. Smart Farming in Europe. Comput. Sci. Rev. 2021, 39, 100345. [Google Scholar] [CrossRef]
  6. Boursianis, A.D.; Papadopoulou, M.S.; Diamantoulakis, P.D.; Liopa-Tsakalidi, A.; Barouchas, P.; Salahas, G.; Karagiannidis, G.K. Internet of Things (IoT) and Agricultural Unmanned Aerial Vehicles (UAVs) in Smart Farming: A Comprehensive Review. Internet Things 2022, 18, 100187. [Google Scholar] [CrossRef]
  7. Amatya, S.; Karkee, M.; Zhang, Q.; Whiting, M.D. Automated Detection of Branch Shaking Locations for Robotic Cherry Harvesting Using Machine Vision. Robotics 2017, 6, 31. [Google Scholar] [CrossRef]
  8. Uryasheva, A.; Kalashnikova, A.; Shadrin, D.; Evteeva, K.; Moskovtsev, E.; Rodichenko, N. Computer Vision-Based Platform for Apple Leaves Segmentation in Field Conditions to Support Digital Phenotyping. Comput. Electron. Agric. 2022, 201, 107269. [Google Scholar] [CrossRef]
  9. Zahan, N.; Hasan, M.Z.; Malek, M.A.; Reya, S.S. A Deep Learning-Based Approach for Edible, Inedible and Poisonous Mushroom Classification. In Proceedings of the 2021 International Conference on Information and Communication Technology for Sustainable Development (ICICT4SD), Dhaka, Bangladesh, 27–28 February 2021; pp. 440–444. [Google Scholar] [CrossRef]
  10. Picek, L.; Šulc, M.; Matas, J.; Heilmann-Clausen, J.; Jeppesen, T.S.; Lind, E. Automatic Fungi Recognition: Deep Learning Meets Mycology. Sensors 2022, 22, 633. [Google Scholar] [CrossRef] [PubMed]
  11. Lee, J.J.; Aime, M.C.; Rajwa, B.; Bae, E. Machine Learning-Based Classification of Mushrooms Using a Smartphone Application. Appl. Sci. 2022, 12, 11685. [Google Scholar] [CrossRef]
  12. Siniosoglou, I.; Argyriou, V.; Bibi, S.; Lagkas, T.; Sarigiannidis, P. Unsupervised Ethical Equity Evaluation of Adversarial Federated Networks. In Proceedings of the 16th International Conference on Availability, Reliability and Security, Vienna, Austria, 17–20 August 2021; pp. 1–6. [Google Scholar] [CrossRef]
  13. Martínez-Ibarra, E.; Gómez-Martín, M.B.; Armesto-López, X.A. Climatic and Socioeconomic Aspects of Mushrooms: The Case of Spain. Sustainability 2019, 11, 1030. [Google Scholar] [CrossRef]
  14. Barea-Sepúlveda, M.; Espada-Bellido, E.; Ferreiro-González, M.; Bouziane, H.; López-Castillo, J.G.; Palma, M.; Barbero, G.F. Toxic Elements and Trace Elements in Macrolepiota procera Mushrooms from Southern Spain and Northern Morocco. J. Food Compos. Anal. 2022, 108, 104419. [Google Scholar] [CrossRef]
  15. Adamska, I.; Tokarczyk, G. Possibilities of Using Macrolepiota procera in the Production of Prohealth Food and in Medicine. Int. J. Food Sci. 2022, 2022, 5773275. [Google Scholar] [CrossRef]
  16. Chaschatzis, C.; Karaiskou, C.; Goudos, S.K.; Psannis, K.E.; Sarigiannidis, P. Detection of Macrolepiota procera Mushrooms Using Machine Learning. In Proceedings of the 2022 5th World Symposium on Communication Engineering (WSCE), Nagoya, Japan, 16–18 September 2022; pp. 74–78. [Google Scholar] [CrossRef]
  17. Wei, B.; Zhang, Y.; Pu, Y.; Sun, Y.; Zhang, S.; Lin, H.; Zeng, C.; Zhao, Y.; Wang, K.; Chen, Z. Recursive-YOLOv5 Network for Edible Mushroom Detection in Scenes With Vertical Stick Placement. IEEE Access 2022, 10, 40093–40108. [Google Scholar] [CrossRef]
  18. Subramani, S.; Imran, A.F.; Abhishek, T.T.M.; Karthik, S.; Yaswanth, J. Deep Learning Based Detection of Toxic Mushrooms in Karnataka. Procedia Comput. Sci. 2024, 235, 91–101. [Google Scholar] [CrossRef]
  19. Wang, Y.; Yang, L.; Chen, H.; Hussain, A.; Ma, C.; Al-gabri, M. Mushroom-YOLO: A Deep Learning Algorithm for Mushroom Growth Recognition Based on Improved YOLOv5 in Agriculture 4.0. In Proceedings of the 2022 IEEE 20th International Conference on Industrial Informatics (INDIN), Perth, Australia, 25–28 July 2022; pp. 239–244. [Google Scholar] [CrossRef]
  20. Panyasiri, K.; Srisai, T.; Srisai, P.; Chaiyaprasert, W.; Srisai, S. Mushroom Spawn Quality Classification with Machine Learning. Comput. Electron. Agric. 2020, 179, 105814. [Google Scholar] [CrossRef]
  21. Tutuncu, K.; Cinar, I.; Kursun, R.; Koklu, M. Edible and Poisonous Mushrooms Classification by Machine Learning Algorithms. In Proceedings of the 2022 11th Mediterranean Conference on Embedded Computing, Budva, Montenegro, 7–10 June 2022; pp. 1–4. [Google Scholar] [CrossRef]
  22. Yin, H.; Yi, W.; Hu, D. Computer vision and machine learning applied in the mushroom industry: A critical review. Comput. Electron. Agric. 2022, 198, 107015. [Google Scholar] [CrossRef]
  23. Zhang, D.; Huang, Z.K.; Wang, H.; Wu, Y.P.; Wang, Y.; Zou, J.H. Research and Application of Wild Mushrooms Classification Based on Multi-Scale Features to Realize Hyperparameter Evolution. J. Graph. 2022, 43, 580–589. Available online: http://www.txxb.com.cn/EN/10.11996/JG.j.2095-302X.2022040580 (accessed on 17 June 2025).
  24. Luo, Y.; Zhang, Y.; Sun, X.; Dai, H.; Chen, X. Intelligent Solutions in Chest Abnormality Detection Based on YOLOv5 and ResNet50. J. Healthc. Eng. 2021, 2021, 2267635. [Google Scholar] [CrossRef] [PubMed]
  25. Wang, A.; Peng, T.; Cao, H.; Xu, Y.; Wei, X.; Cui, B. TIA-YOLOv5: An Improved YOLOv5 Network for Real-Time Detection of Crop and Weed in the Field. Front. Plant Sci. 2022, 13, 1091655. [Google Scholar] [CrossRef]
  26. Mohanty, T.; Pattanaik, P.; Dash, S.; Tripathy, H.P.; Holderbaum, W. Smart Robotic System Guided with YOLOv5 Based Machine Learning Framework for Efficient Herbicide Usage in Rice (Oryza sativa L.) under Precision Agriculture. Comput. Electron. Agric. 2025, 231, 110032. [Google Scholar] [CrossRef]
  27. Yang, W.; Qiu, X. A Novel Crop Pest Detection Model Based on YOLOv5. Agriculture 2024, 14, 275. [Google Scholar] [CrossRef]
  28. Raza, A.; Shaikh, M.K.; Siddiqui, O.A.; Ali, A.; Khan, A. Enhancing Agricultural Pest Management with YOLO V5: A Detection and Classification Approach. UMT Artif. Intell. Rev. 2023, 3, 21–43. [Google Scholar] [CrossRef]
  29. Jiang, Z.; Yin, B.; Lu, B. Precise Apple Detection and Localization in Orchards using YOLOv5 for Robotic Harvesting Systems. arXiv 2024. [Google Scholar] [CrossRef]
  30. Khanal, S.R.; Sapkota, R.; Ahmed, D.; Bhattarai, U.; Karkee, M. Machine Vision System for Early-stage Apple Flowers and Flower Clusters Detection for Precision Thinning and Pollination. arXiv 2023. [Google Scholar] [CrossRef]
  31. Choudhary, V.; Guha, P.; Mishra, S. Novel YOLOv5 Model for Automatic Detection of Cowpea Leaves: Smart Agriculture. Asian J. Converg. Technol. 2023, 9, 1–6. [Google Scholar] [CrossRef]
  32. Xue, J.; Su, B. Significant Remote Sensing Vegetation Indices: A Review of Developments and Applications. J. Sens. 2017, 2017, 1353691. [Google Scholar] [CrossRef]
  33. Davidson, C.; Jaganathan, V.; Sivakumar, A.N.; Czarnecki, J.M.P.; Chowdhary, G. NDVI/NDRE Prediction from Standard RGB Aerial Imagery Using Deep Learning. Comput. Electron. Agric. 2022, 203, 107396. [Google Scholar] [CrossRef]
  34. Gitelson, A.A.; Viña, A.; Ciganda, V.; Rundquist, D.C.; Arkebauer, T.J. Remote estimation of canopy chlorophyll content in crops. Geophys. Res. Lett. 2005, 32. [Google Scholar] [CrossRef]
  35. Solano-Alvarez, N.; Valencia-Hernández, J.A.; Vergara-Pineda, S.; Millán-Almaraz, J.R.; Torres-Pacheco, I.; Guevara-González, R.G. Comparative Analysis of the NDVI and NGBVI as Indicators of the Protective Effect of Beneficial Bacteria in Conditions of Biotic Stress. Plants 2022, 11, 932. [Google Scholar] [CrossRef] [PubMed]
  36. Steven, M.D. The Sensitivity of the OSAVI Vegetation Index to Observational Parameters. Remote Sens. Environ. 1998, 63, 49–60. [Google Scholar] [CrossRef]
  37. Kılıç, D.K.; Nielsen, P. Comparative Analyses of Unsupervised PCA K-Means Change Detection Algorithm from the Viewpoint of Follow-Up Plan. Sensors 2022, 22, 9172. [Google Scholar] [CrossRef] [PubMed]
  38. Skalski, P. Make Sense. 2025. Available online: https://github.com/SkalskiP/make-sense/ (accessed on 17 June 2025).
  39. Goutte, C.; Gaussier, E. A Probabilistic Interpretation of Precision, Recall and F-Score, with Implication for Evaluation. In Proceedings of the Advances in Information Retrieval, Santiago de Compostela, Spain, 21–23 March 2005; Losada, D.E., Fernández-Luna, J.M., Eds.; Springer: Berlin/Heidelberg, Germany, 2005; pp. 345–359. [Google Scholar]
  40. Deng, L.; Mao, Z.; Li, X.; Hu, Z.; Duan, F.; Yan, Y. UAV-based multispectral remote sensing for precision agriculture: A comparison between different cameras. ISPRS J. Photogramm. Remote Sens. 2018, 146, 124–136. [Google Scholar] [CrossRef]
  41. Sa, I.; Chen, Z.; Popovic, M.; Khanna, R.; Liebisch, F.; Nieto, J.; Siegwart, R. weedNet: Dense Semantic Weed Classification Using Multispectral Images and MAV for Smart Farming. arXiv 2017. [Google Scholar] [CrossRef]
  42. Moysiadis, V.; Chaschatzis, C.; Triantafyllou, A.; Liatifis, A.; Siniosoglou, I.; Kelly, V.; Karaiskou, C.; Tsiamitros, D.; Kakamoukas, G.; Krestou, A.; et al. Pleurotus Mushroom Dataset. 2025. Available online: https://ieee-dataport.org/documents/pleurotus-mushroom-dataset (accessed on 17 June 2025).
Figure 1. Ground-level and aerial imagery of wild mushrooms captured in a natural forest environment in Western Macedonia, Greece. The images depict various mushroom growth stages and environments, showcasing both close-up ground perspectives and drone-acquired aerial views. These visual samples form part of the WOES dataset and illustrate the diversity in morphology, lighting conditions, and vegetation context, which are critical for training and validating the YOLOv5-based object detection models.
Information 16 00539 g001
Figure 2. Geographic location of the study area used for data collection, situated in the western part of the Macedonia region in Northern Greece. The marked region represents the forested terrain, where aerial and ground imagery of wild mushrooms was captured using UAV platforms. The environmental conditions in this area—such as seasonal humidity, vegetation density, and natural mushroom proliferation—make it a representative site for testing automated detection methods in real-world forest ecosystems.
Information 16 00539 g002
Figure 3. Assembly process of a custom-built unmanned aerial vehicle (UAV) used for aerial data acquisition in the study. The drone was constructed using low-cost, off-the-shelf components and 3D-printed structural parts to ensure affordability and replicability. Key hardware includes a Parrot Sequoia+ multispectral camera, Raspberry Pi Zero 2 for onboard processing and video streaming, OpenPilot CC3D flight controller, GPS module, and 2300 KV brushless motors. This platform enables high-resolution image capture and real-time monitoring, forming the backbone of the mushroom detection pipeline presented in this research.
Information 16 00539 g003
Figure 4. Visualisation of the five spectral bands captured by the Parrot Sequoia+ multispectral camera used in this study. (a) GREEN (550 nm), (b) Near-Infrared (NIR, 790 nm), (c) RED (660 nm), (d) Red Edge (REDEDGE, 735 nm), and (e) RGB (standard visible light composite). Each band captures different reflectance characteristics of vegetation and ground surfaces, which are critical for identifying spectral signatures of wild mushrooms. These bands are individually processed and aligned to enable vegetation index calculations (e.g., NDVI, NDRE) and support accurate detection using the YOLOv5 object detection framework.
Information 16 00539 g004
Figure 5. Comparison of two unprocessed spectral bands captured by the UAV-mounted multispectral camera: (a) Near-Infrared (NIR) and (b) RED. The images illustrate differences in spectral reflectance that are critical for vegetation and mushroom detection. In this example, the mushroom target is tangent to the red line in the NIR band and to the green line in the RED band, highlighting positional discrepancies that require spectral alignment. Accurate band registration is essential for calculating vegetation indices (e.g., NDRE) and ensuring pixel-level correspondence in multispectral analysis for object detection.
Information 16 00539 g005
Figure 6. Multispectral band processing workflow for wild mushroom detection. (ad) Raw spectral band images captured by the Parrot Sequoia+ camera: (a) GREEN (550 nm), (b) Near-Infrared (NIR, 790 nm), (c) RED (660 nm), and (d) Red Edge (REDEDGE, 735 nm). These unprocessed bands exhibit misalignments and varying reflectance values. (fi) Corresponding band images after geometric alignment to the REDEDGE reference, cropping to a common region of interest, and application of band-specific frequency thresholds (see Table 3) to highlight high-reflectance regions indicative of mushroom presence. (e) RGB composite image manually annotated by researchers (orange bounding boxes) to provide ground-truth labels of wild mushrooms for training and validation. This figure demonstrates the critical preprocessing steps—alignment, thresholding, and annotation—that underpin accurate vegetation index calculation and YOLOv5-based object detection in heterogeneous forest scenes.
Information 16 00539 g006
Figure 10. Statistical visualisation of the annotated data in the OMPES and WOES datasets used for training the mushroom detection models. (a) Bar chart showing the distribution of labelled objects (i.e., mushroom instances) across different classes within the datasets, highlighting the predominance of Macrolepiota procera. (b) Normalised target location map illustrating the spatial distribution of annotated objects in image frames using a Cartesian coordinate system; this helps assess positional bias in annotation. (c) Normalised target size map displaying the relative scale of annotated mushrooms, revealing the concentration of object sizes, which informs model sensitivity to scale variance. These insights support dataset quality assessment and model training strategy.
Information 16 00539 g010
Figure 11. Pipeline of the training and evaluation process, illustrating the logic executed after initial drone deployment. The pipeline begins by checking the current UAV altitude: If the altitude is greater than 20 m, the system directly executes the YOLOv5 model to detect potential wild mushrooms in wide-area multispectral imagery. If the altitude is 20 m or lower, the UAV captures localised images which are then (a) cropped into regions of interest (ROIs), (b) processed through contrast and brightness adjustments, and (c) analysed using a specialised YOLOv5 model to detect distinguishing features of Macrolepiota procera. This tiered decision structure enables efficient detection by balancing high-level scanning with low-altitude precision analysis based on drone altitude and image quality.
Information 16 00539 g011
Figure 12. Confusion matrices illustrating the classification performance of four YOLOv5-based object detection models used in this study for wild mushroom detection and species-specific identification. (a) Wild Mushroom Model (default hyperparameters): baseline performance of the general mushroom detection model using YOLOv5 with unmodified default settings. (b) WildHyperparameters Model (evolved hyperparameters): optimised version of the general mushroom detection model, utilising evolutionary algorithms to fine-tune hyperparameters for improved accuracy. (c) Characteristic Macrolepiota procera Model (default hyperparameters): a focused model trained to detect morphological traits specific to Macrolepiota procera using default YOLOv5 settings. (d) Characteristic Macrolepiota procera Model (evolved hyperparameters): enhanced version of the Procera-specific model incorporating evolved hyperparameters for improved precision and recall. Each confusion matrix shows true positive, false positive, false negative, and true negative counts, providing insight into model accuracy, generalisation, and misclassification trends.
Information 16 00539 g012
Table 1. Comparison of recent studies in mushroom detection and smart agriculture with our proposed approach. The table outlines each study’s focus, methods used, key limitations, and the specific gaps addressed. Our work is distinguished by its integration of UAV-based multispectral imaging, species-specific detection, and real-time inference in natural environments.
StudyFocus AreaTechniques UsedLimitation or GapGap Filled by Our Work
[18]Toxic vs. non-toxic classification using deep learningSVM, ResNet50, YOLOv5, AlexNetNo species-specific or habitat localizationAdds spatial mapping and species-specific wild detection
[19]Spawn quality detection in controlled environmentsDNN, SVM, KNN, NCC, Decision TreesNot applicable to wild mushrooms or field detectionApplies real-time object detection in natural habitats
[20]Growth detection of shiitake mushrooms indoorsImproved YOLOv5, Cloud system (iMushroom)Limited to indoor, controlled conditionsExtends YOLOv5 use to outdoor, wild scenarios
[21]Classification of edible vs. poisonous mushrooms using tabular dataC4.5, Naive Bayes, SVM, Logistic Regression (WEKA)No visual or spatial recognition, only dataset-based classificationUtilizes vision-based detection rather than tabular data
[22]Review of CV/ML applications in mushroom productionSurvey and analysis of ML/CV methodsLacks implementation or model deployment; broad scopeImplements a field-deployable, targeted solution addressing specific species in wild
[17]Detection of edible mushrooms using high-resolution imaging and real-time object recognitionObject detection algorithm with industrial cameras; cloud computing supportFocuses on edible mushroom state detection, not species identification or spatial mapping in wild environmentsAdds species-specific identification and geospatial mapping in natural, unstructured forest settings
[23]Wild mushroom classification using attention mechanisms and lightweight deploymentCBAM, multi-scale fusion, hyperparameter evolution, enhanced YOLOv5Focused on recognition and mobile deployment; lacks spatial mapping for in situ wild mushroom harvestingAdds geographic probability mapping and detection integration for wild harvesting scenarios
[24]Medical image analysis using YOLOv5 for chest anomaly detection in X-raysYOLOv5 with ResNet50, Fast RCNN, EfficientDet, evaluation on VinBigData datasetNon-agricultural application; limited to clinical X-ray data without environmental or field contextExtends YOLOv5 utility to outdoor, real-time agricultural object detection and habitat analysis
[25,26,27,28,29,30,31]Smart agriculture applications, including crop/weed detection, pest control, and plant health monitoringYOLOv5 with attention modules, transformers, data augmentation, transfer learningTask-specific models; lacks integrated species-level detection with environmental spatial correlationCombines YOLOv5 with spatial mapping to support wild mushroom detection and area prediction
Table 2. Calibration parameters used for aligning multispectral image bands to a common reference (REDEDGE) during preprocessing. The values represent pixel offsets applied to the top-left corner of each band (NIR, RED, GREEN, RGB) in order to ensure accurate spatial alignment across all spectral layers. This alignment is critical for generating consistent vegetation indices and enabling pixel-accurate object detection in multispectral imagery.
BandLeftUp
NIR1624
RED3515
GREEN292
RGB2120
Table 3. Optimal frequency threshold ranges (in kilohertz) for each spectral band used in multispectral image analysis to identify potential wild mushroom regions. These thresholds were empirically determined using QGIS tools and highlight reflectance values associated with chlorophyll-rich vegetation, where mushrooms are likely to grow. Applying these thresholds enables more accurate segmentation of candidate areas in NDRE, NDVI, and related vegetation indices.
BandLower Threshold (kHz)Upper Threshold (kHz)
NIR3840
RED3739
GREEN3840
RGB1618
Table 4. Summary of training hyperparameters used for YOLOv5 model development. Parameters include learning rate, batch size, image dimensions, number of epochs, and optimiser settings. These configurations were applied to both the general wild mushroom detection model and the Macrolepiota procera-specific model.
HyperparameterDefaultEvolve (Wild Mushrooms)Evolve (Characteristic Procera)
lr00.010.010480.01451
lrf0.010.015030.01
momentum0.9370.936030.90295
weight_decay0.00050.000480.00042
warmup_epochs3.04.15973.9362
warmup_momentum0.80.950.54134
warmup_bias_lr0.10.126560.10064
box0.050.038720.04636
cls0.50.371510.4517
cls_pw1.01.06251.0195
obj1.01.00870.97986
obj_pw1.02.02.0
iou_t0.200.20.2
anchor_t4.05.57272.879
fl_gamma0.00.00.0
hsv_h0.0150.021620.01234
hsv_s0.70.701830.9
hsv_v0.40.330020.43276
degrees0.00.00.0
translate0.10.032930.11176
scale0.50.424950.43276
shear0.00.424950.0
perspective0.00.00.0
flipud0.00.00.0
fliplr0.50.50.5
mosaic1.00.611210.43276
mixup0.00.00.0
copy_paste0.00.00.0
Table 5. Performance metrics (precision, recall, F1-score, mAP) for wild mushroom detection models, comparing default and evolved hyperparameter settings for both general and Macrolepiota procera-specific detection tasks.
ModelHyperparametersmAPPRF1
Wild MushroomsDefault0.950.970.910.94
Wild MushroomsEvolved0.980.980.940.96
Characteristic ProceraDefault0.750.910.720.80
Characteristic ProceraEvolved0.830.890.820.85
Disclaimer/Publisher’s Note: The statements, opinions and data contained in all publications are solely those of the individual author(s) and contributor(s) and not of MDPI and/or the editor(s). MDPI and/or the editor(s) disclaim responsibility for any injury to people or property resulting from any ideas, methods, instructions or products referred to in the content.

