Abstract
Churn prediction has become one of the core concepts in customer relationship management within the insurances, telecom, and internet service provider industries, which is essential in customer retention. Therefore, this study attempts to analyze the effectiveness of the advanced machine learning and deep learning models for churn prediction in the evaluation of the models’ performance across different sectors. This would help conclude whether the varied patterns of the churn throughout different sectors to the level that affects the model performance and to what extent. The work includes three datasets: namely, insurance churn, internet service provider customer churn, and Telecom churn datasets. The implementation and comparison conducted in this study of models include XGBoost, Convolutional Neural Networks (CNNs), and Ensemble Deep Learning with the pre-trained hybrid approach. The results show that the ensemble deep learning model outperforms other models in terms of accuracy and F1-score, achieving accuracies of up to 95.96% in the insurance churn dataset and of 98.42% in the telecom churn dataset. Moreover, traditional machine learning models like XGBoost also produced competitive results for selected datasets. The proposed deep learning ensembles reveal the strength and possibility for churn prediction and provide a benchmark for future research relevant to customer retention strategies. Also, the proposed ensemble deep learning model shows stable performance across different sectors, which reflects its ability to capture the varied churn patterns of different sectors.
1. Introduction
Customer churn or customer attrition occurs when certain individual clients terminate services and products from a particular company. That is, this is the point when a consumer is no longer counted as a customer. The task of predicting and managing churn is highly significant for a company intending at counter competitors and making profits [1]. This requires linking customer behaviors with product offerings customers could have with new products and offers with customer behaviors themselves that make them churn [2,3]. Customer churn is represented by the churn rate. This rate depicts the proportion of customers who cease to be clients within a period, be it a year, month, or even a fiscal quarter. An accurate prediction of churn, thus, enables companies to take actions before the event occurs, such as discount, gift, promotion, or any other such benefit which can discourage a customer from leaving. Thus, the company does not merely lose a customer but also gets loyal consumers and an increase in profits [4,5].
Using deep learning techniques is becoming one of the most powerful solutions of the time against the difficult surfacing of challenges forecasted by churn, providing the optimum prediction and the ability to learn convoluted patterns in customer behavior. Despite that, generally, traditional analyses like logistic regression and artificial neural networks have not been up to the mark in terms of accuracy under certain conditions like imbalanced datasets and outlier detection. Several methods have been proposed in a number of studies to meet these issues through developing innovative deep learning models and ensemble approaches towards improved prediction performance [6,7,8].
The most significant step forward has been in implementing churn prediction models through the availability of publicly accessible datasets in various industries. For instance, Kaggle has hosted the Telco Customer Churn Dataset (https://www.kaggle.com/datasets/blastchar/telco-customer-churn, accessed on 1 May 2025), which is a comprehensive collection of customer demographics, account information, and service usage patterns, which is widely used as a benchmark for churn modeling in the telecommunications industry [8,9]. The Bank Marketing Dataset, extracted from a Portuguese bank, showcases the customer connection as it engages in marketing campaigns, thus, giving insightful insights into churn behavior in financial services [10,11]. Equally, Online Retail II captures customer transactions for an online retailer, which will enable researchers to examine churn in an e-commerce setting [12]. In addition to that, some datasets, such as Airline Passenger Satisfaction Dataset, provide the use of the dataset for churn behaviors in the airline industry [13].
Many of the newer hybrid models, which combine deep learning with traditional machine learning, have recently emerged and used in a variety of studies. An example of this is on how both the CNN-RNN hybrid has been proposed to effectively capture possible spatial-temporal patterns in customer behavior [14]. Meanwhile, research has also shown how attention-based transformers are being used as feature selection enhancers and increase interpretability in modeling customer churn [15]. The application of graph neural networks (GNNs) also reflects promising advances in modeling relationships between the transactions that all customers make and their interactions with the organization, providing a more innovative perspective with predictive analytics [16].
In this study, churn prediction is performed across three different business sectors (i.e., datasets), which are Internet, Insurance, and Telecom customer data. This research intends to show the applicability of advanced approaches as compared to previous approaches by evaluating using a single machine learning model (XGBoost) and two deep learning architectures (a CNN and Ensemble Deep Learning model). Measures such as true churn, false churn, specificity, precision, and accuracy are used to evaluate the performance of the proposed methodologies.
The present research uses a combination of a machine learning model-XGBoost and two deep learning architectures—CNN and Ensemble Deep Learning—to address churn prediction in heterogeneous datasets. XGBoost has been selected because it works well with tabular data and has high classification accuracy, can handle class imbalance, and is computationally inexpensive; thus, it has become a standard benchmark in churn prediction studies. Conversely, CNN is chosen for its ability to capture the local patterns in sequential customer’s data, including behaviors working in the usage section, which are predominant for the selected datasets. The Ensemble Deep Learning model, combining a Deep Feature Extractor (DFE-CNN) with a Lightweight Feature Extractor (LFE-CNN), engages advantages from both deep and light architectures through ensemble averaging to increase accuracy and generalization. By employing machine learning algorithms such as XGBoost which concentrates on speed and interpretability while also utilizing techniques that efficiently handle complex relating and non-linear patterns from big datasets. It is, therefore, appropriate to utilize both to assess churn prediction comparatively and thoroughly. This careful method selection provides a historical and forward-looking view of the churn prediction landscape-in current state of the art, accommodating varying data characteristics and churn dynamics.
The primary contributions of this study are summarized as follows:
- Via this systematic evaluation, the study is the first to exhibit the accomplishments of Ensemble Learning across sectors (Insurance, ISPs, and Telecom) and the apparent generalizability of these techniques despite different churn patterns, as for instance, it better offers driving churn in Insurance and service coverage affecting churn in Telecom. This cross-sectoral study offers new insights pertaining to the adaptability of predictive models for application to different industrial contexts—a gap never filled before in the literature.
- We present the first direct comparison between Ensemble Deep Learning (integrating Deep Feature Extractor (DFE-CNN) and Lightweight Feature Extractor (LFE-CNN)) and Ensemble Machine Learning (XGBoost), offering a novel perspective on their relative strengths and weaknesses across datasets. This comparison highlights the superior generalization of Ensemble Deep Learning in complex datasets like Insurance (95.96% accuracy) and the efficiency of XGBoost in others like ISP (95.36% accuracy).
- The study introduces a novel Ensemble Deep Learning architecture by combining DFE-CNN and LFE-CNN, balancing predictive accuracy and computational efficiency. This innovative design achieves state of the art performance (e.g., 98.42% accuracy in Telecom) and sets a new benchmark for hybrid deep learning models in churn prediction.
- Our findings encourage organizations across sectors to adopt a single predictive paradigm with little customization, thereby reducing costs of development activity while improving their strategy to retain customers targeting actual intervention pros (e.g., discounts or promotion).
- By analyzing churn behaviors across sectors, the study uncovers new insights into how sector-specific factors influence model effectiveness, contributing to a deeper understanding of customer behavior dynamics in churn prediction.
Research Hypotheses:
H1:
Ensemble Deep Learning outperforms traditional ML models (e.g., XGBoost) in churn prediction by effectively capturing diverse sector-specific patterns.
H2:
Cross-sectoral comparisons reveal consistent model performance despite varying churn drivers, enabling unified retention strategies.
To summarize, this section discusses the significance of churn prediction serves as an important customer retention strategy in industries such as insurance, telecom, internet services, and others. With this, the topic also encompassed economic implications and the need for advanced models of prediction. The following section will review the literature so as to place the present study within the broader research landscape, pointing to gaps that our methodology seeks to fill.
This paper is organized as follows. The introduction provides the background and motivation for this study. Section 2 reviews the related work, highlighting existing approaches in churn prediction. The datasets used in this study are described in Section 3, followed by the methodology, including preprocessing and model development. The results and discussion are presented in Section 4, analyzing the model performance. Section 5 discusses explainable AI (XAI) and model interpretability, providing insights into the interpretability of the proposed models. Finally, Section 6 provides the conclusions and future research directions.
2. Literature Review
In the last few years, various developments have taken place in churn prediction techniques or applications designed for using existing machine learning methods with modifications. This has seen research efforts extended in different sectors such as telecom, human resources, banking, and other financial services. Every company has the incentive to invest in the effectively strategies to prevent customer loss while informing him of any new products [17]. In addition, companies need decision support systems for managing continuity programs such as churn analysis, which supports the identification and addressing of potential churners. Here, related works are structuredly categorized in three main sectors: telecommunications, human resources, and e-commerce. Each subsection summarizes the problem addressed, dataset used, algorithms applied, major results, and limitations.
2.1. Churn Prediction in Telecommunications
More churn studies have been conducted in telecommunication via data mining or machine learning. Churn prediction has improved with the integration of customer behavioral data. The data came from one of the Iranian telecom providers, while algorithms applied are decision trees, Naïve Bayes, and artificial neural networks. The results indicated that decision trees performed better than any other model by achieving 85% accuracy. Nevertheless, this study was limited geographically since a real-time evaluation was not available [18]. Churn prediction has been improved by incorporating customer behavioral data. A dataset from an Iranian telecom provider was used and applied decision trees, Naïve Bayes, and artificial neural networks. The results indicated that decision trees had a better performance than the other models, achieving 85% precision. However, the study was limited to the geographic coverage of the dataset and left out real-time evaluation [18].
One of the methods to improve the performance of churn prediction modeling is attribute selection. In one study using private operator telecom data, researchers performed feature selection and experimentation with random forests and logistic regression models. They found that attribute selection improved predictive accuracy by 10% but not for deep learning approaches [19]. Customer churn has also been predicted using ensemble learning techniques. Data from an Indian telecommunications company was used to produce gradient boosting and XGBoost models which achieved an F1-score of up to 88%. A major limitation was imbalanced data, which could only be overcome by oversampling techniques to make better predictions on minority classes [20].
2.2. Churn Prediction in Human Resources
Employee churn prediction shares similarities with customer churn in terms of modeling and predictive techniques. This machine learning model for predicting employee attrition has been applied to HR data consisting of an analysis of a global corporation for applying decision trees, support vecto machines, and logistic regression. The model attained an accuracy of 82%, but the application of the model was limited by the non-existence of any form of external validation [21]. The ensemble learning technique is proposed for employee churn prediction. Testing with the HR dataset containing over 10,000 employee records, random forests, boosting techniques, and neural networks are among the techniques used. The ensemble model achieved 90% accuracy, surpassing the results obtained from individual classifiers. However, interpretability is still a challenge when using the feature [22].
Clustering-based human resources analytics technique has also been studied for the prediction of employee attrition. Optimized artificial neural networks were combined with data augmentation techniques to enhance prediction accuracy. The model utilizing these HR datasets achieved an accuracy rate of 88%, signifying the merit for clustering and optimization of ANN. The only limitation was the model’s computational complexity because it was not feasible at the large-scale level [23].
2.3. Churn Prediction in E-Commerce
With the rise of online shopping, e-commerce platforms have increasingly adopted advanced machine learning and deep learning methods for churn prediction.
The ever-increasing survey of applicability on machine learning and deep learning techniques in e-commerce is highlighting major aspects of areas including fraud detection, recommender systems, and customer churn prediction. Some challenges that were noted include those of imbalanced data, generalization, and interpretation, emphasizing the need for robust models improving churn prediction [24]. Customer churn prediction in e-commerce subscription services using a recurrent neural network (RNN) model has shown promising results using attention mechanisms. The model achieved a very high accuracy of around 97% compared with traditional methods by capturing the temporal dependencies in subscription-based interactions. Furthermore, the attention mechanism provided insights into important features leading to customer churn which can help develop proactive retention strategies [25].
A hybrid spatial and machine learning approach predicting customer churn in a retail e-commerce business. For this purpose, a dataset was created consisting of numerical data about the orders, text-based after-sales reviews, and socio-geodemographic data, used to build predictive models with extreme gradient boosting and an analysis of variance with logistic regression. The main findings from the analysis were as follows: 1. The combination of order payment value, number of items purchased and shipping cost was very influential regarding the churn probability, while the remaining very influential ones, population density and qualitative review opinion value of products, becomes less influential to customer attrition with respect to [26].
These studies mainly indicate the evolution of churn prediction in e-commerce, which has proved not only predictive performance but also the incorporation of advanced techniques along with deep learning architectures, spatial analytics, and hybrid dimensions in furtherance of interpretability.
2.4. Hybrid and Advanced Techniques
Studies into hybrid models that integrate different types of techniques for the improvement of churn predictions have been very extensive. An AdaBoost-based approach was proposed that performed better than conventional models in predicting churn for financial services, but its dependence on boosting made it more sensitive to noise [27]. A hybrid swarm-Intelligence-based neural network that combined particle swarm optimization (PSO) with feedforward networks was implemented. The predictive accuracy was increased; however, the cost of computation was very high [28].
In summary, several churn prediction studies were discussed, the latter of which are in telecommunications, human resources, e-commerce, and hybrid approaches, thus, tracing the evolution of studies from conventional machine learning to the presently popular areas of deep learning and ensemble methods. The well-known researches have achieved significant accuracy (e.g., accuracy using SVM-POLY [29] and accuracy using optimized ANNs [23]) though the problems of imbalance and computational complexity are yet to be addressed. In the next section, a methodology will be laid out to build upon this literature and propose a strong evaluation framework encompassing XGBoost, CNN, and Ensemble Deep Learning models on a vary dataset basis.
3. The Proposed Methodology
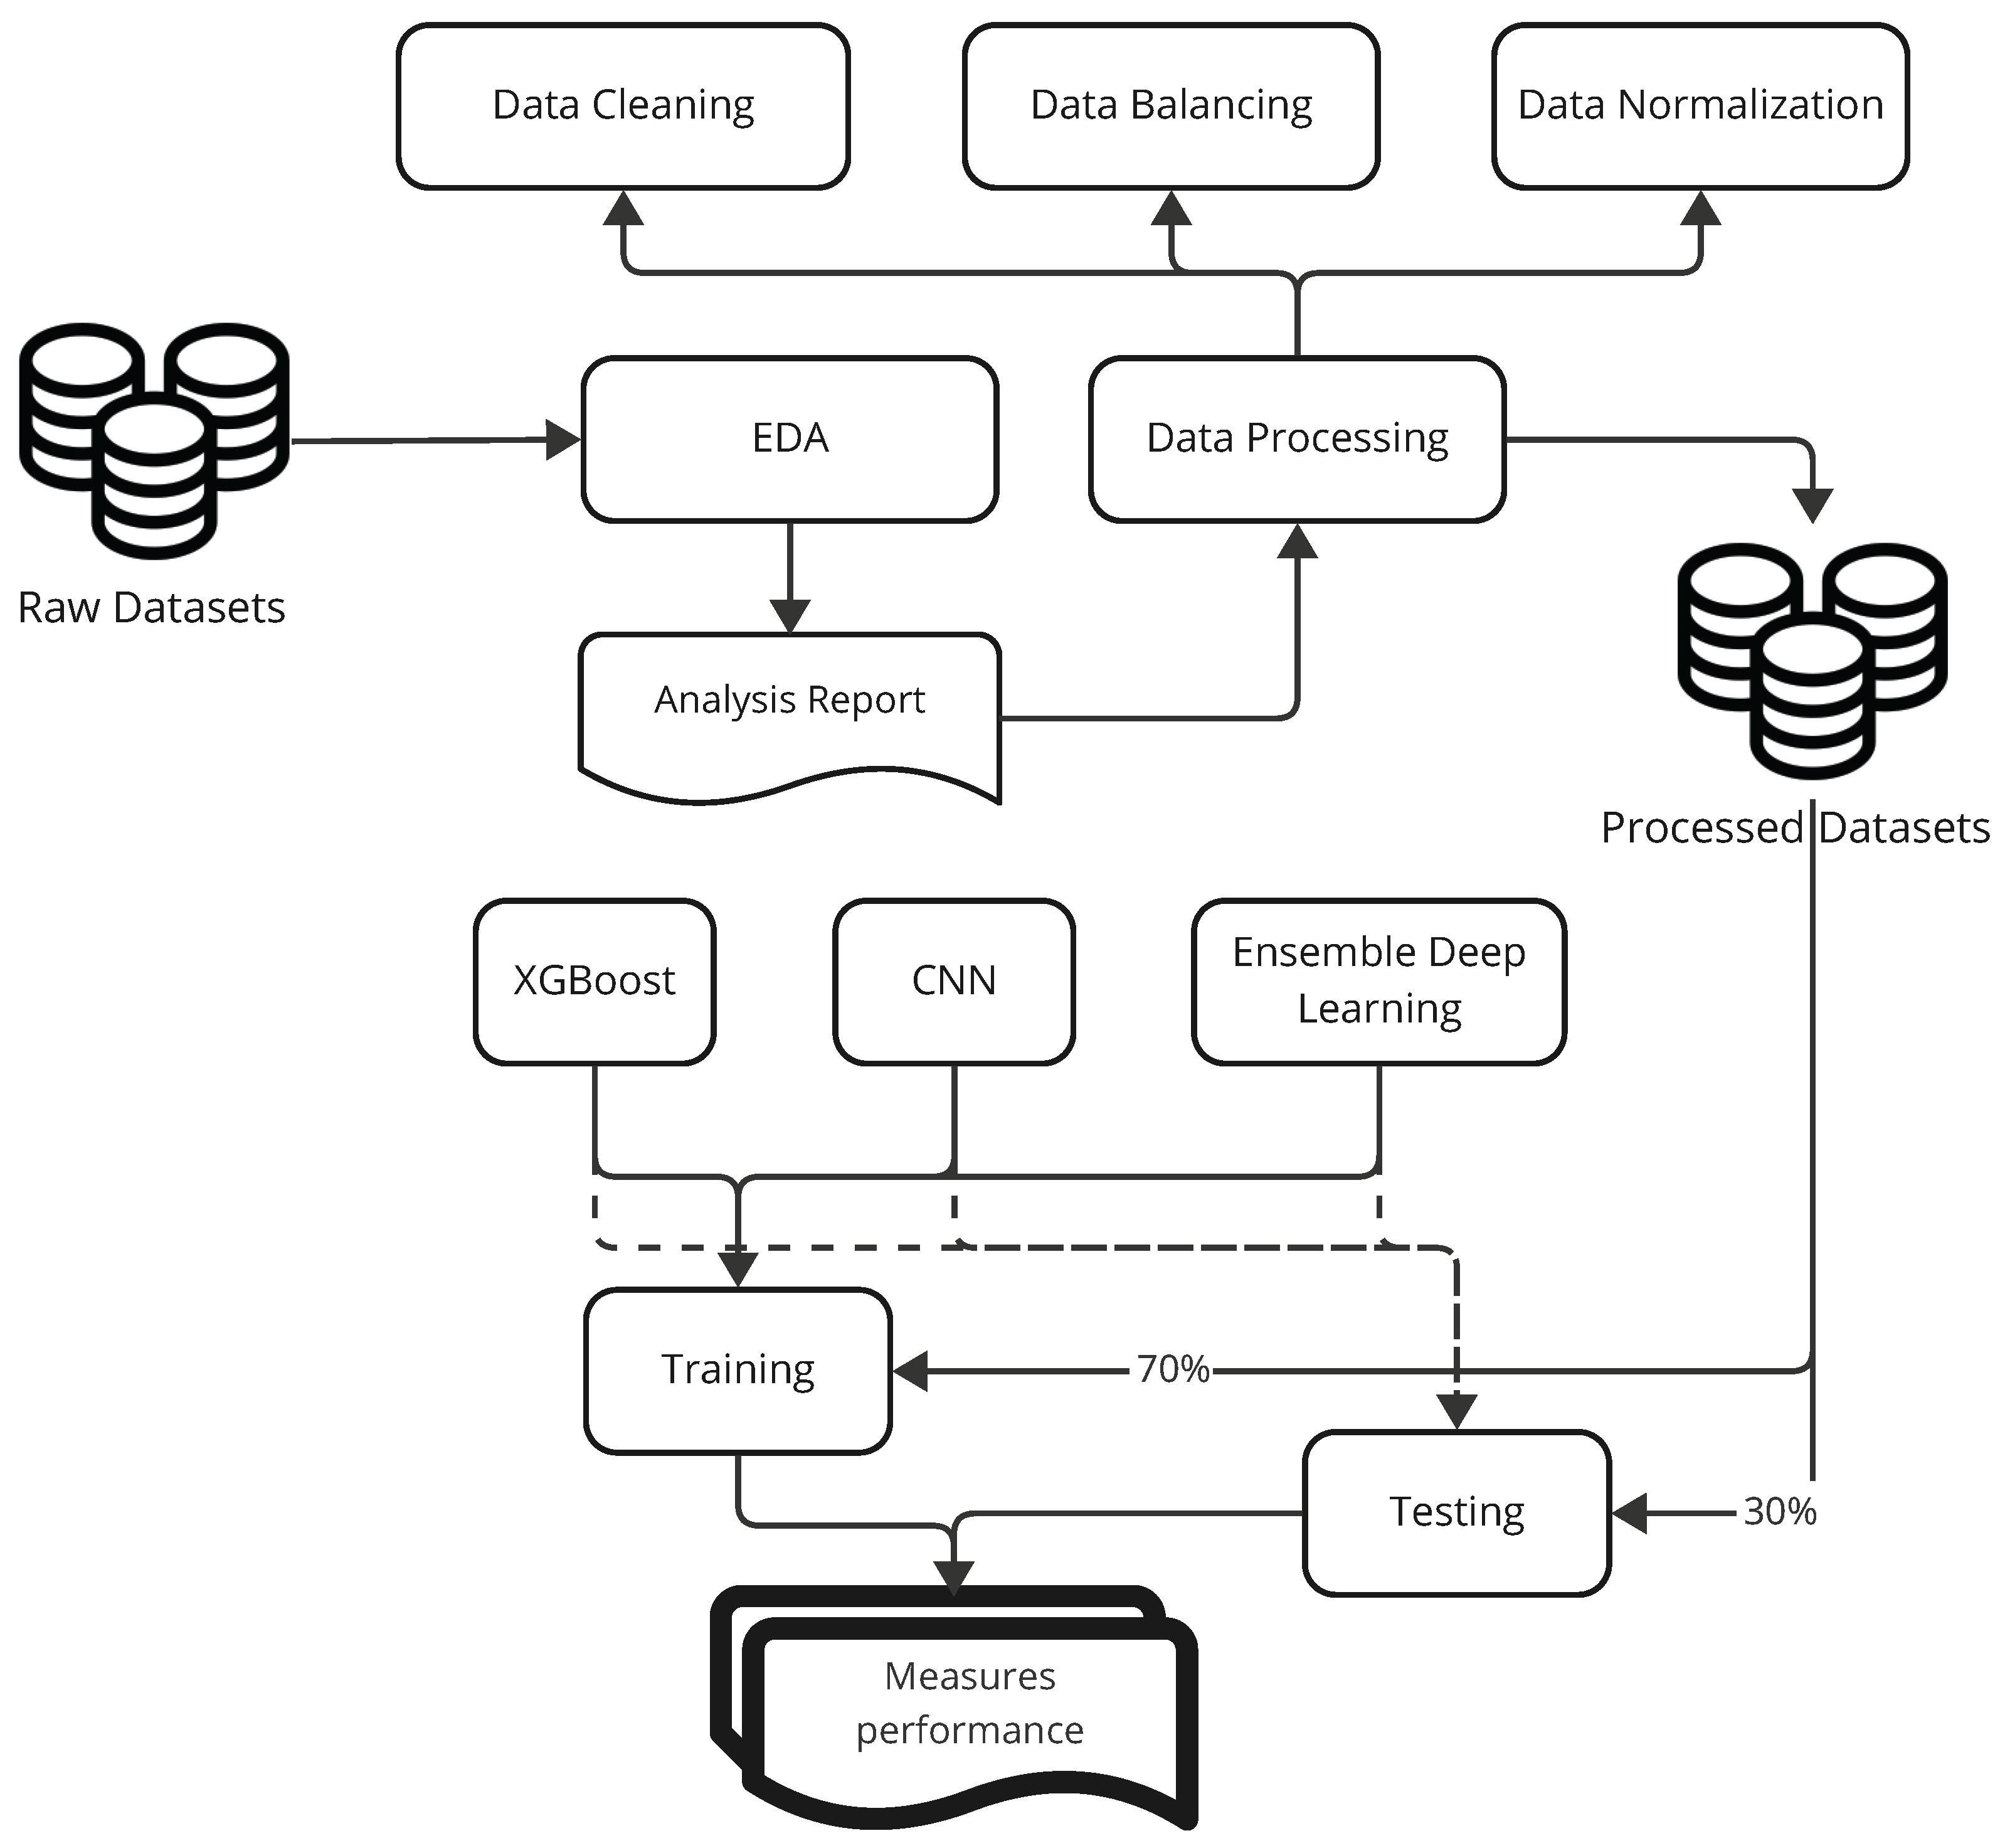
This section discusses the data used and the application of machine learning and deep learning models to perform the classification task (see Figure 1). The applied methodologies included excellent machine learning techniques and advanced deep learning architectures to provide a comprehensive evaluation and comparison of the models used. The models used in this study include XGBoost, a deep learning model with convolutional layers, and an ensemble model that combines deep learning approaches.
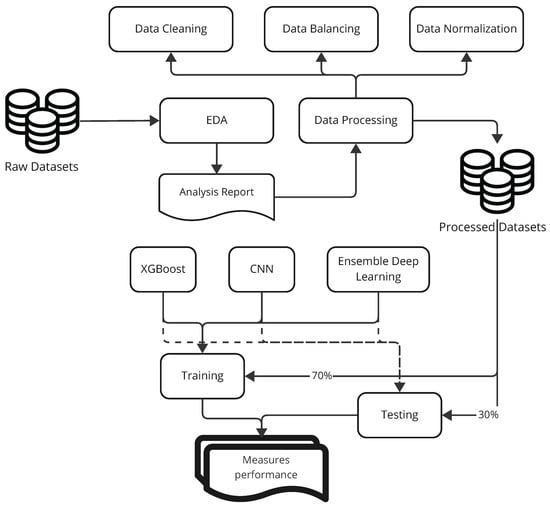
Figure 1.
Overview of the methodology.
Figure 1 provides a broader perspective of the methodology followed in the churn prediction study. Figure 1 depicts the workflow, with three main stages, namely, data preprocessing, model training, and performance evaluation. In data preprocessing, various datasets go through cleaning, imputation for missing values, feature engineering, and normalization to suit the models, as explained further in Section 3.2. Model training processes the models from three fronts: XGBoost, a machine learning model famous for its tabular-data processing efficiency; CNN, a neural network built for catching local patterns from sequential data; and Ensemble Deep Learning model in combination with Deep Feature Extractor (DFE-CNN) and Lightweight Feature Extractor (LFE-CNN) for better predictive and generalizability confidence. The performance evaluation uses metrics such as accuracy, recall, precision, F1-score, ROC AUC, and Kappa score to evaluate the models across the three datasets (Insurance, Internet Service Provider, and Telecom). This structured framework guarantees a thorough comparison of conventional methods versus the state of the art methods in line with the research objectives of churn prediction performance evaluation in diverse industrial contexts.
3.1. Datasets
The present work utilizes three distinct datasets for customer churn prediction from the insurance, internet service, and telecom industries. These datasets have various features related to customer behavior and usage patterns, which are conducive to modeling customer churn prediction effectively. In their way, these sector-specific insights from the individual datasets delineate the churn factors pertinent to a particular sector.
The present work utilizes three distinct datasets for customer churn prediction from the insurance, internet service, and telecom industries. The primary goal is to test the consistency of model performance (XGBoost, CNN, and Ensemble Deep Learning) across these sectors, which exhibit different churn behaviors (e.g., better offers in Insurance vs. coverage in Telecom), rather than optimizing data quality or tailoring models to specific domain characteristics, leaving room for future sector-specific enhancements.
3.1.1. Selection Criteria for Datasets
In choosing the Insurance Churn Dataset, Internet Service Provider Customer Churn Dataset, and Telecom Churn Dataset, certain selected criteria were needed to ensure a robust and comprehensive testing of the proposed churn prediction models. First, datasets representing multiple industries, such as insurance, internet services, and telecommunication, were selected to allow the performance of models to be tested against the different patterns exhibited by human behavior and dynamics of churn. Such diversity ensures that results are generalized to other sectors. Second, the chosen datasets are available publicly from Kaggle, a much-recognized platform for data science challenges, making it easy for anyone to get them and reproduce the results. These datasets are very common in churn prediction research, setting them as benchmarks. Third, it presents churning-related attributes such as customer demographics, service usage pattern, and billing information that are important factors for churn prediction. Fourth, the datasets are very different sizes-wise, with 33,908 records for Insurance, 72,274 for Internet Service, and 3333 for Telecom, which will give us an idea of how scalability and performances of the models are affected by other data scales. With such criteria, it is assured that the chosen datasets are good enough for the testing of the proposed models, giving important insights into real-world churn prediction scenarios.
3.1.2. Insurance Churn Prediction Dataset
The Insurance Churn Prediction dataset [30] comprises 33,908 records and 17 features. The dataset consists of customer-related attributes, such as demographic information, payment methods, and policy details, to identify patterns that could lead to customer churn. The columns include the feature_0 through feature_15, respectively representing different customer attributes, and the labels column, which is the target variable that indicates whether a customer has churned (1) or stayed (0). The dataset was preprocessed to treat missing values and normalize numerical features before it was used for predictive modeling. Because of its relatively large size made available for modeling churn prediction in insurance, the dataset provides insight into any churn issue.
3.1.3. Internet Service Provider Customer Churn Dataset
The dataset Internet Service Provider Customer Churn, found on [31], contains 72,274 entries of which 11 are features. This dataset gives insight into what customers do regarding the consumption of internet services. Apart from knowing about subscription age, average billing amount, download and upload speeds, and service failures, key features have to do with defining when a customer churns, the use of the term churn as a target variable in this case, indicating whether the customer cancels, and are hence more appropriate for analyzing churn in the internet service sector based on effecting a prediction of churn. Data were normalized into equal levels, and consistent usage of numerical variables improves the model’s performance in machine learning.
3.1.4. Telecom Churn Dataset
The Telecom Churn Dataset has 3333 consumer records under 20 attributes [32]. The dataset revolves solely on utilizing various telecom services and detailing customer service, call duration, and plan particulars. The columns include customer data such as account length, the total number of minutes spent in call during day, evening, and night, and the total number of calls to customer service. The dependent variable, churn, specified whether the customer has ever canceled the services. This dataset gives an account of the detailed insights of how the usage patterns and customer service experiences affect churns in the telecom industry. It has undergone preprocessing for missing values and normalization in features towards making it ready for churn prediction modeling. The size of this dataset is not compared with the other two datasets, but it is still very much significant in creating a churn prediction model in the telecom industry.
3.2. Exploratory Data Analysis
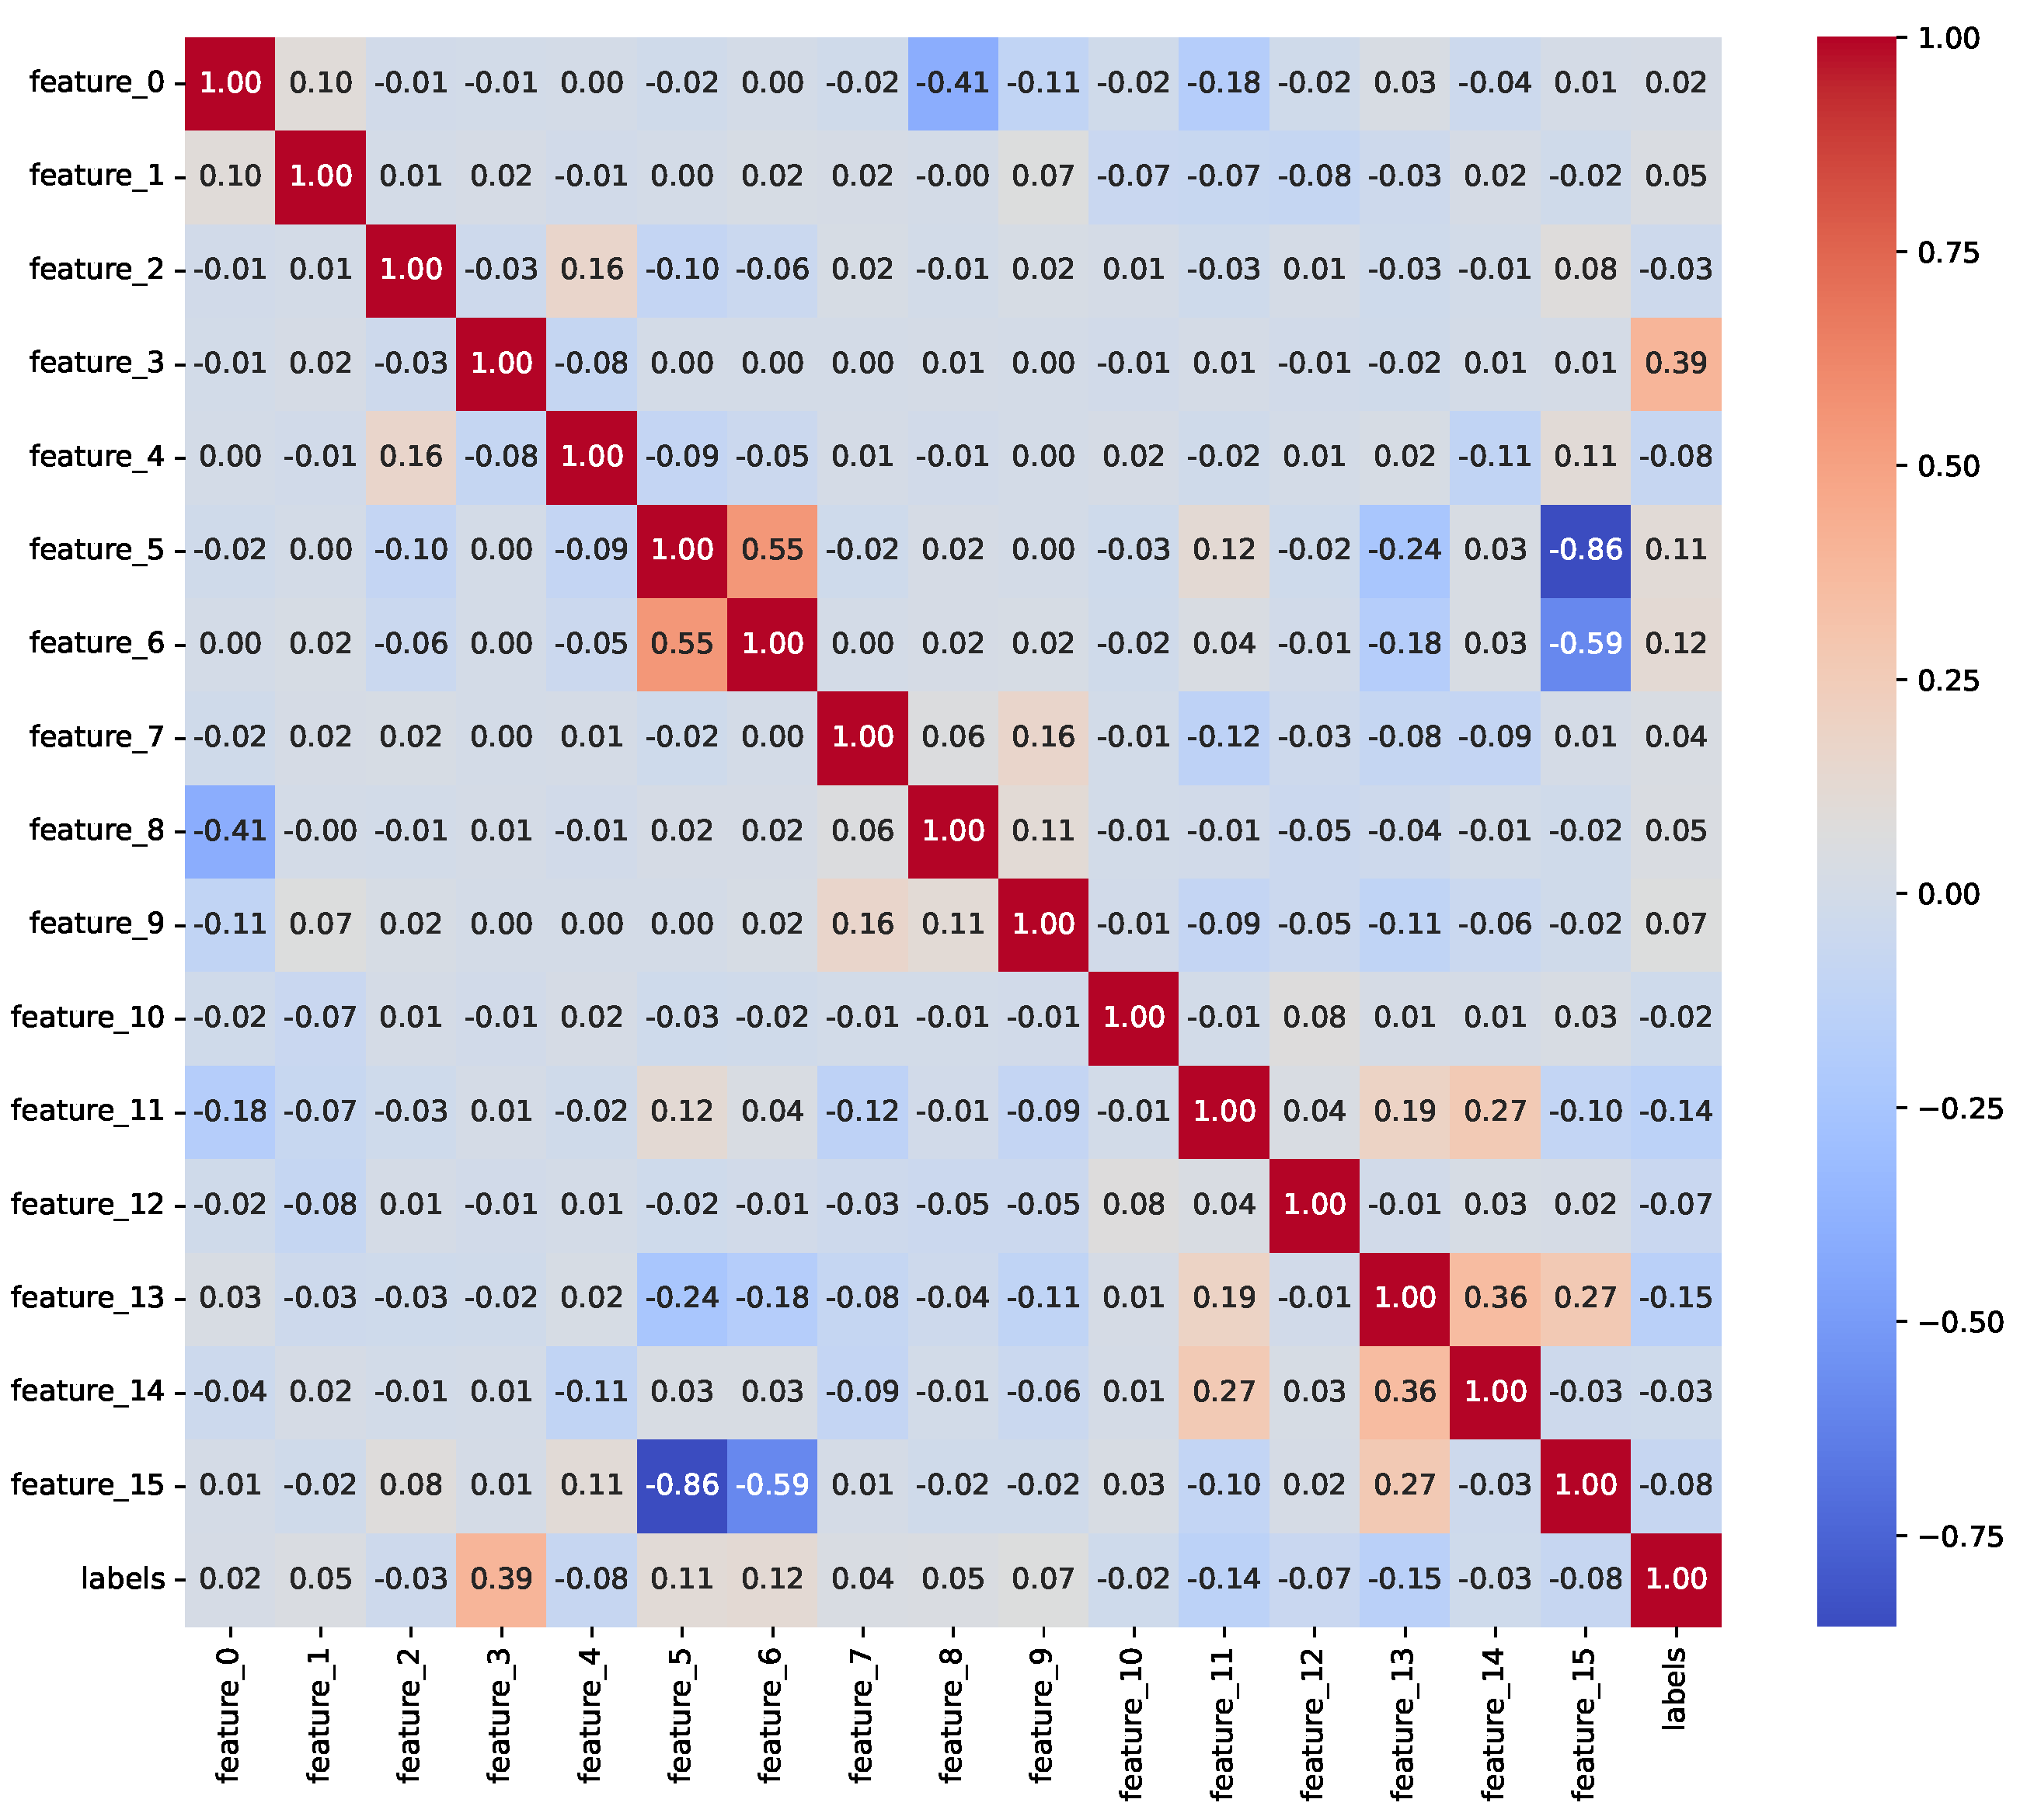
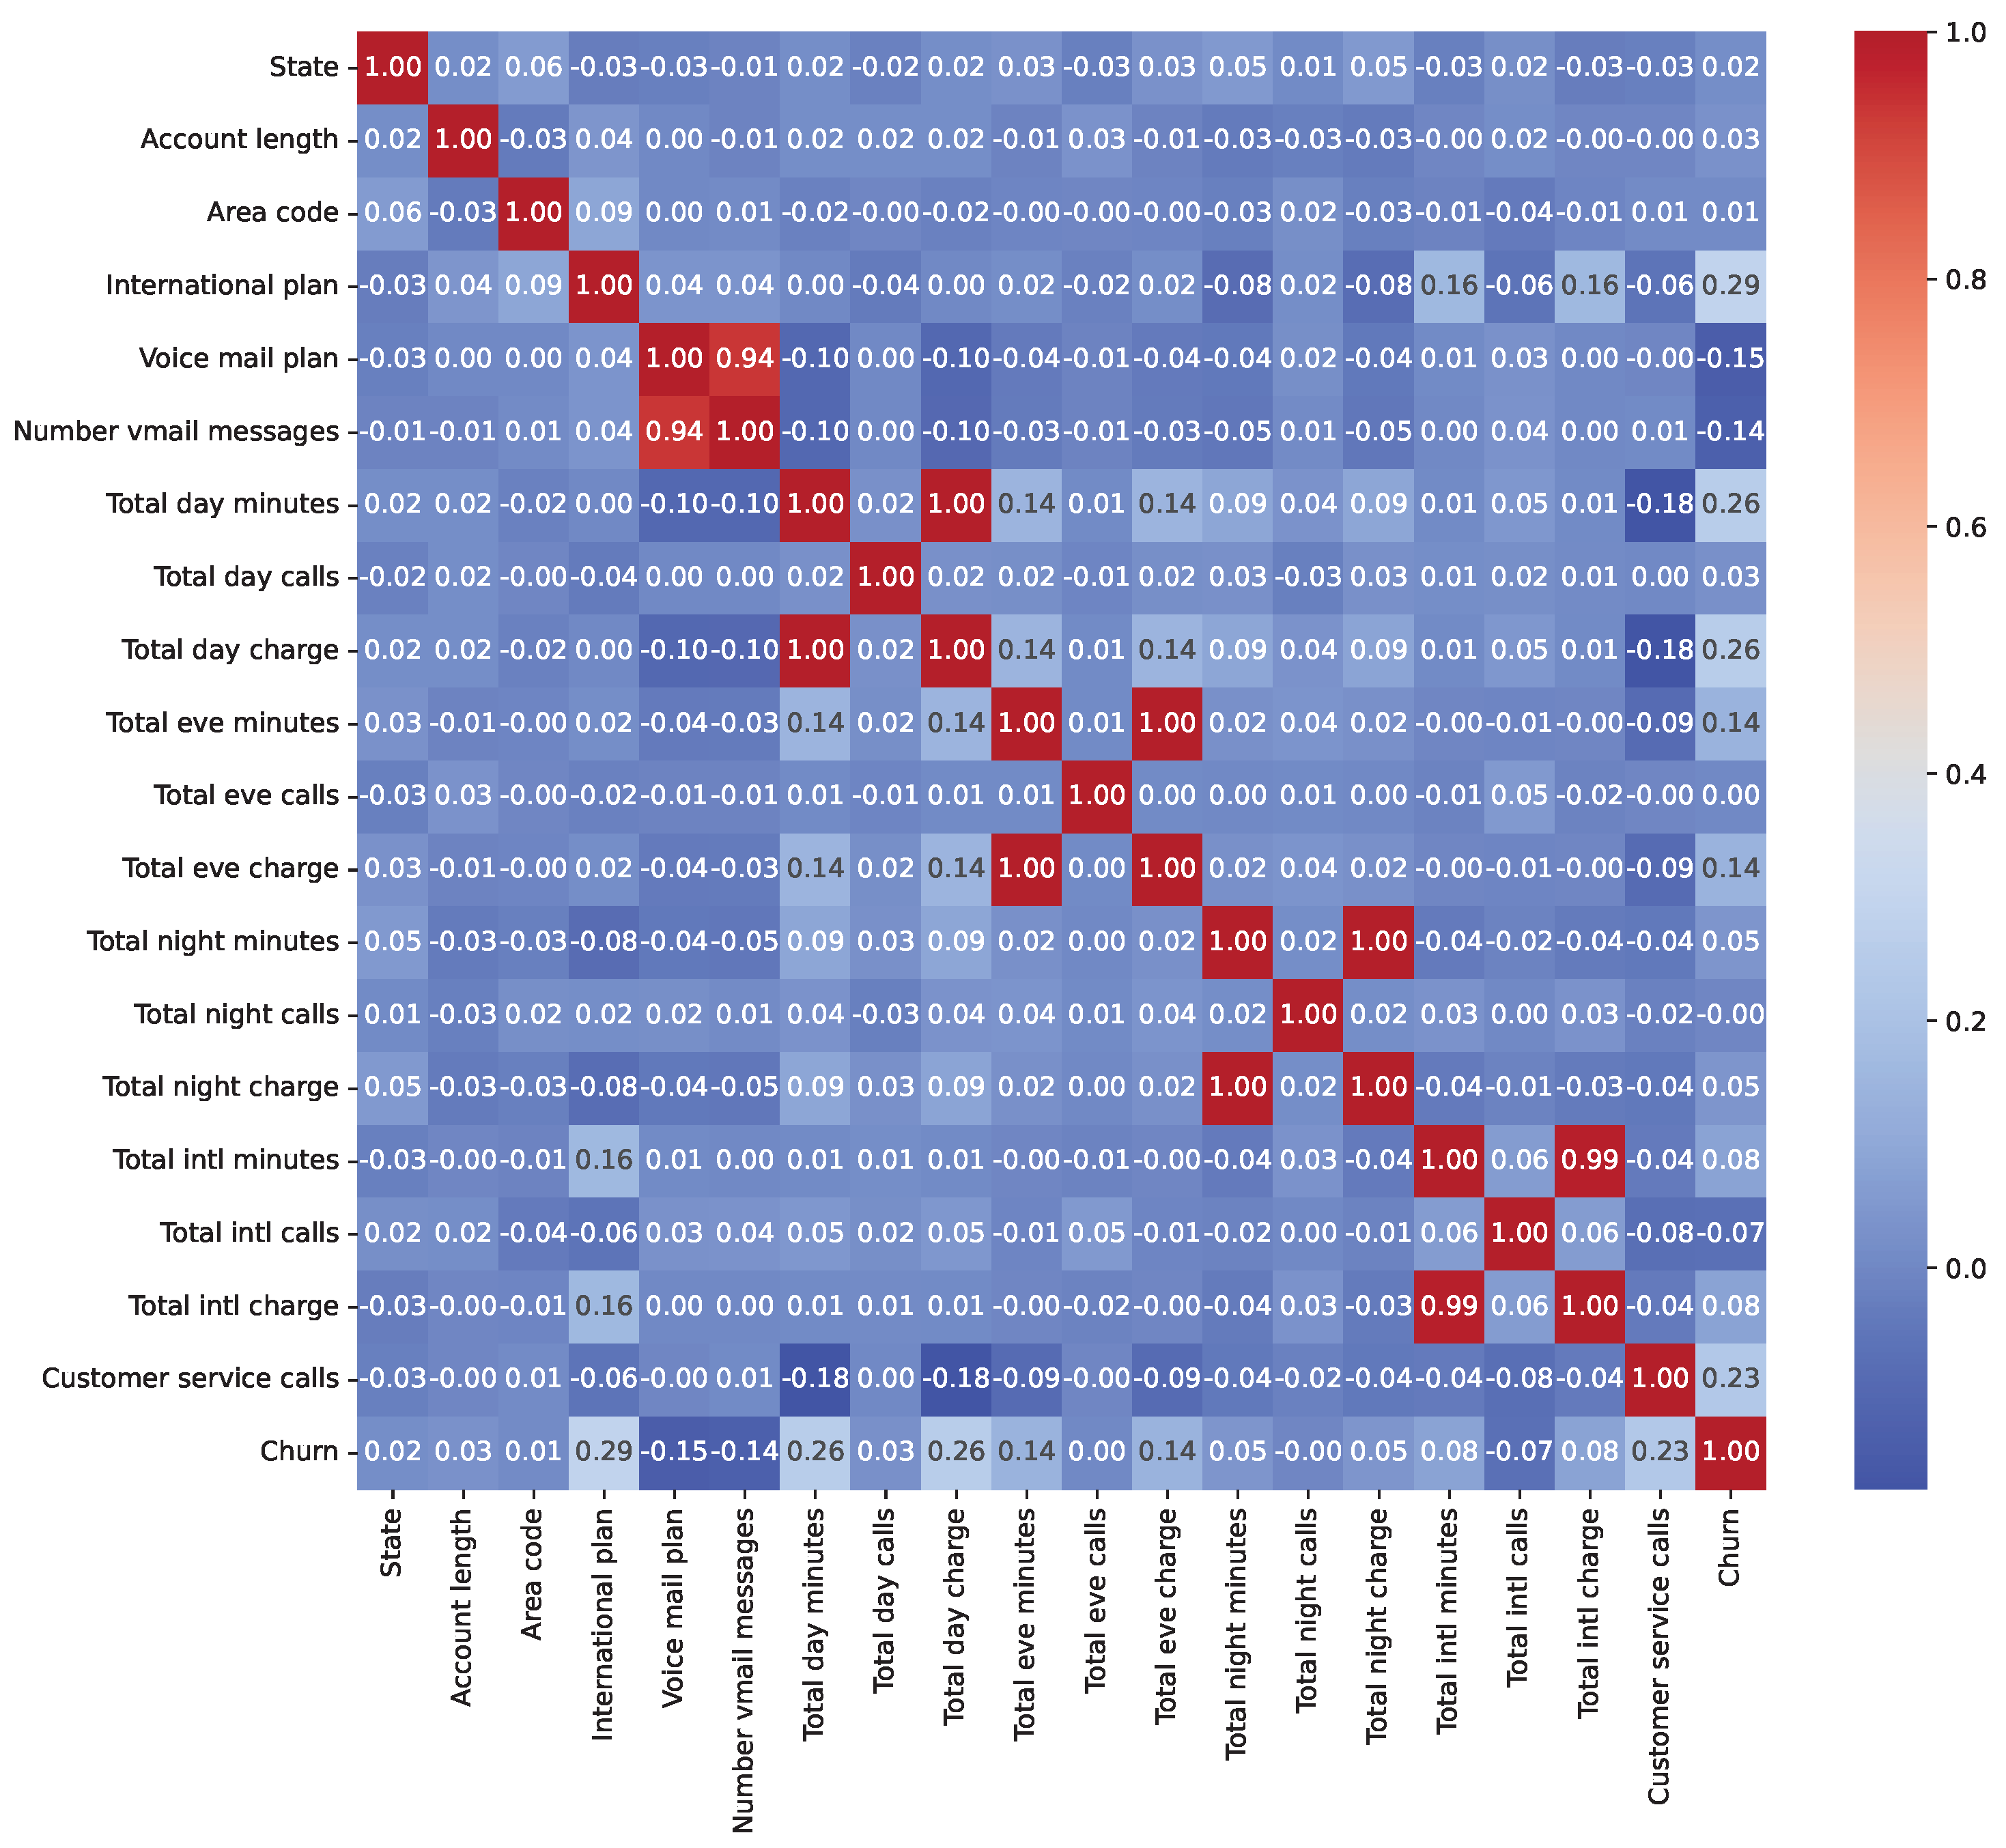
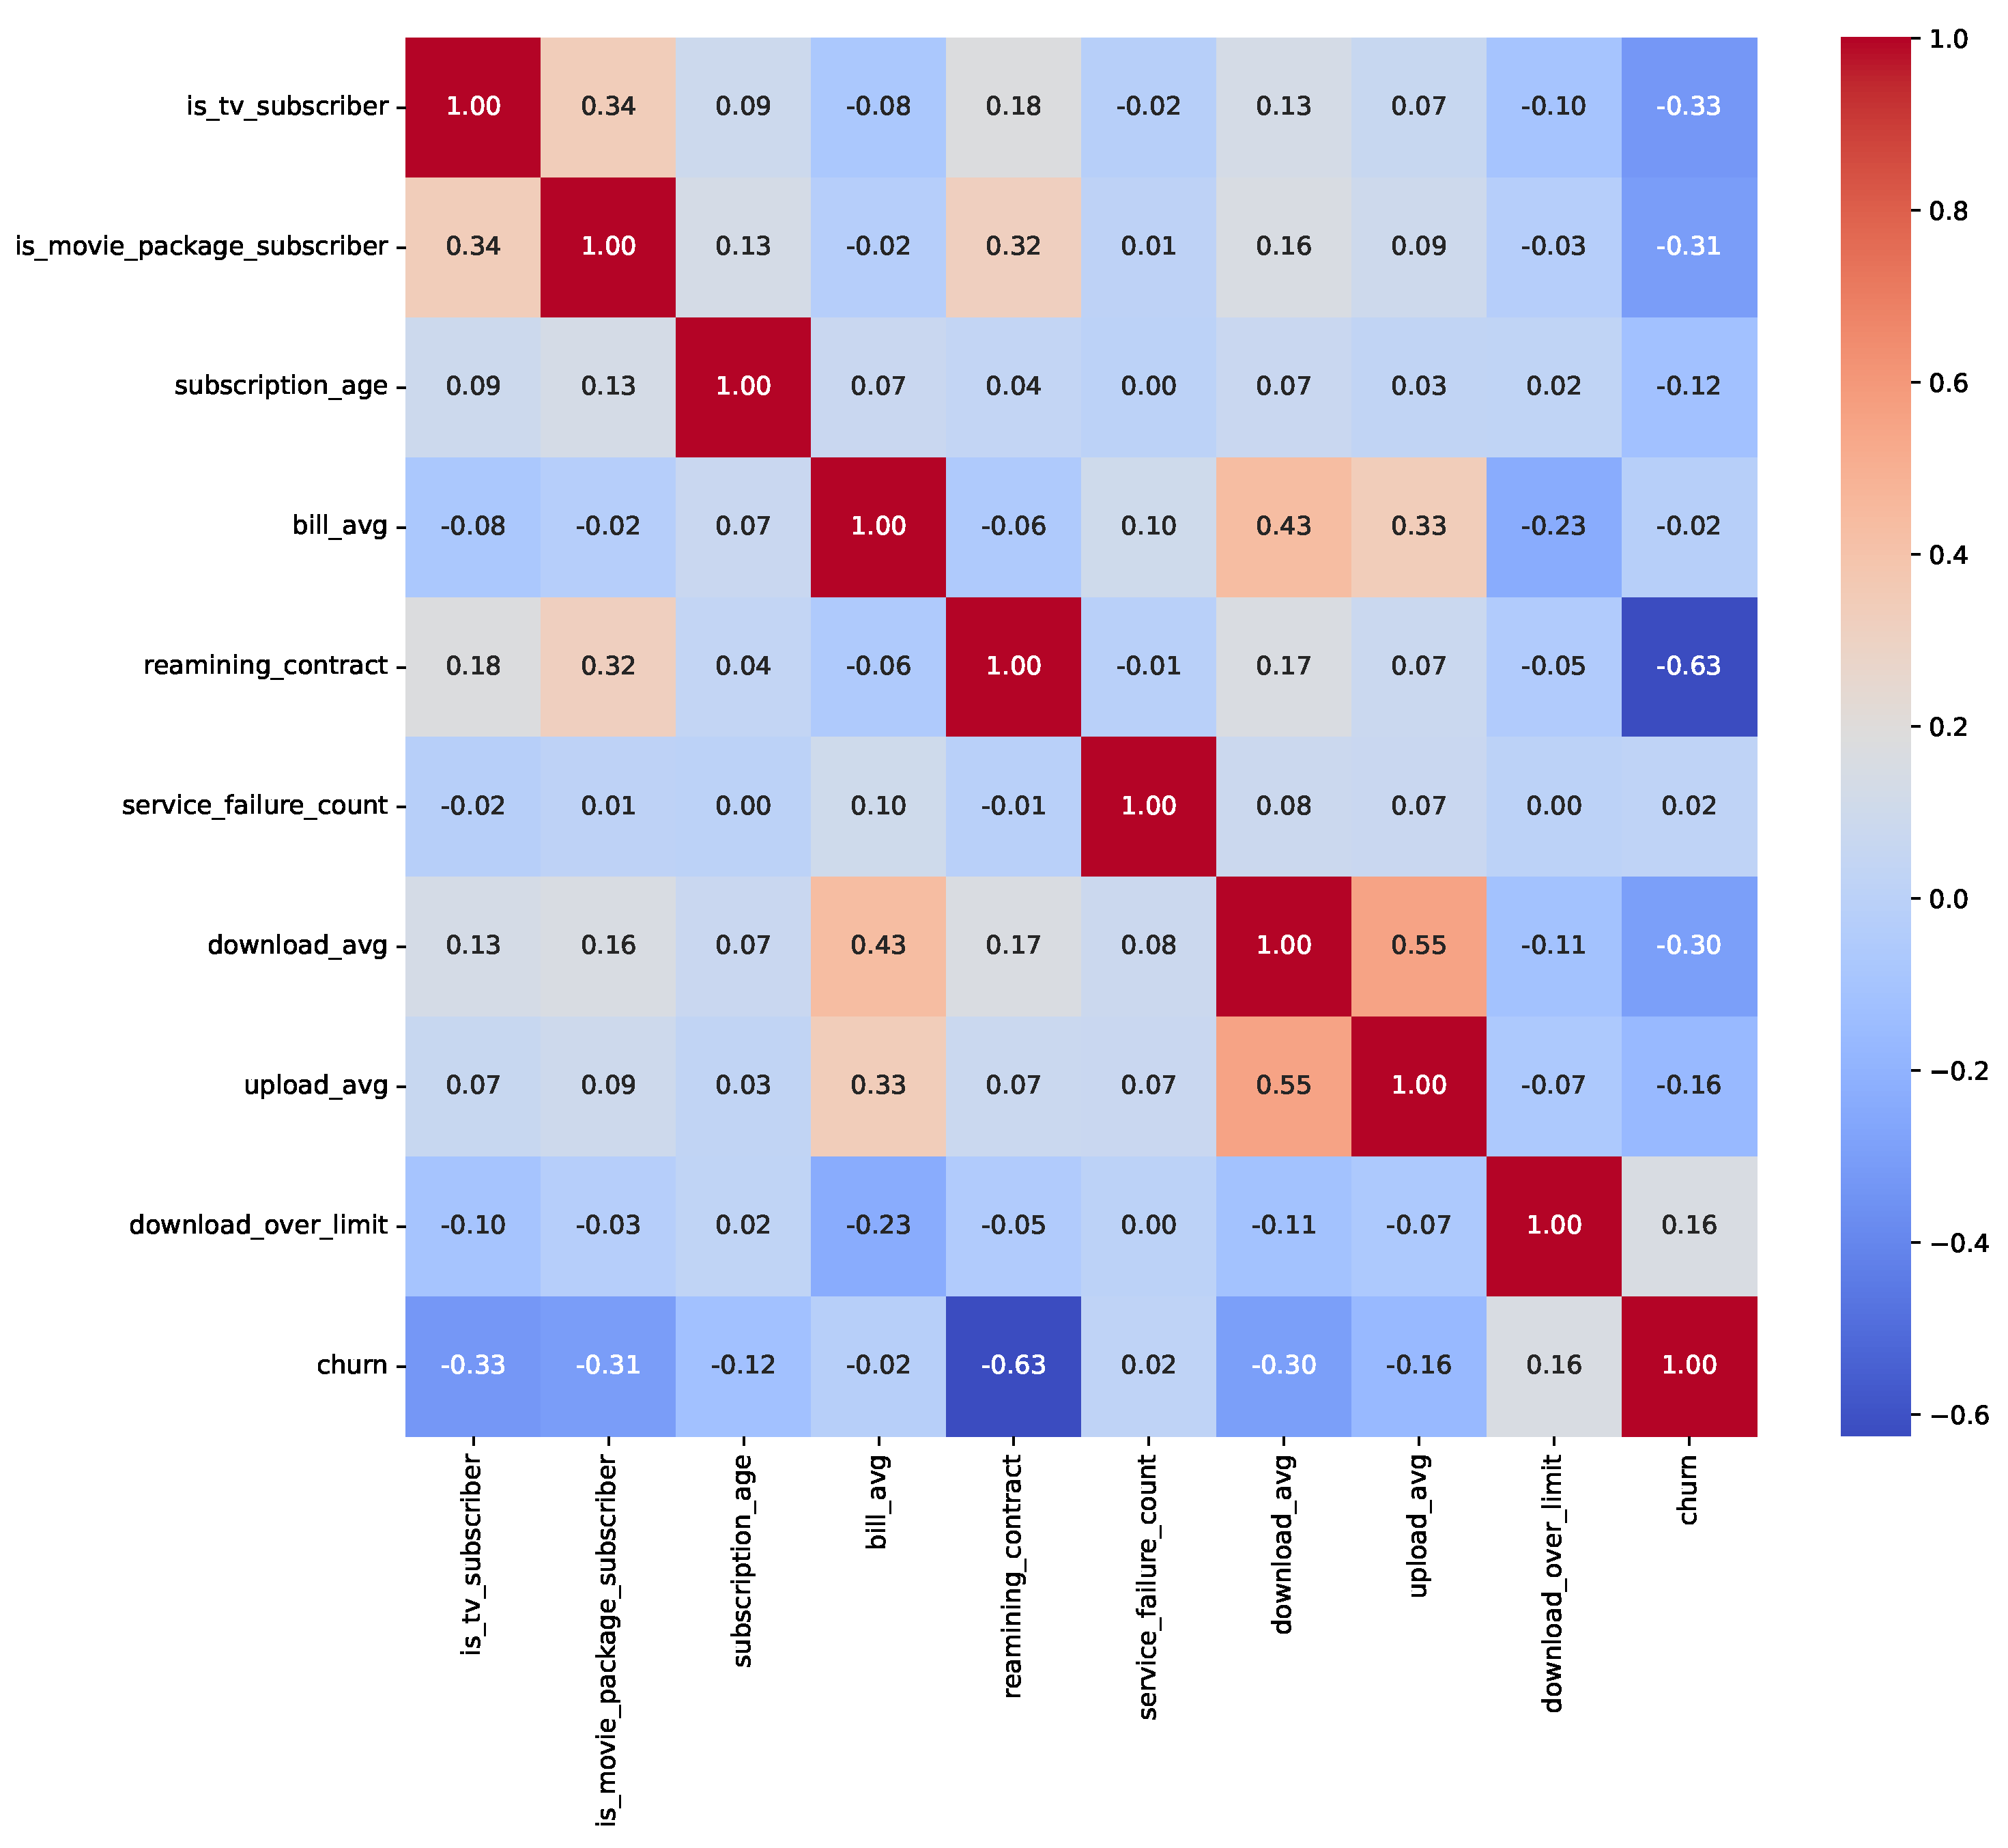
We conducted an exploratory data analysis (EDA) to investigate feature distributions, class imbalances, and relationships with the target variable. Table 1 presents the class distribution percentages before resampling, highlighting significant imbalances in Insurance (11.70% churn) and Telecom (14.49% churn), while ISP is relatively balanced (40.36% churn). Post-resampling, all datasets achieved a 50% churn rate. The exploratory data analysis revealed key insights into feature distributions and relationships with churn. For the Insurance dataset (33,908 records pre-resampling), numeric features (e.g., feature_0 to feature_15) exhibited skewness, with feature_3 showing a strong influence on churn prediction. In the ISP dataset (3333 records preresampling), subscription_age and bill_avg displayed positive skewness, with bill_avg values significantly higher among churners (mean bill_avg for churners: $120.50 vs. $85.30 for nonchurners). The Telecom dataset (72,274 records preresampling) showed skewness in total_day_minutes and total_day_charges, with churners averaging 230.4 min daily compared to 180.2 for nonchurners. Outliers were identified in ISP bill_avg (e.g., values exceeding $200) and Telecom customer_service_calls (e.g., five calls), indicating higher churn likelihood. Categorical feature analysis showed that in ISP, 65% of monthly contract holders churned compared to 20% of yearly contract holders, while in Telecom, 45% of international_plan subscribers churned vs. 10% without the plan. In Insurance, payment methods (e.g., electronic check) were associated with a 30% higher churn rate than bank transfers. Figure 2, Figure 3 and Figure 4 illustrate correlation matrices, highlighting key predictive features, such as feature_3 (Insurance), remaining_contract (ISP, 0.62), and international_plan (Telecom, 0.283). These insights guided feature selection and model development.

Table 1.
Class distribution percentages for each churn prediction dataset (before resampling).
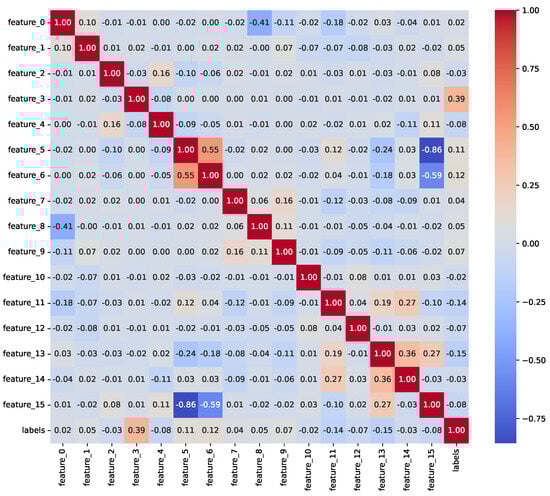
Figure 2.
Correlation matrix for numeric features in the Insurance Churn Dataset.
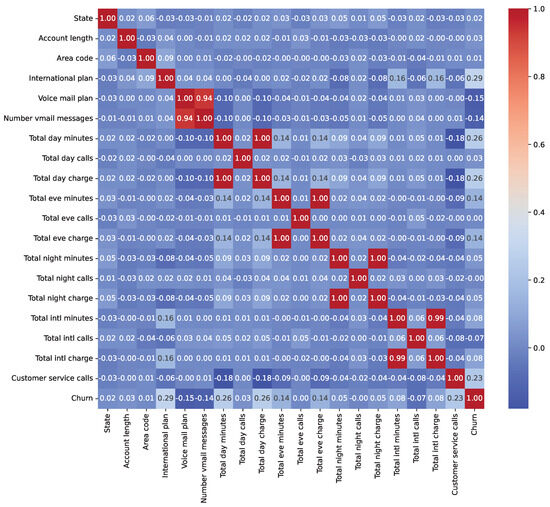
Figure 3.
Correlation matrix for numeric features in the ISP Customer Churn Dataset.
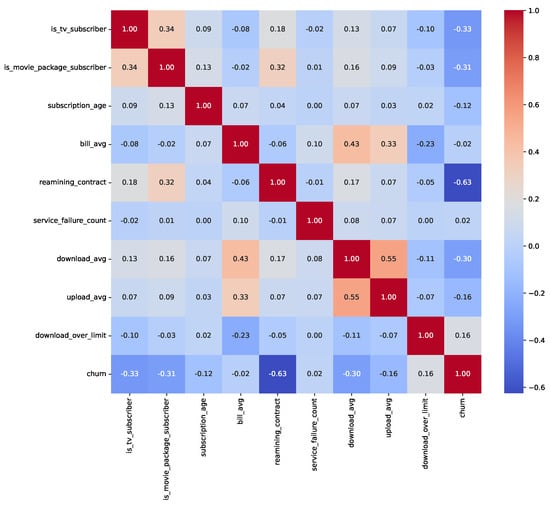
Figure 4.
Correlation matrix for numeric features in the Telecom Churn Dataset.
3.3. Preprocessing and Data Handling
The datasets underwent extensive preprocessing to prepare them for machine learning models. Missing values were imputed using mean values for numerical columns and mode values for categorical columns. New features, such as customer tenure and usage behavior, were engineered to enhance predictive power. Numerical features were normalized to ensure uniform scaling, critical for models like CNN. To address class imbalances, RandomOverSampler was applied, increasing dataset sizes from 33,908 to 59,882 (Insurance), 72,274 to 50,375 (ISP), and 3333 to 5700 (Telecom, using a subset post-resampling). The datasets were split into training, validation, and test sets, with the Telecom dataset using an 80% (churn-80) split for training/crossvalidation and 20% (churn-20) for testing.
To mitigate data leakage, we ensured no target-derived or future information was included in the features. In the Insurance dataset, RandomOverSampler was applied before train-test splitting, potentially introducing minor leakage; future work will apply resampling within a pipeline. In the ISP dataset, the ‘id’ column was removed as a nonpredictive identifier. In the Telecom dataset, traintest splitting preceded preprocessing steps like MinMaxScaler, and LabelEncoder was applied to combined data, acceptable for encoding. Correlation analyses (Figure 2, Figure 3 and Figure 4) showed no features with near-perfect correlations (e.g., Pearson > 0.9), confirming low leakage risk. Key correlations include feature_3 (Insurance), remaining_contract (ISP, −0.62), and international_plan (Telecom, 0.283).
3.4. Limitations and Considerations
While the datasets provide valuable insights into customer churn across different industries, though there are quite a few challenges and limitations when it comes to them. For example, one of the fundamental challenges lies in the data quality, wherein missing values and inconsistencies had to be solved in the preprocessing level. The second problem is the class imbalance by its nature common to all three datasets which clearly shows that the number of customer churners is usually less than that of the retained ones. This imbalance has led to the necessity of employing resampling techniques, wherein the model can learn to predict churn accuracy. Unfortunately, the datasets leave out some other factors that include but are not limited to market trends, economic terms, and memorable promotional campaigns because they also add a dimension to customer churn. Limitations notwithstanding, the datasets have some relevance to churn prediction and also prove to be good sources of information for the development of quality machine learning models.
3.5. XGBoost Machine Learning Model
As a machine learning model based on the gradient boosting procedure, XGBoost (Extreme Gradient Boosting) [33,34] has become renowned for its efficiency and accuracy in the classification task. For XGBoost implementation, the XGBClassifier module of the xgboost library was used. The model is a gradient boosting framework in which several weak models built on the same dataset are combined to create a strong predictor, minimizing prediction error in the process. The learning curve approach to training was applied to show the relationship between the training size and the performance of the model. Positive weights were assigned a scale of one so that both classes were treated equally. After training, the model was run on a test data set, and the accuracy scores of both sets were then examined.
3.6. The Proposed CNN Model
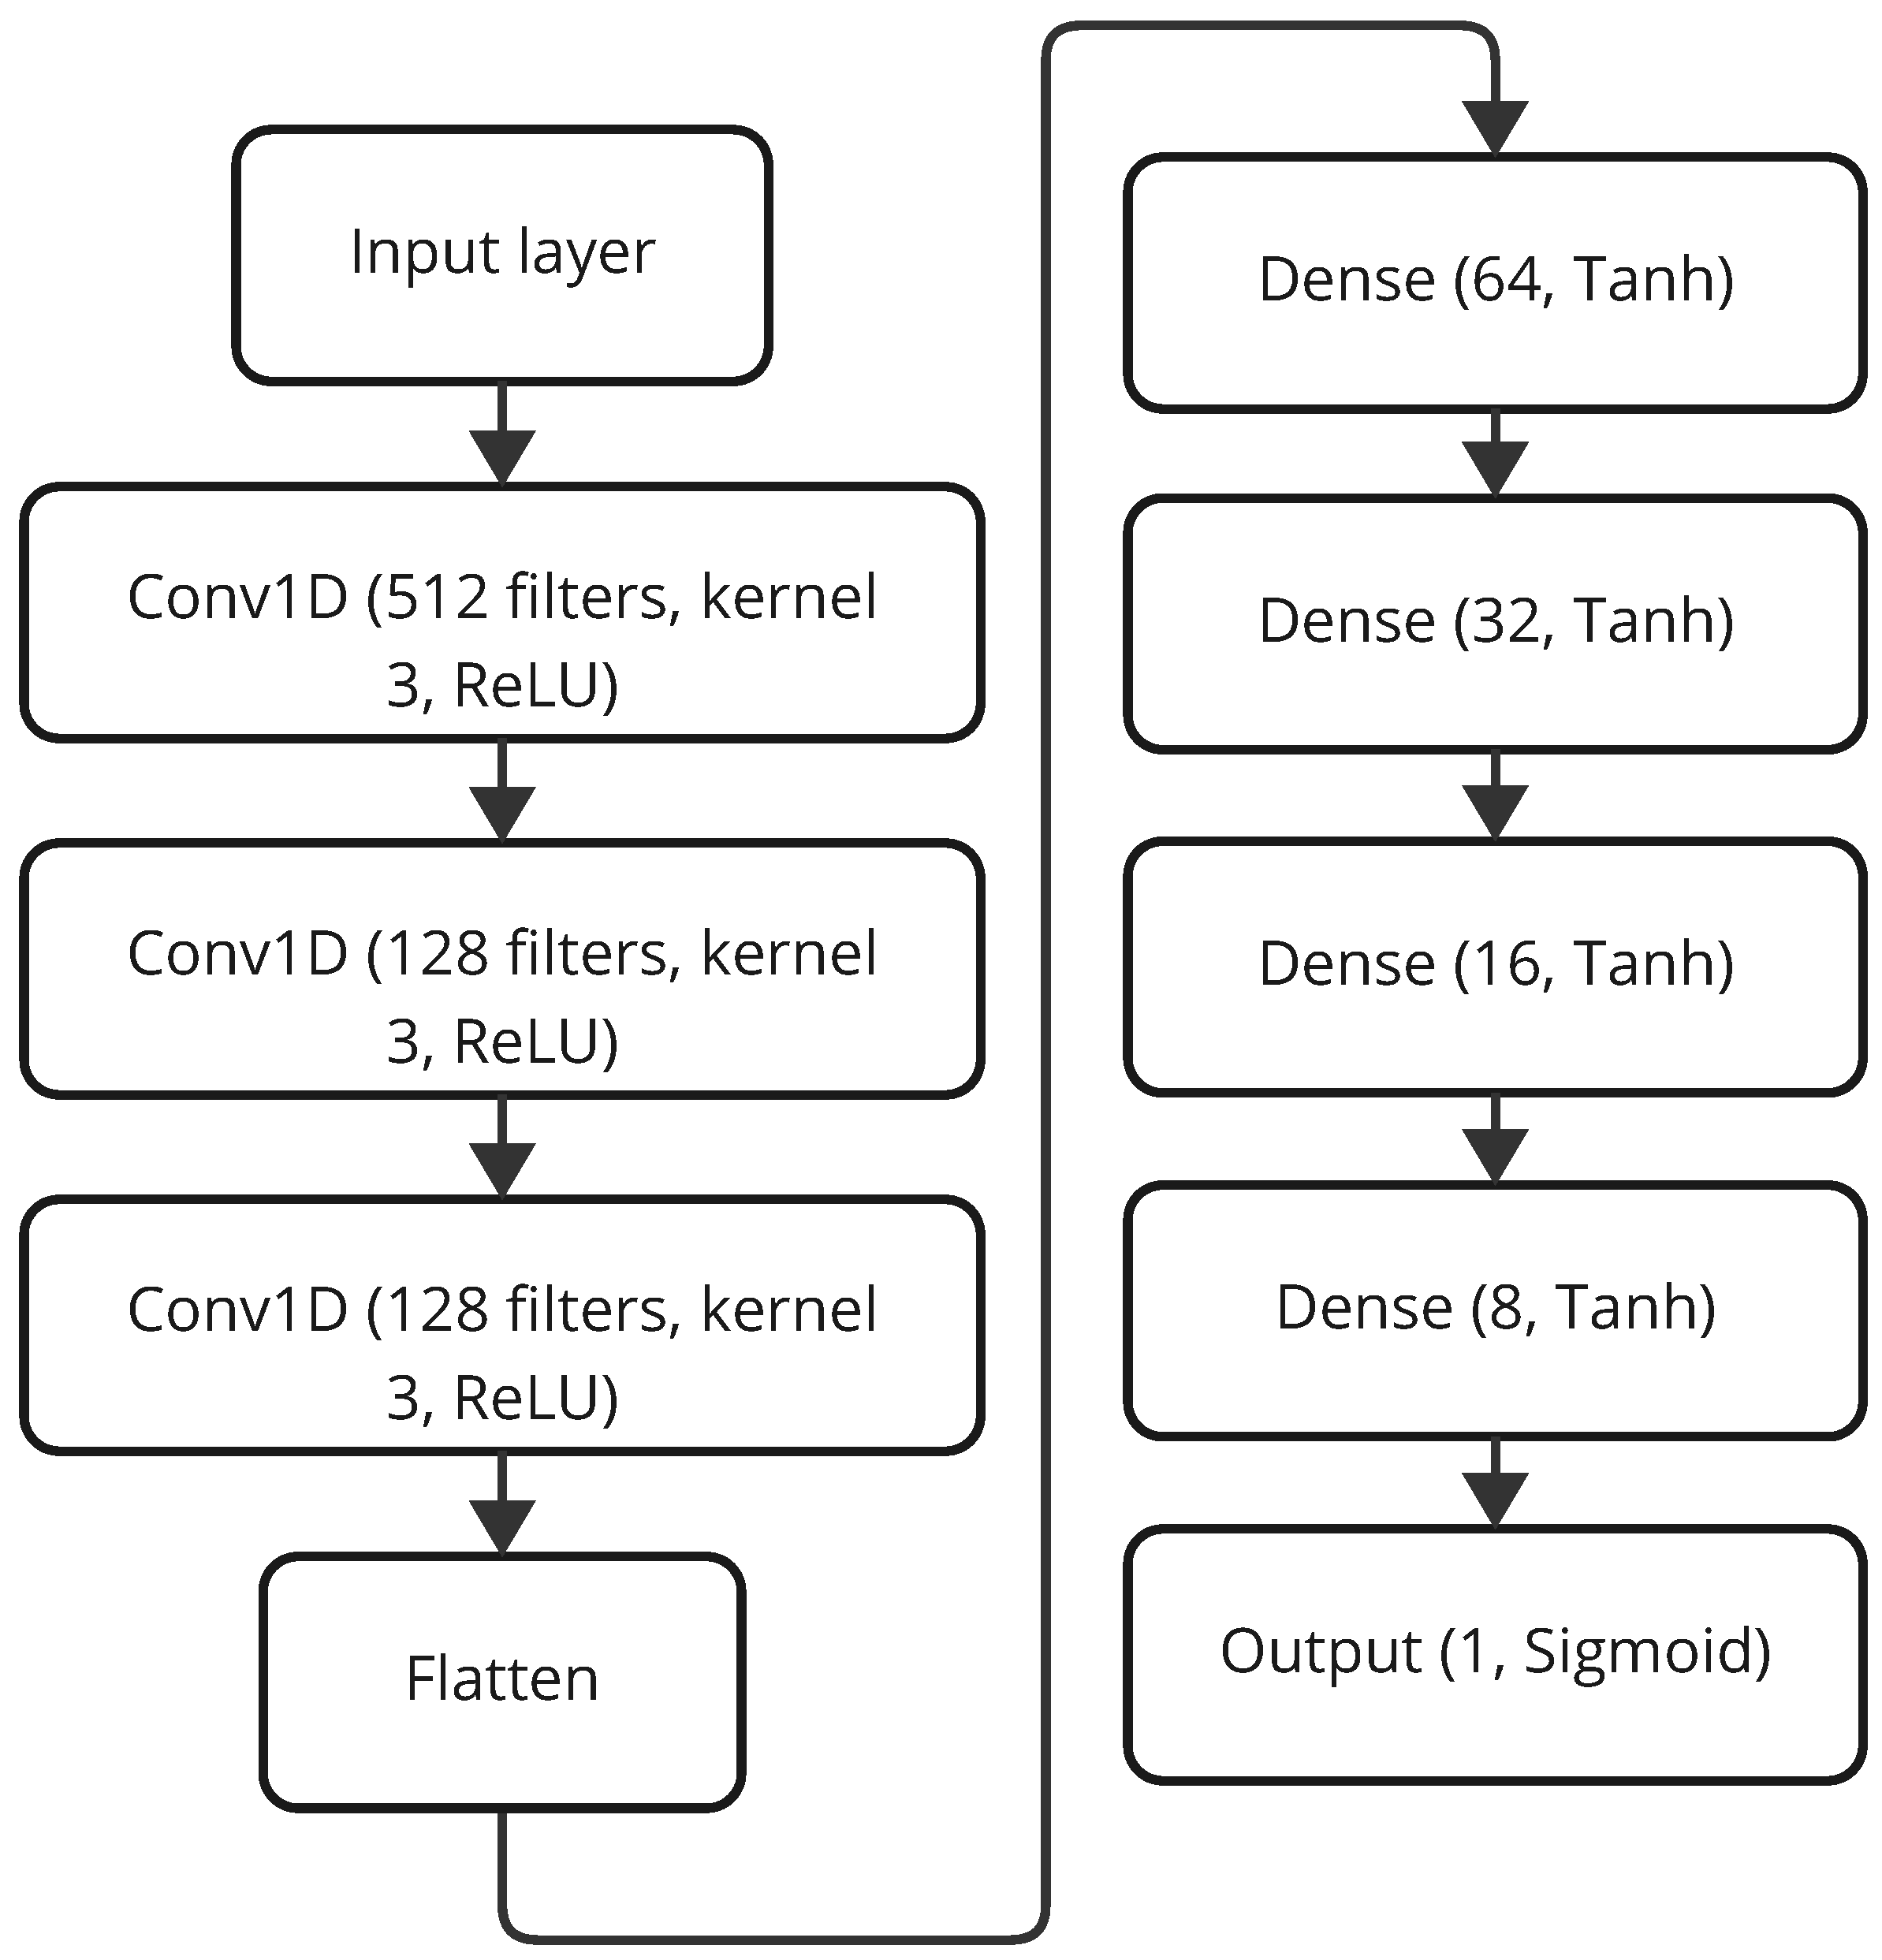
The proposed platform for customer churn classification has been developed using a Convolutional Neural Network with 1D convolution layers to accommodate sequential customer behavior data. The architectural schema, given in Figure 5, has an input layer, followed by two Conv1D layers with 128 filters, kernel size 3, and ReLU activation, to capture local patterns from inputs effectively. Now follow the Flatten layers, which basically transform the feature maps into one-dimensional vectors for feeding into dense layers [35]. Then these are followed by four Dense layers, which have: 64 units, 32 units, and 16 units, respectively, all using Tanh activation, and then output an activation of Sigmoid with a single unit for binary classification of churn or no churn. Adam with a learning rate of 0.001 and binary cross-entropy as its loss function has been used here for compilation of the model since it is generally suited for binary classification. Training was undertaken for 50 epochs, batch size 32, along with early stopping on validation loss to curb overfitting. The model is designed to understand local and hierarchical structures in customer data, prioritizing predictive power over training time, as found in the evaluation on test sets for the three datasets.
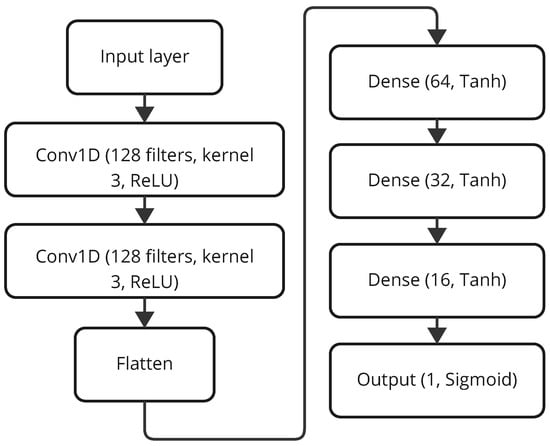
Figure 5.
Architecture of the LFE-CNN model.
3.7. Ensemble Deep Learning
We proposed performing tasks through the entire deep learning technique involves outputting two complementary Convolutional Neural Networks, namely, Deep Feature Extractor (DFE-CNN) and Lightweight Feature Extractor (LFE-CNN), as an ensemble. Therefore, this approach concerns the improvement of each model in terms of their respective and combinatorial robustness and capacity in generalizing [36]. Both models are trained independently for 50 epochs using the Adam optimizer with a learning rate of 0.001 and binary cross-entropy loss function, incorporating early stopping based on validation loss to prevent overfitting, with a batch size of 32.
The DFE-CNN, represented in Figure 6, is a deeper architecture created to seize intricate feature hierarchies from data. This architecture comprises three Conv1D layers, each with 128 filters except the first layer, which contains 512 filters, a kernel size of 3, and ReLU activation, designed to extract complex patterns from customer data. These are followed by a Flatten layer to transform the feature maps into a one-dimensional vector, and three fully connected Dense layers with 64, 32, 16 and 8 units, respectively, using Tanh activation, culminating in a final Dense layer with a single unit and sigmoid activation for binary classification. Its depth and complexity enable the learning of highly structured data representations, enhancing classification accuracy across diverse datasets.
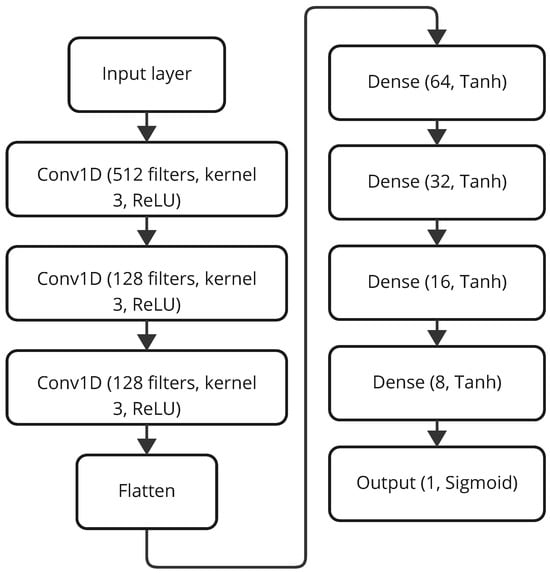
Figure 6.
Architecture of the DFE-CNN model.
On the other hand, the LFE-CNN, whose architecture is shown a streamlined for faster computation while retaining almost full feature extraction ability. The design consists of two Conv1D layers with 128 filters each, a kernel size of 3, and ReLU activation, followed by a Flatten layer. Then come three Dense layers of 64, 32, and 16 units with Tanh activation, respectively, finished with a Dense layer with 1 unit and sigmoid activation for binary classification. By having fewer convolutional layers than the DFE-CNN, it gains the advantage of faster training and inference in cases where real-time prediction or very limited computation is demanded, yet having productive feature extraction remains possible.
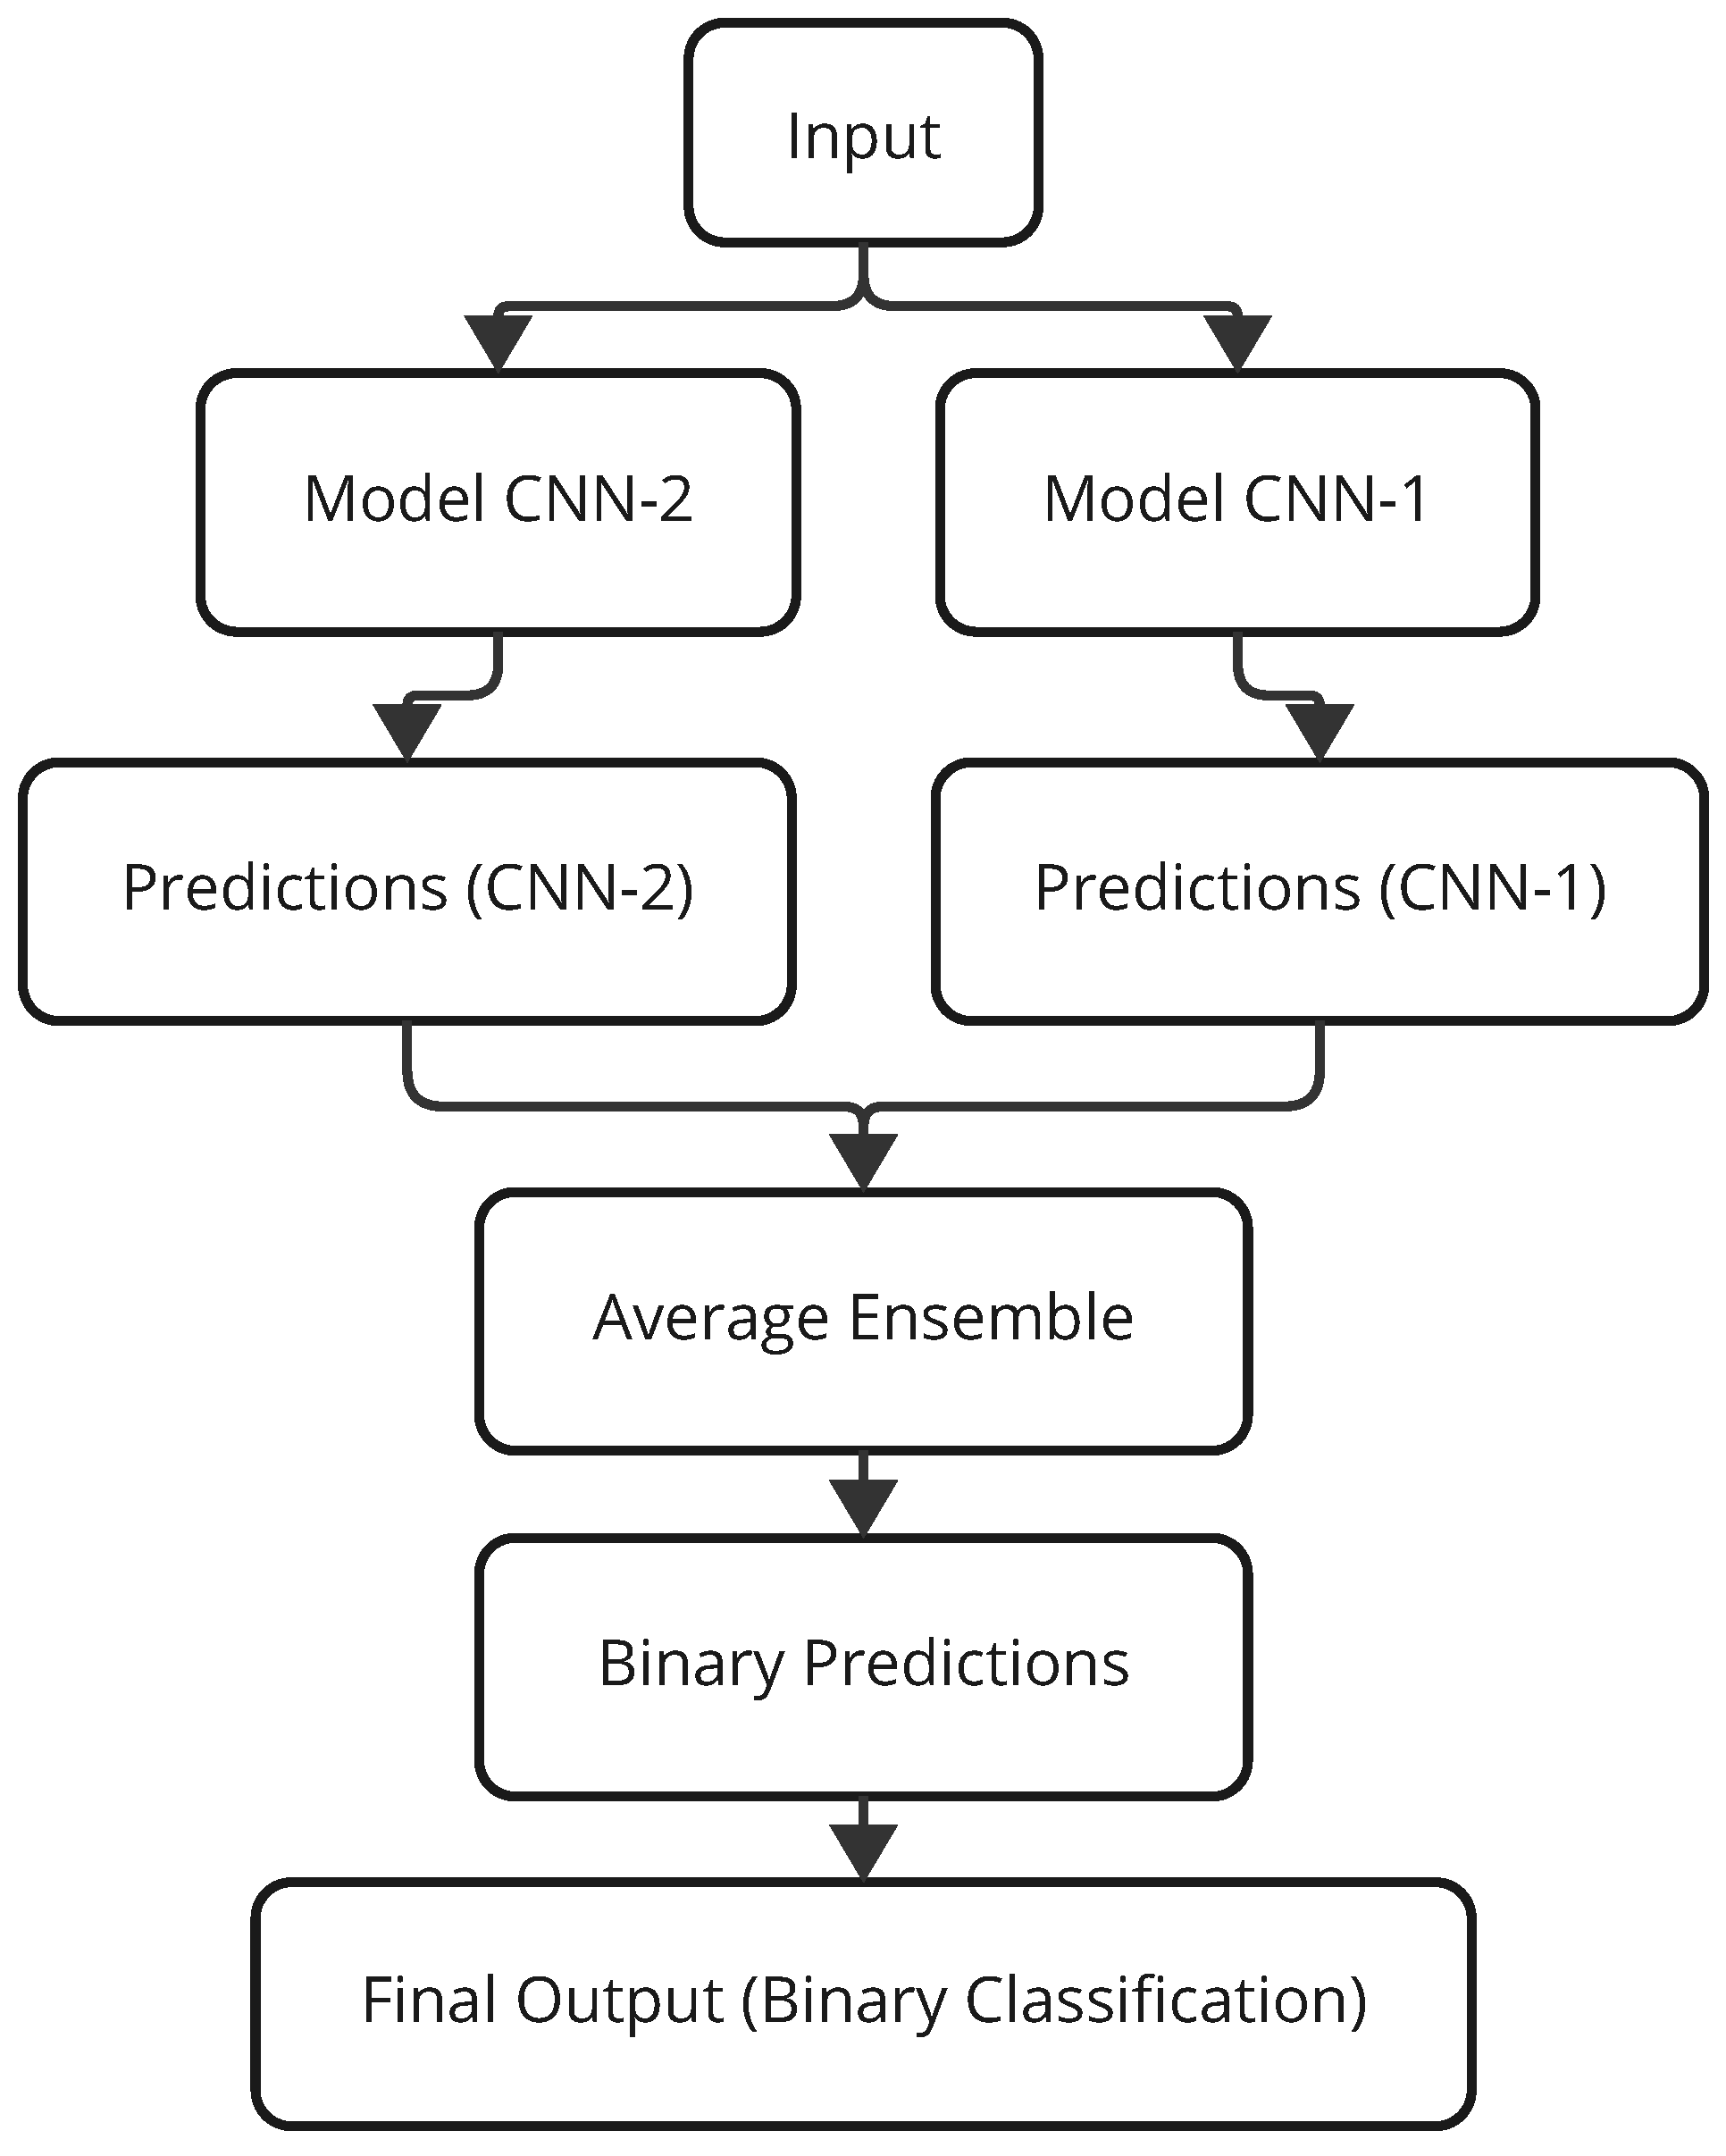
The integration between the two models consists of an average ensemble, which is elucidated in Figure 7. The input data is fed through and processed by both DFE-CNN (Model CNN-1) and LFE-CNN (Model CNN-2), generating predictions independently (Predictions CNN-1 and Predictions CNN-2). The Average Ensemble layer averages the output probabilities of the two models for the final prediction. These average predictions are processed with a threshold function whose value is set to 0.5, returning crisp predictions: either Churn or No Churn. This ensemble setup gives a big performance boost by lessening the biases of individual algorithms and taking into account the pros of a DFE-CNN that focuses on deep feature extraction and an LFE-CNN that worries about computational time, against the generalization ability of an unseen set of data.
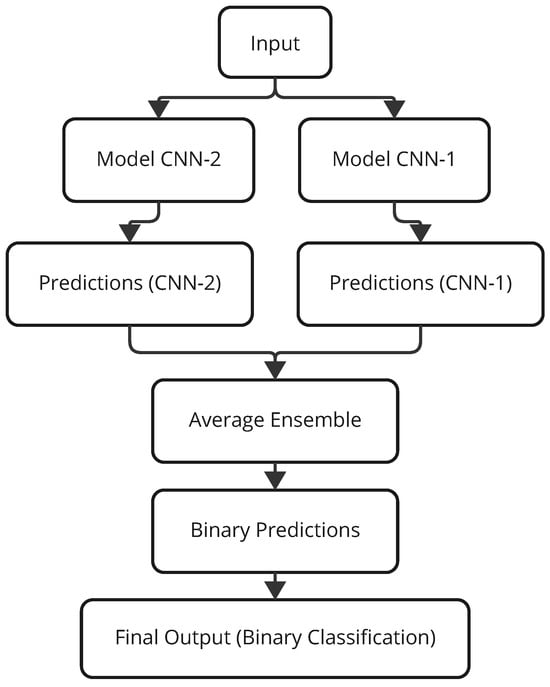
Figure 7.
Architecture of the Ensemble model.
This hybrid strategy assumes particular importance while treating diverse datasets, in which individual models typically excel at feature learning in diverse aspects. The ensembled model counters individual deficiencies intrinsic to the architectures and, thus, yields more stable and sound predictions across various conditions, aligning with the study’s goal of evaluating churn prediction across insurance, internet service, and telecom datasets.
This section described the churn-prediction methodology, including the choice of three datasets (insurance, internet service provider, and telecom), preprocessing techniques to impute missing values and address class imbalance, and the tooling of XGBoost, CNN, and Ensemble Deep Learning models. In the ensemble-thought process, the DFE (Deep Feature Extractor) and LFE (Lightweight Feature Extractor) CNNs were combined to improve accuracy and generalization. The next section will present and discuss the results concerning model performance over the datasets.
4. Results and Discussion
4.1. Setup
All experiments were conducted on a computer with 32.0 GiB RAM, Intel Core i7-9850H × 12, Intel UHD Graphics 630 + NVIDIA Quadro T2000, 1.0 TB disk. The OS is Ubuntu 24.04.2 LTS (Kernel 6.11.0-24-generic), GNOME 46, X11, and with Python 3.10.16.
4.2. Results
This section describes the performance of the models over the three datasets, namely, the Insurance Churn Dataset, the Internet Service Provider Customer Churn Dataset, and the Telecom Churn Dataset. Performance metrics included are accuracy, recall, precision, F1-score, and Kappa score. To provide a comprehensive evaluation, especially for imbalanced datasets, we computed the Precision-Recall Area Under the Curve (PR-AUC) for all models, with results for the best-performing models reported in Table 2. The Ensemble Deep Learning model achieved a PR-AUC of 93.54% on the Insurance dataset, XGBoost achieved 97.89% on the ISP dataset, and 1D-CNN achieved 99.36% on the Telecom dataset. Additionally, we introduced cost-based metrics to quantify the business impact, assuming a retention offer cost of USD 50 per customer and a revenue of USD 500 per retained customer. The net benefit is calculated as the gain from the true positives (retained customers) minus the cost of false positives (incorrect offers), summarized in Table 3. The confusion matrices and ROC curves presented in Figure 8, Figure 9, Figure 10, Figure 11, Figure 12 and Figure 13, Precision-Recall curves and Lift and Gain charts presented in Figure 14, Figure 15, Figure 16, Figure 17, Figure 18 and Figure 19 for (Insurance, ISP, and Telecom, respectively) were generated to illustrate the models’ ability to prioritize high-risk churners for targeted interventions. To provide a detailed comparison of model performance, Table 4 presents the accuracy and loss metrics for XGBoost, CNN, Ensemble Deep Learning, and an Attention-based Deep Learning model across the Insurance, ISP, and Telecom datasets. The Ensemble Deep Learning model achieves the lowest loss (0.130) on the Insurance dataset, while the CNN model excels on the Telecom dataset with a loss of 0.120, highlighting their respective strengths in handling different data characteristics.
Table 2.
Performance of each model on different churn prediction datasets.
Table 3.
Cost-based metrics for the best-performing model on each churn prediction dataset (Cost: USD 50 per false positive; Gain: USD 500 per true positive).
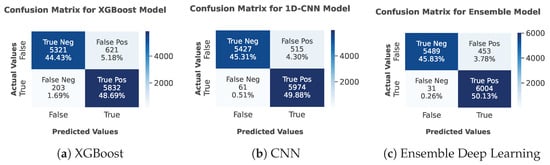
Figure 8.
Confusion matrix for Insurance Churn Dataset.
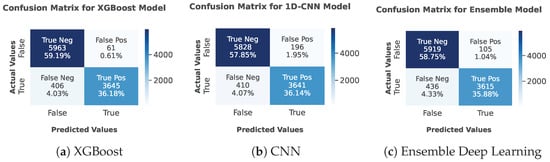
Figure 9.
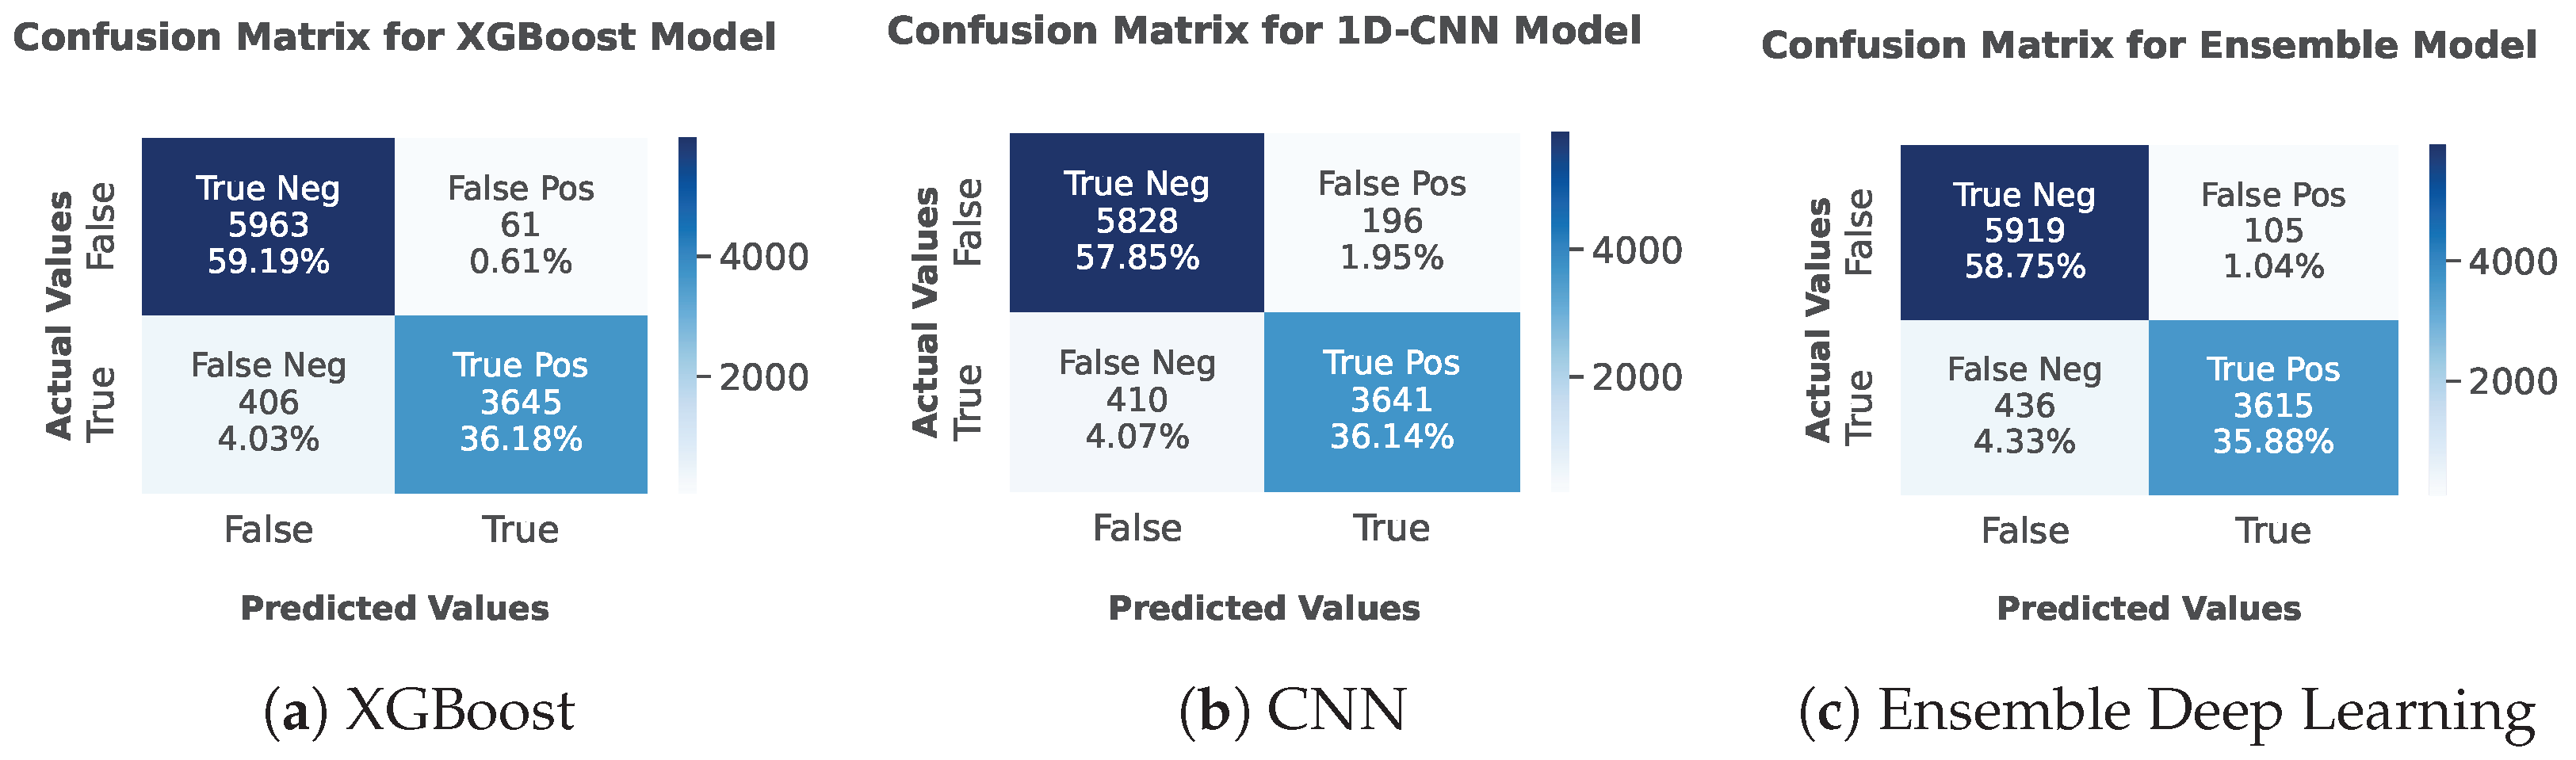
Confusion matrix for Internet Service Provider Customer Churn Dataset.
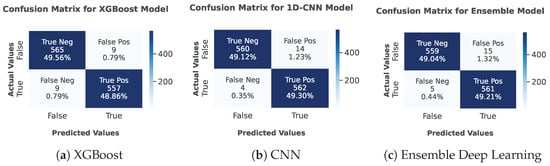
Figure 10.
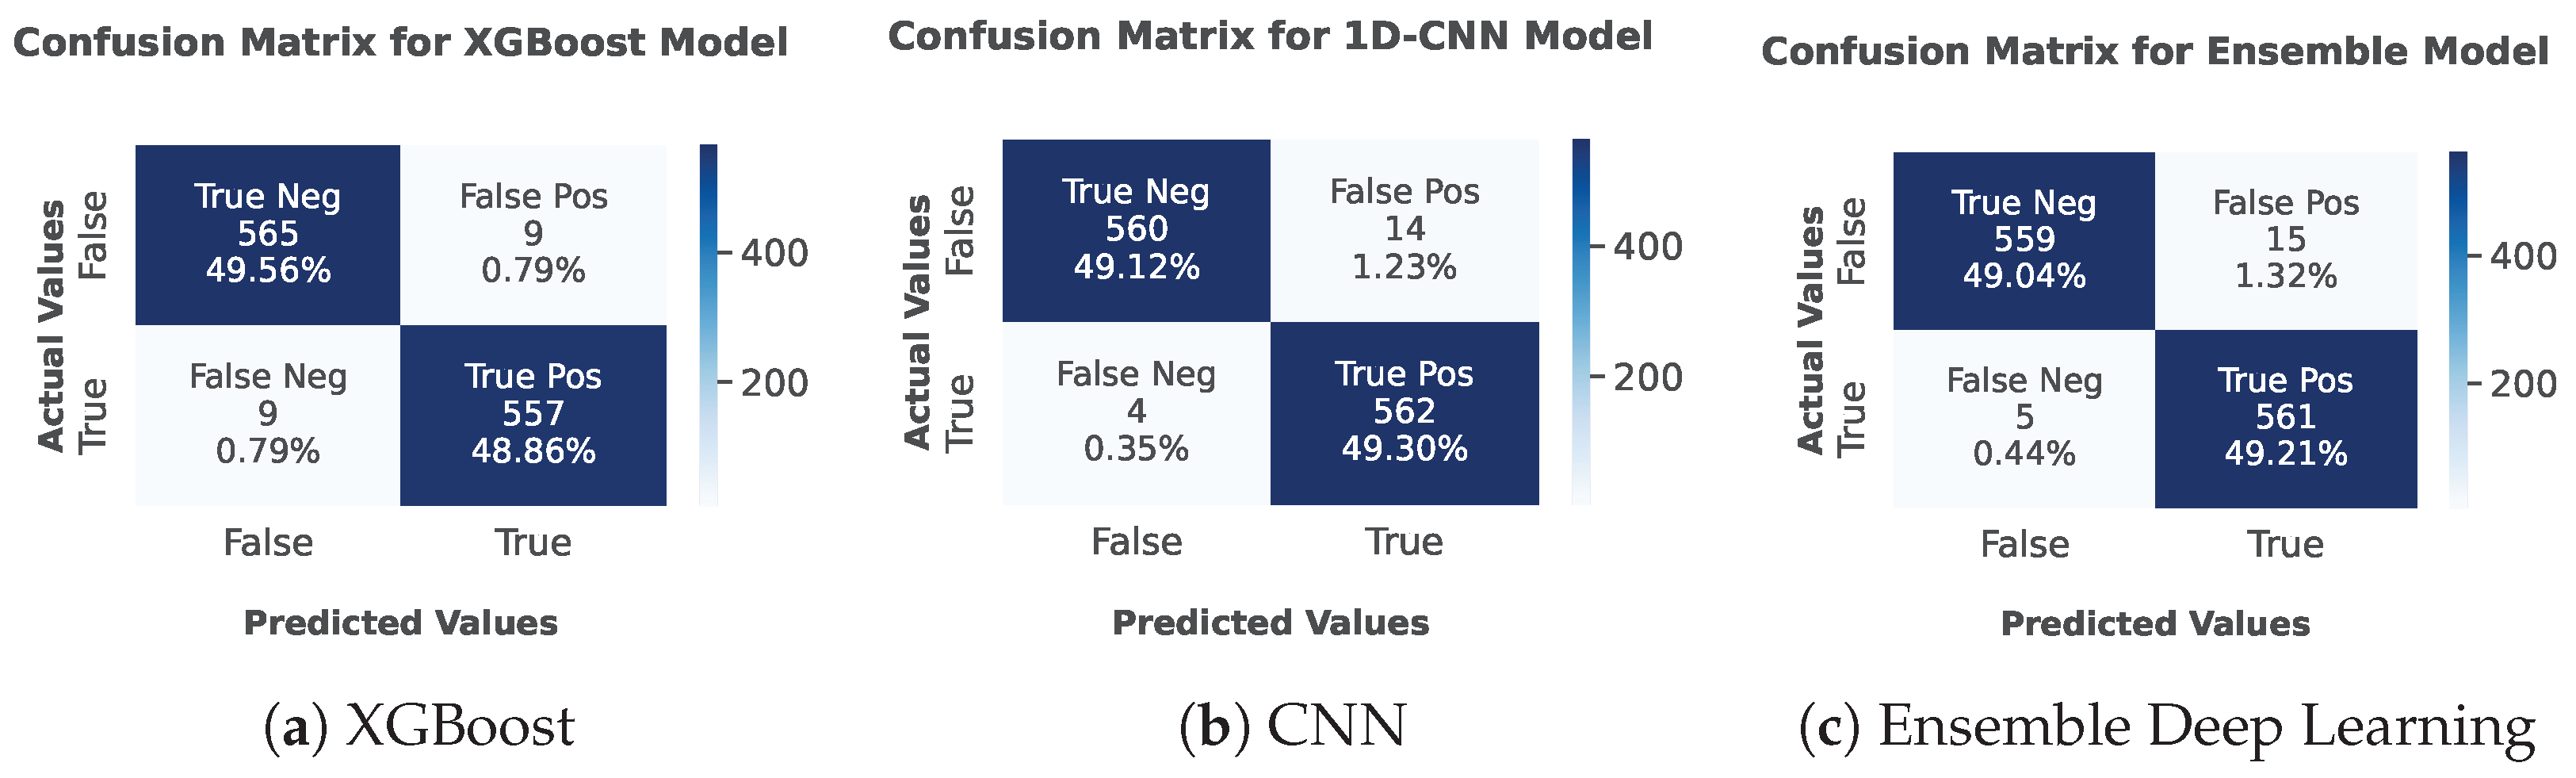
Confusion matrix for Telecom Churn Dataset.
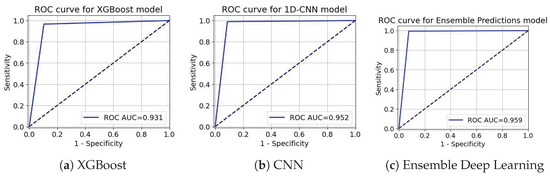
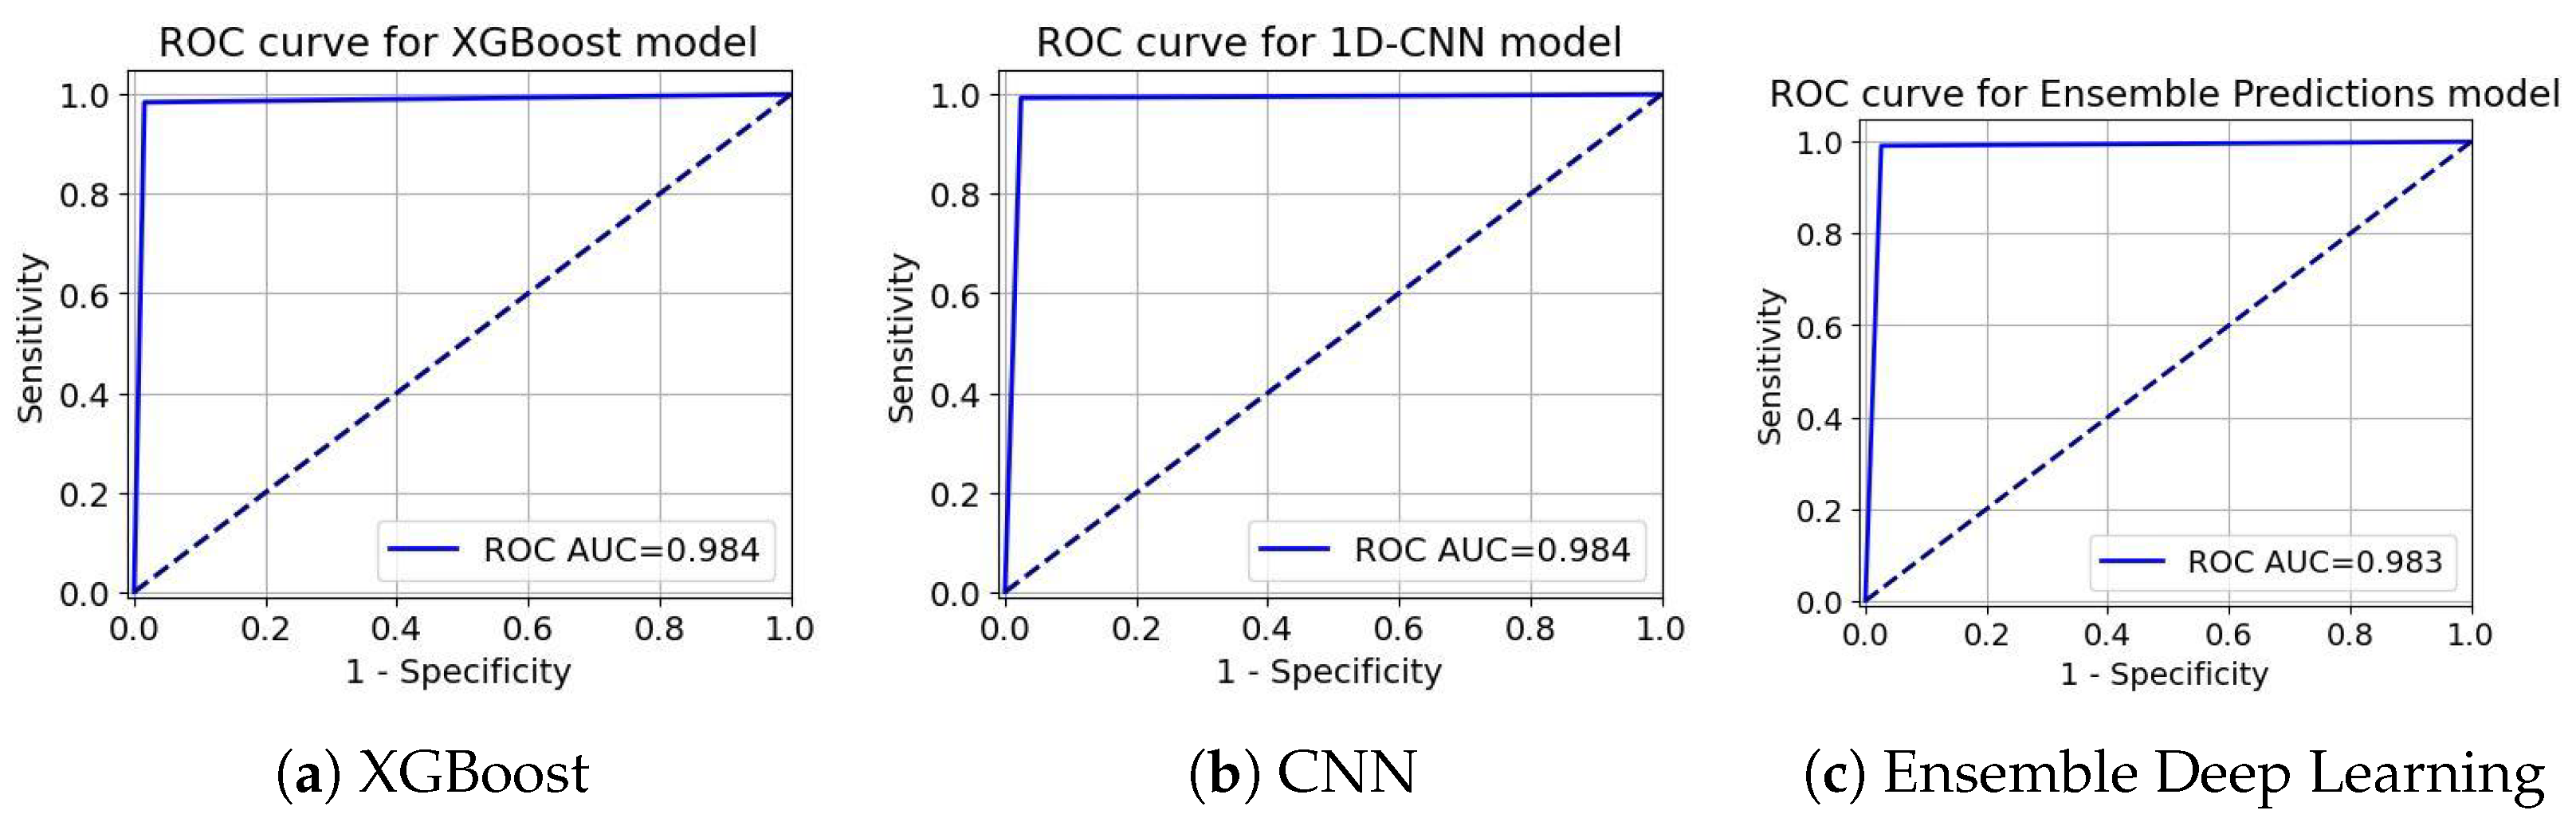
Figure 11.
ROC-AUC curve for the Insurance Churn Dataset.
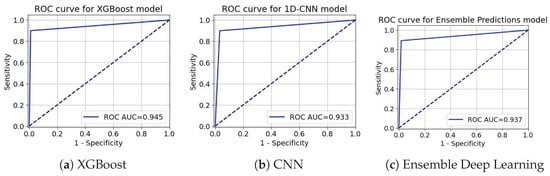
Figure 12.
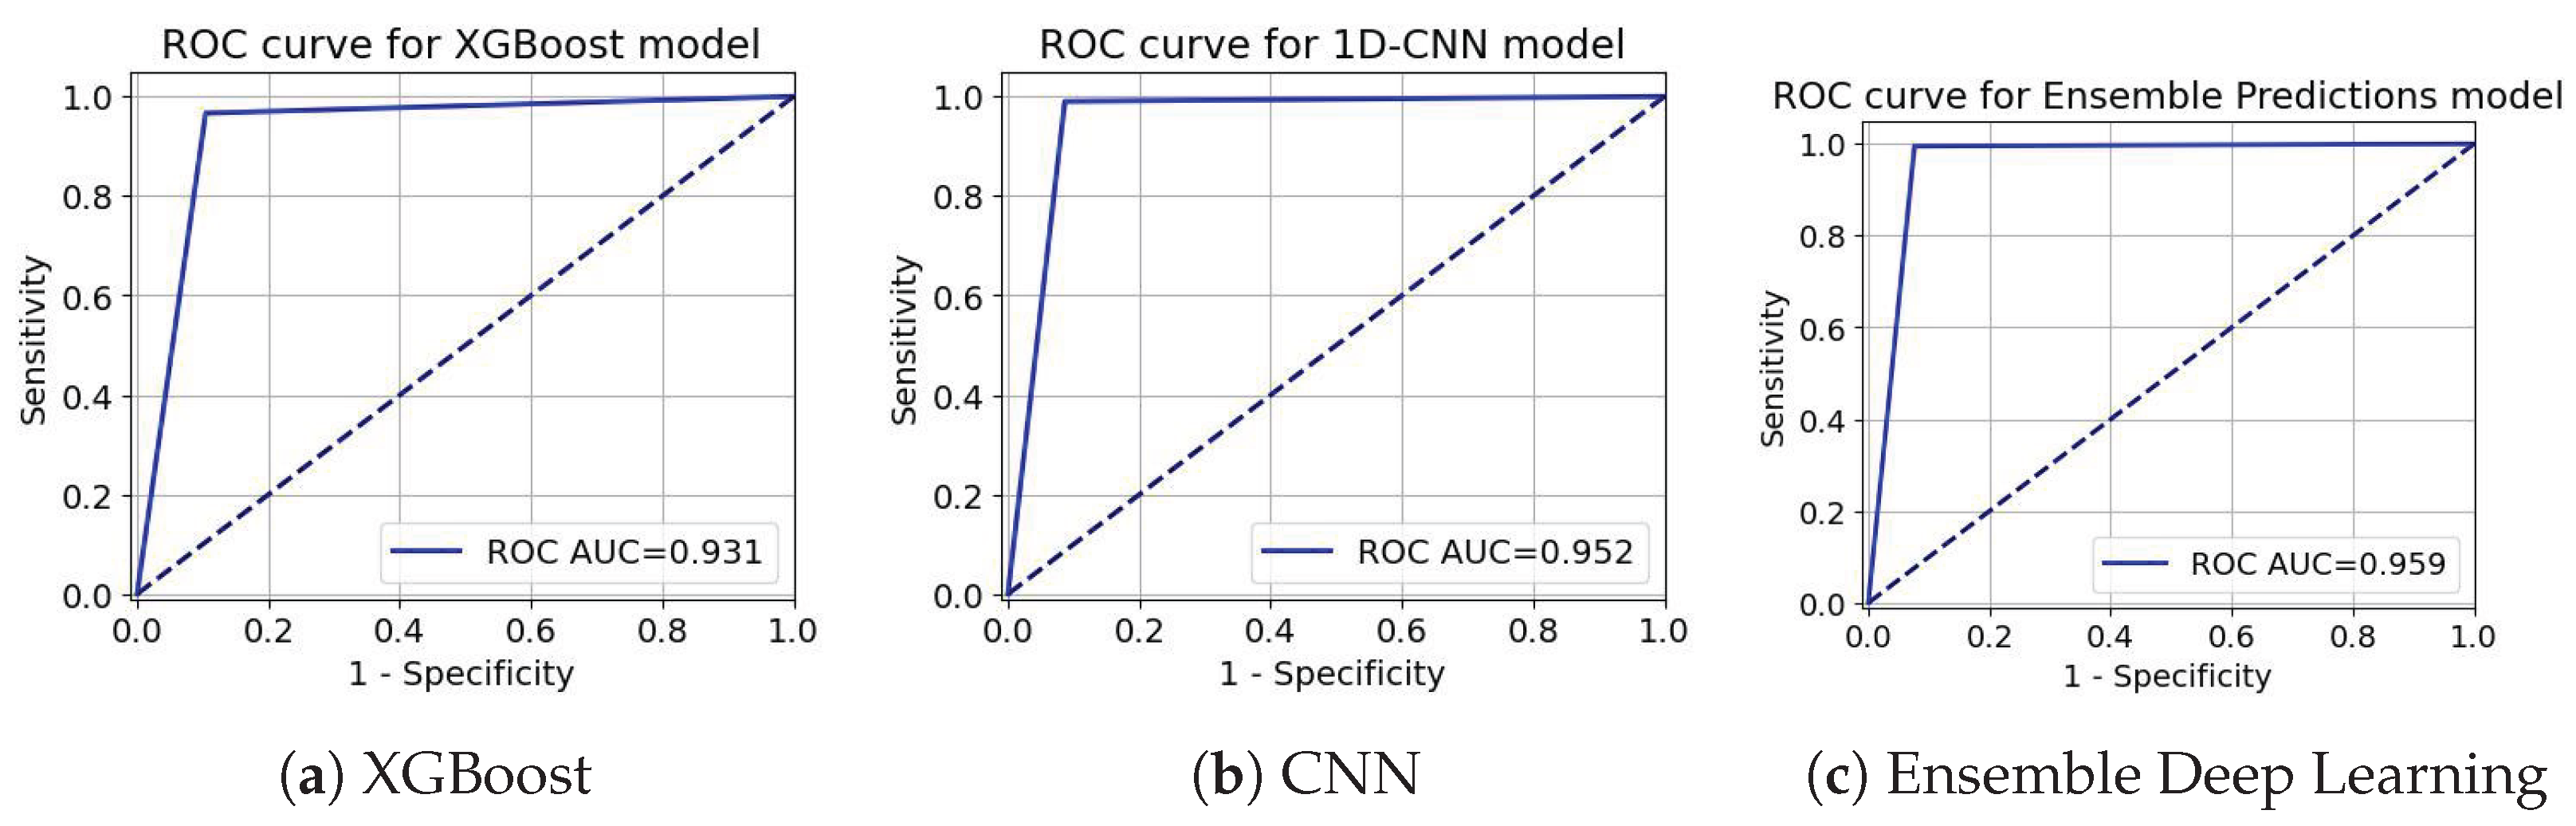
ROC-AUC curve for the Internet Service Provider Customer Churn Dataset.
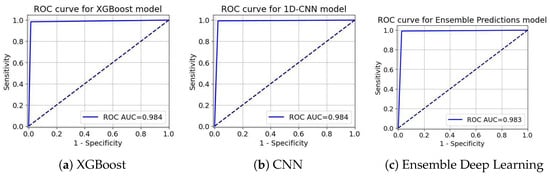
Figure 13.
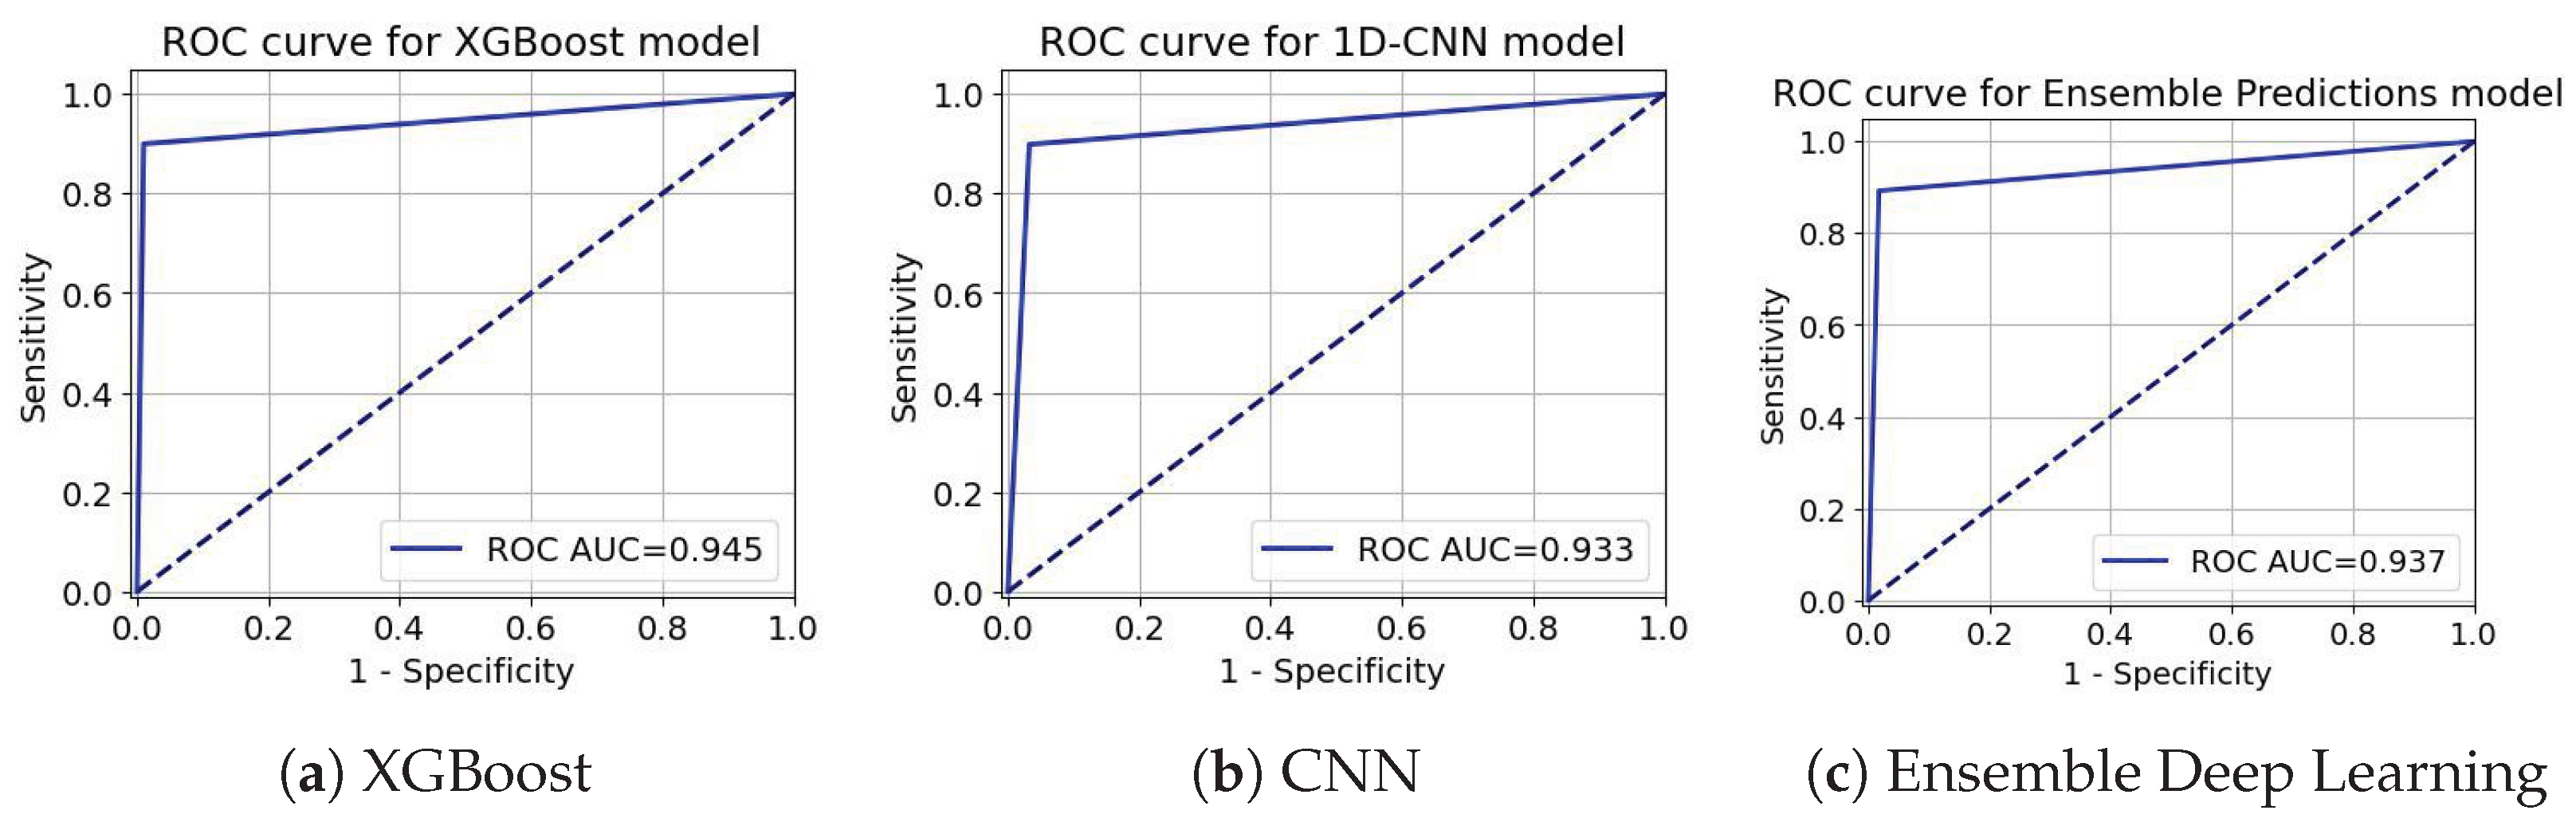
ROC-AUC curve for Telecom Churn Dataset.
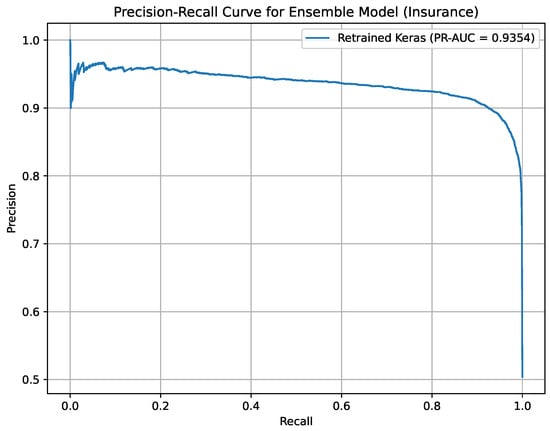
Figure 14.
Precision-Recall curve for Ensemble Deep Learning on the Insurance Churn Dataset.
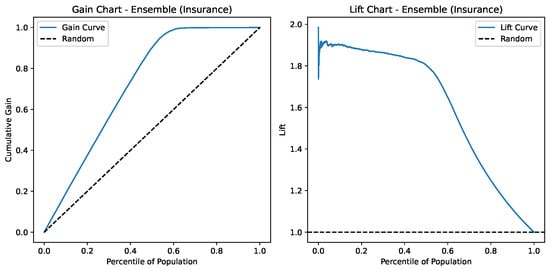
Figure 15.
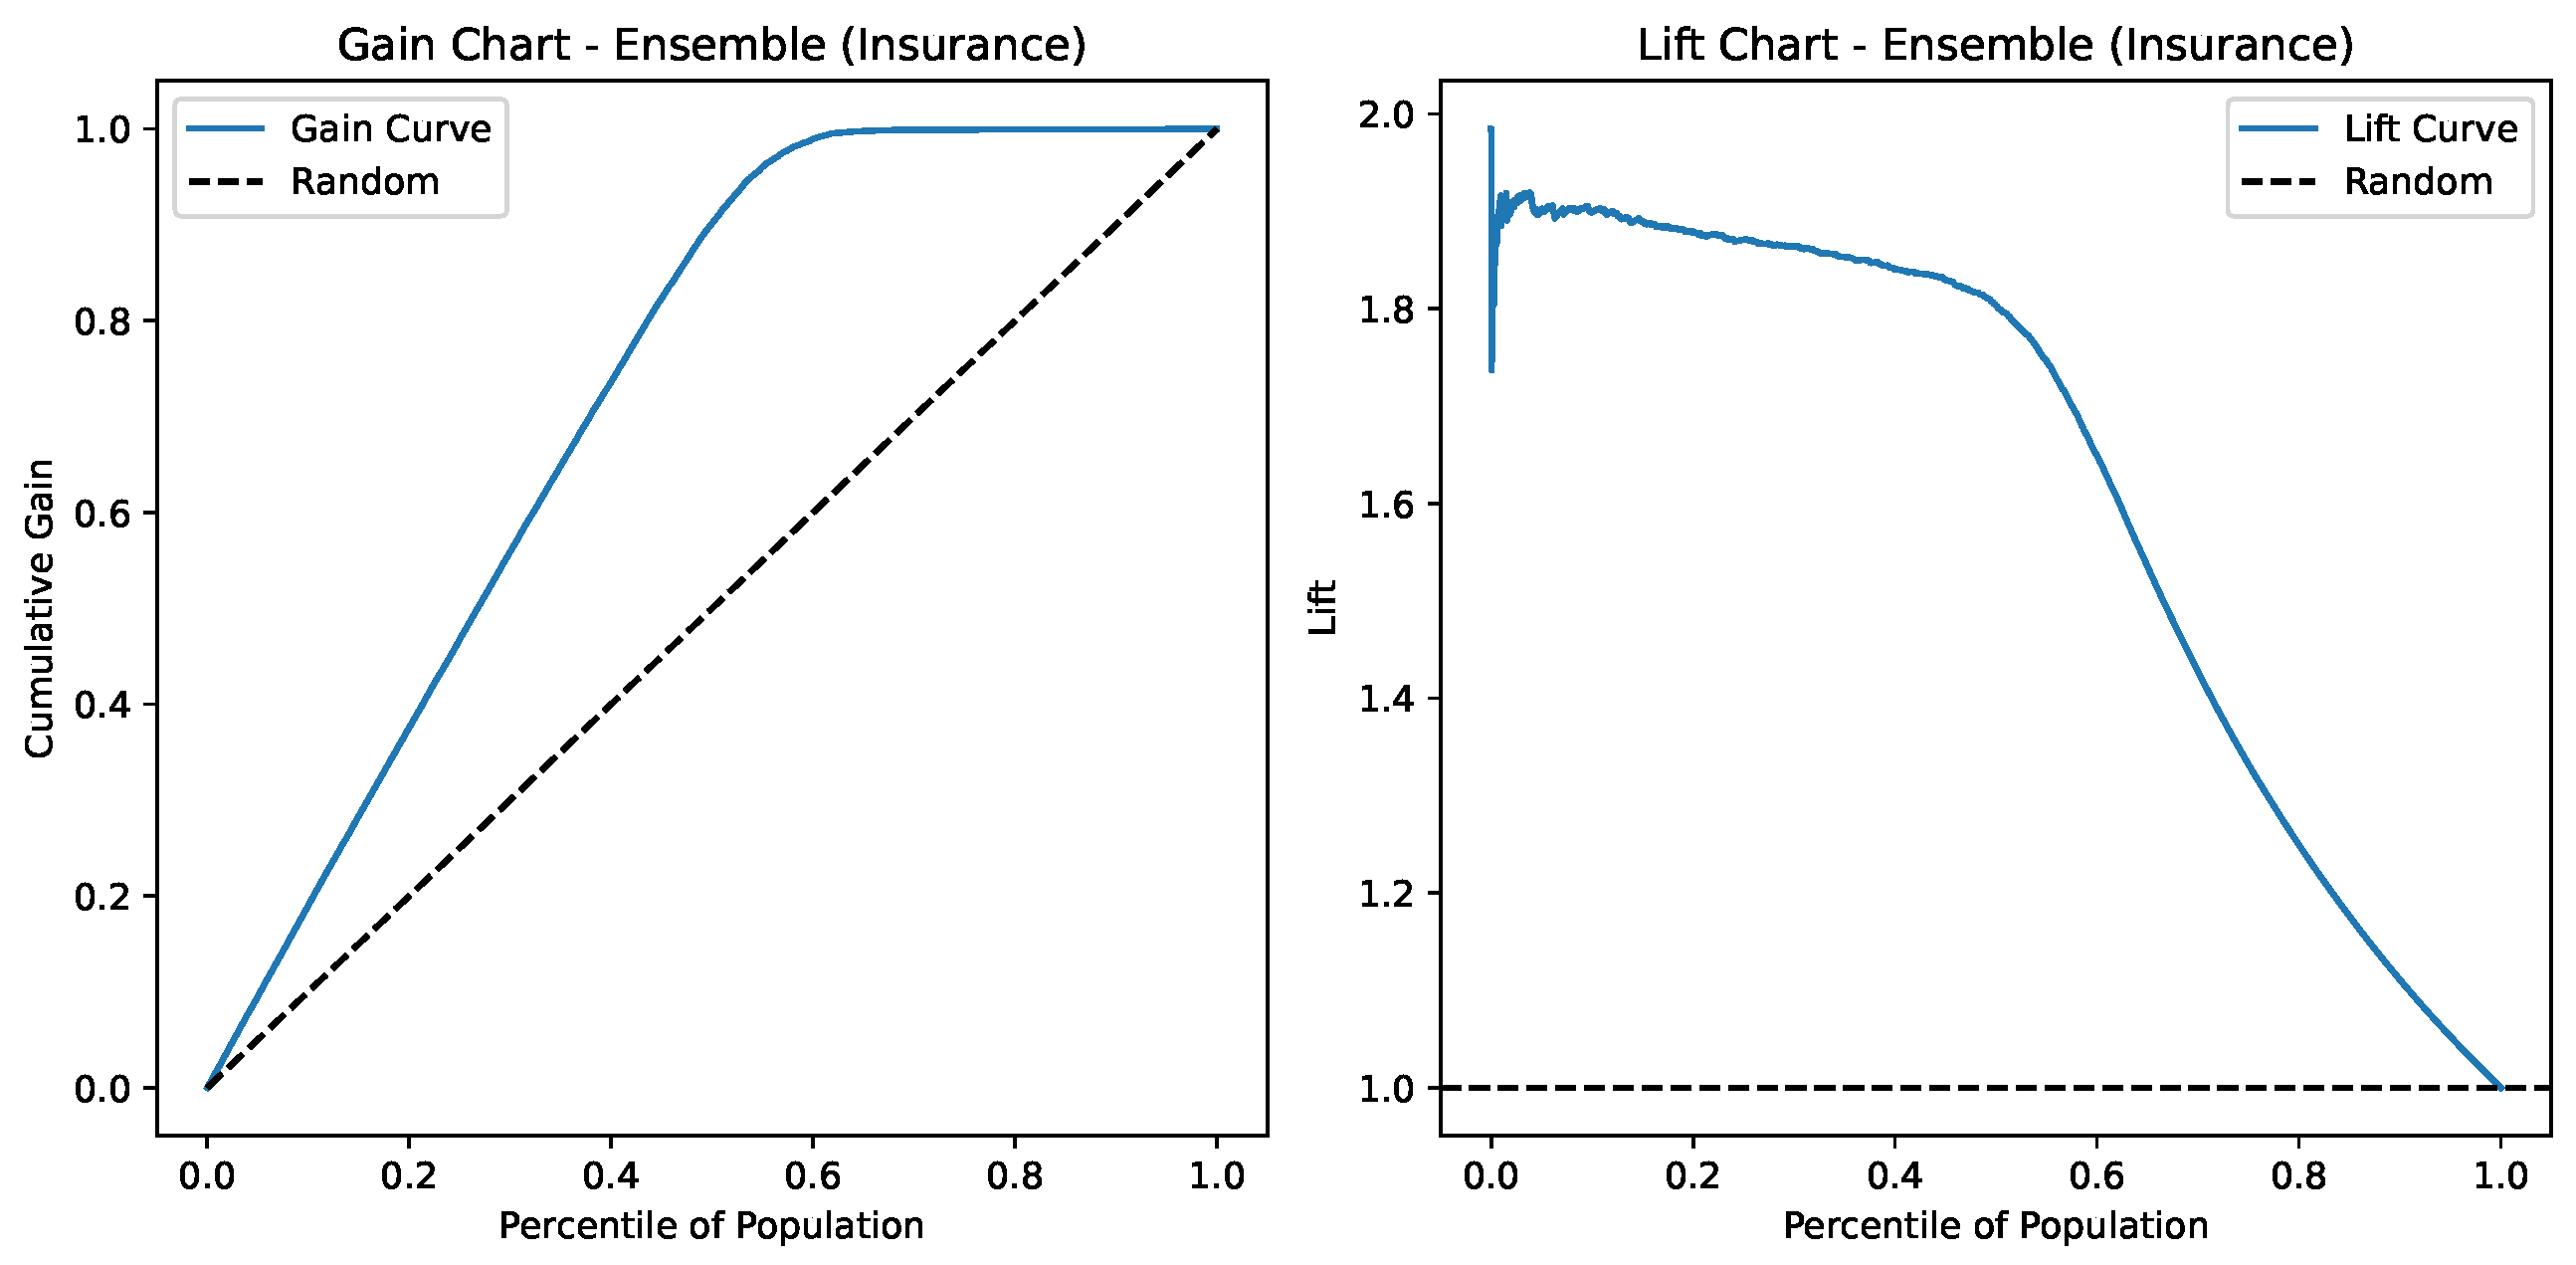
Lift and Gain charts for Ensemble Deep Learning on the Insurance Churn Dataset.
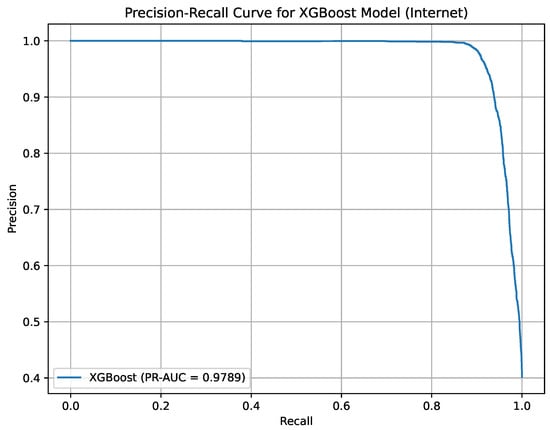
Figure 16.
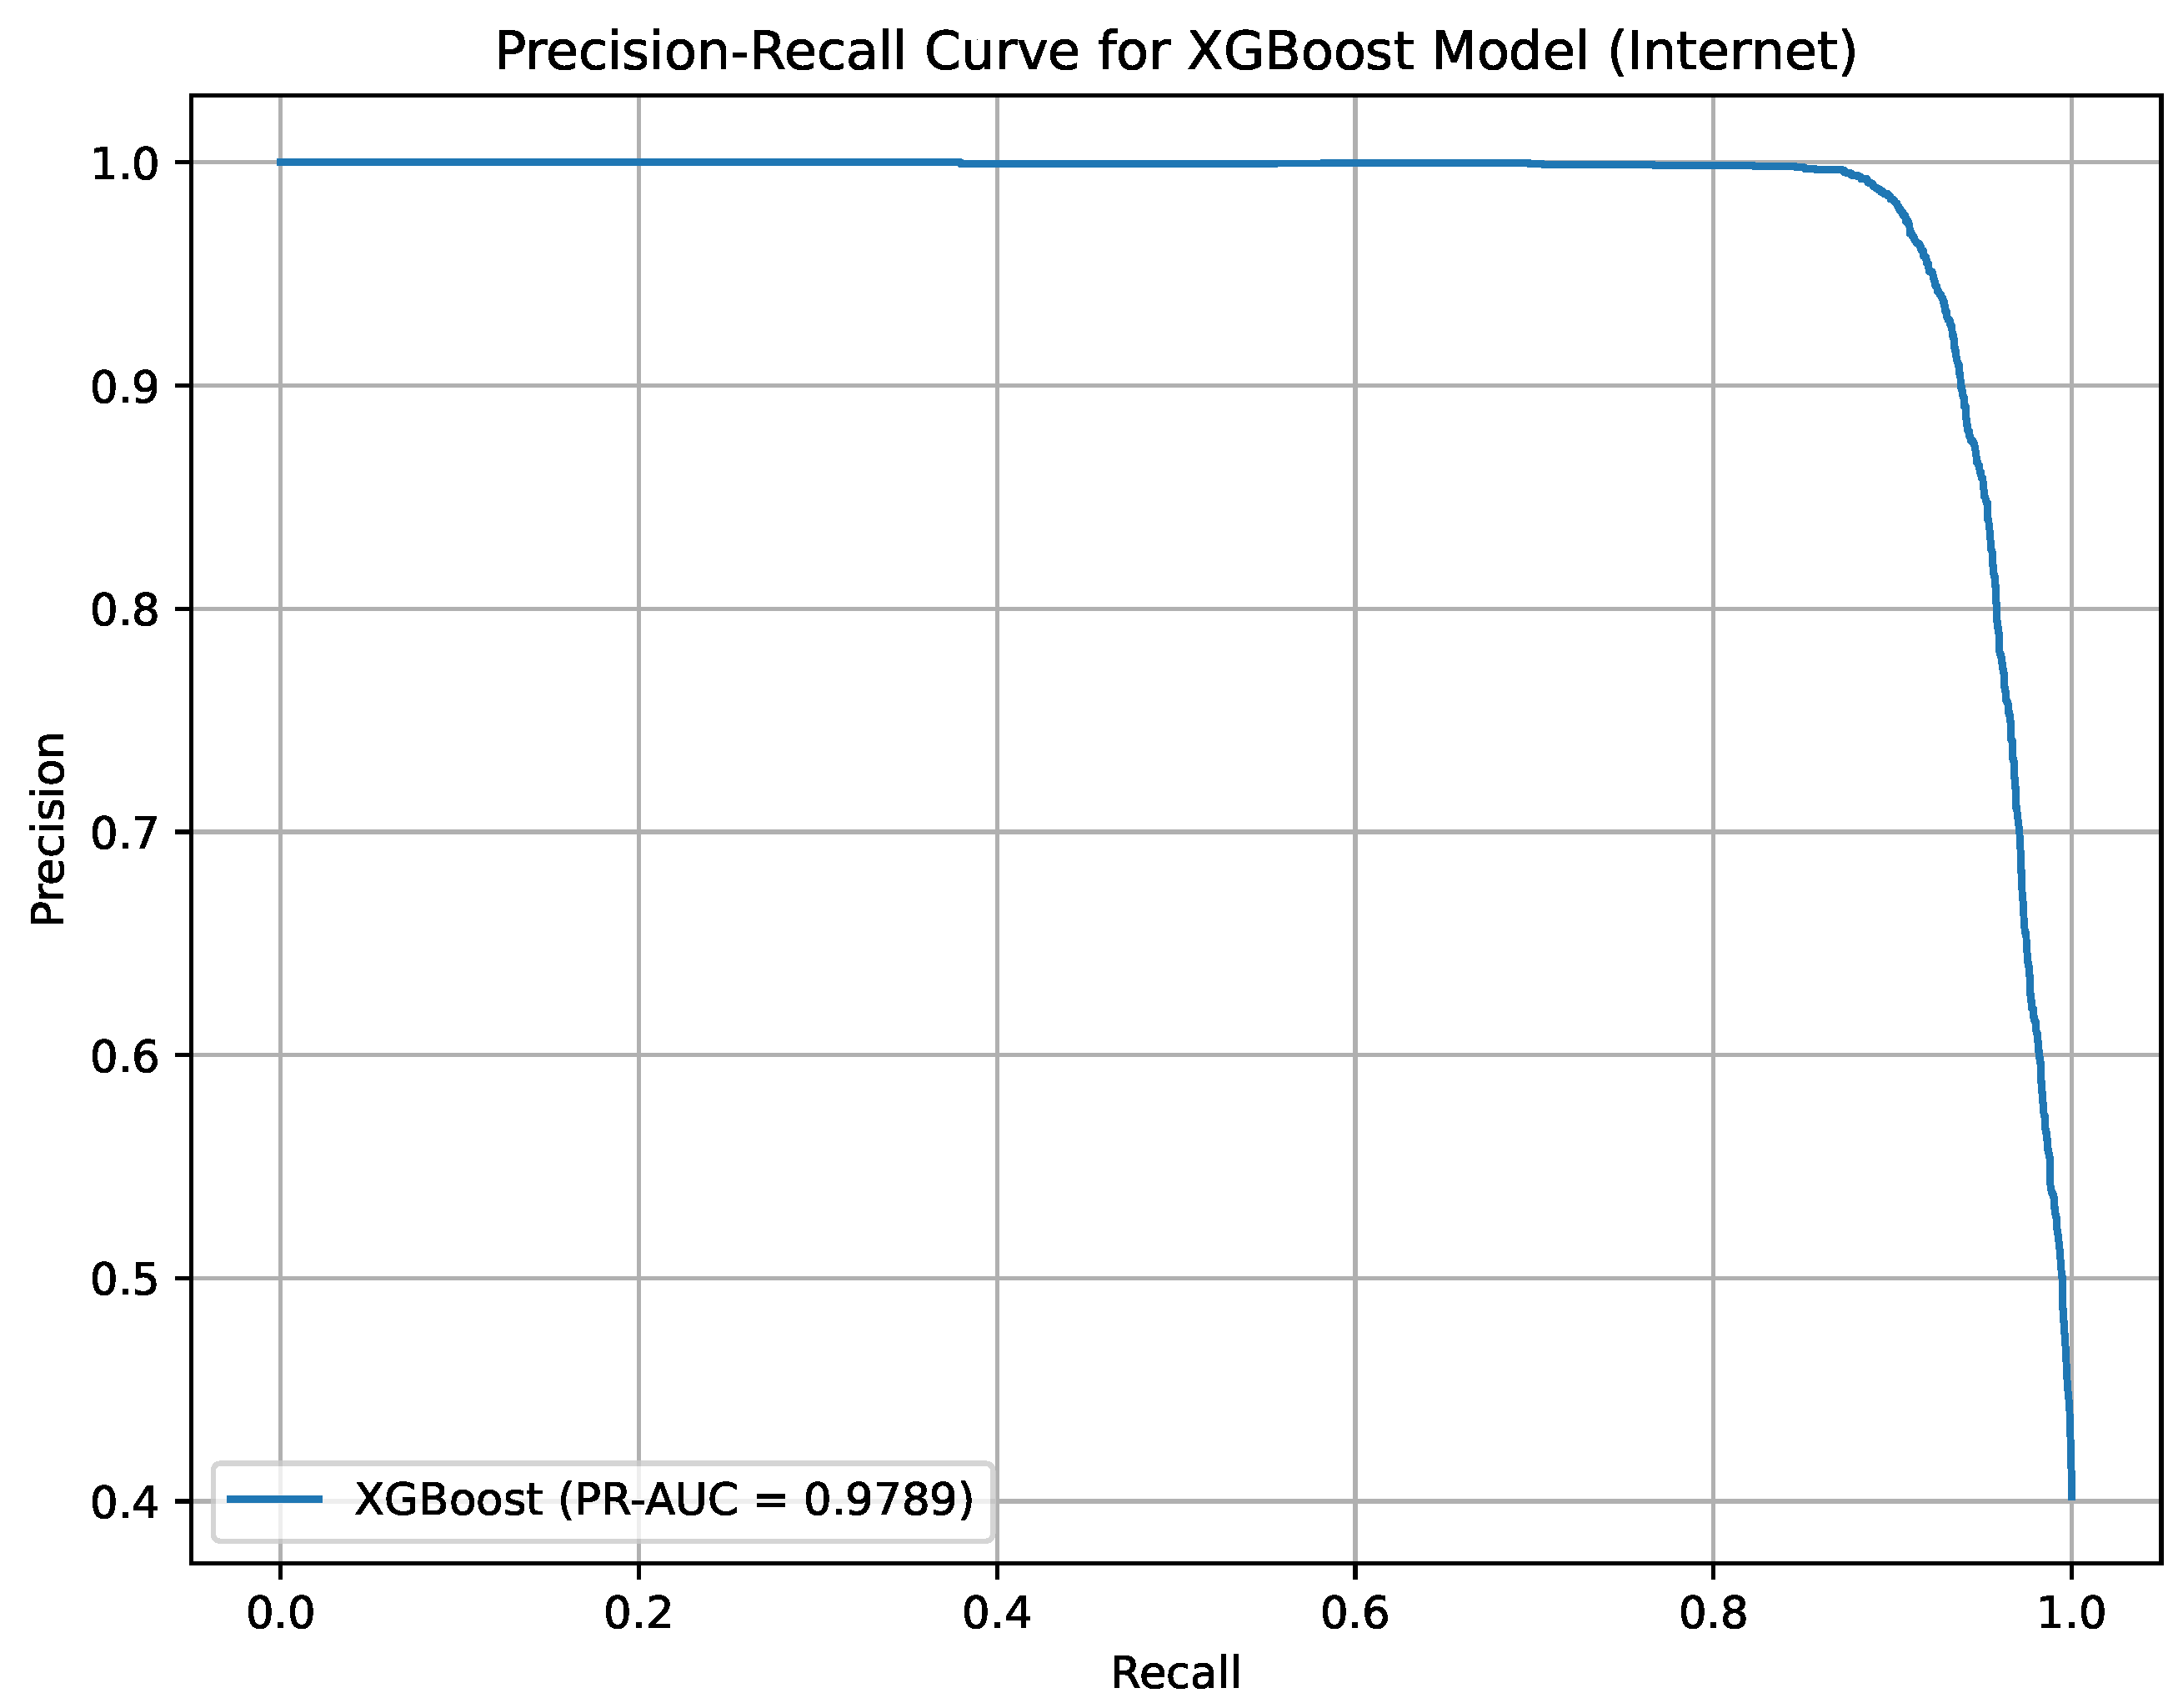
Precision-Recall curve for XGBoost on the Internet Service Provider Customer Churn Dataset.
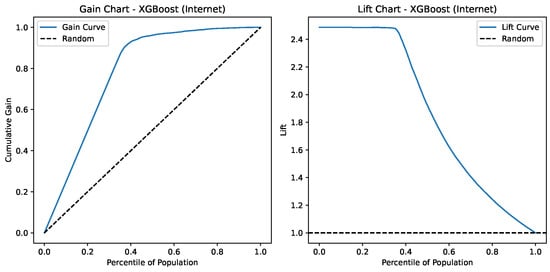
Figure 17.
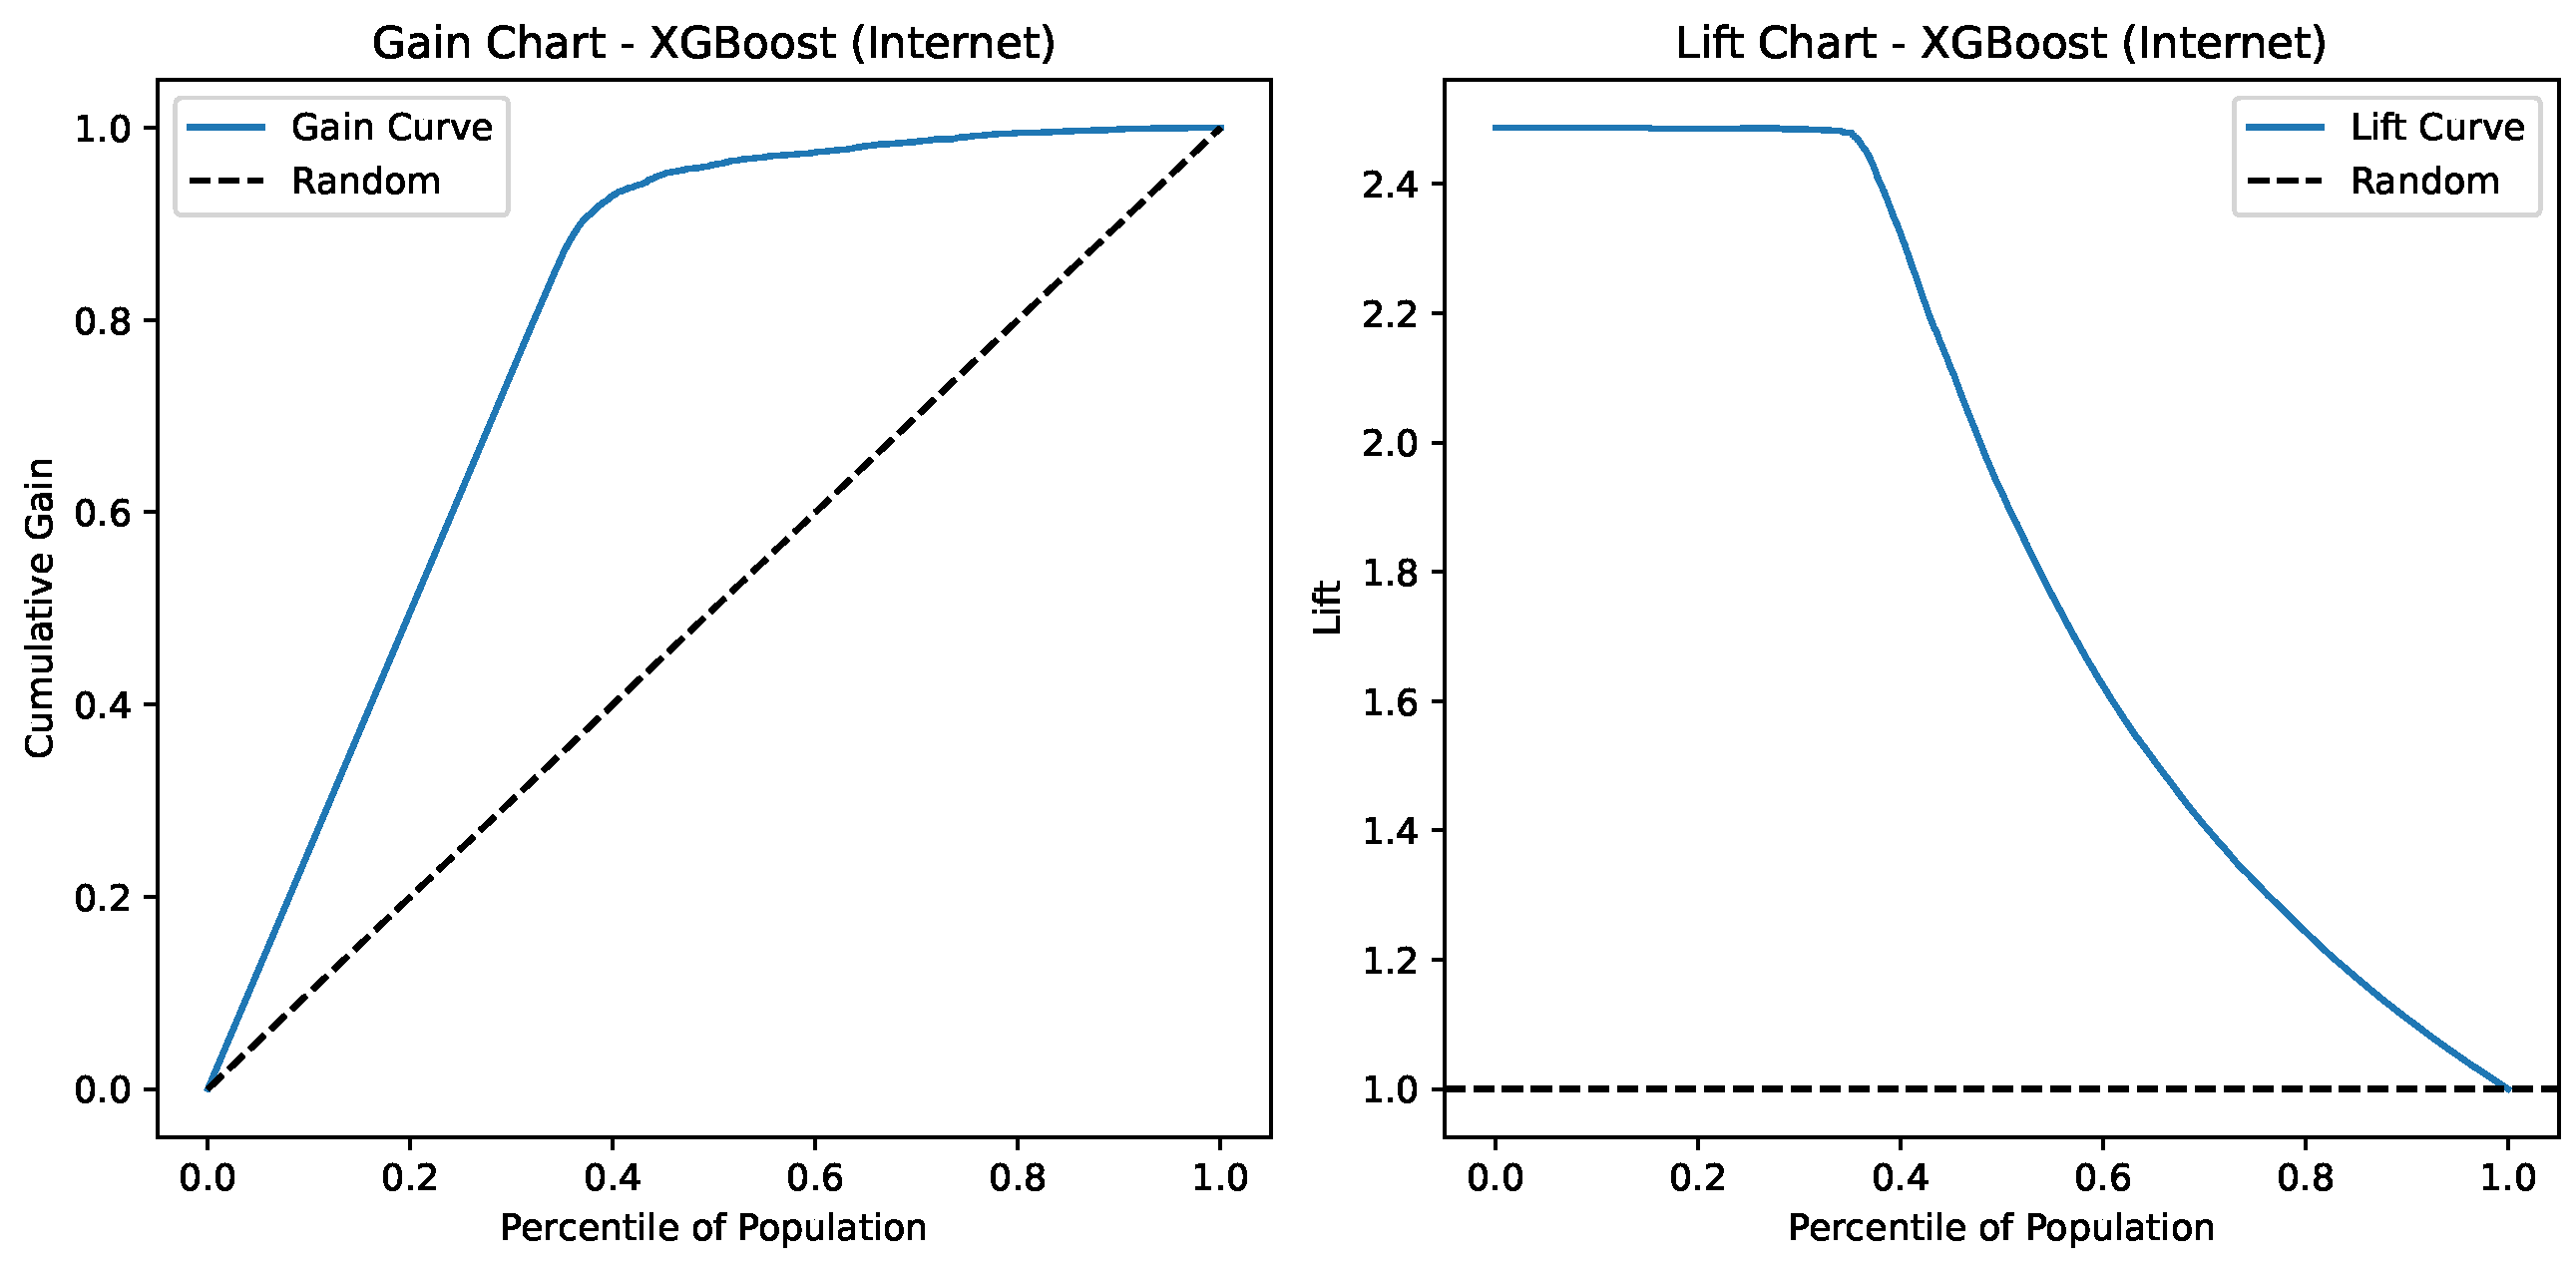
Lift and Gain charts for XGBoost on the Internet Service Provider Customer Churn Dataset.
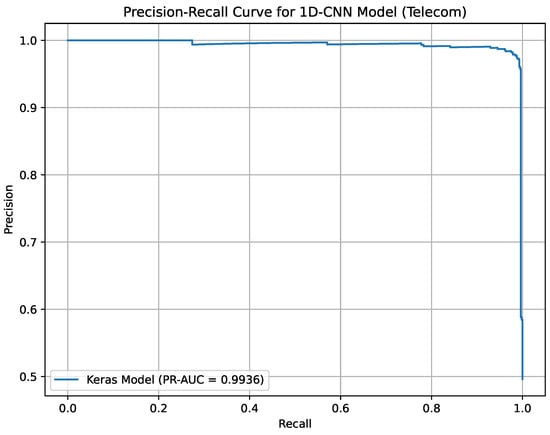
Figure 18.
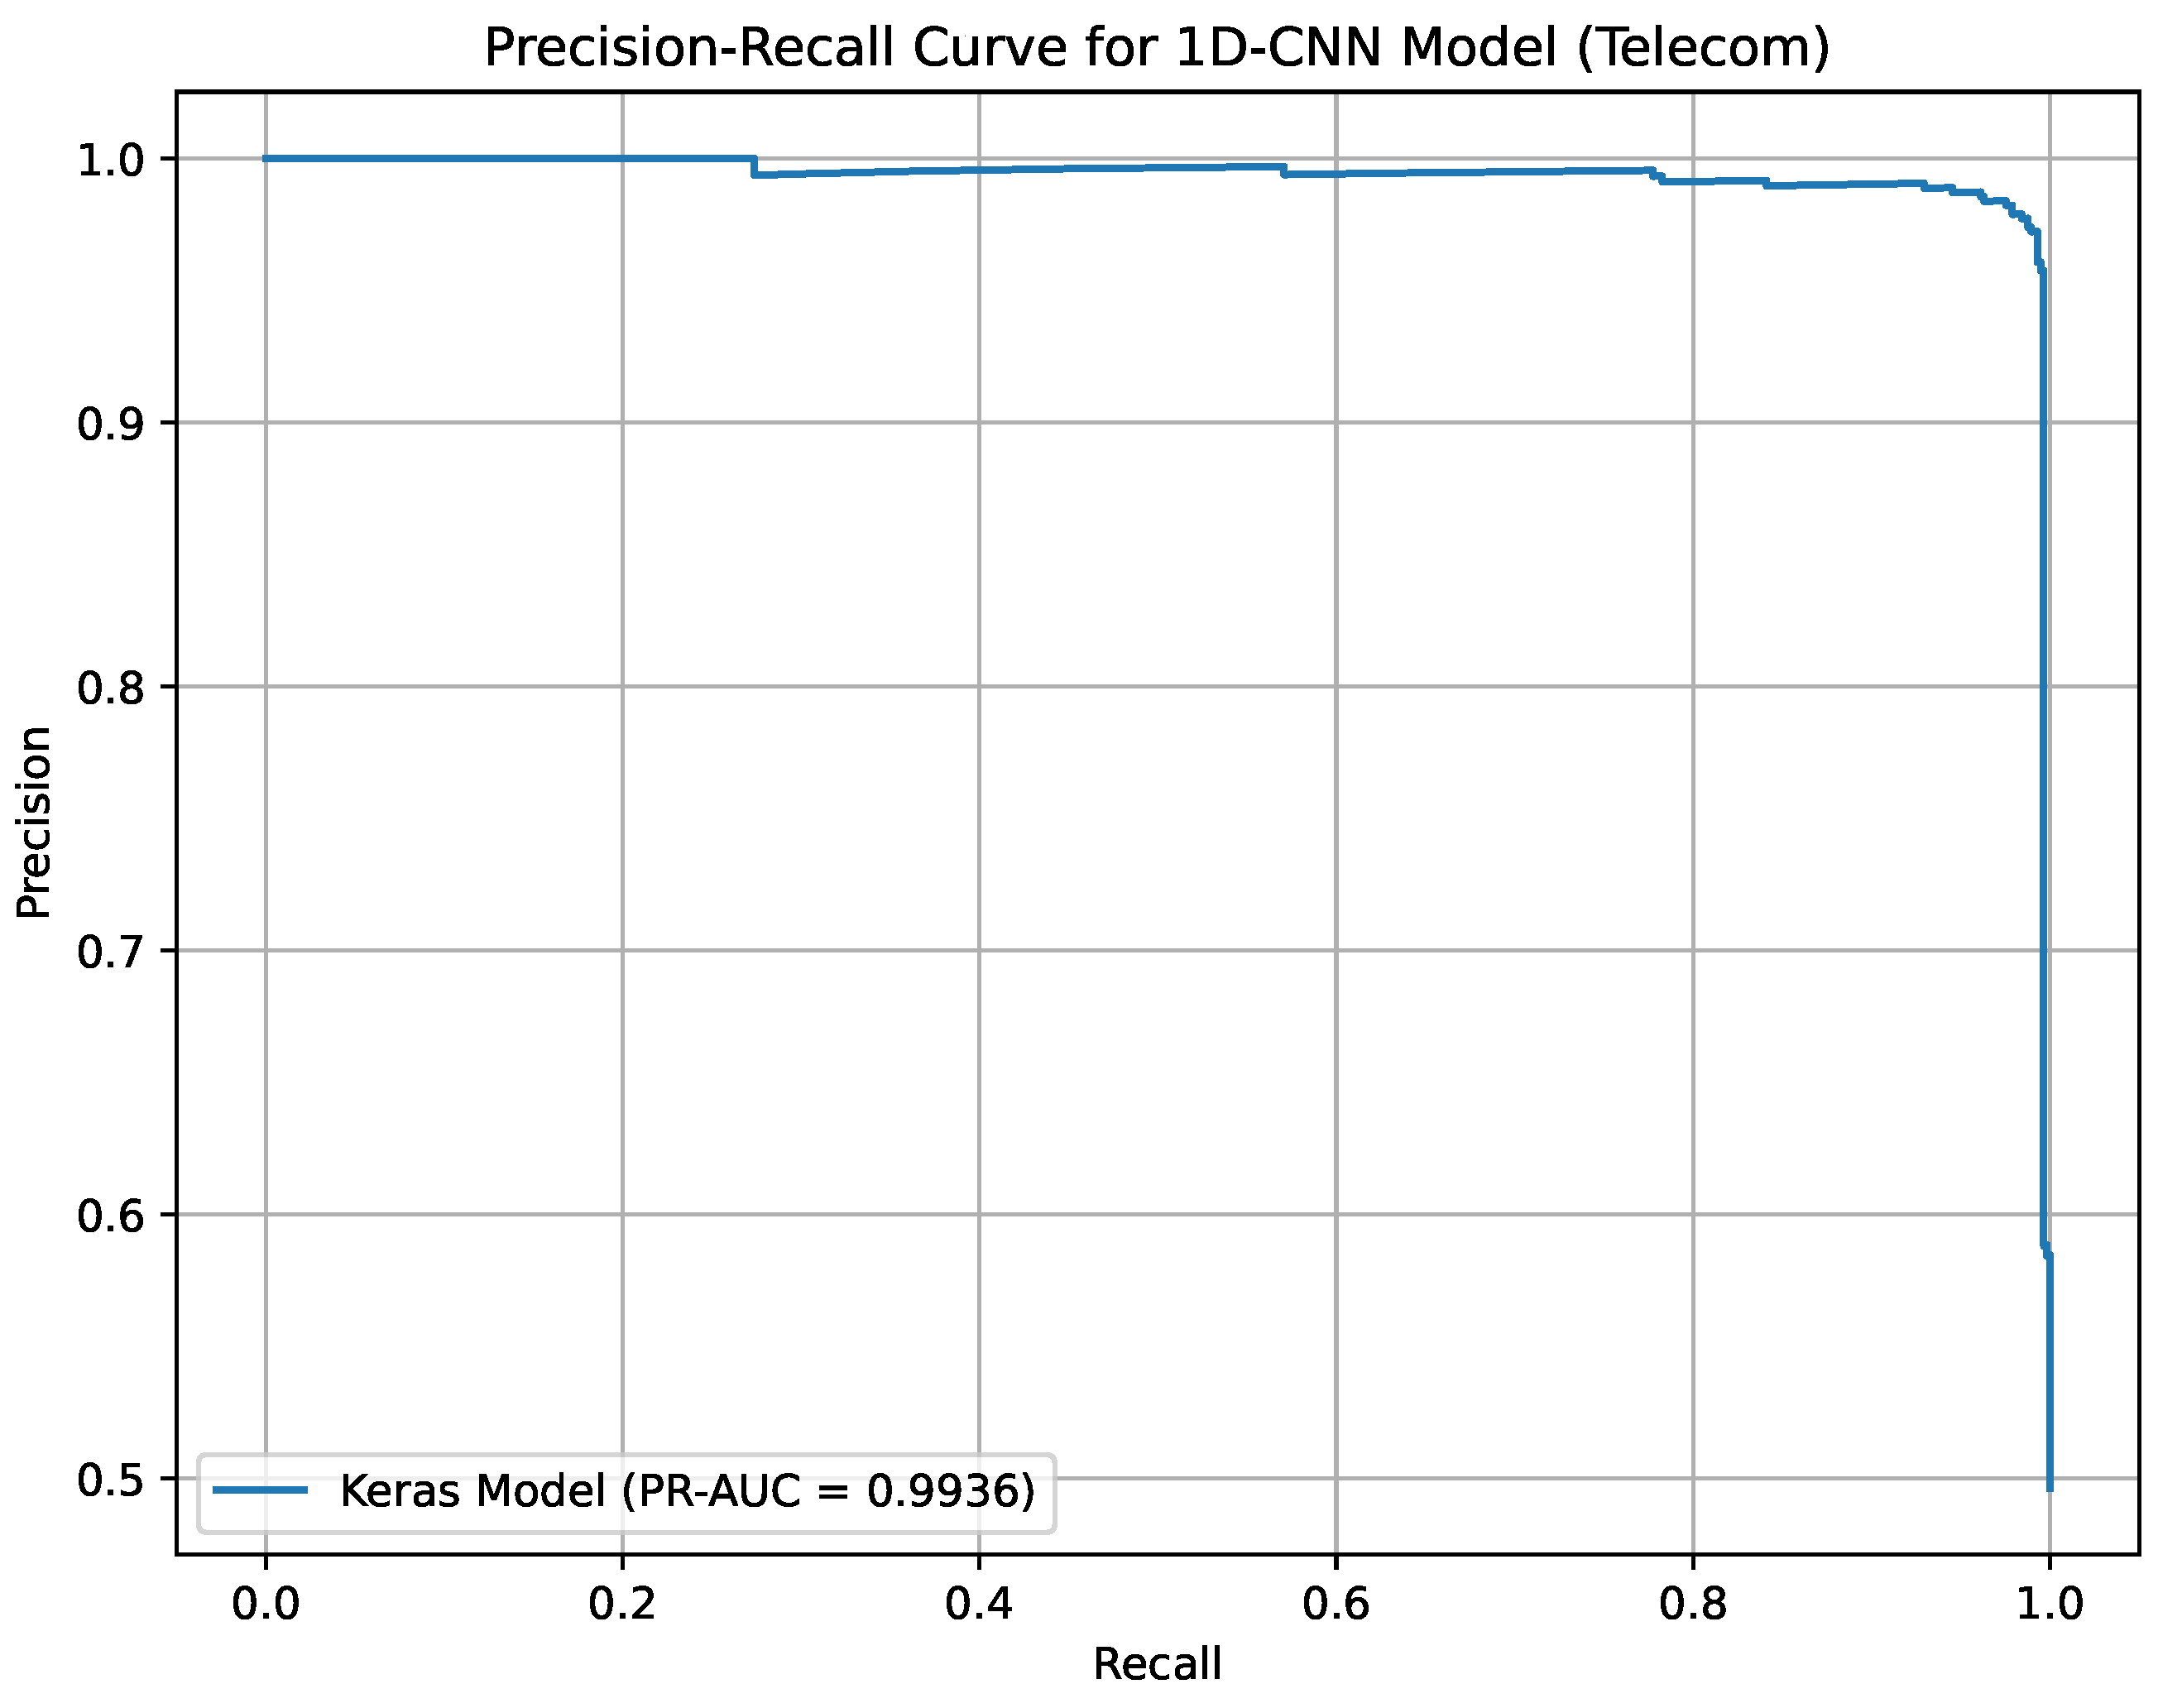
Precision-Recall curve for 1D-CNN on the Telecom Churn Dataset.
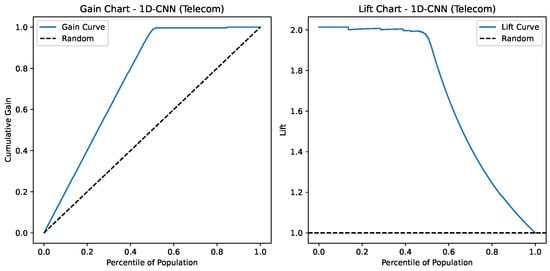
Figure 19.
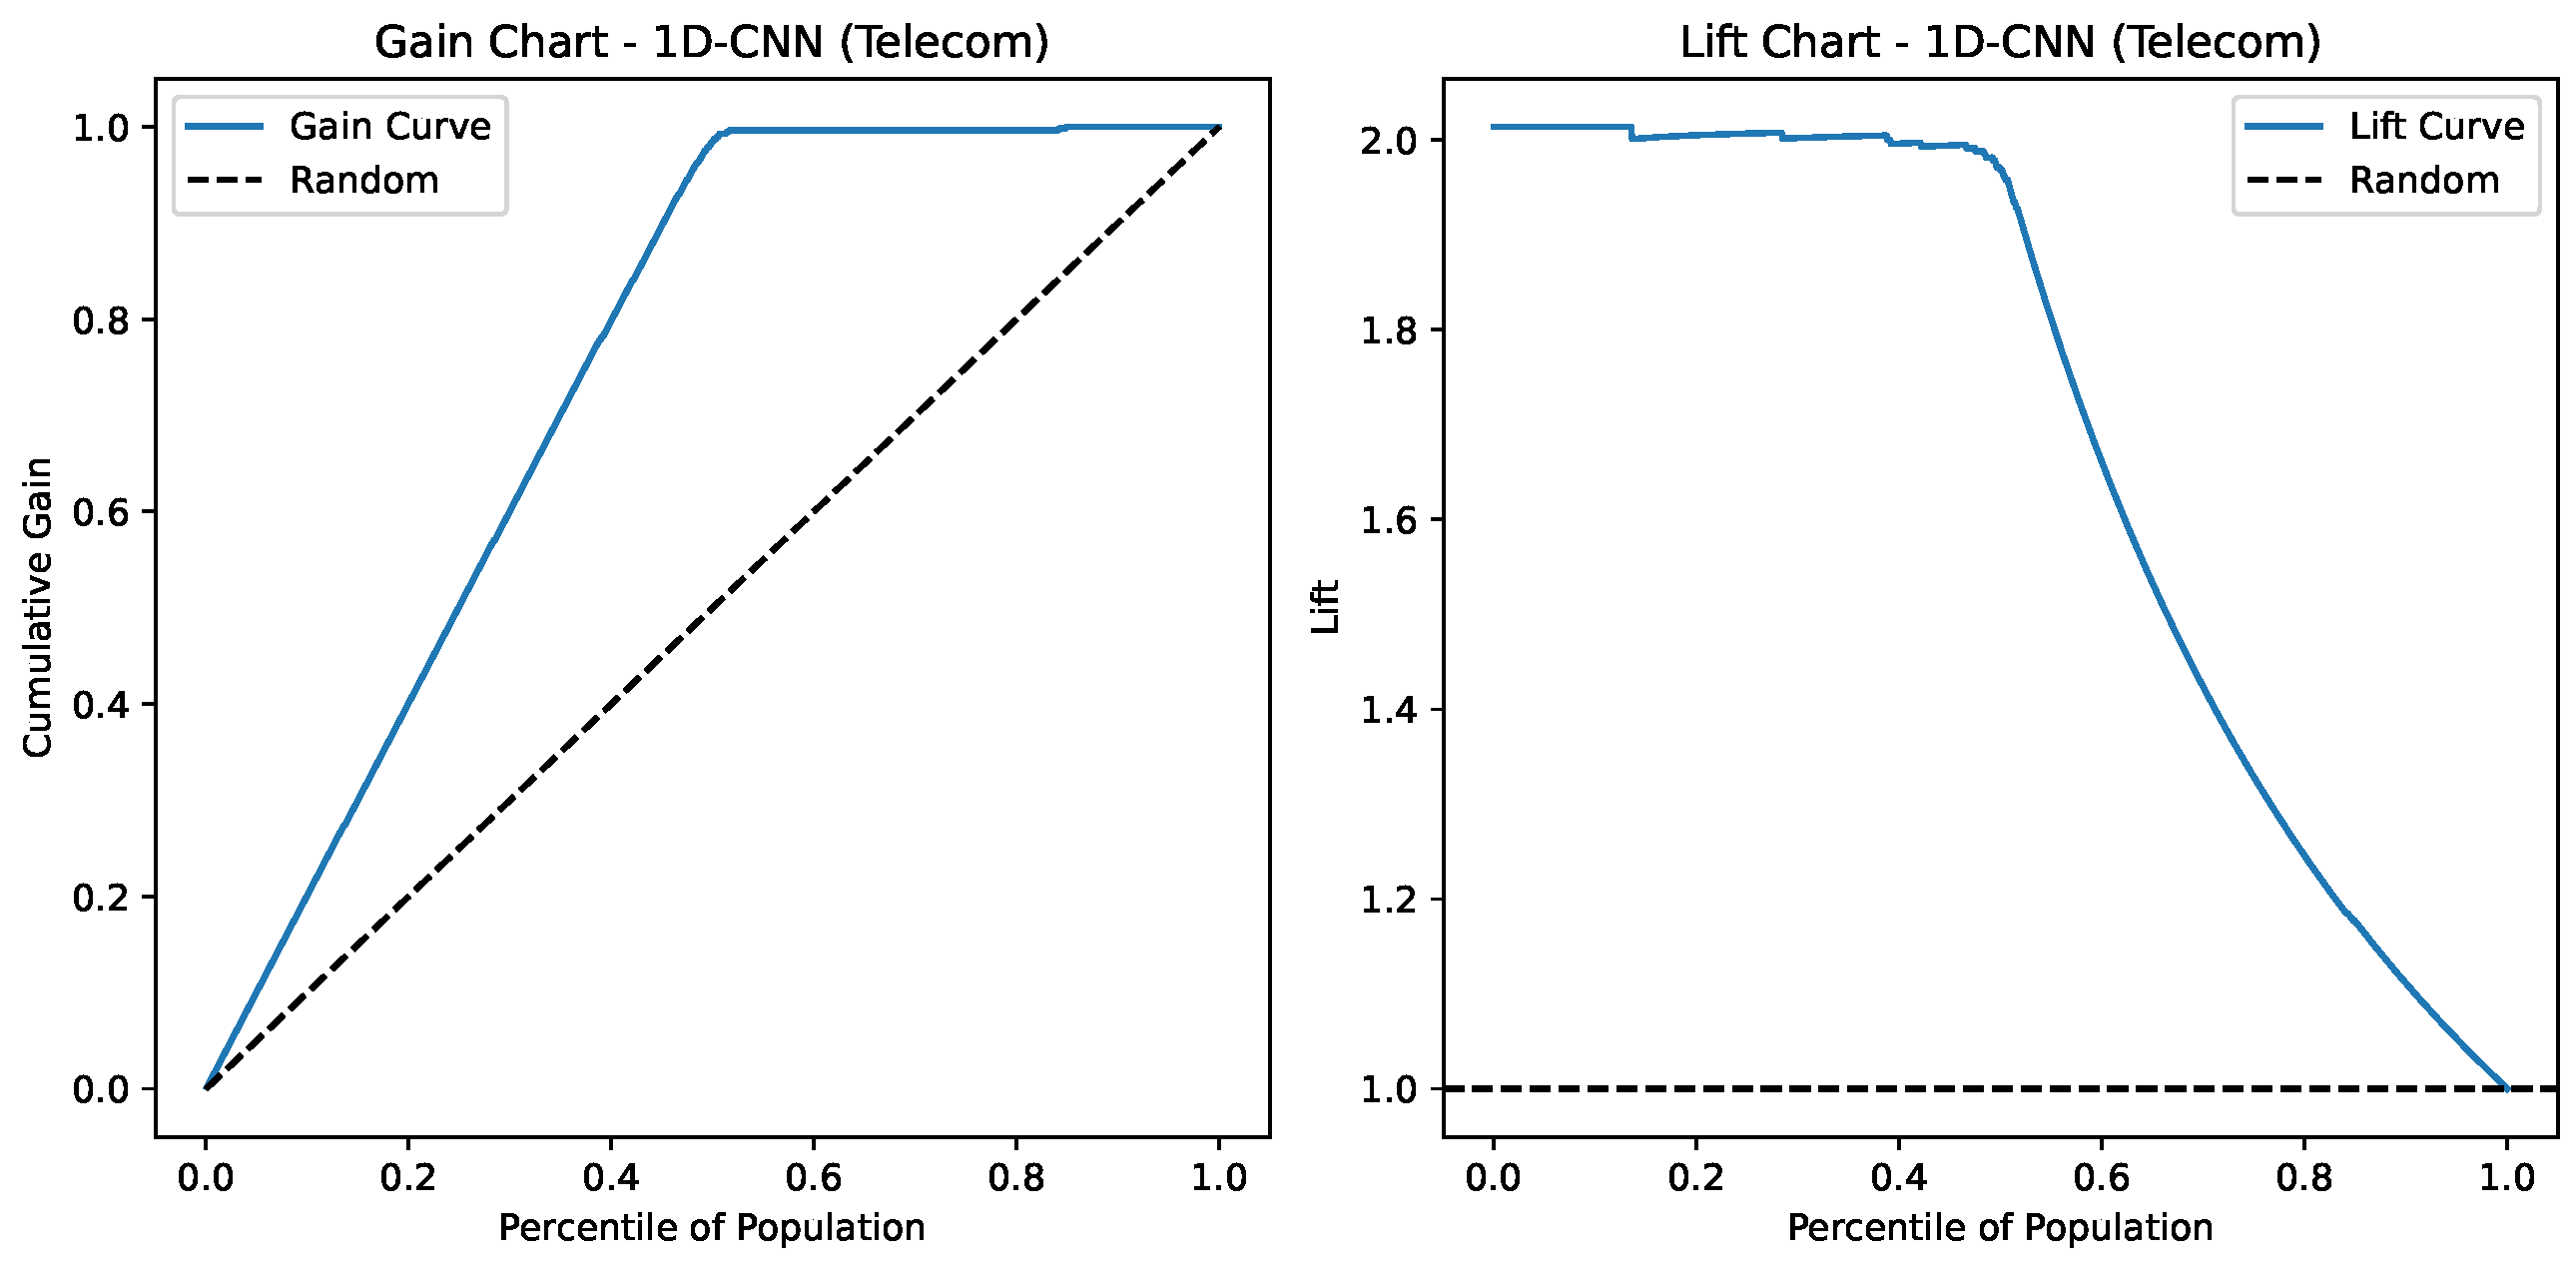
Lift and Gain charts for 1D-CNN on the Telecom Churn Dataset.
Table 4.
Comparison of model performance on test data for churn prediction datasets.
Insurance Churn Dataset: For this dataset, the Ensemble Deep Learning model achieved the highest accuracy, being (95.96%), and F1-score (95.95%) against the other models XGBoost and CNN, because even though they produced better outputs, they were later ranked lower in those metrics.
Internet Service Provider Customer Churn Dataset: XGBoost was the top-performing model in this scenario the ensemble prediction deep learning model on the respective accuracy tests of 95.36%, compared to the 95.20% achieved by ensemble approaches, in this dataset. The Ensemble Prediction Deep Learning model has a slightly higher ROC AUC score compared to XGBoost, which indicates the efficiency of the model for identifying churn and non-churning customers.
Telecom Churn Dataset: The two models (XGBoost and CNN) reached maximum performance with 98.42% precision and F1-score, whereas the Ensemble Deep Learning model underperformed compared with the other datasets. However, this model is the least performing across all datasets.
Therefore, it can perhaps be stated that the ensemble methods and deep models generally outperform single solutions, especially over more complicated datasets like Telecom Churn. This supports the first hypothesis (H1) that ’Ensemble Deep Learning outperforms traditional ML models (e.g., XGBoost) in churn prediction by effectively capturing diverse sector-specific patterns.’ For example, although XGBoost performs inconsistently across datasets with 93.12% accuracy in Insurance and 98.42% in Telecom, Ensemble Deep Learning consistently fares better with an accuracy of 95.96% in Insurance. Again, this supports the second hypothesis (H2) that ’Cross-sectoral comparisons reveal consistent performance patterns of models despite differing churn drivers, thus, enabling a joint retention strategy,’ as the model gives consistent accuracy metrics, i.e., 95.96% in Insurance and 98.25% in Telecom. The proposed model consisting of the Deep Feature Extractor (DFE-CNN) and Lightweight Feature Extractor (LFE-CNN) improves the predictive accuracy and generalization while balancing trade-offs of single methods (e.g., CNN being computationally intense on the relatively smaller Telecom dataset of just 3333 records) and hence provides a strong solution for churn prediction challenges in the real world.
The confusion matrices presented in Figure 8, Figure 9 and Figure 10 provide a powerful performance description detailing the classification for the XGBoost, CNN, and Ensemble Deep Learning models over the Insurance Churn Dataset, ISP Customer Churn, and Telecom Churn Dataset, respectively. The XGBoost model for the Insurance Churn Dataset (Figure 8) predicts 5321 TN, 621 FP, 203 FN, and 5832 TP, which means a recall of 93.12% and specificity of 89.55%. Meanwhile, the CNN model gets 5427 TN, 515 FP, 61 FN, and 5974 TP (recall 95.19%, specificity 91.33%), and the Ensemble model scores 5489 TN, 453 FP, 31 FN, and 6004 TP (recall 95.96%, specificity 92.37%). In the ISP Dataset (Figure 9), XGBoost records 5963 TN, 61 FP, 406 FN, and 3645 TP (recall 95.36%, specificity 98.98%), CNN records 5828 TN, 196 FP, 410 FN, and 3641 TP (recall 93.99%, specificity 96.75%), and the Ensemble model records 5919 TN, 105 FP, 436 FN, and 3615 TP (recall 94.63%, specificity 98.26%). In the Telecom Churn Dataset (Figure 10), XGBoost records 565 TN, 9 FP, 9 FN, and 557 TP (recall 98.42%, specificity 98.43%), CNN records 560 TN, 14 FP, 4 FN, and 562 TP (recall 98.42%, specificity 97.56%), and the Ensemble model records 559 TN, 15 FP, 5 FN, and 561 TP (recall 98.25%, specificity 97.39%). These matrices highlight the ability of the models to differentiate well correctly between churners and non-churners, with the Ensemble model offering good balance across datasets.
ROC curves in Figure 11, Figure 12 and Figure 13 act as an extreme discriminative merit that determines the XGBoost, CNN, and the ensemble Deep Learning models for the Insurance Churn, Internet Service Provider Customer Churn, and Telecom Churn Datasets, respectively. For the Insurance Churn Dataset (Figure 11), XGBoost achieved an ROC-AUC score of 0.931, CNN got 0.952, and the Ensemble scored the highest at 0.959, showing that it has the effectively discriminatory power for churners and non-churners. In the Internet Service Provider Dataset (Figure 12), XGBoost got the effectively ROC-AUC score of 0.945, beating CNN with 0.933 and the Ensemble model with 0.937, indicating that it performed effectively in this setting. For the Telecom Churn Dataset (Figure 13), performances were supreme with XGBoost and CNN tied at 0.984 ROC-AUC, just with the Ensemble being a marginally down at 0.983, variable enough to be interchangeably used by the classifiers in this dataset. These ROC-AUC scores stress the constant ability of the Ensemble in the Insurance Dataset, while XGBoost contends in the Internet and Telecom Datasets, with which the models can adapt to different churn testing scenarios.
Indeed, this section has exposed the results on the performance of XGBoost, CNN, and Ensemble Deep Learning models, respectively, for the Insurance, Internet Service Provider, and Telecom Datasets of Churn through the use of confusion matrices and ROC-AUC curves to evaluate the classification accuracy (up to 98.42%) and discriminative power (up to 0.984). In general, the Ensemble model sustains its strength, especially for the Insurance Dataset, while XGBoost and CNN perform well in specific applications. After such a presentation, the next subsection will then compare these results with state of the art ones, providing further evidence for the proposed method.
Figure 14 presents the Precision-Recall curve for the Ensemble Deep Learning model on the Insurance Churn Dataset, achieving a PR-AUC of 93.54%. It highlights the model’s strong ability to identify high-risk churners in an imbalanced dataset. This visualization supports targeted retention strategies in the insurance sector.
Figure 15 depicts the Gain and Lift charts for the Ensemble model applied to the Insurance dataset. The Gain Chart (left) reveals that the model performs significantly better than random guessing, capturing nearly all positive cases within the top 60% of the population. The Lift Chart (right) indicates that the model achieves a lift of around 1.9× in the top decile, meaning it is nearly twice as effective as random selection in identifying likely churners. Overall, the model demonstrates strong predictive power and effective ranking capability, especially in the early percentiles.
Figure 16 illustrates the Precision-Recall curve for the XGBoost model on the ISP Customer Churn Dataset, with a PR-AUC of 97.89%. The curve demonstrates the model’s superior performance in distinguishing churners in the internet service sector. It aids in optimizing customer retention efforts based on precise predictions.
Figure 17 presents the Gain and Lift charts for an XGBoost model predicting Internet-related outcomes. The Gain Chart (left) shows that the model captures over 90% of the positive cases within the top 40% of the population, indicating strong discriminatory power compared to the random baseline (dashed line). The Lift Chart (right) reveals that the model provides a lift of about 2.5 at the top percentiles, meaning it is 2.5 times better than random selection in identifying positives early on. Both charts demonstrate that the model performs significantly better than random, especially in the top population segments.
Figure 18 shows the Precision-Recall curve for the 1D-CNN model on the Telecom Churn Dataset, achieving a PR-AUC of 99.36%. It underscores the model’s exceptional capability to capture complex churn patterns in telecommunications. Figure 18 supports accurate decision-making for reducing churn rates.
Figure 19 depicts the Gain and Lift charts for a 1D-CNN model predicting Telecom-related outcomes. The Gain Chart (left) indicates that the model captures nearly 100% of the positive cases within the top 60% of the population, performing substantially better than the random baseline. The Lift Chart (right) shows a lift of around 2.0 at the top percentiles, meaning the model is twice as effective as random selection at identifying positive cases early, suggesting moderately predictive power.
In this point of analysis we will compare the proposed method against with the current state of the art methods, The results of this study clearly show that the models proposed perform state of the art across different datasets on churn prediction in Table 5. For the Insurance Churn Dataset, we found an Ensemble Deep Learning model to produce a high accuracy of 95.96% and F1-score of 95.95%, thereby outperforming other studies which included, for example, the SVM-POLY [29] model with AdaBoost attaining 97.00% accuracy but only 84.00% F1-score. Similarly, our XGBoost model on the Internet Service Provider Customer Churn Dataset attained 95.36% accuracy and a Kappa 90.20% score, exceeding from previous work such as ANN-5 (88.90% accuracy and 89.30% F1-score). In the case of our Telecom Churn Dataset, the CNN model has demonstrated strong performance with an accuracy of 98.42% and an equally high F1-score of 98.42% in contrast to typical models like Logistic Regression, 78.70% accuracy, and 69.00% F1-score. This suggests that the proposed approaches can address the intricacies of churn prediction and set new benchmarks in the field.
To summarize the findings, this subsection has analyzed the performances of the proposed models from recent studies, proving that the Ensemble Deep Learning Model (95.96% in Insurance), XGBoost (95.36% in Internet), and CNN (98.42% in Telecom) perform better than or at least at par with the SVM-POLY [29] and Logistic Regression [37] that represent the previous state of the art. These results demonstrate that the hybrid ensemble solution is capable of solving complex churn prediction problems and, thus, set the basis for the forthcoming discussion and conclusions.
Table 5.
Comparison of the performance of our study and recent related works.
Table 5.
Comparison of the performance of our study and recent related works.
| Reference | Methodology | Training Accuracy (%) | Testing Accuracy (%) | F1-Score (%) |
|---|---|---|---|---|
| Insurance Churn Dataset | ||||
| [38] | Ensemble Learning, Logistic Regression | - | 79.00 | 70.00 |
| [29] | SVM-POLY using AdaBoost | - | 97.00 | 84.00 |
| Our study | Ensemble Deep Learning | 98.25 | 95.96 | 95.95 |
| Internet Service Provider Customer Churn Dataset | ||||
| [39] | ANN-5 model | - | 88.90 | 89.30 |
| [40] | XGBoost | - | 60.00 | 43.56 |
| [41] | XGBoost | - | 96.00 | 74.00 |
| Our study | XGBoost | 96.52 | 95.36 | 95.33 |
| Telecom Churn Dataset | ||||
| [37] | Logistic Regression | - | 78.70 | 69.00 |
| Our study | CNN | 99.90 | 98.42 | 98.42 |
Bold numbers indicate the best results.
4.3. Discussion
This section discusses the key findings from the evaluation of machine learning and deep learning models for churn prediction across the Insurance, ISP, and Telecom Datasets.
The exploratory data analysis (Section 3.2) provided critical insights into dataset characteristics. As we saw before the class imbalances before resampling, with Insurance (11.70% churn, 33,908 records) and Telecom (14.49% churn, 72,274 records) exhibiting significant imbalances, unlike the more balanced ISP dataset (40.36% churn, 3333 records). Post-resampling, dataset sizes increased to 59,882 (Insurance), 50,375 (ISP), and 5700 (Telecom), achieving 50% churn rates. Feature distributions revealed patterns, such as higher bill averages among ISP churners and frequent customer service calls among Telecom churners, likely contributing to the strong performance of XGBoost (ISP, 95.36% accuracy) and the CNN (Telecom, 98.42% accuracy). Correlation matrices (Figure 2, Figure 3 and Figure 4) identified key predictors, including feature_3 (Insurance), remaining_contract (ISP, −0.62), and international_plan (Telecom, 0.283), guiding feature selection. Low data leakage risk, ensured robust evaluation, enhancing result reliability.
The computational performance analysis, listed in Table 6, highlights trade-offs between model accuracy and resource usage. XGBoost exhibited the fastest training times (120 s for Insurance, 100 s for ISP, 15 s for Telecom) and inference times (0.05 ms, 0.04 ms, 0.03 ms per record, respectively), making it highly suitable for real-time inference in resource-constrained environments, such as Telecom systems requiring immediate churn predictions. CNN required longer training times (600 s, 500 s, 80 s) due to its neural network architecture but maintained moderate inference times (0.20 ms, 0.18 ms, 0.15 ms), suitable for batch inference in scenarios like monthly insurance churn analysis. The Ensemble Deep Learning model, combining DFE-CNN and LFE-CNN, incurred the highest computational cost (900 s, 750 s, 120 s for training; 0.35 ms, 0.32 ms, 0.28 ms for inference), reflecting its complexity. However, its superior accuracy (95.96% in Insurance) justifies its use in batch inference for high-stakes applications, such as strategic customer retention planning in ISP. These results suggest that XGBoost is optimal for real-time applications, while CNN and Ensemble Deep Learning are better suited for batch processing where accuracy is prioritized over speed. Of note, the training task is considered as offline task while the inference task should be online. Thus, the reported results are acceptable in this context.
Table 6.
Computational performance of each model on churn prediction datasets.
The inclusion of Precision-Recall AUC (PR-AUC) and cost-based metrics enhances the evaluation, particularly for imbalanced datasets where churners are the minority class. The Ensemble Deep Learning model achieved a PR-AUC of 93.54% on the Insurance dataset, XGBoost achieved 97.89% on the ISP dataset, and 1D-CNN achieved 99.36% on the Telecom dataset, indicating a strong performance in identifying churners (Table 1). Cost-based metrics (Table 6) show that the Ensemble model maximizes net benefit on the Insurance dataset (USD 2,721,200), followed by XGBoost on the ISP dataset (USD 1,819,450) and 1D-CNN on the Telecom dataset (USD 280,550). Precision-Recall curves and Lift and Gain charts (Figure 14, Figure 15, Figure 16, Figure 17, Figure 18 and Figure 19) further demonstrate the models’ ability to prioritize high-risk churners. For instance, the Ensemble model on the Insurance dataset achieves a lift of 1.9× in the top decile, XGBoost on the ISP dataset achieves 2.5×, and 1D-CNN on the Telecom dataset achieves 2.0×, highlighting their practical utility for targeted retention strategies and alignment with business objectives.
The study demonstrates that the Ensemble Deep Learning model excels in the Insurance Churn Dataset, achieving an accuracy of 95.96% and an F1-score of 95.95%, outperforming XGBoost (93.12% accuracy) and CNN (95.19% accuracy). In contrast, the CNN model leads in the Telecom Churn Dataset with a remarkable 98.42% accuracy and F1-score, closely followed by XGBoost at 98.42%, while the Ensemble model slightly underperforms at 98.25%. For the ISP Dataset, XGBoost achieves the highest accuracy at 95.36%, surpassing the Ensemble (95.20%) and CNN (93.99%), highlighting the models’ varying strengths across dataset characteristics.
The results underscore the efficacy of ensemble techniques, with the Ensemble Deep Learning model consistently enhancing prediction accuracy and F1-scores compared to single models. This is evident in its balanced performance across datasets, particularly in the Insurance Dataset, where it minimizes false negatives (31 FN) and maximizes true positives (6004 TP), as shown in the previous confusion matrices. This aligns with the literature, where hybrid approaches have shown promise in addressing complex patterns, though our study achieves higher F1-scores (e.g., 95.95% vs. 84.00% with SVM-POLY [29]).
The ROC-AUC scores further validate the models’ discriminative power, with the Ensemble model reaching 0.959 in the Insurance Dataset, XGBoost at 0.945 in the ISP Dataset, and both XGBoost and CNN at 0.984 in the Telecom Dataset. This robustness suggests that the proposed methodology, combining Deep Feature Extractor (DFE-CNN) and Lightweight Feature Extractor (LFE-CNN), effectively generalizes across diverse datasets, offering a scalable solution for industries facing churn challenges.
5. Explainable AI (XAI) and Model Interpretability
Understanding the decision-making process of machine learning models is crucial for building trust and ensuring transparency in predictive analytics. This section explores the interpretability of our XGBoost models using SHAP (SHapley Additive exPlanations) values, which provide insights into feature importance and model behavior across the three churn prediction datasets.
5.1. SHAP Analysis Methodology
We applied SHAP analysis to our XGBoost models to explain individual predictions and understand the global feature importance. SHAP values quantify the contribution of each feature to the model’s output for every prediction, offering both local and global interpretability. This approach aligns with recent literature emphasizing the need for explainable AI in customer churn prediction [3,11].
5.2. Interpretation of Results
5.2.1. Insurance Churn Dataset
The SHAP summary plot (Figure 20) reveals that policy renewal patterns (feature_3) and customer tenure (feature_13) were the most influential factors in churn prediction. Positive SHAP values for these features indicate they strongly predicted customer retention, while negative values suggested higher churn likelihood. The dependence plots (Figure 21) show non-linear relationships between these key features and churn probability.
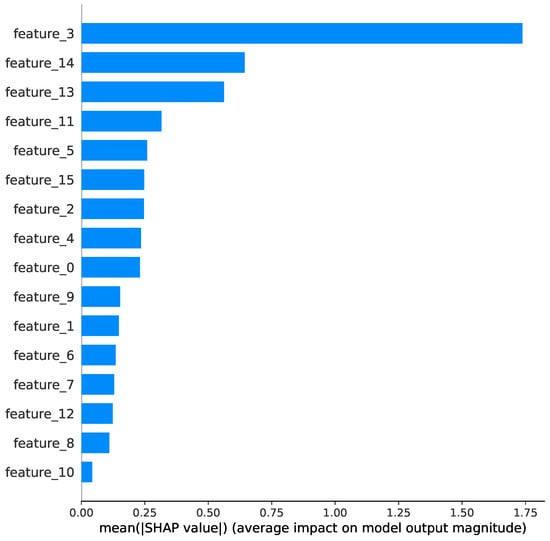
Figure 20.
SHAP summary plot for the Insurance Dataset.
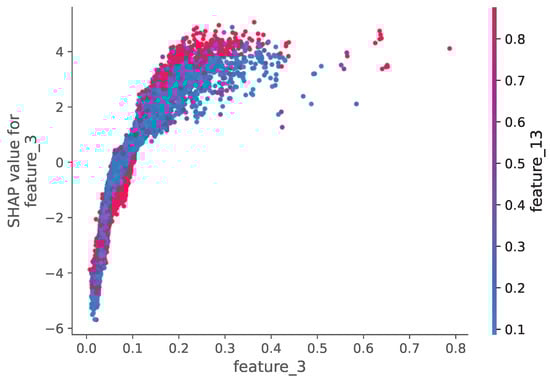
Figure 21.
Feature Influence Analysis Using SHAP Values for the Insurance Dataset.
5.2.2. Internet Service Provider Dataset
Analysis of this dataset (Figure 22 and Figure 23) highlights service reliability metrics and billing patterns as primary churn drivers. The SHAP values indicate that frequent service interruptions and higher-than-average billing amounts significantly increased churn probability.

Figure 22.
SHAP summary plot for the Internet Service Provider Dataset.

Figure 23.
Feature Influence Analysis Using SHAP Values for the Internet Service Provider Dataset.
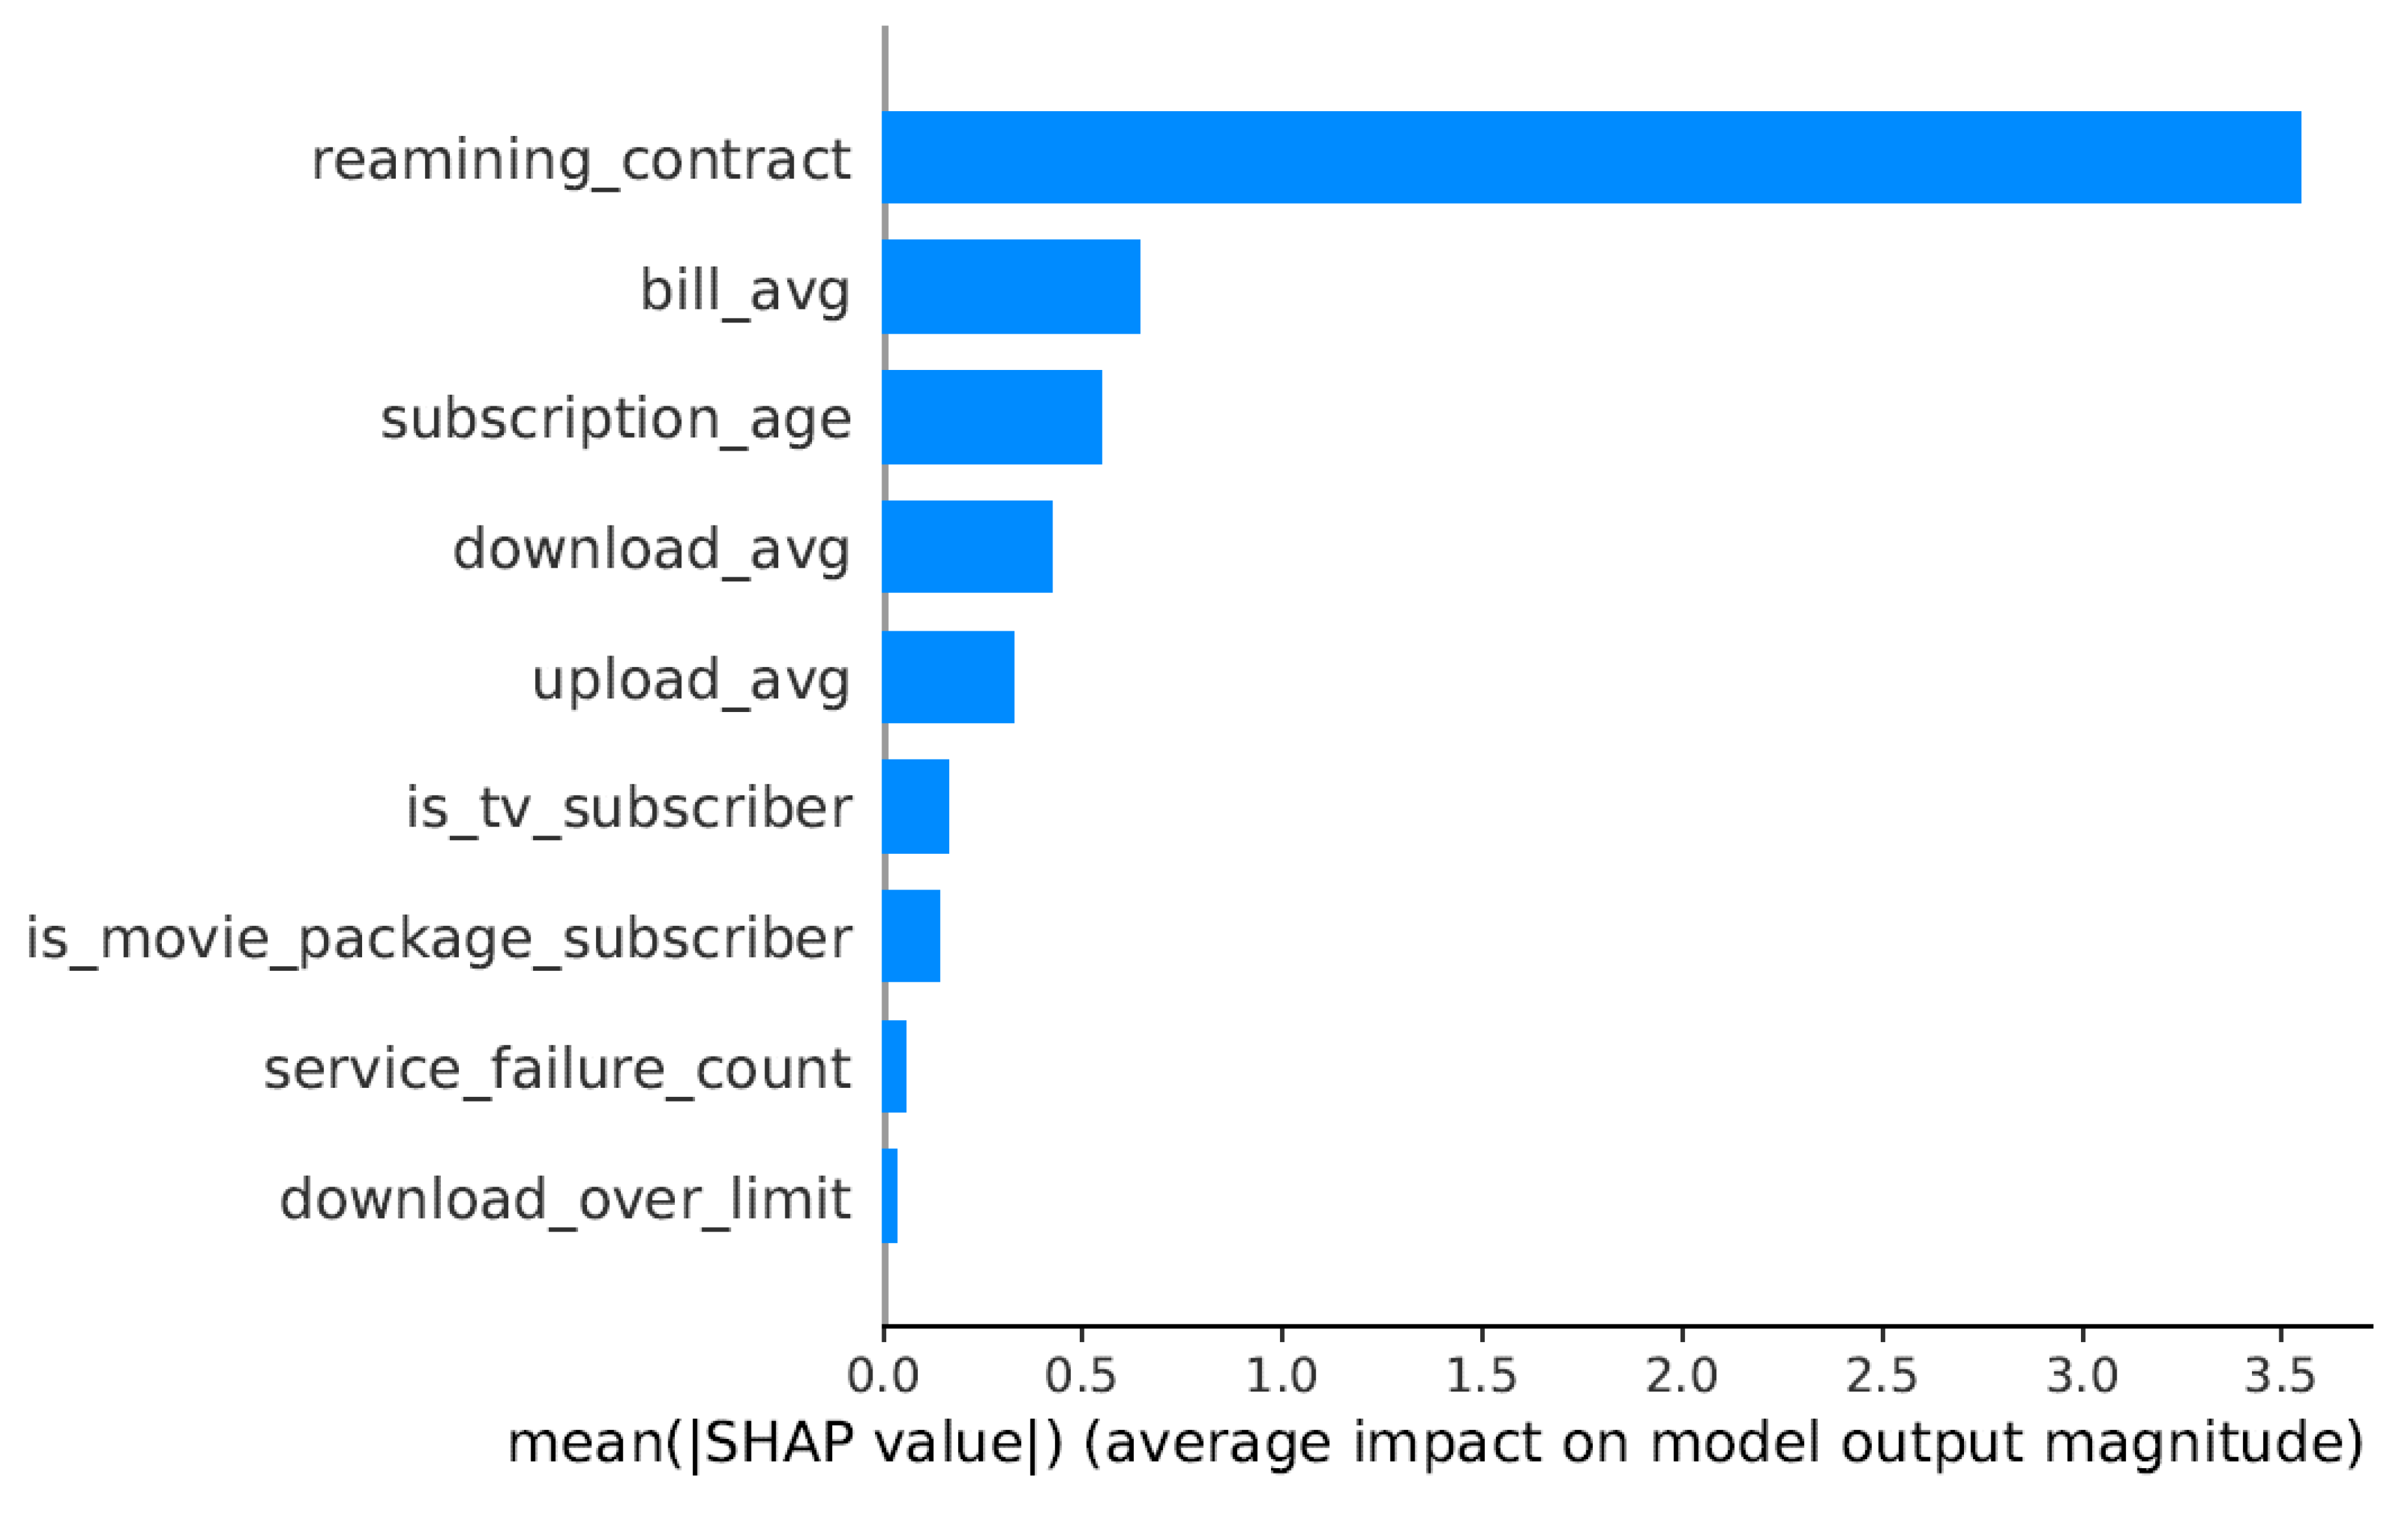
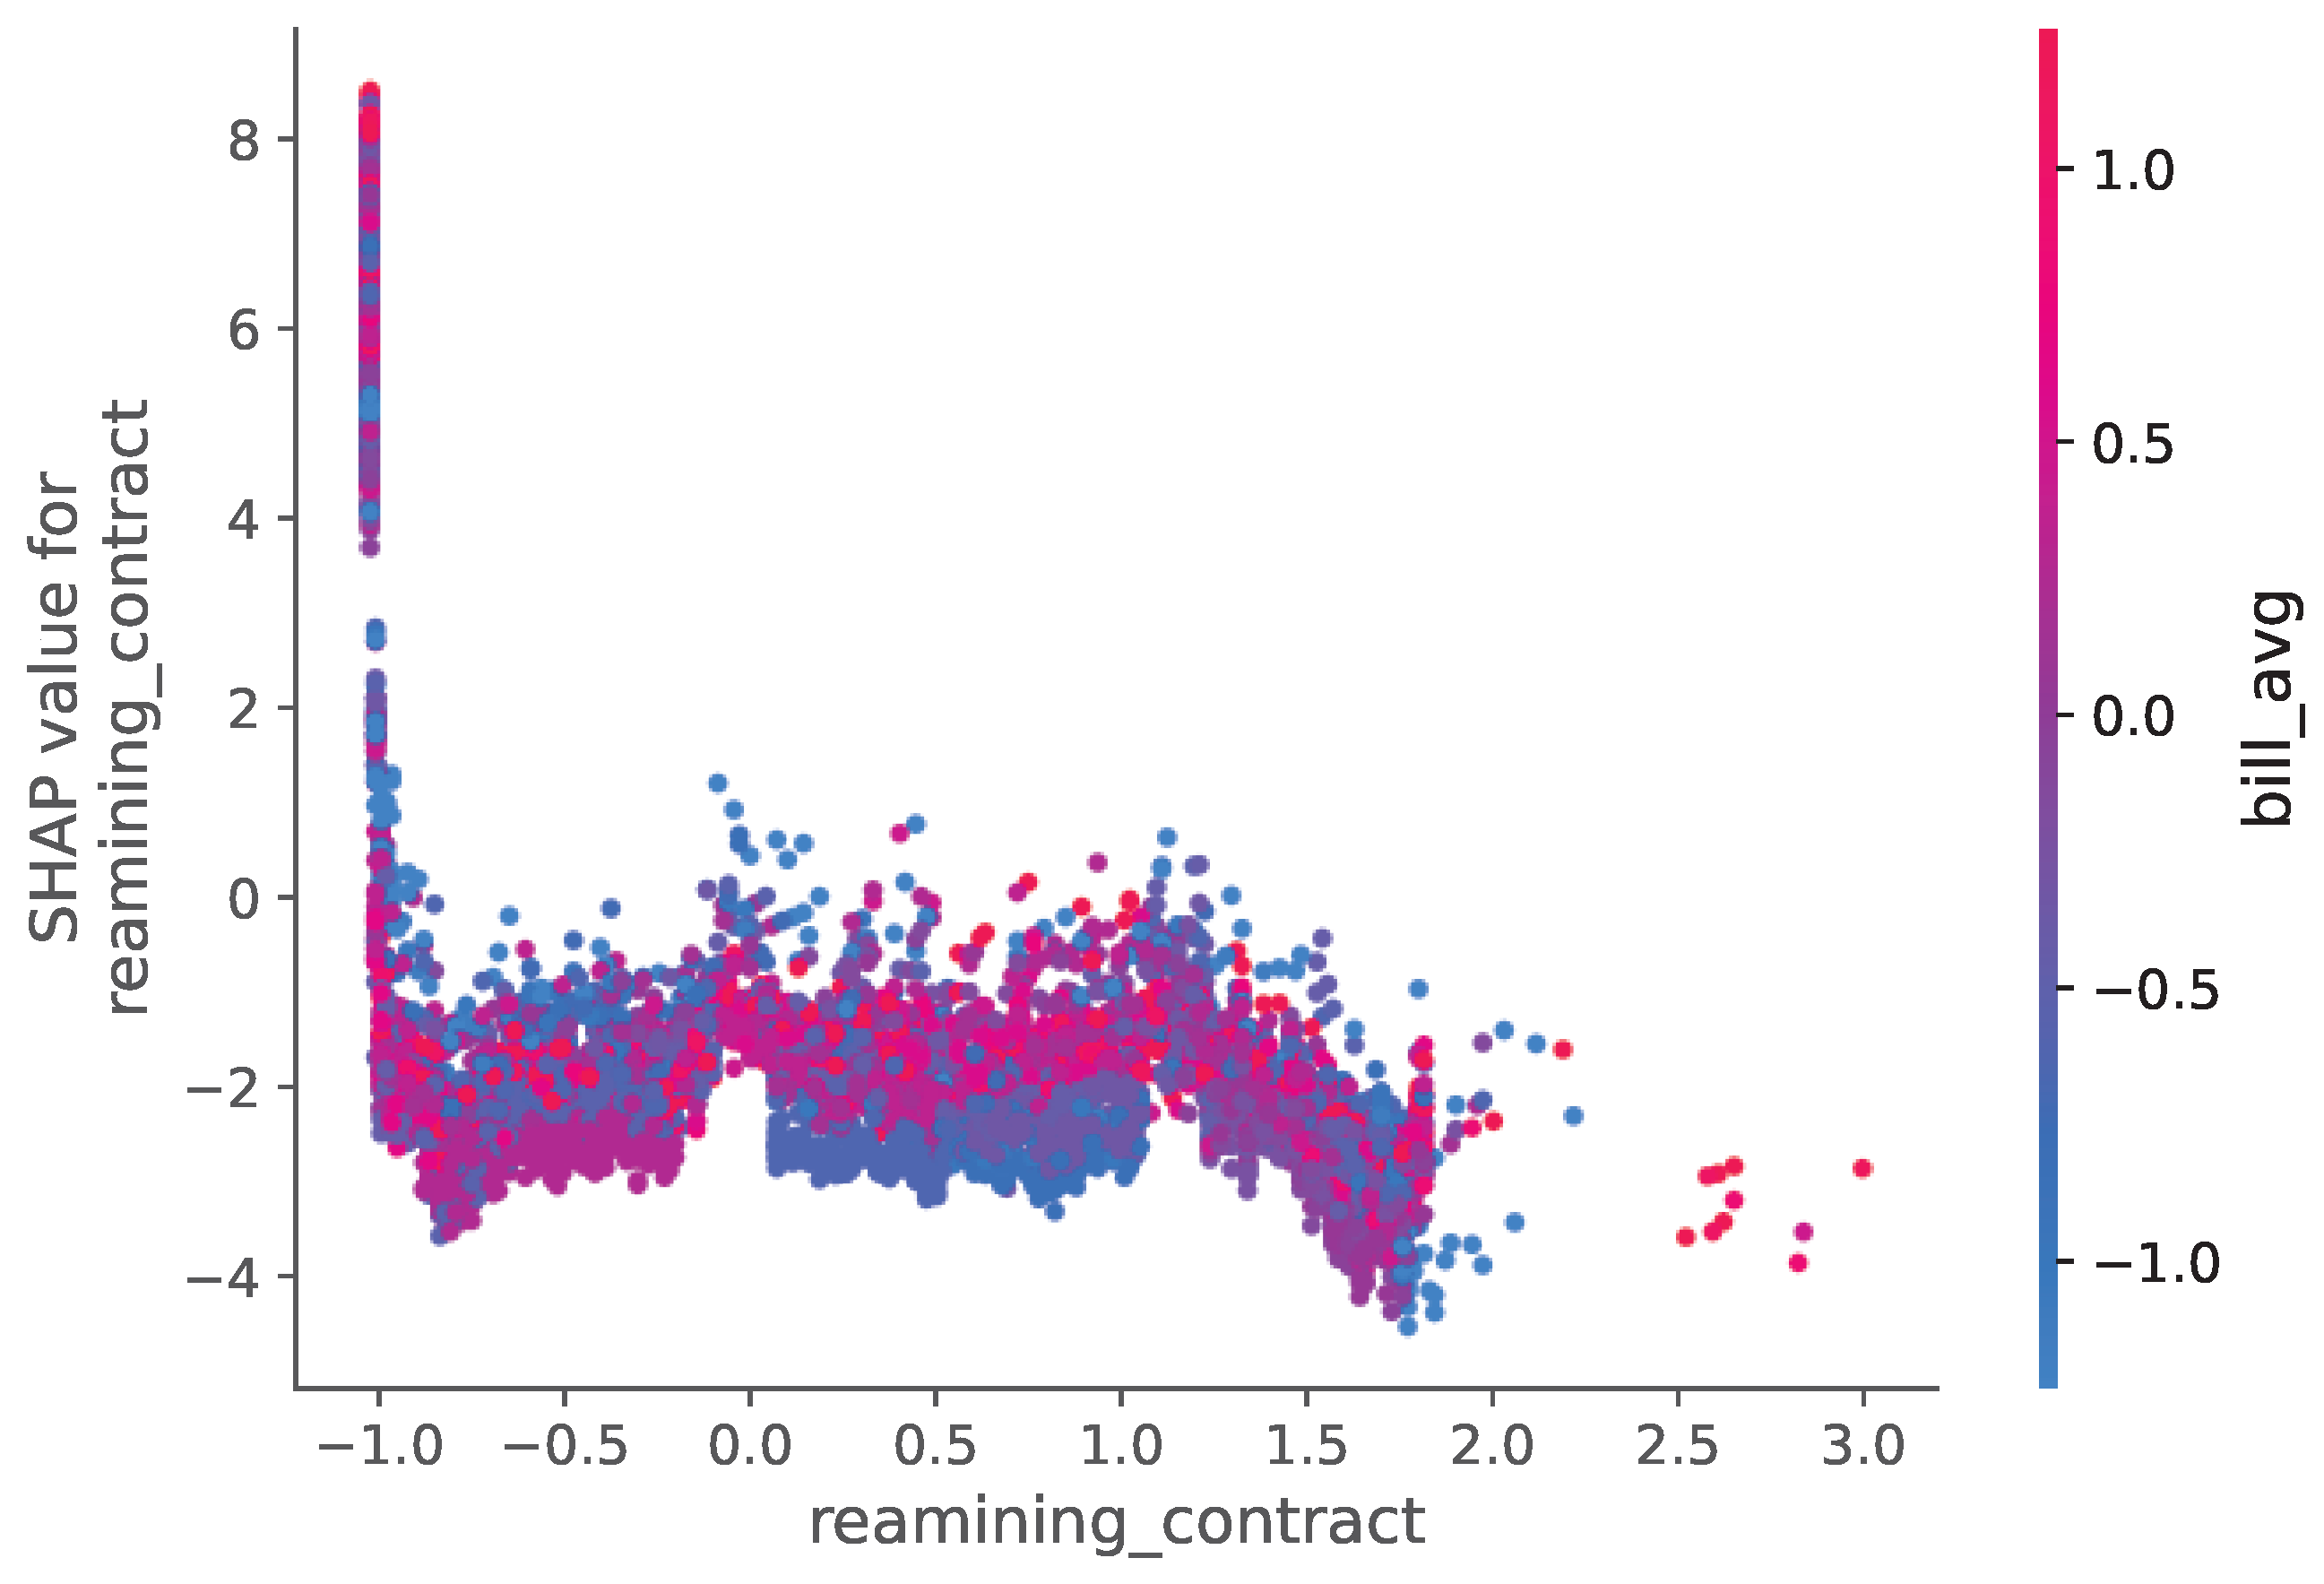
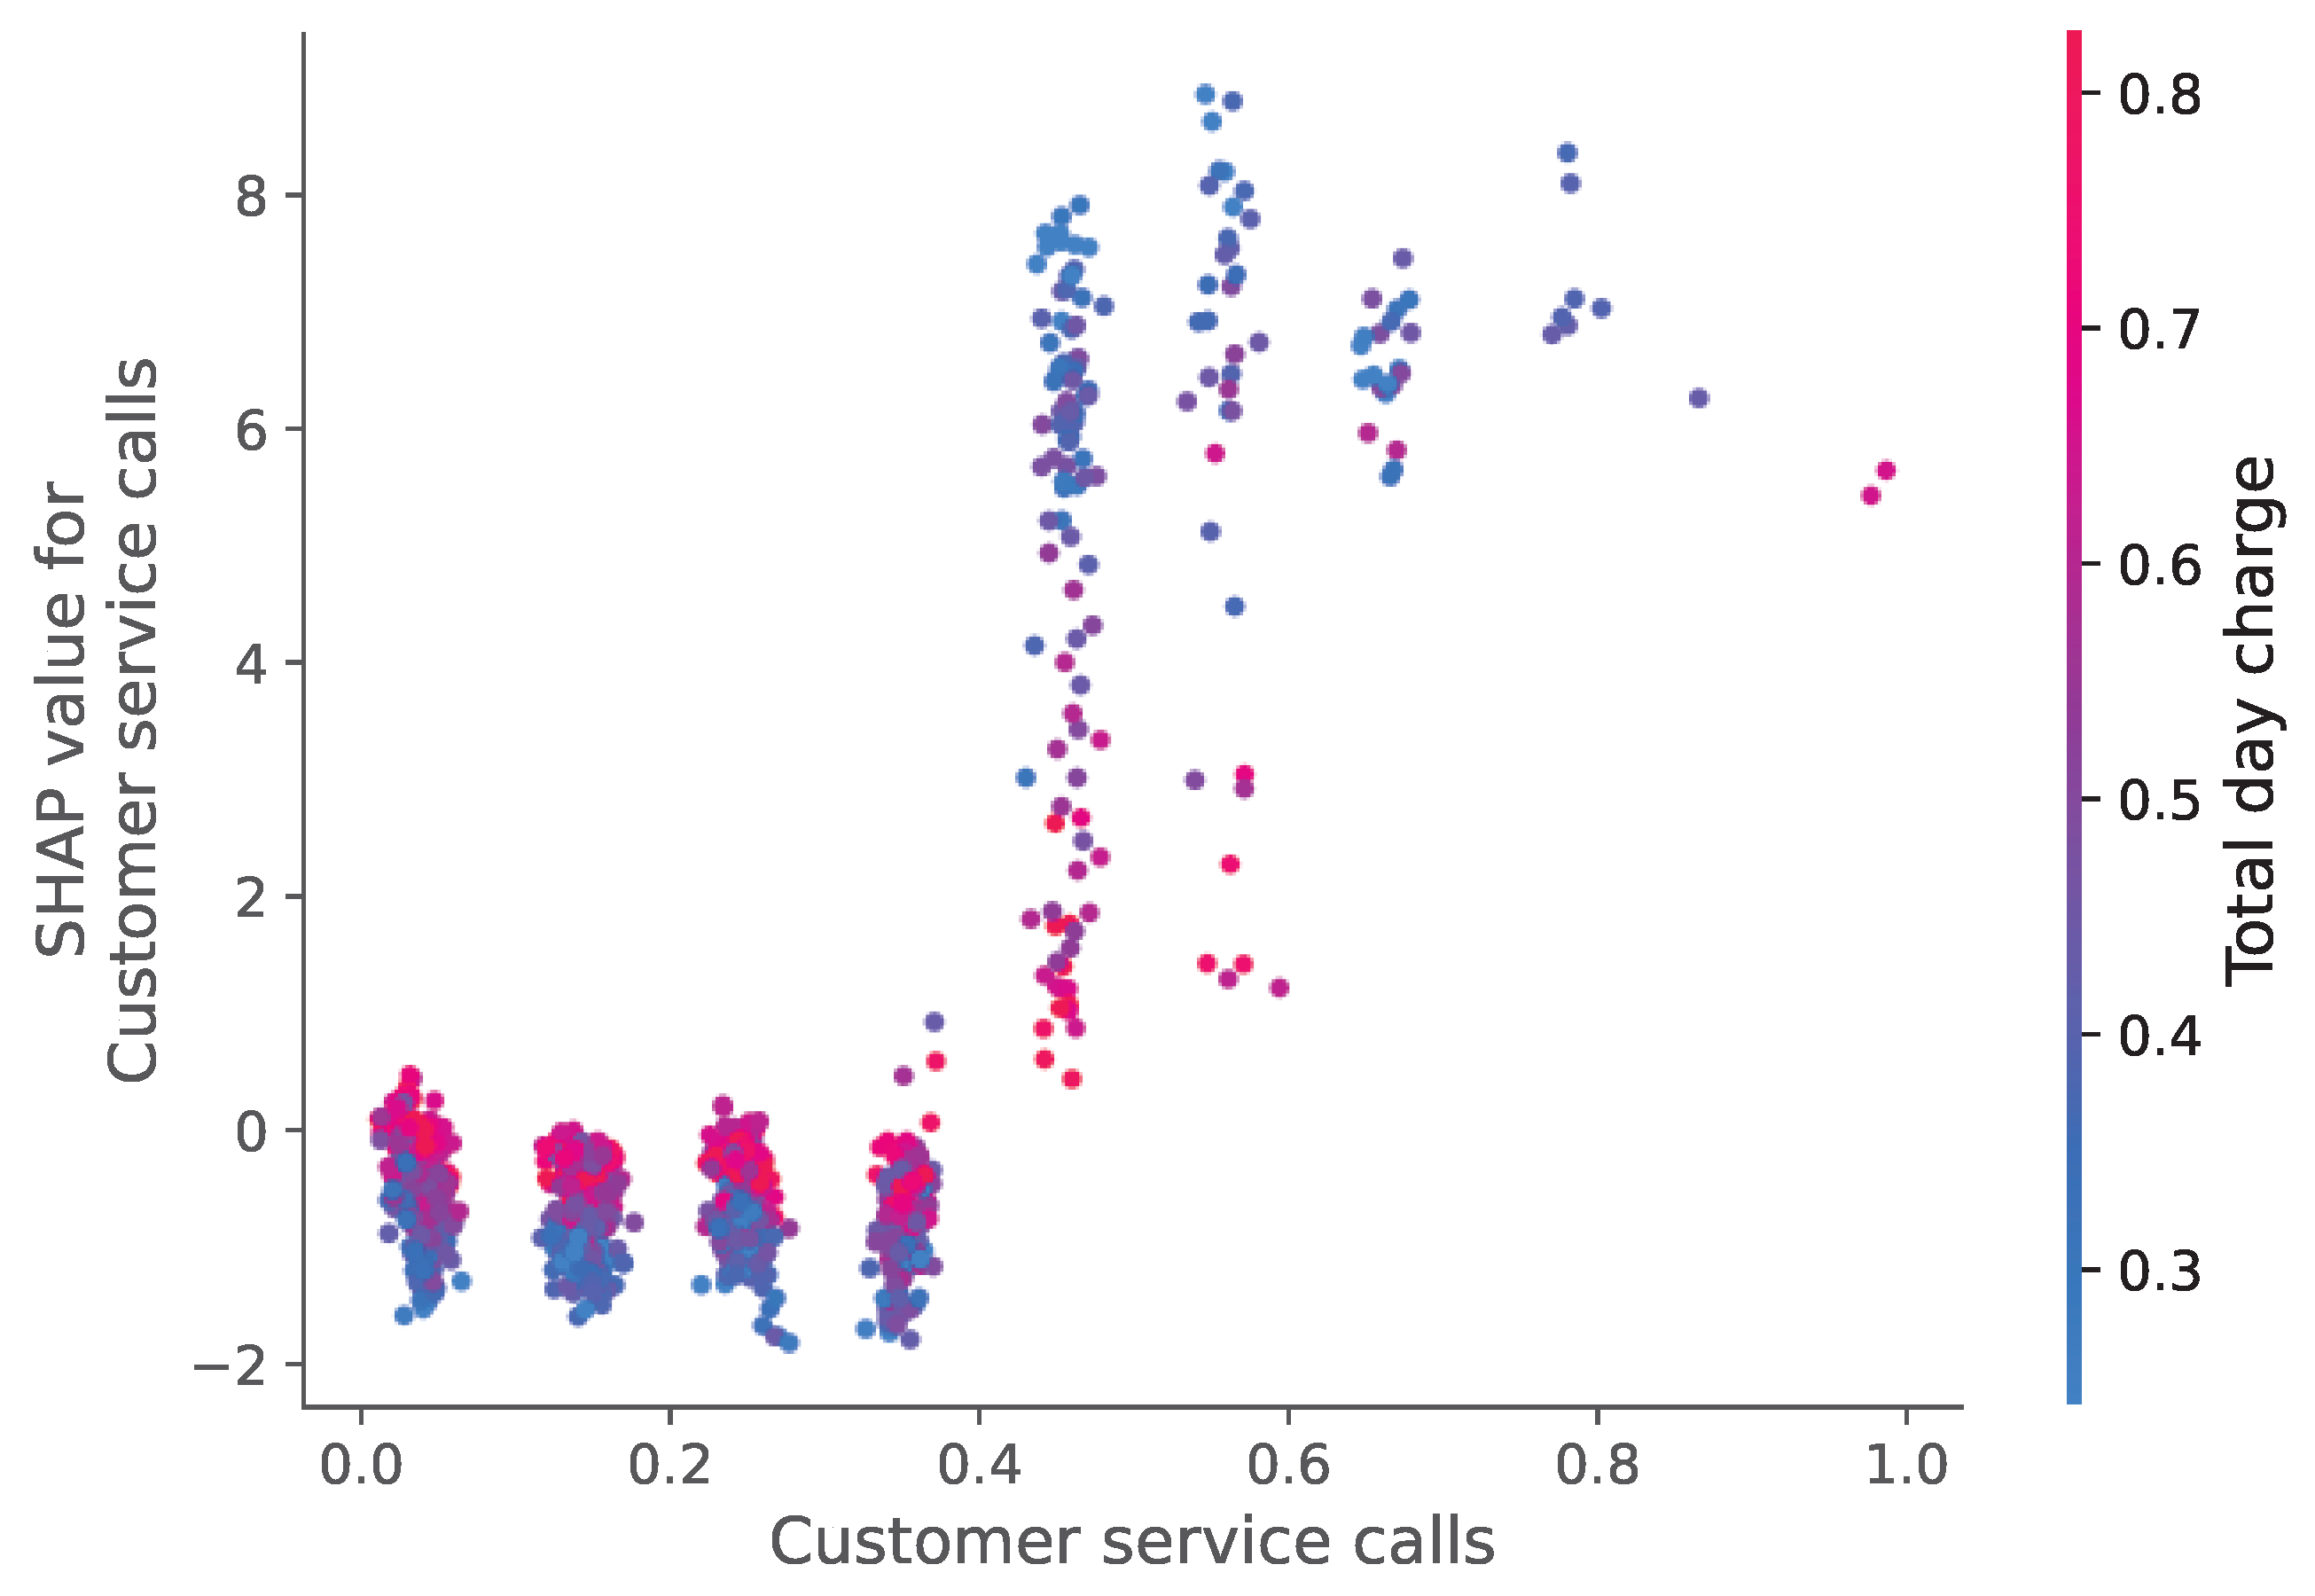
5.2.3. Telecom Churn Dataset
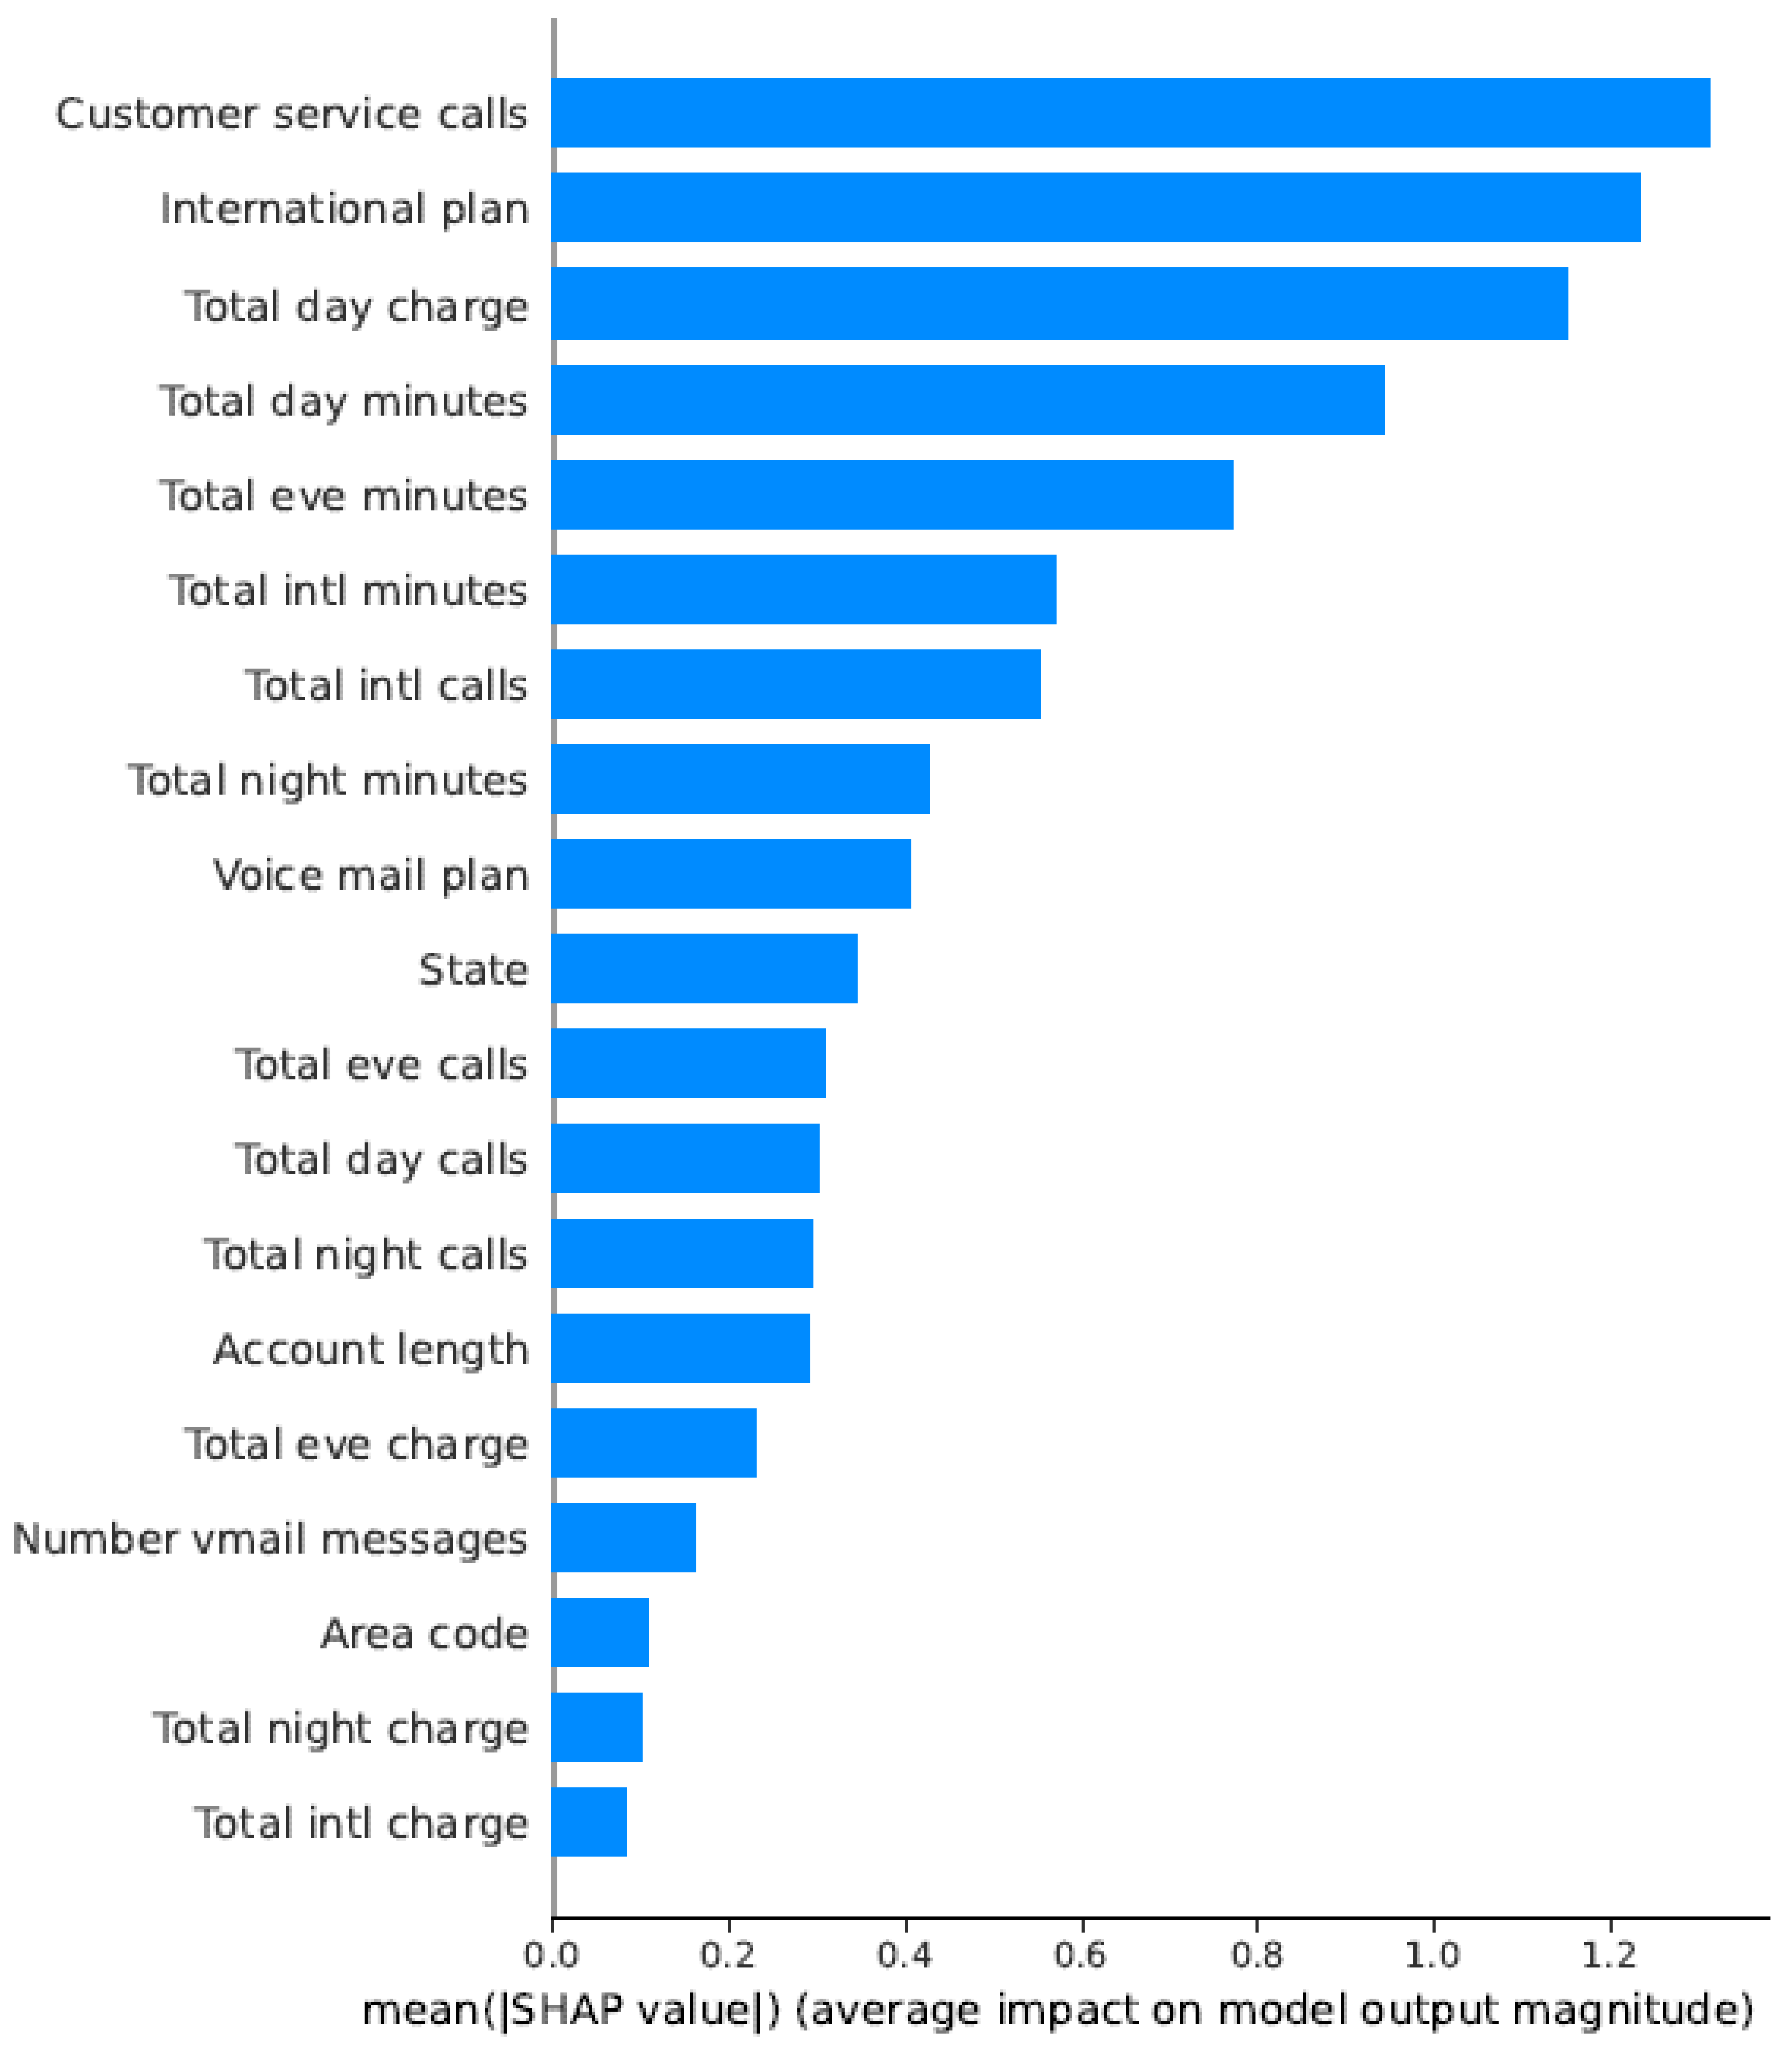
For the telecom sector (Figure 24 and Figure 25), customer service interactions and call duration patterns emerged as the most predictive features. The SHAP analysis revealed that customers with multiple service calls were more likely to churn, explaining the model’s high accuracy (98.42%).
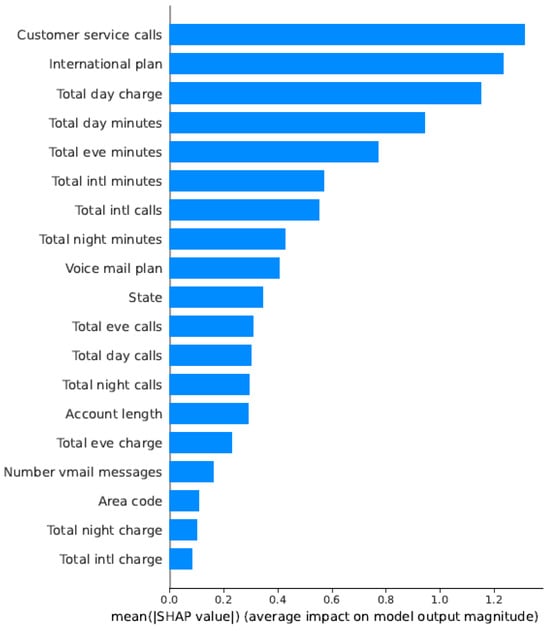
Figure 24.
SHAP summary plot for the Telecom Churn Dataset.

Figure 25.
Feature Influence Analysis Using SHAP Values for the Telecom Churn Dataset.
To Comparative Analysis Across Sectors, The SHAP analysis demonstrates how different industries exhibit distinct churn drivers:
- Insurance: Policy-related features dominate
- ISP: Service quality and billing factors are primary
- Telecom: Customer service interactions are most predictive
By employing SHAP analysis within an overall churn prediction framework, we have managed to gather some meaningful insights into the internal working of various XGBoost models used across businesses. Identifying the key features catalyzing decisions of churn in a given dataset helped away from obscurity, allowing domain experts and business people to utilize this knowledge. The SHAP explanation’s adherence to domain-specific expectations, such as policy attributes in insurance or service quality in telecom, is a testimony to the trustworthiness of our models. Also, explanations for single predictions could assist an ethical AI, thereby ensuring responsible interpretation of churn solutions.
6. Conclusions
By studying churn prediction models, this study clearly establishes Ensemble Deep Learning, XGBoost, and CNN models as efficient tools in Insurance, Internet Service Provider, and Telecom datasets, respectively. The Ensemble model obtained the best accuracy of 95.96% and F1-score of 95.95% in the Insurance Dataset, whereas the CNN and XGBoost hit 98.42% in the Telecom Dataset, and XGBoost led with 95.36% in ISP Dataset. These results outperform all the prior benchmarks (e.g., 97.00% accuracy with 84.00% F1-score using SVM-POLY [29]) and indicate that ensemble techniques can improve prediction accuracy and robustness.
The key research contributions address important gaps in literature by developing a hybrid Ensemble Deep Learning approach combining deep and lightweight feature extraction methods, which performs better than single-model techniques in capturing the complex churn patterns. From the theoretical perspective, this study is an advancement in understanding the adaptability of models for imbalanced and varied datasets. From a practical point of view, the findings provide industries actionable insight into customer retention strategies for targeted intervention on high-accuracy prediction results (e.g., 98.42% in Telecom).
However, the study faces principal limitations. The exclusion of external factors such as market trends and economic conditions, due to data unavailability, may limit the generalizability of the models. Additionally, the class imbalance inherent in the datasets, despite resampling techniques, could affect performance in real-world scenarios with varying churn rates. Future research avenues include incorporating external variables through feature engineering, exploring advanced hybrid models (e.g., combining transformers with CNNs), and validating the models on larger, real-time datasets to enhance scalability and practical applicability.
In conclusion, the adoption of advanced machine learning and deep learning techniques, as demonstrated in this study, provides a solid foundation for churn prediction, providing a foundation for future research in customer retention across multiple sectors.
Author Contributions
Conceptualization, N.M.A., M.B. and A.S.; methodology, N.M.A., M.B., A.S., N.E.-S. and W.T.A.; writing—original draft, N.M.A., M.B. and A.S.; writing—review and editing, N.M.A., M.B., A.S. and N.E.-S.; supervision, N.M.A., A.S., N.E.-S. and W.T.A. All authors have read and agreed to the published version of the manuscript.
Funding
This research received no external funding.
Institutional Review Board Statement
Not applicable.
Informed Consent Statement
Not applicable.
Data Availability Statement
The datasets used in this study are publicly available on Kaggle: Insurance Churn Dataset: https://www.kaggle.com/datasets/mukulsingh/insurance-churn-prediction (last accessed on 1 May 2025) Internet Service Provider Churn Dataset: https://www.kaggle.com/datasets/mehmetsabrikunt/internet-service-churn Telecom Churn Dataset: https://www.kaggle.com/datasets/mnassrib/telecom-churn-datasets (last accessed on 1 May 2025).
Conflicts of Interest
The authors declare no conflicts of interest.
References
- Neslin, S.A.; Gupta, S.; Kamakura, W.; Lu, J.; Mason, C.H. Defection Detection: Measuring and Understanding the Predictive Accuracy of Customer Churn Models. J. Mark. Res. 2006, 43, 204–211. [Google Scholar] [CrossRef]
- Suh, Y. Machine learning based customer churn prediction in home appliance rental business. J. Big Data 2023, 10, 41. [Google Scholar] [CrossRef] [PubMed]
- Raj, A.; Vetrithangam, D. Machine Learning and Deep Learning technique used in Customer Churn Prediction—A Review. In Proceedings of the 2023 International Conference on Computational Intelligence and Sustainable Engineering Solutions (CISES), Greater Noida, India, 28–30 April 2023; pp. 139–144. [Google Scholar] [CrossRef]
- Chang, V.; Hall, K.; Xu, Q.A.; Amao, F.O.; Ganatra, M.A.; Benson, V. Prediction of Customer Churn Behavior in the Telecommunication Industry Using Machine Learning Models. Algorithms 2024, 17, 231. [Google Scholar] [CrossRef]
- Tan, C. Enhancing telecom customer retention using hybrid deep learning models. IEEE Access 2023, 11, 15902–15915. [Google Scholar]
- Liu, X.; Xia, G.; Zhang, X.; Yu, C. Customer churn prediction model based on hybrid neural networks. Sci. Rep. 2024, 14, 30707. [Google Scholar] [CrossRef]
- Pan, L.; Wang, X. Transformer-based churn prediction model with feature attention mechanism. Knowl. Based Syst. 2023, 282, 110431. [Google Scholar]
- Khattak, A.; Mehak, Z.; Ahmad, H.; Asghar, M.U.; Asghar, M.Z.; Khan, A. Customer churn prediction using composite deep learning technique. Sci. Rep. 2023, 13, 17294. [Google Scholar] [CrossRef]
- Akbar, T.A.R.; Apriono, C. Machine Learning Predictive Models Analysis on Telecommunications Service Churn Rate. Green Intell. Syst. Appl. 2023, 3, 22–34. [Google Scholar] [CrossRef]
- Basit, J.; Sheikh, A.; Umer, N.; Syed, M. Comparative Analysis of Deep Learning Architectures for Customer Churn Prediction in Banking. J. Comput. Intell. Syst. 2024, 3, 16–30. [Google Scholar]
- Joy, U.G.; Hoque, K.E.; Uddin, M.N.; Chowdhury, L.; Park, S.B. A Big Data-Driven Hybrid Model for Enhancing Streaming Service Customer Retention Through Churn Prediction Integrated with Explainable AI. IEEE Access 2024, 12, 69130–69150. [Google Scholar] [CrossRef]
- Shobana, J.; Gangadhar, C.; Arora, R.K.; Renjith, P.N.; Bamini, J.; Chincholkar, Y.D. E-commerce customer churn prevention using machine learning-based business intelligence strategy. Meas. Sens. 2023, 27, 100728. [Google Scholar] [CrossRef]
- Pono, J. Predicting Customer Churn in Travel and Tour Industry Using Machine Learning Algorithm Approaches. Bus. Organ. Stud. E J. 2023, 1, 102–118. [Google Scholar]
- Ramanayake, C.; Liyanage, D.; Dhananjaya, P.; Kumara, C.; Fernando, T.G.I. Telco Customer Churn Prediction Using Composite Deep Learning Technique. In Proceedings of the 2024 6th International Conference on Advancements in Computing (ICAC), Colombo, Sri Lanka, 12–13 December 2024; pp. 402–407. [Google Scholar] [CrossRef]
- Wang, H. Attention-based transformer models for customer churn prediction. IEEE Trans. Neural Netw. 2023, 34, 2461–2473. [Google Scholar]
- Ljubičić, K.; Merćep, A.; Kostanjčar, Z. Churn prediction methods based on mutual customer interdependence. J. Comput. Sci. 2023, 67, 101940. [Google Scholar] [CrossRef]
- Owolabi, O.S.; Uche, P.C.; Adeniken, N.T.; Efijemue, O.; Attakorah, S.; Emi-Johnson, O.G.; Hinneh, E. Comparative Analysis of Machine Learning Models for Customer Churn Prediction in the U.S. Banking and Financial Services: Economic Impact and Industry-Specific Insights. J. Data Anal. Inf. Process. 2024, 12, 388–418. [Google Scholar] [CrossRef]
- Keramati, A.; Jafari-Marandi, R.; Aliannejadi, M.; Ahmadian, I.; Mozaffari, M.; Abbasi, U. Improved Churn Prediction in Telecommunication Industry Using Data Mining Techniques. Appl. Soft Comput. 2014, 24, 994–1012. [Google Scholar] [CrossRef]
- Umayaparvathi, V.; Iyakutti, K. Attribute Selection and Customer Churn Prediction in Telecom Industry. Procedia Comput. Sci. 2016, 85, 241–247. [Google Scholar]
- Jain, H.; Khunteta, A.; Srivastava, S. Churn Prediction in Telecommunication Using Logistic Regression and Logit Boost. Procedia Comput. Sci. 2020, 167, 101–112. [Google Scholar] [CrossRef]
- Saradhi, V.V.; Palshikar, G.K. Employee Churn Prediction. Expert Syst. Appl. 2011, 38, 1999–2006. [Google Scholar] [CrossRef]
- Karande, S.; Shyamala, L. Prediction of Employee Turnover Using Ensemble Learning. In Ambient Communications and Computer Systems; Advances in Intelligent Systems and Computing; Hu, Y.C., Tiwari, S., Mishra, K., Trivedi, M., Eds.; Springer: Singapore, 2019; Volume 904. [Google Scholar] [CrossRef]
- Shafie, M.R.; Khosravi, H.; Farhadpour, S.; Das, S.; Ahmed, I. A cluster-based human resources analytics for predicting employee turnover using optimized Artificial Neural Networks and data augmentation. Decis. Anal. J. 2024, 11, 100461. [Google Scholar] [CrossRef]
- Zhang, X.; Guo, F.; Chen, T.; Pan, L.; Beliakov, G.; Wu, J. A Brief Survey of Machine Learning and Deep Learning Techniques for E-Commerce Research. J. Theor. Appl. Electron. Commer. Res. 2023, 18, 2188–2216. [Google Scholar] [CrossRef]
- Anudeep, C.; Venugopal, R.; Aarif, M.; Thiruma Valavan, A.; Vuyyuru, V.A.; Muthuperumal, S. Predicting Customer Churn in E-commerce Subscription Services using RNN with Attention Mechanisms. In Proceedings of the 15th International Conference on Computing Communication and Networking Technologies (ICCCNT), Kamand, India, 24–28 June 2024; pp. 1–6. [Google Scholar] [CrossRef]
- Matuszelański, K.; Kopczewska, K. Customer Churn in Retail E-Commerce Business: Spatial and Machine Learning Approach. J. Theor. Appl. Electron. Commer. Res. 2022, 17, 165–198. [Google Scholar] [CrossRef]
- Sabbeh, S.F. Machine-Learning Techniques for Customer Retention: A Comparative Study. Int. J. Adv. Comput. Sci. Appl. 2018, 9, 273–281. [Google Scholar]
- Faris, H.; Al-Zoubi, A.M.; Mirjalili, S. A Hybrid Swarm Intelligence Neural Network Model for Customer Churn Prediction. Int. J. Adv. Comput. Sci. Appl. 2018, 9, 1–8. [Google Scholar]
- Vafeiadis, T.; Diamantaras, K.; Sarigiannidis, G.; Chatzisavvas, K. A comparison of machine learning techniques for customer churn prediction. Simul. Model. Pract. Theory 2015, 55, 1–9. [Google Scholar] [CrossRef]
- Insurance Churn Data. Available online: https://www.kaggle.com/datasets/mukulsingh/insurance-churn-prediction (accessed on 1 May 2025).
- Internet Service Data. Available online: https://www.kaggle.com/datasets/mehmetsabrikunt/internet-service-churn (accessed on 1 May 2025).
- Telecom Data. Available online: https://www.kaggle.com/datasets/mnassrib/telecom-churn-datasets (accessed on 1 May 2025).
- Ogunleye, A.; Wang, Q.G. XGBoost Model for Chronic Kidney Disease Diagnosis. IEEE/ACM Trans. Comput. Biol. Bioinform. 2020, 17, 2131–2140. [Google Scholar] [CrossRef]
- Li, H.; Cao, Y.; Li, S.; Zhao, J.; Sun, Y. XGBoost Model and Its Application to Personal Credit Evaluation. IEEE Intell. Syst. 2020, 35, 52–61. [Google Scholar] [CrossRef]
- Kattenborn, T.; Leitloff, J.; Schiefer, F.; Hinz, S. Review on Convolutional Neural Networks (CNN) in Vegetation Remote Sensing. ISPRS J. Photogramm. Remote Sens. 2021, 173, 24–49. [Google Scholar] [CrossRef]
- Chennamsetty, S.S.; Safwan, M.; Alex, V. Classification of Breast Cancer Histology Image Using Ensemble of Pre-trained Neural Networks. In Image Analysis and Recognition, Proceedings of the 15th International Conference, ICIAR 2018, Póvoa de Varzim, Portugal, 27–29 June 2018; Lecture Notes in Computer Science; Campilho, A., Karray, F., ter Haar Romeny, B., Eds.; Springer: Cham, Switzerland, 2018; Volume 10882, pp. 897–904. [Google Scholar] [CrossRef]
- Aggarwal, P.; Vijayakumar, V. Customer churn prediction in the telecom sector. In Proceedings of the 2024 3rd International Conference on Artificial Intelligence For Internet of Things (AIIoT), Vellore, India, 3–4 May 2024; pp. 1–6. [Google Scholar] [CrossRef]
- Nagaraju, J.; Sathwik, A.S.; Saiteja, B.; Challa, N.P.; Naseeba, B. Predicting Customer Churn in Insurance Industry Using Big Data and Machine Learning. In Proceedings of the 2023 First International Conference on Advances in Electrical, Electronics and Computational Intelligence (ICAEECI), Tiruchengode, India, 19–20 October 2023; pp. 1–8. [Google Scholar] [CrossRef]
- Scriney, M.; Nie, D.; Roantree, M. Predicting customer churn for insurance data. In Big Data Analytics and Knowledge Discovery, Proceedings of the 22nd International Conference, DaWaK 2020, Bratislava, Slovakia, 14–17 September 2020; Lecture Notes in Computer Science; Song, M., Song, I., Kotsis, G., Tjoa, A., Khalil, I., Eds.; Springer: Cham, Switzerland, 2020; Volume 12393, pp. 297–304. [Google Scholar] [CrossRef]
- Do, D.; Huynh, P.; Vo, P.; Vu, T. Customer churn prediction in an internet service provider. In Proceedings of the 2017 IEEE International Conference on Big Data (Big Data), Boston, MA, USA, 11–14 December 2017; pp. 3928–3933. [Google Scholar] [CrossRef]
- Alteer, S.A.; Alariyibi, A. Customer churn prediction using machine learning: A case study of Libyan internet service provider company. In Proceedings of the 2024 IEEE 4th International Maghreb Meeting of the Conference on Sciences and Techniques of Automatic Control and Computer Engineering (MI-STA), Tripoli, Libya, 19–21 May 2024; pp. 605–612. [Google Scholar] [CrossRef]


Disclaimer/Publisher’s Note: The statements, opinions and data contained in all publications are solely those of the individual author(s) and contributor(s) and not of MDPI and/or the editor(s). MDPI and/or the editor(s) disclaim responsibility for any injury to people or property resulting from any ideas, methods, instructions or products referred to in the content. |
© 2025 by the authors. Licensee MDPI, Basel, Switzerland. This article is an open access article distributed under the terms and conditions of the Creative Commons Attribution (CC BY) license (https://creativecommons.org/licenses/by/4.0/).