Article

Biasing Rule-Based Explanations Towards User Preferences

Institute for Application-Oriented Knowledge Processing (FAW), Johannes Kepler University, 4040 Linz, Austria
*
Author to whom correspondence should be addressed.
Information 2025, 16(7), 535; https://doi.org/10.3390/info16070535
Submission received: 19 May 2025 / Revised: 21 June 2025 / Accepted: 23 June 2025 / Published: 24 June 2025

Abstract

With the growing prevalence of Explainable AI (XAI), the effectiveness, transparency, usefulness, and trustworthiness of explanations have come into focus. However, recent work in XAI often still falls short in terms of integrating human knowledge and preferences into the explanatory process. In this paper, we aim to bridge this gap by proposing a novel method, which personalizes rule-based explanations to the needs of different users based on their expertise and background knowledge, formalized as a set of weighting functions over a knowledge graph. While we assume that user preferences are provided as a weighting function, our focus is on generating explanations tailored to the user’s background knowledge. The method transforms rule-based interpretable models into personalized explanations considering user preferences in terms of the granularity of knowledge. Evaluating our approach on multiple datasets demonstrates that the generated explanations are highly aligned with simulated user preferences compared to non-personalized explanations.

1. Introduction

As the demand for Explainable AI (XAI) and providing explanations of black-box models is growing significantly, different methods are proposed to increase and improve transparency and interpretability [1,2]. However, different users require different levels of explanation. Thus, explanations should not be uniform, but should consider user goals, expectations, and needs [3]. As argued by Doshi-Velez and Kim [4], the demand for explanations varies depending on the local/global scope, background, and the user’s level of expertise. In addition, user acceptance and understandability play a crucial role, as they directly impact trust in the system [5].
Currently, XAI methods mainly focus on enhancing the perception of targeted users in a specific domain of the underlying black-box models, and only a limited amount of research is dedicated to engaging the user’s background and knowledge in XAI. This leads to a gap between the XAI techniques and real-world users.
In this work, we address this problem and aim to bridge the gap by highlighting user preferences and generating different levels of explanation based on given data categories. We propose a meta-XAI technique that takes multiple rule-based explanations as input and tries to find an explanation that is tailored to the user’s knowledge and preferences, which are in turn specified as weights associated with nodes in a knowledge graph.
This article is organized as follows. Section 2 briefly reviews the most important works and studies on the role of user preferences in XAI, Section 3 elaborates on the role of user preference and knowledge in XAI, Section 4 describes research objectives, Section 5 explains the proposed method in detail, and Section 6 discusses the results.

2. Related Works

Most existing explanability approaches focus on generating the same type of explanation regardless of the targeted users and domain. Recent empirical studies exploring user experiences with such explanations reveal pitfalls with this approach [6,7]. In particular, users often find the generated explanations challenging to use and the reasoning distracting and time-consuming [8,9,10,11].
Therefore, recent research and studies have focused on examining the effectiveness and acceptability of explanations by taking into account users’ perception [12], their background knowledge, and their preferences. The idea of “testing explainable AI with humans in the loop” reflects this turn to human-centered approaches [8,13].
Furthermore, various research efforts aim to introduce new methods to bridge the gap between generated explanations in XAI and human understandability. Xie et al. [9] introduce CheXplain, a system that allows physicians to explore and understand chest X-ray analysis through three iterative activities designed to reveal expert needs, low-fidelity and high-fidelity prototypes. Ghai et al. [14] present a novel human-in-the-loop paradigm for explainable active learning (XAL), which involves explaining the algorithm’s prediction for the selected instance and obtaining feedback from human labelers.
Similarly, Huang et al. [15] focus on adapting XAI to developers employing XAI for code smell prioritization, incorporating features that reflect the developer’s major expectations. The alignment between expectations and XAI explanations is assessed through accuracy, coverage, and complexity. Kim et al. [16] aim to analyze a uniform explanation from a human-centered perspective by investigating user’s preferences for different AI interfaces.
Lai et al. [8] propose a novel framework that aims to generate selective explanations by selecting a subset of model reasoning that aligns with the user’s preferences. The framework can be used to enhance any feature-based local explanation. Similarly, Feng et al. [17] use a model to select the most suitable explanations from a set of candidates that aligns with the user’s decision. The models are subsequently updated based on human feedback.
What is common with these approaches is their focus on feature-based explanations. In contrast, our proposed method targets rule-based interpretable models, since logical expressions are more expressive than mere feature weights, but arguably still quite understandable for humans. Moreover, we also pick up on the idea that the interpretability of learned concepts is influenced by human cognitive biases [18], which should be considered when formulating rule-based explanations [19]. Specifically, we are focusing on one particular type of cognitive bias, namely the recognition heuristic [20,21]. Essentially, this states that explanations that use concepts that are more familiar to a user will be preferred by the user.

3. User Preferences

As discussed above, explanations generated by various XAI methods are not domain-specific, meaning they can be used across multiple disciplines and are not tailored to specific users with individual levels of expertise and individual preferences [22].
User preferences and expertise play a crucial role in human-centered approaches [23,24]. For instance, in medical applications, they influence whether the explanations are suitable for patients or doctors, each type requiring a different abstraction level or even vocabulary. Additionally, adapting explanations to user needs can enhance the users’ satisfaction, understanding, and trust in the system. However, many studies do not explicitly define their target users, often prioritizing professionals while neglecting people without professional expertise. Furthermore, the European Union’s AI Act emphasizes that explanations should be communicated in a language comprehensible to the average citizen, not only to technical experts [25]. Consequently, a “one-size-fits-all” approach to explanations is insufficient, as users prefer personalized and adaptable explanations that are aligned with their knowledge and preferences [26,27,28].
This emphasis on aligning explanations with user cognition reflects broader concerns raised in recent sociotechnical research, particularly in [29]. This work underscores that explanations generated by AI models are interpreted through the lens of human cognitive biases and mental shortcuts. It argues that AI is not simply a neutral technical tool, but part of a broader information ecosystem where misinformation can be amplified by cognitive shortcuts and misaligned communication. Building on this, Shin [30] also demonstrates that transparency cues, such as labeling and source framing, act as heuristics that influence how users assess the credibility and trust of AI-generated content, especially depending on their trust in algorithms. These insights are relevant in contexts where explanations must be tailored to align with users’ knowledge and cognitive preferences. By adopting a human-in-the-loop approach, we address these challenges by personalizing explanations in ways that support interpretability and reduce the risk of cognitive misalignment.
An important additional aspect here is the granularity of explanations, which influences how an individual comprehends and interprets an explanation [27]. Research, such as [31], indicates that a balance between coarse and fine-grained explanations enhances users’ mental models of the prediction process. In this article, we propose another perspective on granularity, namely that it is necessary to provide varying levels of explanation granularity tailored to the individual preferences and expertise of different users.
In our context, user preferences are not only conceptual but also modeled as preferences over the explanatory vocabulary. Specifically, we assume that users may prefer certain types of concepts—such as high-level or low-level terms—when receiving explanations. We formalize these preferences through a weighting function over the available vocabulary, which influences how explanations are constructed. This formal representation is detailed in Section 5, but we introduce the conceptual motivation here to emphasize that preference modeling plays a foundational role in enabling personalized, user-aligned explanations.

4. Problem Statement

4.1. The CoRIfEE Framework

We develop our new approach in the context of the more general framework for discovering Cognitively biased Rule-based Interpretations from Explanation Ensembles (CoRIfEE). The general approach of CoRIfEE is a meta-XAI method that takes multiple explanations in the form of rules as input, and then synthesizes them into an explanation that is more aligned to the user’s cognitive preferences. The design decision to generate multiple explanations first is motivated by the so-called Rashomon effect [32], which states that there are typically multiple models that explain the data equally well (in terms of a given performance measure), but often base their models on very different feature sets and may therefore have very different semantic interpretations. Not surprisingly, this effect has also been observed and analyzed for interpretable explanations [33,34].
Since various interpretable models provide different explanations of the data, in our approach, we extract features and rules from the pool of used features that satisfy the defined criteria and reassemble them to new explanations, relying on heuristic criteria for a good explanation beyond the commonly used criteria such as syntactic simplicity and/or fidelity to the underlying hidden model. Among the different criteria considered are semantic coherence, relevance, or user recognition [19]. In this paper, we focus specifically on an instantiation of the CoRIfEE platform, CoRIfEE-Pref, which emphasizes user preferences through knowledge graphs and weighting functions.

4.2. CoRIfEE-Coh

An existing instantiation of the CoRIfEE platform is CoRIfEE-Coh, which focuses on a different aspect of cognitive biases: semantic coherence. Semantic coherence refers to the degree to which the concepts in the explanation are semantically related. CoRIfEE-Coh is designed to generate coherent rule-based explanations that are more understandable to humans.
It follows a similar procedure to CoRIfEE-Pref, starting with a pool of interpretable models, and then generating a single, coherent explanation; while CoRIfEE-Pref emphasizes user preferences and background knowledge modeled through a weighting function, CoRIfEE-Coh focuses on optimizing a heuristic that is a combination of a conventional rule learning heuristic and a semantic coherence measurement method [35].

4.3. CoRIfEE-Pref

We present CoRIfEE-Pref, an instantiation of CoRIfEEwith a focus on incorporating the recognition heuristic [20,21], i.e., the observation that explanations using concepts more familiar to a given user will be preferred by them. We model user knowledge in the form of a weighting function W ( KG ) that is defined over a knowledge graph KG , representing user preferences as weights assigned to concepts within the knowledge graph. For example, in medical applications, physicians and medical experts often describe blood test results in detail, using specific terminology or specialized categories and numbers, which carry higher weights in the weighting function. Conversely, patients without medical knowledge typically tend to prefer the results described in broader terms, such as high blood pressure or high cholesterol level. As a result, a model of their preferences should assign lower weights to medical terminology and numerical values, while placing higher weights on more general concepts.
The example in Table 1 illustrates the concept of user-customized explanation by assuming a hypothetical user who prefers a more general explanation. In this case, selecting the explanation that is most suited to the user knowledge and expertise could be accomplished by a weighting function that takes the abstraction level of the concepts in the graph into account, i.e., the user’s interest rises proportionally with the weighting of abstract concepts. Table 1a shows a higher-level explanation, while Table 1b offers a more detailed explanation.

4.4. Terms and Notation

Throughout this article, a rule  r is an if–then statement consisting of a body (if-part) and a head (then-part). The body has one or multiple conditions connected by conjunctions. The l e n g t h ( r ) of the rule is the number of conditions in the body. Rule sets are presented as R = { r 1 , , r k } . The dataset D consists of examples where each example is characterized by a vector of attributes denoted as A = { a 1 , , a n } . For each attribute a i ( i = 1 , , n ) , the corresponding value to the j-th example is denoted as v i ( j ) . The Boolean feature f is known as a combination of attribute f . a t t r and value f . v a l u e .
The method also relies on a knowledge graph defined as a directed labeled graph KG = ( V , E ) where V represents a set of vertices or nodes and E depicts the set of edges connecting the vertices. In this article, a set of vertices V encompasses nodes that represent attributes, attribute values, and abstract concepts, labeled as “abstract”, that are high-level concepts semantically group-related attributes. For example, in the educational domain, a node might represent the attribute “education”, and the other node represents “secondary education”. An edge labeled “categorized as” would connect the two nodes.
An example of the KG is depicted in Figure 1, in which the nodes in green represent attributes in the dataset, blue nodes illustrate abstract concepts, and pink nodes indicate the attributes’ values.
The inputs to our method are multiple interpretable models in the form of rule sets I = { R i } , a dataset D , and users’ preferences, which are defined in the form of a list of weighting functions for each user. The weighting function is defined as W ( KG ) = { w u 1 , , w u m } where each w u i represents preferences of a user u i and assigns a numerical weight to each node labeled as abstract and attribute’s values in the knowledge graph. In addition, a metric s ( R , KG , W ) is defined for characterizing to what extent an explanation is aligned with a user’s knowledge and preferences. Our goal is to generate an explanation R most aligned with user knowledge from KG , such that s ( R ) s ( R ) R R i .

5. Methodology

CoRIfEE-Pref is another instantiation of the CoRIfEE platform that tailors the explanations to user expertise and background knowledge. This is accomplished by modeling user preferences as weighting functions over a knowledge graph. The following sections provide a detailed step-by-step breakdown of the proposed method.
To enhance understandability and transparency, Figure 2 presents an illustrative example outlining the main steps of the CoRIfEE-Pref method. In this example, the dataset D includes attributes A = { education , work _ hour } . The interpretable model I consists of a rule r, where a feature is f = ( education , PhD ) . Each step depicted in the figure is explained in detail in the following sections.

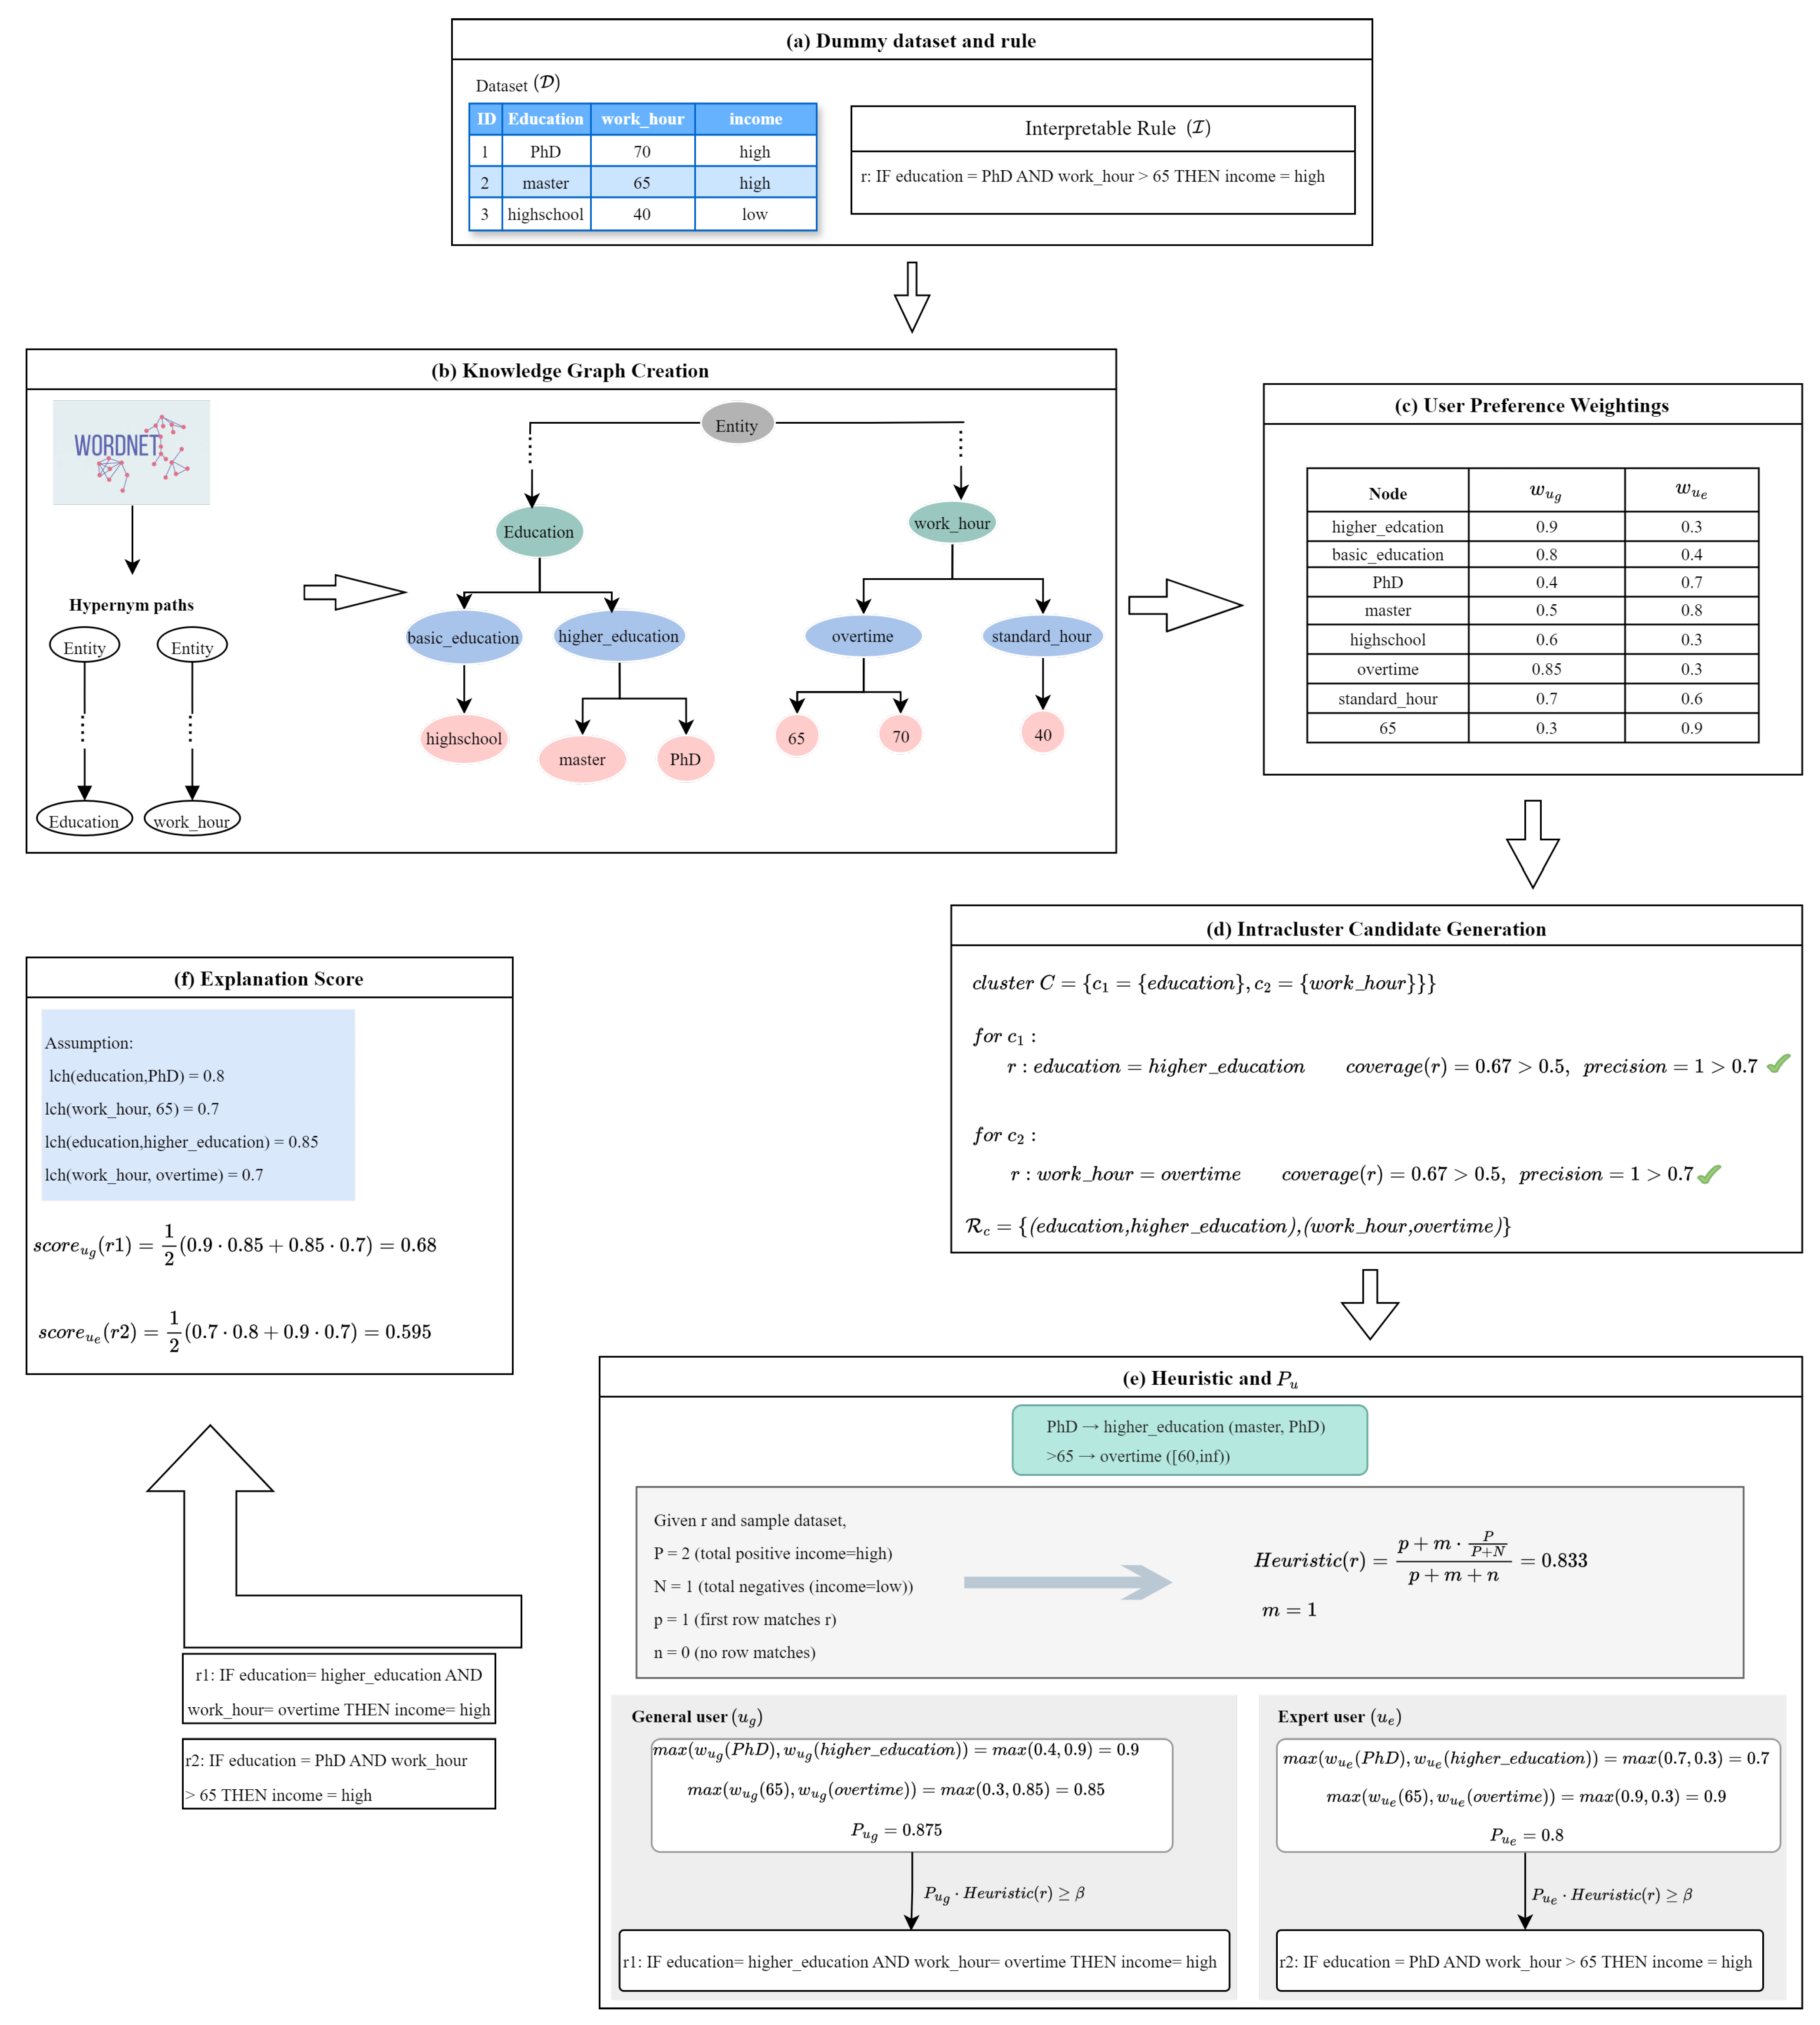
5.1. Defining CoRIfEE-Pref Inputs

The CoRIfEE-Pref operates on four main inputs:
  • Pool of interpretable models ( I ):
    A collection of rule-based explanations derived from various interpretable machine learning models, such as random forest or JRIP. The explanations are in an if–then format, making them human-understandable.
  • Dataset ( D ):
    It provides the underlying structured data on which the method operates.
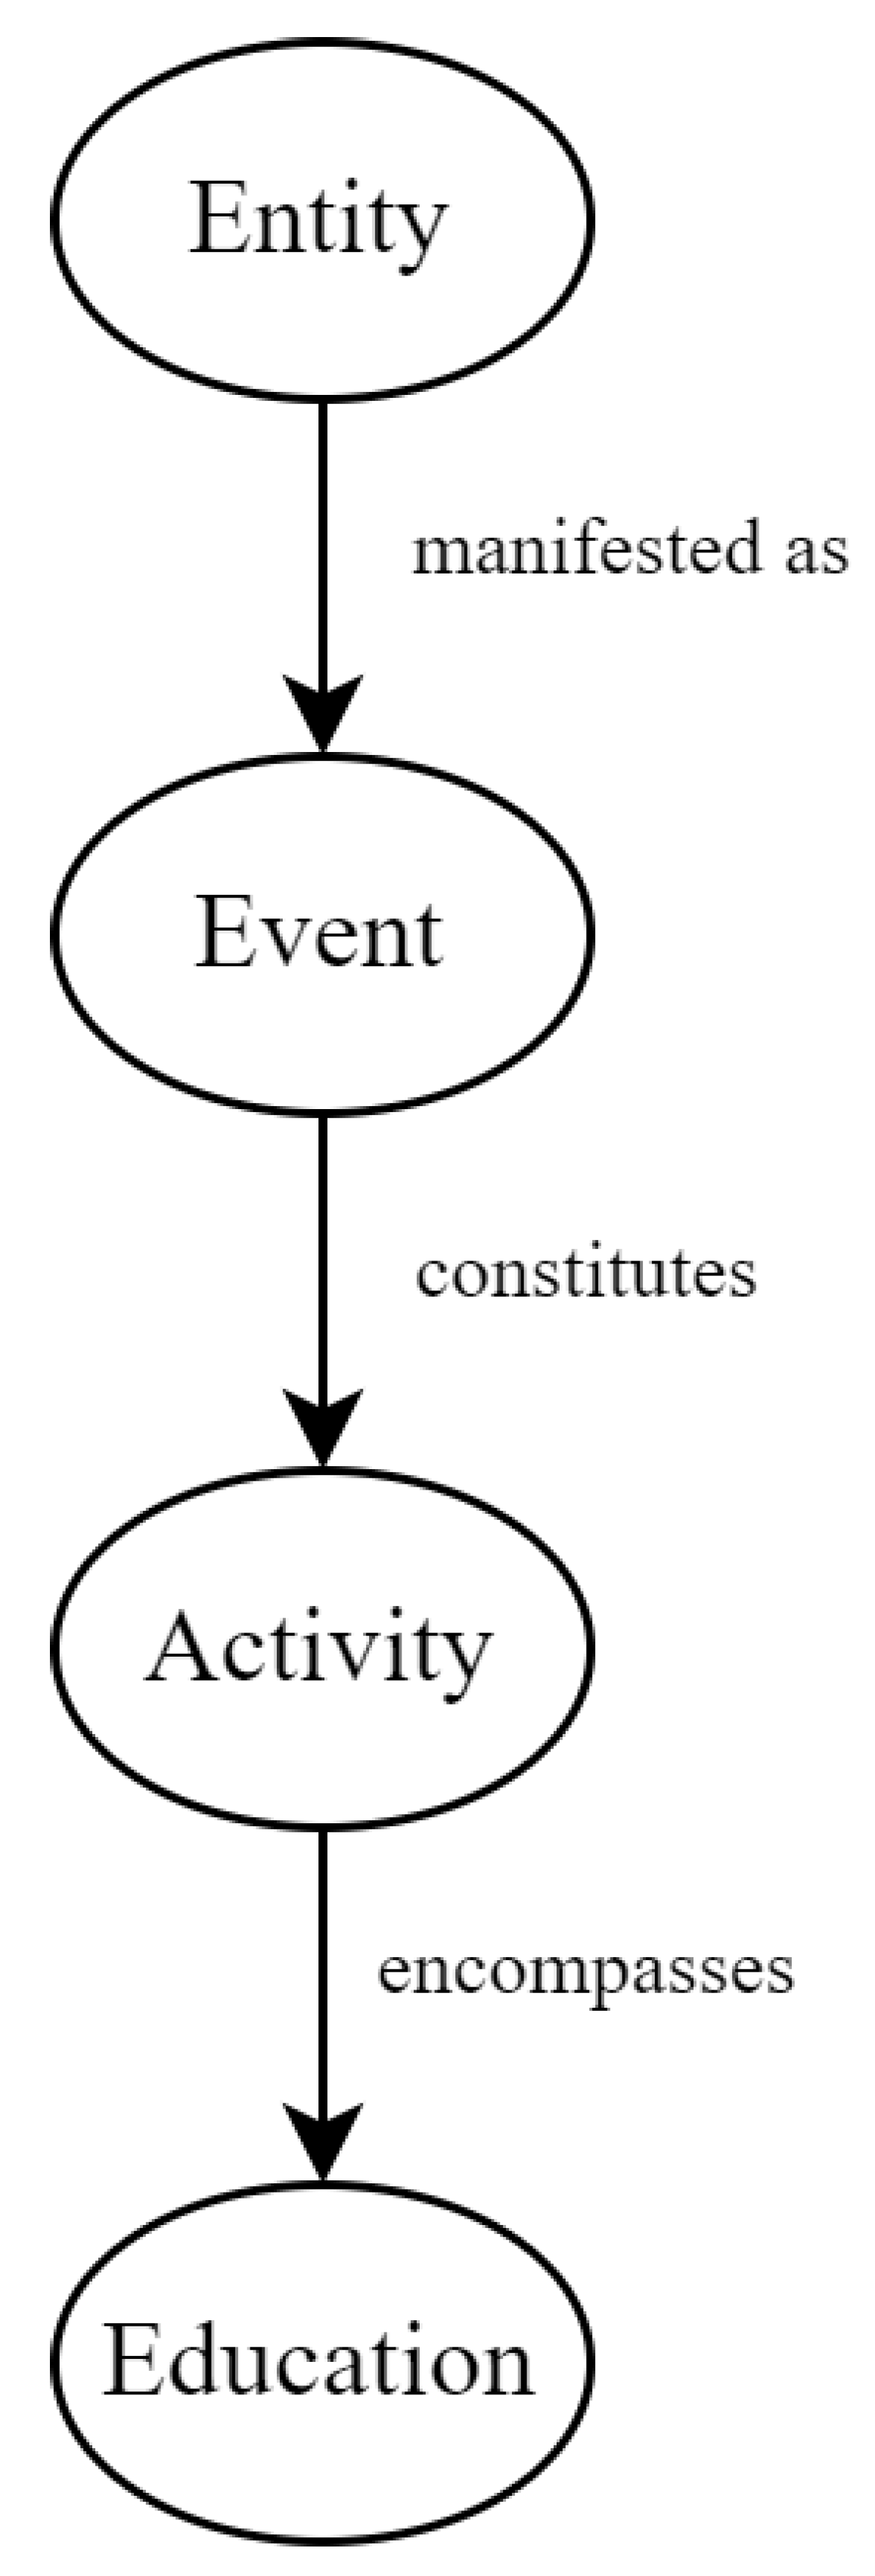
  • Knowledge Graph ( KG ):
    A directed label encapsulates the domain’s knowledge.
  • User weighting function ( W ):
    A function defined over the KG to model users’ preferences and background knowledge. It assigns numerical weight to nodes (concepts) in the KG that reflects how familiar the concept is to the user. The weights enable the methods to adjust explanations that resonate with user preferences.

5.2. Modeling User Preferences

In CoRIfEE-Pref, the user preferences are taken into account through a modeling approach using a weighting function defined over a domain-specific knowledge graph. This reflects the idea that preference-customized explanations are more comprehensible and understandable to the targeted users. To this end, the weighting function W ( KG ) is introduced to integrate user-specific knowledge into the explanation generation process.
The function is defined by each user and assigns each node within KG —whether representing an attribute, an abstract concept, or an attribute’s value—a numerical weight, which specifies the user’s familiarity with or perceived importance of the corresponding concept. For example, in medical applications, a physician’s preference model might assign higher weights to specialized terminologies, whereas a layperson prefers more general ones.
The weights are then taken into account in the explanation generation process, where the method first retrieves the set of all ancestor nodes of a node labeled as “abstract”. The one with the highest weight, indicating the strongest alignment with user knowledge and preference, is then selected from the retrieved nodes to replace the original attribute’s value.
Mathematically, the user preference on a given rule is defined as
P u ( r , KG , w u ) = 1 length ( r ) f r max v anc ( f ) w u ( v )
In (1), r is a rule consisting of attribute–value pairs, length ( r ) is the number of conditions in the rule, and v is a node in the knowledge graph. f r represents a single condition within the body of the rule r . Each condition is associated with an attribute–value pair; for instance, in Figure 2, the two conditions are “education=PhD” and “work_hour=65”. anc ( f ) denotes the set of ancestor nodes associated with a node labeled as “abstract”. For example, referring again to Figure 2, the abstract ancestor of the specific node “PhD” is “higher_education”. w u ( v ) is the weight for the user u that assigns a weight to node v in the knowledge graph KG .
The introduced P u effectively integrates user preferences into the explanation generation process by retrieving the highest weighted node in the rule condition and thereby ensures that the explanation is tailored to the expertise and background knowledge of the intended user.
To provide a clearer understanding of the step, Figure 2 illustrates simplified example data. The process begins with (a) a small dataset and a sample rule as an interpretable model. The dataset contains three instances, where “income” is the target variable. The corresponding knowledge graph is shown in (b), highlighting relationships between attribute values and more abstract concepts.
For modeling user preferences, we consider two hypothetical users:
  • General user ( u g ), who prioritizes general, abstract concepts.
  • Expert user ( u e ), who values specific details and precise terminology.
Each user assigns normalized weights (ranging from 0 and 1) to concepts and attributes in the knowledge graph, as shown in (c). For instance, the general user assigns higher weights to abstract nodes “higher_education” and “overtime”, while the expert user emphasizes specific nodes “PhD” and the numeric value “65” for work_hour.
The computation of P u is illustrated in step (e). For each condition in the given rule (“education=PhD", “work_hour > 65”), the algorithm identifies both the node directly mentioned in the rule condition and its ancestor node labeled as “concept” in the knowledge graph. Among these nodes, the one with the highest assigned user weight is selected to represent how well the rule aligns with that user’s preferences. For example,
  • For the general user ( u g ), the selected nodes with the highest weights are “education = higher_education” (0.9) and “work_hour = overtime” (0.85).
  • For the expert user ( u e ) , the relevant features with the highest weights are “education = PhD (0.7)” and “work_hour > 65” (0.9).
Finally, P u for each user is computed by summing the selected weights and normalizing, as explicitly demonstrated in step (e), Figure 2.

5.3. User-Customized Explanation Generation

This section discusses CoRIfEE-Pref and elaborates on how to integrate the user’s knowledge into the explanation generation process.
Once the input and user preferences are defined, CoRIfEE-Pref performs the phases described in the following.
CoRIfEE-Pref proceeds by preparing and preprocessing the dataset via renaming, filling in missing values, and discretization of numerical features. Subsequently, the method generates an initial set of single-condition rules taken from the interpretable models I . It then forms conceptual clusters of attributes based on the distance in the KG . Clustering ensures the rules are based on conceptual meaning, leading to more general explanations, and improves computational efficiency.
The clusters are then used in a two-level rule set generation, intracluster and intercluster candidate generation.
The intracluster candidate generation finds a candidate rule set R c within each cluster by merging the conditions that satisfy the coverage and precision thresholds, as explained in Algorithm 1. The merging process is iterative. Initially, for each cluster c i , the individual condition is evaluated against the predetermined coverage and precision thresholds. If the criteria are passed, the condition is appended to the conditions in r . This process continues until all the clusters are iterated, and no further conditions can be added without violating the threshold constraints. The generated rules are then added to R c . In practice, the default values for t h c and t h p can be set to 0.5 and 0.7, respectively, which are grounded in a combination of theoretical insight and empirical validation. A coverage threshold of 0.5 specifies that a rule must apply to at least half of the relevant instances, and the precision threshold of 0.7 is set to guarantee that the rule’s predictions are correct for at least 70% of the cases it covers. Therefore, the thresholds provide a basis for generating rules that are general to cover significant portions of the data and precise enough to ensure predictive performance, which has been found to work well. Additionally, since rule generation at this level begins with single-condition rules that cover concepts within a cluster, it limits the number of rules and reduces the search space by filtering out redundant or low-quality rules.
Algorithm 1 Pseudocode on CoRIfEE-Pref.
Input: Pool of interpretable models I .
Input: Knowledge graph KG
Input: Dataset D
Input: User weighting function W .
Output: Explanation R maximally aligned with user preferences.
  1:
I i n i t initialize interpretable models
  2:
for every two attribute nodes, calculate Wu–Palmer semantic similarity in the KG .
  3:
cluster C = { c 1 , , c m } cluster features based on their semantic similarity using a clustering method.
  4:
R c = []
  5:
for  c i in C do
  6:
      clusterFeatures ← get all ( V j , V k ) for one class from c i
  7:
       r
  8:
      for  f i in clusterFeatures do
  9:
           if  coverage ( r f i ) t h c and precision ( r f i ) t h p  then
10:
                 r r f i
11:
           end if
12:
      end for
13:
       R c R c r
14:
end for
15:
R [ ]
16:
for each r i and r j in R c  do
17:
      mergeValid ← merge_validation( r i , r j )
18:
      if mergeValid then
19:
            r merge ( r i , r j )
20:
           if  Heuristic ( r ) · P u ( r , KG , w u ) β  then
21:
                 R R r
22:
           end if
23:
      end if
24:
end for
25:
postprocess the generated explanation as the final explanation
To illustrate the intracluster candidate generation defined in CoRIfEE-Pref, we refer to the example shown in Figure 2. As described, we first obtain clusters over the knowledge graph KG , which yields two clusters c 1 and c 2 depicted in step (d). The intracluster candidate generation phase focuses on forming rules using only features within each cluster. For cluster c 1 , a single-condition rule is created based on the “education” attribute, formulated as “r:if education-higher_education then income=high”. Applying this rule to the dataset, the computed evaluation metrics are coverage = 0.67 and precision = 1 . Since both metrics satisfy the respective thresholds ( t h c and t h p ), the rule is considered valid and is subsequently appended to R c . The same procedure is also applied to cluster c 2 to generate additional intracluster candidate rules.
The intercluster candidate generation generates the final explanation. It forms a rule set R by considering all pairs of rules in R c and evaluating whether the two rules are valid to be merged. Every candidate rule pair is evaluated through a dedicated function, merge _ validation , which checks for contradictions between the conditions of the two rules. For numerical attributes, it verifies that the proposed merged intervals are feasible and do not reduce the range to an impractical narrow band. For categorical attributes, it ensures that merged conditions do not contain attributes with conflicting values.
Upon successful merge validation, the two rules r i and r j are merged via merge . The merge function checks if two conditions in the pair of rules have the same attribute in the merging process. If so, the one with the higher weight is selected to be part of the candidate explanation. The merged rule r is then evaluated against a composite metric that integrates a conventional rule learning heuristic with the user preference function P u introduced in (1). The metric is designed to balance predictive performance and user alignment. The Heuristic ( r ) is the m-estimate [36], a rule learning heuristic that provides a tunable trade-off between precision and weighted relative accuracy, and is defined as
Heuristic ( r ) = p + m · P P + N p + n + m
where p is the positive examples out of all positive examples P that are covered by the rule, n is the negative examples out of all negative examples N that are covered by the rule, and m is the examples used for initialization.
Consider the rule r and dataset D depicted in Figure 2. The dataset contains P = 2 positive examples (i.e., “income = high”) and N = 1 negative examples (i.e., “income = low”). The rule covers p = 1 positive examples and no negative examples n = 0 . Assuming that m = 1 for this example, we compute the heuristic as heuristic ( r ) = 1 + 2 3 1 + 1 = 0.83 .
Only the merged rules that meet the predefined threshold β on the metrics are appended to R . After an initial set of merged rules is established, the process revisits the remaining candidate rules in R c to explore further possible combinations. This iterative approach continues until no additional valid merges can be performed without violating the validation criteria.
The final result R is the new explanation that is highly aligned with user preferences.

6. Experimental Evaluation

6.1. Experimental Setup

The CoRIfEE-Pref is evaluated on multiple binary classification datasets, mainly from the UCI repository [37]. The datasets are chosen because they operate in domains where knowledge bases for the underlying background knowledge can be easily identified:
  • Heart Disease consists of medical records related to heart health, used for specifying heart disease.
  • Bank Marketing contains information about customer interactions with marketing campaigns, used to predict the success of marketing strategies.
  • Water Quality includes measurements of various water quality parameters specifying the cleanliness of water.
  • Hepatitis consists of medical records of hepatitis patients, determining whether the patient survives or dies.
  • Adult specifies whether a person earns more than 50K per year.
Additionally, our method requires as input a set of interpretable models, a knowledge graph KG , and a weighting function representing the user’s terminological preferences. In this experiment, we use rules generated from a few trees of a random forest as the interpretable models. For each dataset, we generated a focused knowledge graph using WordNet [38] by getting the hypernym path of attributes, and extracting subject–verb–object triples where the subject and objects are two nodes in the path connected by an edge (verb). The triples are then used to create nodes and edges/relationships in the graph. For example, consider the hypernym path extracted from WordNet for “Education” in Figure 3.
In this case, the subject–verb–object triple is captured as (“Entity”, “manifested as”, “Event”), (“Event”, “constitutes”, “Activity”), and (“Activity”, “encompasses”, “Education”).
For the weighting function, we simulate two users representing their preferences through the weights assigned to nodes in KG . Each user’s weighting function differs in terms of nodes labeled as “abstract”. We then pass the inputs to the method and obtain an explanation for each user tailored based on their preferences and knowledge.
A single user-customized rule r generated by the method is evaluated using the following metric:
score ( r ) = f r w u ( f . v a l u e ) · l c h ( f . a t t r , f . v a l u e ) length ( r )
where the average normalized lch semantic similarity of each attribute and value of the explanation r is weighted by the weight w u that user u attributes to this value.
The score metric ranges from 0 to 1 and captures the rule semantic alignment with user preferences. It uses the Leacock&Chodorow similarity [39] to obtain conceptual closeness in the knowledge graph, weighted by the user-defined weights indicating their preferences. Dividing the weighted similarity by rule length normalizes the score to ensure comparability across varying sizes; while precision and coverage are used to filter candidate rules, this metric focuses on the semantic dimension of interpretability, which is not reflected in standard performance metrics. The Leacock&Chodorow similarity (lch) is calculated as
l c h ( c i , c j ) = log length ( c i , c j ) 2 · D i j
In this equation, length ( c i , c j ) denotes the length of the shortest path between the two concepts c i and c j , and D i j represents the maximum depth of these nodes in the taxonomy, i.e., D i j = max ( depth ( c i ) , depth ( c j ) ) . The score of a rule set R is then simply defined as the average over all explanatory rules r k in the set.
As an example, the processed rules r 1 in Figure 2 is used to calculate the metric in (3). Assuming that the lch semantic similarities from the knowledge graph are provided, as illustrated in step (f), then the score for user u g is computed using the respective weights as follows:
score u g = 1 2 ( w u g ( higher _ education ) · lch ( education , higher _ education ) + w u g ( overtime ) · lch ( work _ hour , overtime ) ) = 0.68
In this way, the weights are taken into account as part of the explanation generation; thus, the generated explanation includes the features most aligned with the user’s preferences.
To assess the performance of the proposed method, we generate two explanations considering the weights from the two users’ weighting functions. Thus, we expect to obtain two different explanations R u 1 and R u 2 , which include features that are most aligned with the respective user’s knowledge. To simulate two users without direct user studies, we simulate two distinct users using ChatGPT 4o. One user focuses on general and abstract terminology, while the other emphasizes more specific, professional terms. The weightings were created by prompting ChatGPT to rate concepts’ familiarity and usefulness from the two users’ perspectives. This approach is inspired by the work of Bona et al. [40], which demonstrated the efficiency of LLMs in approximating human-like responses. The efficiency and alignment with each user’s preferences are evaluated through accuracy and the scoring method introduced in (3) by comparing them to the original explanation R o r i g .
For clarity and reproducibility, we report the prompts used to simulate two distinct user roles— a medical expert and a patient without a medical background— for the Heart Disease dataset. The prompts, shown in Table 2, were used to generate weightings over concepts and attributes. The responses simulate users’ preferences, perceived familiarity, and relevance of domain-specific concepts on a scale from 0 to 1.

6.2. Quantitative Results

Table 3 shows the evaluation results on multiple datasets.
Bold font is used to highlight the highest value for each user and dataset. The general pattern in all datasets is that the generated explanations exhibit a clear increase in the fitness for the user for which they were generated ( R u 1 for user u 1 , and R u 2 for user u 2 ). This increase in the score for matching the user preferences comes at the expense of a slight decrease in the predictive accuracy of the resulting rule sets.
To further support the results, we conducted evaluations on two datasets: Heart Disease and Bank Marketing. For each dataset, the explanation generation and scoring were repeated ten times using different random train/test splits. This allowed us to estimate the variability in score by computing 95% confidence intervals for each explanation generated for u 1 and u 2 . The results reported in Table 4 confirm that personalized explanations achieve a higher mean score across multiple executions. Notably, the confidence intervals for the user-personalized explanations R u 1 and R u 2 do not overlap with those of the original explanations when evaluated against the same user preferences. This provides evidence that the generated explanations are robust and meaningful.

6.3. Qualitative Results

Table 5 depicts fragments of R o r i g and R u 1 on the Adult dataset. Table 5a shows the original rule set, and Table 5b shows the rule set for a user who prefers broader concepts for more specific terms such as occupation, education, etc. This is reflected in the weighting functions by giving low weights to terminology and values. By comparing R o r i g and R u 1 , we can see that R u 1 explains the targeted terms in more general concepts while maintaining the more common terms such as attributes like “race” unchanged.
While Table 5 illustrates how CoRIfEE-Pref personalizes explanations by adjusting terminologies and abstraction levels of attributes’ values, Table 6 presents a complementary original and user1 explanations by reformulating the same rule-based explanations in a more narrative style. This helps to more clearly represent the high and low granularity level achieved by CoRIfEE-Pref.
To further demonstrate the model’s adaptability across domains and user expertise levels, Table 7 presents rule-based explanations from the Heart Disease dataset. Table 7a includes technical descriptions such as “ventricular ECG abnormalities” suited to medical experts, while Table 7b rephrases the same rules for patient communication, preserving the underlying decision logic. This highlights the ability of CoRIfEE-Pref to adjust both the terminology and conceptual abstraction to reflect domain-specific knowledge and to match the informational needs and backgrounds of the intended user.

7. Conclusions and Discussion

The goal of this work was to strengthen the role of the user in the explanatory process, building on the CoRIfEE framework, a meta-XAI method that takes multiple rule-based explanations as input and synthesizes them into a single explanation tailored to a particular user’s needs.
We introduced CoRIfEE-Pref, a novel method focusing on generating user-personalized explanations, taking into account background knowledge and user preferences, which are specified as weighting functions. This implements the so-called recognition heuristic, which essentially captures the idea that among two competing explanations, humans will prefer the one that uses concepts that are more familiar to them.
Our experimental results on several UCI domains on simulated users demonstrate that the method is able to generate explanations that are highly aligned with user preferences while maintaining almost the same accuracy as the original explanations.
One of the strengths of our method is its ability to dynamically adapt explanation granularity based on the user preferences. This represents an important step toward human-centered XAI, as it facilitates user-aligned explanations. Moreover, the use of knowledge graphs enables the integration of domain-specific concepts and semantic relations into the explanation generation process.
However, several limitations remain. Our evaluation relies on simulated users using ChatGPT; while this approach is scalable and cost-effective, it cannot fully capture real-world user cognition and preferences. Future studies will address this by incorporating real users in applied domains such as healthcare, education, and finance. In addition, while the scoring metric introduced in Section 6 assesses the structural alignment with user-defined preferences, it does not evaluate subjective interpretability. Future works can explore and incorporate behavioral signals and user feedback.
Furthermore, as CoRIfEE-Pref emphasizes personalization to improve user alignment and interpretability, it also introduces trade-offs. In particular, overly simplified or highly personalized explanations might unintentionally hide important details or reinforce existing biases. Exploring these risks and trade-offs, and their implications will be an important direction for future work, particularly in high-stakes domains and applications.
Overall, CoRIfEE-Pref offers a promising foundation for a user-centered explanation platform that addresses the shortcomings of a one-size-fits-all approach by tailoring explanations to different users with various levels of expertise.

Author Contributions

Conceptualization, P.M. and J.F.; Investigation, P.M.; Methodology, P.M.; Software, P.M.; Supervision, J.F.; Validation, P.M. and J.F.; Visualization, P.M.; Writing—original draft, P.M.; Writing—review and editing, P.M. and J.F. All authors have read and agreed to the published version of the manuscript.

Funding

This research received no external funding.

Institutional Review Board Statement

Not applicable.

Informed Consent Statement

Not applicable.

Data Availability Statement

The datasets used in this study are publicly available from the UCI Machine Learning Repository. These include the Adult dataset (https://archive.ics.uci.edu/dataset/2/adult), the Heart Disease dataset (https://archive.ics.uci.edu/dataset/45/heart+disease), the Hepatitis dataset (https://archive.ics.uci.edu/dataset/46/hepatitis), the Bank Marketing dataset (https://archive.ics.uci.edu/dataset/222/bank+marketing), and the Water Quality dataset (https://archive.ics.uci.edu/dataset/733/water+quality+prediction-1). All accessed on 22 June 2025.

Conflicts of Interest

The authors declare no conflicts of interest.

References

  1. Hanif, A.; Beheshti, A.; Benatallah, B.; Zhang, X.; Habiba; Foo, E.; Shabani, N.; Shahabikargar, M. A Comprehensive Survey of Explainable Artificial Intelligence (XAI) Methods: Exploring Transparency and Interpretability. In Proceedings of the Web Information Systems Engineering—WISE 2023; Zhang, F., Wang, H., Barhamgi, M., Chen, L., Zhou, R., Eds.; Springer: Singapore, 2023; pp. 915–925. [Google Scholar]
  2. Thunki, P.; Reddy, S.R.B.; Raparthi, M.; Maruthi, S.; Babu Dodda, S.; Ravichandran, P. Explainable AI in Data Science—Enhancing Model Interpretability and Transparency. Afr. J. Artif. Intell. Sustain. Dev. 2021, 1, 1–8. [Google Scholar]
  3. Ribera, M.; Lapedriza, À. Can we do better explanations? A proposal of user-centered explainable AI. In Proceedings of the CEUR Workshop Proceedings, CEUR-WS, Los Angeles, CA, USA, 20 March 2019; Volume 2327. [Google Scholar]
  4. Doshi-Velez, F.; Kim, B. A Roadmap for a Rigorous Science of Interpretability. arXiv 2017, arXiv:1702.08608. [Google Scholar]
  5. Ehsan, U.; Tambwekar, P.; Chan, L.; Harrison, B.; Riedl, M.O. Automated rationale generation: A technique for explainable AI and its effects on human perceptions. In Proceedings of the 24th International Conference on Intelligent User Interfaces, New York, NY, USA, 16–20 March 2019; pp. 263–274. [Google Scholar]
  6. Ehsan, U.; Riedl, M.O. Explainability pitfalls: Beyond dark patterns in explainable AI. Patterns 2024, 5, 100971. [Google Scholar] [CrossRef] [PubMed]
  7. de Bruijn, H.; Warnier, M.; Janssen, M. The perils and pitfalls of explainable AI: Strategies for explaining algorithmic decision-making. Gov. Inf. Q. 2022, 39, 101666. [Google Scholar] [CrossRef]
  8. Lai, V.; Zhang, Y.; Chen, C.; Liao, Q.V.; Tan, C. Selective Explanations: Leveraging Human Input to Align Explainable AI. Proc. ACM Hum.-Comput. Interact. 2023, 7, 1–35. [Google Scholar] [CrossRef]
  9. Xie, Y.; Chen, M.; Kao, D.; Gao, G.; Chen, X.A. CheXplain: Enabling Physicians to Explore and Understand Data-Driven, AI-Enabled Medical Imaging Analysis. In Proceedings of the 2020 CHI Conference on Human Factors in Computing Systems, New York, NY, USA, 25–30 April 2020; pp. 1–13. [Google Scholar]
  10. Bansal, G.; Wu, T.; Zhou, J.; Fok, R.; Nushi, B.; Kamar, E.; Ribeiro, M.T.; Weld, D. Does the Whole Exceed its Parts? The Effect of AI Explanations on Complementary Team Performance. In Proceedings of the 2021 CHI Conference on Human Factors in Computing Systems, New York, NY, USA, 8–13 May 2021. [Google Scholar]
  11. Wang, X.; Yin, M. Are Explanations Helpful? A Comparative Study of the Effects of Explanations in AI-Assisted Decision-Making. In Proceedings of the 26th International Conference on Intelligent User Interfaces, New York, NY, USA, 18–21 March 2021; pp. 318–328. [Google Scholar]
  12. Suffian, M.; Stepin, I.; Alonso-Moral, J.M.; Bogliolo, A. Investigating Human-Centered Perspectives in Explainable Artificial Intelligence. In Proceedings of the CEUR Workshop Proceedings, CEUR-WS, Rome, Italy, 6–9 November 2023; Volume 3518, pp. 47–66. [Google Scholar]
  13. Ehsan, U.; Wintersberger, P.; Liao, Q.V.; Watkins, E.A.; Manger, C.; Daumé III, H.; Riener, A.; Riedl, M.O. Human-Centered Explainable AI (HCXAI): Beyond Opening the Black-Box of AI. In Proceedings of the Extended Abstracts of the 2022 CHI Conference on Human Factors in Computing Systems, New York, NY, USA, 29 April–5 May 2022. [Google Scholar]
  14. Ghai, B.; Liao, Q.V.; Zhang, Y.; Bellamy, R.; Mueller, K. Explainable Active Learning (XAL): Toward AI Explanations as Interfaces for Machine Teachers. Proc. ACM Hum.-Comput. Interact. 2021, 4, 1–28. [Google Scholar] [CrossRef]
  15. Huang, Z.; Yu, H.; Fan, G.; Shao, Z.; Li, M.; Liang, Y. Aligning XAI explanations with software developers’ expectations: A case study with code smell prioritization. Expert Syst. Appl. 2024, 238, 121640. [Google Scholar] [CrossRef]
  16. Kim, D.; Song, Y.; Kim, S.; Lee, S.; Wu, Y.; Shin, J.; Lee, D. How should the results of artificial intelligence be explained to users?—Research on consumer preferences in user-centered explainable artificial intelligence. Technol. Forecast. Soc. Chang. 2023, 188, 122343. [Google Scholar] [CrossRef]
  17. Feng, S.; Boyd-Graber, J. Learning to Explain Selectively: A Case Study on Question Answering. In Proceedings of the 2022 Conference on Empirical Methods in Natural Language Processing, Abu Dhabi, United Arab Emirates, 7–11 December 2022; pp. 8372–8382. [Google Scholar]
  18. Kliegr, T.; Bahník, Š.; Fürnkranz, J. A Review of Possible Effects of Cognitive Biases on Interpretation of Rule-based Machine Learning Models. Artif. Intell. 2021, 295, 103458. [Google Scholar] [CrossRef]
  19. Fürnkranz, J.; Kliegr, T.; Paulheim, H. On Cognitive Preferences and the Plausibility of Rule-based Models. Mach. Learn. 2020, 109, 853–898. [Google Scholar] [CrossRef]
  20. Goldstein, D.G.; Gigerenzer, G. The recognition heuristic: How ignorance makes us smart. In Simple Heuristics That Make Us Smart; Gigerenzer, G., Todd, P.M., Group, A.R., Eds.; Oxford University Press: New York, NY, USA, 1999; pp. 37–58. [Google Scholar]
  21. Goldstein, D.G.; Gigerenzer, G. Models of ecological rationality: The recognition heuristic. Psychol. Rev. 2002, 109, 75. [Google Scholar] [CrossRef] [PubMed]
  22. Islam, M.R.; Ahmed, M.U.; Barua, S.; Begum, S. A Systematic Review of Explainable Artificial Intelligence in Terms of Different Application Domains and Tasks. Appl. Sci. 2022, 12, 1353. [Google Scholar] [CrossRef]
  23. Suresh, H.; Gomez, S.R.; Nam, K.K.; Satyanarayan, A. Beyond Expertise and Roles: A Framework to Characterize the Stakeholders of Interpretable Machine Learning and their Needs. In Proceedings of the 2021 CHI Conference on Human Factors in Computing Systems, New York, NY, USA, 8–13 May 2021. [Google Scholar]
  24. Ehsan, U.; Passi, S.; Liao, Q.V.; Chan, L.; Lee, I.H.; Muller, M.; Riedl, M.O. The Who in XAI: How AI Background Shapes Perceptions of AI Explanations. In Proceedings of the 2024 CHI Conference on Human Factors in Computing Systems, New York, NY, USA, 11–16 May 2024. [Google Scholar]
  25. The EU Artificial Intelligence Act. Available online: https://www.ey.com/content/dam/ey-unified-site/ey-com/en-gl/services/ai/documents/ey-eu-ai-act-political-agreement-overview-february-2024.pdf (accessed on 2 February 2024).
  26. Meske, C.; Bunde, E.; Schneider, J.; Gersch, M. Explainable Artificial Intelligence: Objectives, Stakeholders, and Future Research Opportunities. Inf. Syst. Manag. 2022, 39, 53–63. [Google Scholar] [CrossRef]
  27. Ma, S. Towards Human-centered Design of Explainable Artificial Intelligence (XAI): A Survey of Empirical Studies. arXiv 2024, arXiv:2410.21183. [Google Scholar]
  28. Naveed, S.; Stevens, G.; Robin-Kern, D. An Overview of the Empirical Evaluation of Explainable AI (XAI): A Comprehensive Guideline for User-Centered Evaluation in XAI. Appl. Sci. 2024, 14, 11288. [Google Scholar] [CrossRef]
  29. Shin, D. Artificial misinformation. In Exploring Human-Algorithm Interaction Online; Springer: Cham, Switzerland, 2024. [Google Scholar]
  30. Shin, D. Debiasing AI: Rethinking the Intersection of Innovation and Sustainability; Routledge: London, UK, 2025. [Google Scholar]
  31. Mishra, S.; Rzeszotarski, J.M. Crowdsourcing and Evaluating Concept-driven Explanations of Machine Learning Models. Proc. ACM Hum.-Comput. Interact. 2021, 5, 1–26. [Google Scholar] [CrossRef]
  32. Breiman, L. Statistical Modeling: The Two Cultures (with comments and a rejoinder by the author). Stat. Sci. 2001, 16, 199–231. [Google Scholar] [CrossRef]
  33. Leventi-Peetz, A.; Weber, K. Rashomon Effect and Consistency in Explainable Artificial Intelligence (XAI). In Proceedings of the Future Technologies Conference (FTC); Springer: Cham, Switzerland, 2022; Volume 1, pp. 796–808. [Google Scholar]
  34. Müller, S.; Toborek, V.; Beckh, K.; Jakobs, M.; Bauckhage, C.; Welke, P. An Empirical Evaluation of the Rashomon Effect in Explainable Machine Learning. In Proceedings of the European Conference on Machine Learning and Knowledge Discovery in Databases (ECML/PKDD): Research Track (Part III), Turin, Italy, 18–22 September 2023; pp. 462–478. [Google Scholar]
  35. Mahya, P.; Fürnkranz, J. Extraction of Semantically Coherent Rules from Interpretable Models. In Proceedings of the 17th International Conference on Agents and Artificial Intelligence—Volume 1: IAI. INSTICC, SciTePress, Porto, Portugal, 23–25 February 2025; pp. 898–908. [Google Scholar]
  36. Džeroski, S.; Cestnik, B.; Petrovski, I. Using the m-estimate in Rule Induction. J. Comput. Inf. Technol. 1993, 1, 37–46. [Google Scholar]
  37. Kelly, M.; Longjohn, R.; Nottingham, K. The UCI Machine Learning Repository. Available online: https://archive.ics.uci.edu (accessed on 22 June 2025).
  38. Fellbaum, C. WordNet: An Electronic Lexical Database; The MIT Press: Cambridge, MA, USA, 1998. [Google Scholar]
  39. Fellbaum, C.; Miller, G. Combining Local Context and Wordnet Similarity for Word Sense Identification; MIT Press: Cambridge, MA, USA, 1998; pp. 265–283. [Google Scholar]
  40. Bona, F.B.D.; Dominici, G.; Miller, T.; Langheinrich, M.; Gjoreski, M. Evaluating Explanations Through LLMs: Beyond Traditional User Studies. arXiv 2024, arXiv:2410.17781. [Google Scholar]
Figure 1. Example of a knowledge graph where green nodes denote attributes, blue nodes represent abstract concepts, and pink nodes indicate attributes’ values.
Information 16 00535 g001
Figure 2. Illustration of the CoRIfEE-Pref step-by-step methodology. (a) A sample dataset and an interpretable model composed of a rule. (b) Construction of a domain-specific knowledge graph KG linking concepts, attributes, and attribute values. (c) Simulation of two user profiles with distinct weighting functions: general (user u g ) and expert (user u e ). (d) Generation of intracluster candidate rules. (e) Computation of the user preference score P u and heuristic. (f) Final computation of score for the generated rule.
Information 16 00535 g002
Figure 3. Example of hypernym path extracted for “Education”.
Information 16 00535 g003
Table 1. Example of explanation with two different abstraction levels.
(a) High-Level Explanation(b) Low-Level Explanation
If a person consistently prioritizes their physical and mental health, then they are likely to experience improved overall health.If a person consumes a variety of fruits and vegetables, avoids excessive foods, and drinks plenty of water, then their immune system may strengthen, reducing illnesses like cold and flu.
If a person pursues a higher education degree, then he/she is likely to obtain knowledge that contributes to career success.If a graduate student engages in research, and collaborates in academic papers and projects, he/she is likely to specialized expertise in their field.
Table 2. Prompts to simulate medical expert and patient roles on the Heart Disease dataset.
(a) Medical Expert Prompt(b) Patient Prompt
Imagine you are an experienced cardiologist.Imagine you are a patient with no formal medical background.
On a scale from 0 (not familiar/preferred at all) to 1 (extremely familiar/preferred), rate the given concepts used in diagnosing heart diseases, based on your professional familiarity and practical usefulness.On a scale from 0 (not familiar/useful at all) to 1 (extremely familiar/useful), rate the given medical concepts in terms of how understandable or meaningful you find them for discussing heart health issues with your doctor.
Table 3. Evaluation results of the generated explanations on datasets.
DatasetUser ExplanationAccuracyScore
Heart DiseaseUser1 R o r i g 0.8740.225
R u 1 0.8680.496
R u 2 0.8460.230
User2 R o r i g 0.8740.337
R u 1 0.8680.397
R u 2 0.8460.476
Bank MarketingUser1 R o r i g 0.8870.185
R u 1 0.8860.555
R u 2 0.8840.404
User2 R o r i g 0.8870.278
R u 1 0.8860.517
R u 2 0.8840.680
Water QualityUser1 R o r i g 0.6330.270
R u 1 0.6290.525
R u 2 0.6210.445
User2 R o r i g 0.6330.279
R u 1 0.6290.545
R u 2 0.6210.752
HepatitisUser1 R o r i g 0.7810.293
R u 1 0.7780.474
R u 2 0.7610.460
User2 R o r i g 0.7810.375
R u 1 0.7780.538
R u 2 0.7610.570
AdultUser1 R o r i g 0.8090.190
R u 1 0.7950.447
R u 2 0.7880.387
User2 R o r i g 0.8090.215
R u 1 0.7950.464
R u 2 0.7880.602
Table 4. Mean scores and 95% confidence intervals (CI) for personalized and original explanations on Heart Disease and Bank Marketing datasets.
DatasetUser ExplanationMean Score95% Confidence Intervals (CI)
Heart Disease R o r i g 0.233[0.2, 0.267]
User1 R u 1 0.496[0.476, 0.516]
R o r i g 0.255[0.215, 0.295]
User2 R u 2 0.489[0.473, 0.506]
Bank Marketing R o r i g 0.180[0.159, 0.200]
User1 R u 1 0.551[0.525, 0.577]
R o r i g 0.266[0.23, 0.302]
User2 R u 2 0.643[0.614, 0.672]
Table 5. Fragments of the explanations generated from Adult dataset.
(a) Original Explanation(b) User1 Explanation
class = 1: education = Mastersclass = 1: education = higher_education
           AND occupation = Exec-managerial           AND occupation = managerial
           AND relationship = Husband           AND relationship = Spouse
           AND work_time ≥ 59.8           AND work_time = over_time
..
..
..
class = 0: capital_gain < 871.2class = 0: capital_gain = low
           AND race = White           AND race = White
           AND sex = Female           AND sex = Female
           AND working_class = Self-emp-inc           AND working_class = labor_force
..
..
..
Table 6. Alternative representations of original and user-personalized explanations on Adult dataset.
(a) High-Level Explanation(b) Low-Level Explanation
If a person holds a Master’s degree, works as an executive manager, is husband, and works more than 59.8 h/week, (s)he is likely to earn over $50K.If a person has higher education, holds a management position, has a family, and consistently works overtime, (s)he is likely to earn high income.
..
..
..
If a person has capital gain below 871.2, is white and female, and self-employed, (s)he is likely to earn $50K or less.If a person who is white and female participates in the general workforce, and has low financial gain, (s)he earns low income.
..
..
..
Table 7. Fragments of explanations generated for medical expert and a patient on Heart Disease dataset.
(a) Explanation for a Medical Expert(b)Explanation for a Patient
If a patient presents angina, asymptomatic chest pain, ventricular ECG abnormalities, and any measurable ST segment depression, then heart disease is likely.If you have reported chest discomfort, show signs of irregular heart activity, and test results suggest that your heart may not be getting enough oxygen, you may be at risk of heart disease.
..
..
..
If a patient has no history of cardiovascular disease and presents with normal fasting blood glucose, then the heart disease is not likely.if you have not had any heart problems, and your blood sugar levels are healthy, it is unlikely to have heart disease.
..
..
..
Disclaimer/Publisher’s Note: The statements, opinions and data contained in all publications are solely those of the individual author(s) and contributor(s) and not of MDPI and/or the editor(s). MDPI and/or the editor(s) disclaim responsibility for any injury to people or property resulting from any ideas, methods, instructions or products referred to in the content.

