
Virtual Collaboration and E-Democracy During the Pandemic Era: Insights on Digital Engagement, Infrastructure, and Social Dynamics


 ,
,  ,
, 
Abstract
1. Introduction
2. Theoretical Framework
2.1. The Digital Transformation of Democratic Participation
2.2. Platform-Mediated Democracy and Social Transformation
2.3. Social Dynamics and Demographic Variations in Digital Democracy
3. Materials and Methods
3.1. Research Design and Rationale
3.2. Survey Design and Structure
3.2.1. Instrument Design Process
- Initial Development Phase: Based on a comprehensive literature review, we identified key constructs relevant to virtual collaboration experiences. Initial item pools were created for each construct domain, drawing from validated measures where available and developing new items where necessary.
- Expert Review Phase: The preliminary instrument was evaluated by a panel of six experts in educational technology, organizational psychology, and survey methodology. Experts rated each item’s relevance, clarity, and appropriateness using a content validity index (CVI) approach. Items with CVI scores below 0.78 were either revised or eliminated.
- Cognitive Interview Phase: Ten participants representing diverse demographics engaged in cognitive interviewing while completing the draft survey, providing feedback on item interpretation, response processes, and survey structure. This process identified several problematic items that were subsequently modified or removed.
- Pilot Testing Phase: The revised instrument was pilot-tested with 48 participants from various occupational backgrounds. Statistical analyses, including item-total correlations, inter-item correlations, and preliminary factor analyses, were conducted to evaluate psychometric properties. Cronbach’s alpha coefficients for multi-item scales ranged from 0.72 to 0.89, indicating acceptable internal consistency. The pilot phase also established an estimated completion time of 10–12 min.
3.2.2. Instrument Structure and Content
- Demographics and Background (12 items): Collected information on age, gender, education level, community size, employment/educational role, family status, pre-pandemic experience with teleworking/e-learning, and geographic location. Age was measured in six brackets (18–24, 25–34, 35–44, 45–54, 55–64, and 65+), while community size was categorized as small (rural), medium, large, and metropolitan areas based on population thresholds.
- Digital Infrastructure (14 items): Assessed availability and usability of devices (5-point Likert scale from “completely inadequate” to “completely adequate”), type of internet connection (categorical: fiber optic, ADSL/VDSL, mobile data, other), frequency of connection problems (5-point scale from “never” to “very frequently”), workspace setup quality (5-point scale from “very poor” to “excellent”), and organizational support for remote work/learning (5-point scale from “none” to “comprehensive”).
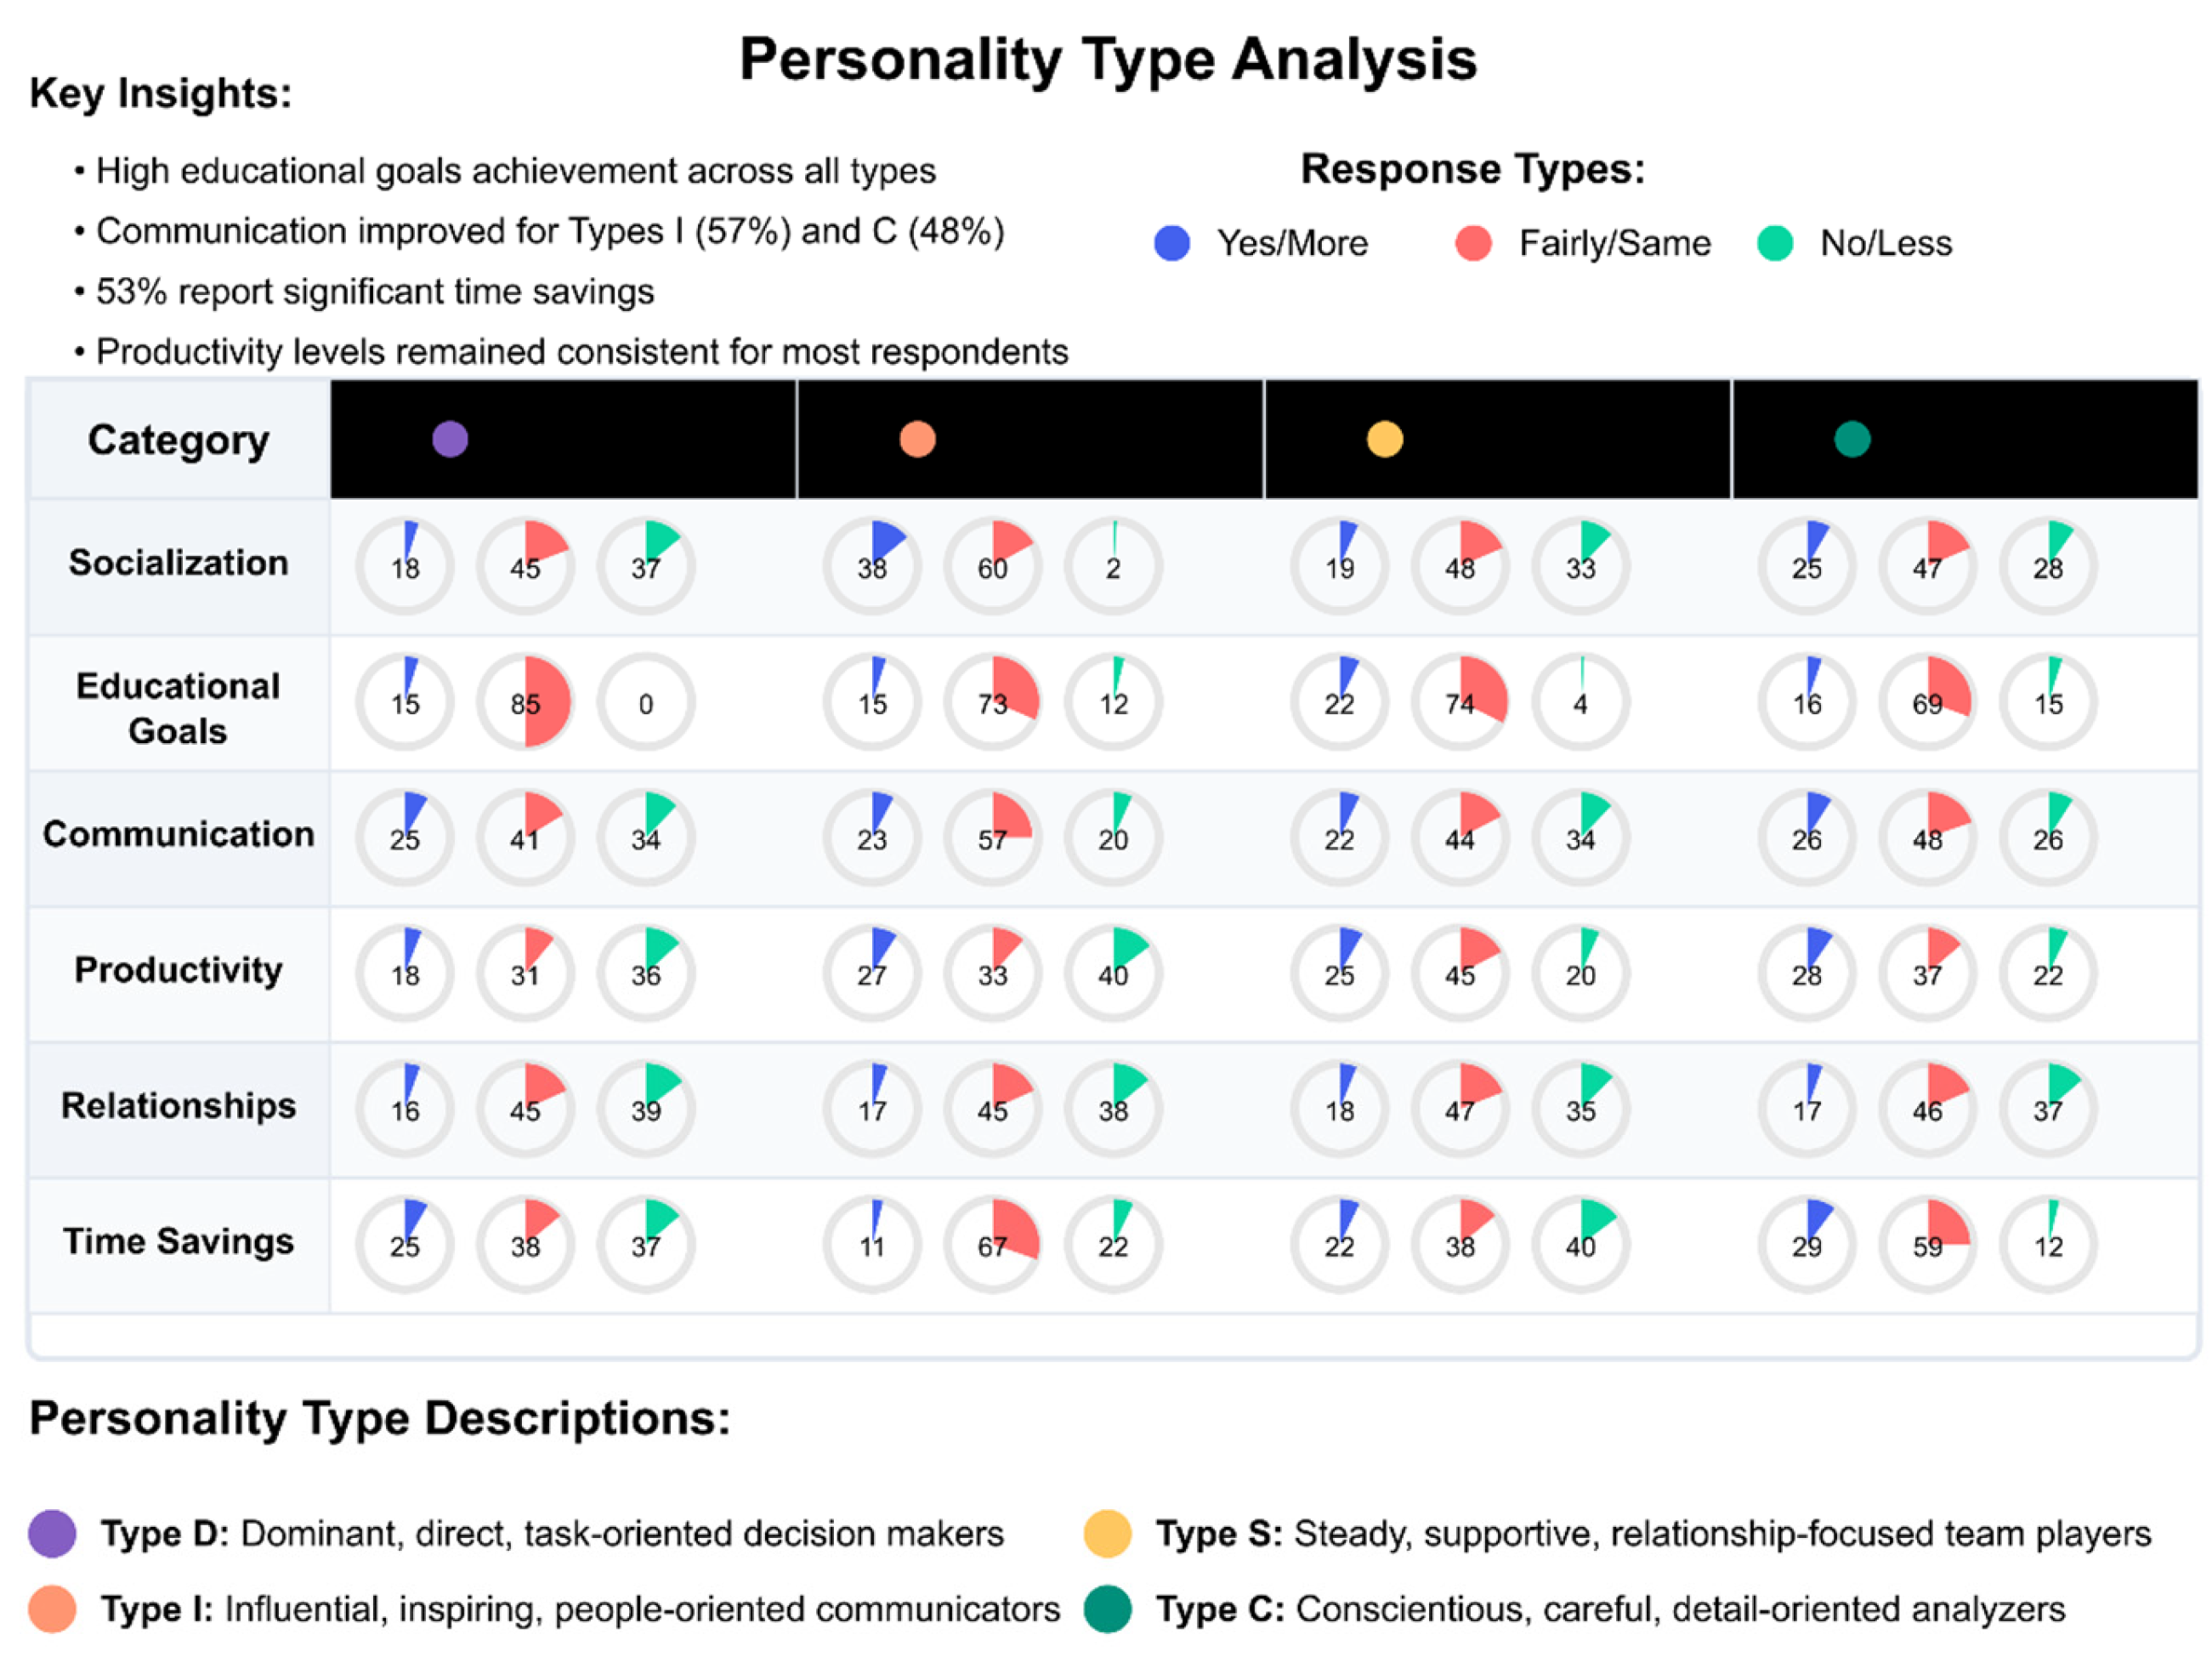
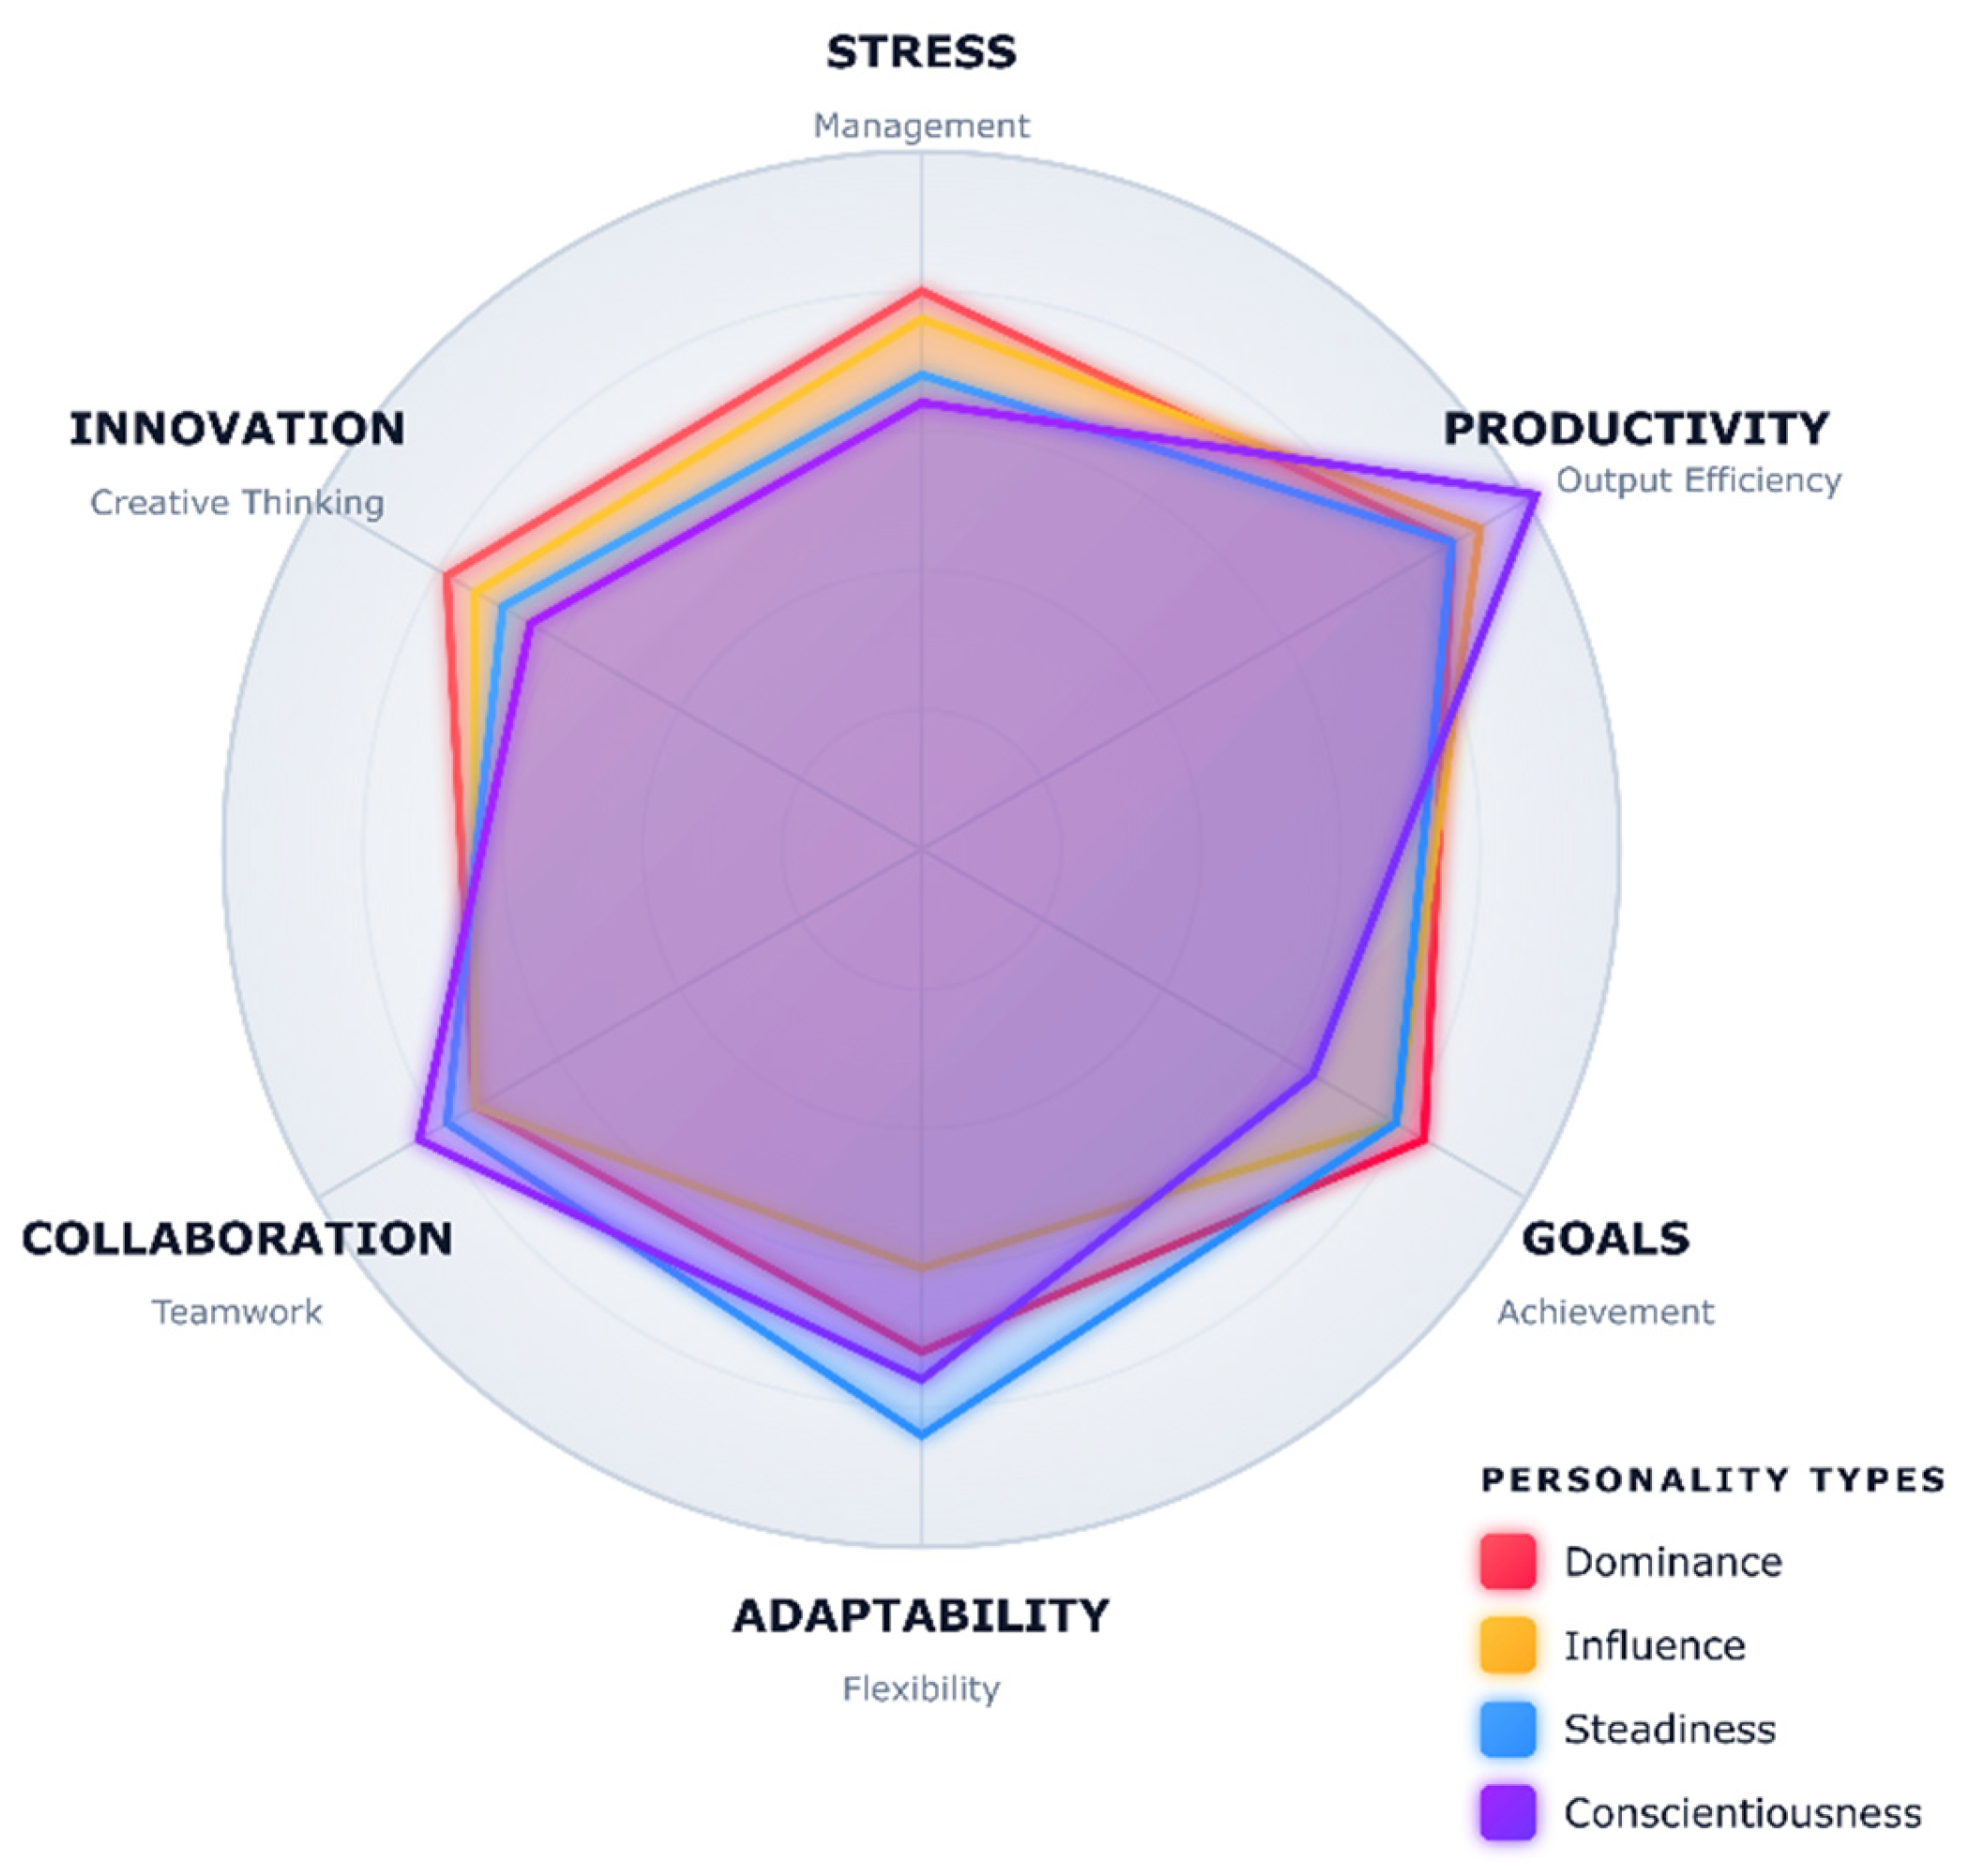
- Personality Assessment (8 items): Incorporated a simplified version of the DISC personality assessment (Dominance, Influence, Steadiness, Conscientiousness), using paired forced-choice items validated in previous studies [84,85]. This abbreviated instrument has demonstrated adequate convergent validity (r = 0.72–0.81) in comparison to full-length DISC assessments in prior research while reducing respondent burden.
- Teleworking and E-Learning Experiences (20 items): Measured key outcome variables including stress levels (5-point scale from “significantly decreased” to “significantly increased”), productivity (5-point scale from “much less productive” to “much more productive”), communication quality (5-point scale from “much worse” to “much better”), educational/work engagement (5-point scale from “much less engaged” to “much more engaged”), and overall satisfaction (5-point scale from “very dissatisfied” to “very satisfied”). Specific subsections were tailored to respondents’ primary roles (student, educator, employee).
- Behavioral and Preference Assessment (8 items): Examined inclination toward hybrid or remote work models (5-point scale from “strong preference for traditional” to “strong preference for remote”), perceptions of fairness in virtual assessments (5-point scale from “much less fair” to “much more fair”), and goal attainment in virtual environments (5-point scale from “goals not achieved” to “goals exceeded”).
3.2.3. Reliability and Validity Assessment
- Internal Consistency: Cronbach’s alpha coefficients were calculated for multi-item scales, with values ranging from 0.74 to 0.91, exceeding the conventional threshold of 0.70 for adequate reliability.
- Test–Retest Reliability: A subset of 42 participants completed the survey twice, two weeks apart, yielding intraclass correlation coefficients ranging from 0.68 to 0.85 across different sections, indicating satisfactory temporal stability.
- Construct Validity: Exploratory factor analysis, using principal components extraction with varimax rotation, confirmed the hypothesized factor structure for the multi-item scales, with factor loadings exceeding 0.50 and minimal cross-loadings.
- Convergent Validity: Where possible, we included established measures alongside our developed items. For example, our abbreviated DISC assessment demonstrated a strong correlation (r = 0.78) with standard DISC inventory results from participants who had previously completed formal assessments.
3.3. Sampling Strategy and Participant Recruitment
3.3.1. Sampling Framework
- Age groups: Minimum quotas established for each age bracket (18–24, 25–34, 35–44, 45–54, 55–64, 65+).
- Gender: Approximately balanced representation of male and female participants.
- Occupational/educational roles: Minimum quotas for university students, school students, educators, public sector employees, private sector employees, and self-employed/freelancers.
- Community sizes: Representation across rural, medium, large, and metropolitan communities.
- Geographic regions: Participants from northern, southern, eastern, western, and central areas of Greece.
3.3.2. Recruitment Methods
- Academic networks: Invitations distributed through university mailing lists at eight institutions across Greece, with coordination through faculty contacts to reach student and staff populations.
- Educational authorities: Collaboration with secondary education administrators to distribute survey invitations to teachers and eligible students (ages 18+) across 24 schools from diverse geographic and socioeconomic contexts.
- Professional associations: Survey invitations were distributed through newsletters and member communications of twelve professional organizations representing diverse sectors (technology, healthcare, public administration, business, and education).
- Social media channels: Targeted advertisements on Facebook, Twitter, and Instagram using demographic filtering to reach underrepresented groups, with strategic boosting of posts to extend reach beyond primary networks.
- Community organizations: Partnerships with local community centers and municipalities to reach populations with potentially limited digital access, including the provision of paper surveys with later digital entry when necessary (accounting for 4.2% of total responses).
3.4. Data Collection Procedures
- Adaptive questioning: Conditional logic to present relevant questions based on participants’ roles and prior responses.
- Progress indicators: Visual feedback showing completion percentage to reduce abandonment.
- Save and resume functionality: Option to save partial responses and complete them later, reducing participant burden.
- Mobile optimization: Responsive design for completion on various devices.
- Accessibility features: Compliance with WCAG 2.1 guidelines for maximum accessibility.
- Require responses to essential items (with “prefer not to answer” options where appropriate).
- Identify logically inconsistent responses.
- Flag unusually rapid completion times that might indicate inattentive responding.
- Prevent duplicate submissions through IP verification and browser cookies.
3.5. Data Validation and Processing
3.5.1. Data Cleaning and Validation
- Completeness verification: Only responses with 100% completion of required items were included in the final dataset. Of 1384 initiated surveys, 1122 (81.1%) met this criterion and were retained for analysis.
- Response time analysis: Submissions completed in less than 5 min (calculated as two standard deviations below the mean completion time) were flagged for manual review, with 36 submissions excluded due to evidence of inattentive responding.
- Attention check analysis: Three embedded attention check items (e.g., “Please select ‘Somewhat agree’ for this question”) were used to identify careless responding, with 42 submissions failing multiple attention checks excluded from the analysis.
- Consistency verification: Logically inconsistent response patterns were identified through cross-validation of related items, with 23 submissions showing systematic inconsistencies, which were excluded from the dataset.
- Outlier detection: Univariate outliers were identified using z-scores (|z| > 3.29) for continuous response variables and examined individually. In most cases, outliers were retained as representing valid extreme experiences, but 14 cases with multiple extreme values inconsistent with overall response patterns were excluded.
3.5.2. Data Processing
- Variable classification: Variables were classified as follows:
- ○
- Categorical (e.g., gender, profession, and internet connection type);
- ○
- Ordinal (e.g., Likert-scale satisfaction scores and agreement levels);
- ○
- Interval (e.g., age brackets and community size categories).
- Scale construction: For multi-item constructs, composite scores were created following psychometric analysis, which confirmed unidimensionality and internal consistency.
- Missing data handling: Although complete responses were required for submission, occasional missing values occurred for non-mandatory items. Given their limited extent, these represented less than 0.5% of all data points and were handled through pairwise deletion in specific analyses rather than imputation.
- Variable transformation: Several variables showed moderate skewness (|skewness| > 1.0) and were transformed to approximate normal distributions where appropriate for parametric analyses. Specifically, log transformations were applied to highly skewed frequency measures, while square root transformations were used for moderately skewed satisfaction scores.
3.6. Statistical Analysis
3.6.1. Descriptive Statistics
- Frequency distributions and percentages for categorical variables.
- Measures of central tendency (mean, median) and dispersion (standard deviation and interquartile range) for ordinal and interval variables.
- Visual representations, including histograms, box plots, and bar charts, to illustrate distributions.
3.6.2. Segmentation Analysis
- Age: Compared experiences across six age brackets using ANOVA with post hoc Tukey tests.
- Gender: Examined differences between male and female participants using t-tests and chi-square analyses.
- Personality traits: Analyzed variations across DISC personality profiles using ANOVA and post hoc comparisons.
- Profession/role: Compared experiences across occupational categories using ANOVA and chi-square tests.
- Community size: Examined differences across four community size categories using ANOVA with trend analysis.
3.6.3. Correlation Analysis
- Spearman’s rho correlation: Used for ordinal and non-normally distributed variables to assess associations between infrastructure characteristics, experiential outcomes, and demographic factors.
- Point-biserial correlation: Applied to examine relationships between dichotomous and continuous variables.
- Partial correlation: Employed to control for potential confounding variables when examining specific relationships.
3.6.4. Advanced Statistical Techniques
- Chi-square tests of independence: Assessed associations between categorical variables (e.g., community size and device usability).
- One-way ANOVA: Compared mean differences across categorical groups with post hoc tests (Tukey HSD or Games–Howell, depending on variance homogeneity) to identify specific group differences.
- Hierarchical regression analysis: Examined predictors of key outcome variables (productivity, stress, satisfaction) while controlling for demographic characteristics.
- Mediation analysis: Explored potential mediating roles of infrastructure quality and personality traits in relationships between demographic factors and experiential outcomes.
3.7. Limitations and Methodological Considerations
- Self-reported data: Despite mitigation strategies, self-reporting remains susceptible to various biases, including social desirability and recall inaccuracy.
- Cross-sectional design: The one-time measurement approach limits causal inference and cannot capture longitudinal changes in experiences throughout the pandemic.
- Sampling limitations: While stratified purposive sampling achieved diversity across key demographics, it does not guarantee full representativeness of the Greek population.
- Geographic concentration: Although participants were recruited from various regions, the sample shows some concentration in urban areas and western Greece, potentially limiting generalizability to other regions.
- Pandemic timing: Data collection occurred after the initial pandemic shock, potentially introducing retrospective biases in recall of early pandemic experiences.
- Language and cultural context: The instrument was developed and administered in Greek, with findings potentially specific to Greek cultural contexts and pandemic response policies.
4. Results
4.1. Demographic Characteristics
4.2. Psychological Aspects and Experiential Patterns
4.2.1. Age-Related Differences in Virtual Collaboration
4.2.2. Community Size and Virtual Experience
4.2.3. Personality Traits and Virtual Adaptation
4.2.4. Family Status and Virtual Experience
4.2.5. Gender Differences in Virtual Experience
4.3. Factors Influencing Remote Work and Learning Outcomes
4.3.1. Gender, Age, and Work–Life Balance
4.3.2. Infrastructure and User Experience
4.3.3. Personality and Experience Factors
4.4. Key Findings Summary for Policy-Makers
5. Discussion
5.1. Key Insights—Interpretation of Results
5.2. Implications for E-Democracy and Digital Governance
5.2.1. Infrastructure as the Foundation of Digital Citizen Participation
5.2.2. Communication Quality as the Mediator of Democratic Engagement
5.2.3. Demographic and Psychological Factors in E-Democratic Inclusion
5.3. Limitations of the Study and Methodological Considerations
5.3.1. Threats to Internal Validity
- Self-reported data limitations: Despite implementing multiple validation strategies (anonymous collection, attention checks, consistency verification), our reliance on self-reported measures introduces potential social desirability and recall biases. This may have particularly affected stress and productivity measures, which could not be objectively verified.
- Cross-sectional design constraints: The one-time measurement approach limits causal inference regarding the relationships between infrastructure, personality traits, and e-democracy outcomes. The identified associations may reflect bidirectional or complex relationships that are not fully captured in our analysis.
- Measurement validity: While we utilized established scales where possible, some constructions (particularly those related to e-democratic participation) required newly developed measures with limited prior validation. The abbreviated DISC assessment, while showing adequate convergent validity with full-length assessments (r = 0.72–0.81), may not capture the full complexity of personality dimensions.
- Potential confounding variables: Despite our efforts to control for key demographic and contextual factors, unmeasured variables (such as pre-pandemic attitudes toward technology or political engagement) may have influenced the relationships observed.
5.3.2. Threats to External Validity
- Sampling limitations: While our stratified purposive sampling achieved diversity across key demographics, it cannot guarantee full representativeness of the broader population. The slight overrepresentation of urban participants (66.5% vs. approximately 60% in the general Greek population) may have affected our assessment of infrastructure challenges.
- Pandemic context specificity: Data collection occurred after the initial pandemic shock, potentially capturing experiences specific to later adaptation stages rather than the whole pandemic experience. This timing may limit the generalizability of the findings to future non-emergency contexts of e-democracy implementation.
- Geographic and cultural context: Our findings are situated within the specific Greek context, including its digital infrastructure landscape, pandemic response policies, and cultural attitudes toward technology and governance. Caution should be exercised when generalizing to other national contexts with different infrastructure conditions or governance traditions.
- Selection bias: Despite efforts to include digitally marginalized populations through paper surveys (4.2% of responses), our methodology inherently favored participants with some level of digital access and comfort, potentially underrepresenting those most severely affected by digital divides.
5.3.3. Mitigation Strategies
- Triangulation of measures: Key constructs were assessed through multiple question formats to enhance reliability and validity.
- Mixed-mode data collection: Including paper surveys for participants with limited digital access.
- Statistical controls: Demographic variables were systematically controlled in analyses to minimize confounding effects.
- Effect size reporting: All findings were assessed not only for statistical significance but for practical significance through appropriate effect size metrics.
- Transparency in limitations: Explicitly acknowledging these constraints to prevent overinterpretation of findings.
5.4. Implications for Future Use of E-Collaboration Tools and Future Work
- Longitudinal studies of e-democratic engagement: Track how citizen participation in digital governance evolves beyond the pandemic crisis context into normalized practice.
- Comparative, cross-cultural analysis: Examine how different cultural contexts, governance traditions, and infrastructure landscapes shape e-democratic participation.
- Platform-specific evaluations: Assess how specific technological design choices within e-governance platforms influence participation patterns across demographic groups.
- Mixed-method approaches: Complement quantitative assessments with in-depth qualitative analysis of participation quality and democratic deliberation in virtual environments.
- Intervention studies: Test the effectiveness of the policy recommendations outlined above through controlled implementation and evaluation.
5.5. Privacy and Data Security
6. Conclusions
Supplementary Materials
Author Contributions
Funding
Institutional Review Board Statement
Informed Consent Statement
Data Availability Statement
Conflicts of Interest
References
- McLeod, J.M.; Scheufele, D.A.; Moy, P. Community, communication, and participation: The role of mass media and interpersonal discussion in local political participation. Political Commun. 1999, 16, 315–336. [Google Scholar] [CrossRef]
- Huckfeldt, R.; Sprague, J. Citizens, Politics, and Social Communication: Information and Influence in an Election Campaign; Cambridge University Press: Cambridge, UK, 1995. [Google Scholar] [CrossRef]
- Antonopoulou, H.; Halkiopoulos, C.; Barlou, O.; Beligiannis, G.N. Transformational Leadership and Digital Skills in Higher Education Institutes: During the COVID-19 Pandemic. Emerg. Sci. J. 2021, 5, 1–15. [Google Scholar] [CrossRef]
- Asimakopoulos, G.; Antonopoulou, H.; Giotopoulos, K.; Halkiopoulos, C. Impact of Information and Communication Technologies on Democratic Processes and Citizen Participation. Societies 2025, 15, 40. [Google Scholar] [CrossRef]
- Frenk, J.; Chen, L.C.; Chandran, L.; Groff, E.O.; King, R.; Meleis, A.; Fineberg, H.V. Challenges and opportunities for educating health professionals after the COVID-19 pandemic. Lancet 2022, 400, 1539–1556. [Google Scholar] [CrossRef]
- Cahaya, A.; Yusriadi, Y.; Gheisari, A. Transformation of the Education Sector during the COVID-19 Pandemic in Indonesia. Educ. Res. Int. 2022, 2022, 8561759. [Google Scholar] [CrossRef]
- Jiang, B.; Li, X.; Liu, S.; Hao, C.; Zhang, G.; Lin, Q. Experience of online learning from COVID-19: Preparing for the future of digital transformation in education. Int. J. Environ. Res. Public Health 2022, 19, 16787. [Google Scholar] [CrossRef]
- Gu, M.M.; Huang, C.F. Transforming habitus and recalibrating capital: University students’ experiences in online learning and communication during the COVID-19 pandemic. Linguist. Educ. 2022, 68, 101057. [Google Scholar] [CrossRef]
- Pregowska, A.; Masztalerz, K.; Garlińska, M.; Osial, M. A worldwide journey through distance education—From the post office to virtual, augmented and mixed realities, and education during the COVID-19 pandemic. Educ. Sci. 2021, 11, 118. [Google Scholar] [CrossRef]
- Katz, E.; Lazarsfeld, P.F. Personal Influence: The Part Played by People in the Flow of Mass Communications; Free Press: Los Angeles, CA, USA, 1955. [Google Scholar]
- Lazarsfeld, P.F.; Berelson, B.; Gaudet, H. The People’s Choice: How the Voter Makes Up His Mind in a Presidential Campaign; Duell, Sloan and Pearce: New York, NY, USA, 1944. [Google Scholar]
- Pietromonaco, P.R.; Overall, N.C. Applying relationship science to evaluate how the COVID-19 pandemic may impact couples’ relationships. Am. Psychol. 2021, 76, 438–450. [Google Scholar] [CrossRef]
- Gioia, F.; Fioravanti, G.; Casale, S.; Boursier, V. The role of online relational closeness and individuals’ online communication in social networking sites use during the COVID-19 pandemic. Front. Psychiatry 2021, 12, 620442. [Google Scholar] [CrossRef]
- Zarzycka, E.; Krasodomska, J.; Mazurczak-Mąka, A.; Turek-Radwan, M. Distance learning during the COVID-19 pandemic: Students’ communication and collaboration and the role of social media. Cogent Arts Humanit. 2021, 8, 1953228. [Google Scholar] [CrossRef]
- Qin, Y.S.; Men, L.R. Exploring the impact of internal communication on employee psychological well-being during the COVID-19 pandemic: The mediating role of employee organizational trust. Int. J. Bus. Commun. 2023, 60, 1197–1219. [Google Scholar] [CrossRef]
- Campione-Barr, N.; Skinner, A.; Moeller, K.; Cui, L.; Kealy, C.; Cookston, J. The role of family relationships on adolescents’ development and adjustment during the COVID-19 pandemic: A systematic review. J. Res. Adolesc. 2025, 35, e12969. [Google Scholar] [CrossRef] [PubMed]
- Hampshire, A.; Hellyer, P.J.; Soreq, E.; Mehta, M.A.; Ioannidis, K.; Trender, W.; Grant, J.E.; Chamberlain, S.R. Associations between dimensions of behaviour, personality traits, and mental health during the COVID-19 pandemic in the United Kingdom. Nat. Commun. 2021, 12, 4111. [Google Scholar] [CrossRef]
- Neill, M.S.; Bowen, S.A. Ethical listening to employees during a pandemic: New approaches, barriers and lessons. J. Commun. Manag. 2021, 25, 57–74. [Google Scholar] [CrossRef]
- Long, E.; Patterson, S.; Maxwell, K.; Blake, C.; Pérez, R.B.; Lewis, R.; McCann, M.; Riddell, J.; Skivington, K.; Wilson-Lowe, R.; et al. COVID-19 pandemic and its impact on social relationships and health. J. Epidemiol. Community Health 2022, 76, 128–132. [Google Scholar] [CrossRef]
- Sommerlad, A.; Marston, L.; Huntley, J.; Livingston, G.; Lewis, G.; Steptoe, A.; Fancourt, D. Social relationships and depression during the COVID-19 lockdown: Longitudinal analysis of the COVID-19 Social Study. Psychol. Med. 2022, 52, 3381–3390. [Google Scholar] [CrossRef]
- Dumlao, R. A Guide to Collaborative Communication for Service-Learning and Community Engagement Partners; Taylor & Francis: London, UK, 2023. [Google Scholar] [CrossRef]
- Halkiopoulos, C.; Gkintoni, E. The Role of Machine Learning in AR/VR-Based Cognitive Therapies: A Systematic Review for Mental Health Disorders. Electronics 2025, 14, 1110. [Google Scholar] [CrossRef]
- Antonopoulou, H.; Halkiopoulos, C.; Gkintoni, E.; Katsimpelis, A. Application of Gamification Tools for Identification of Neurocognitive and Social Function in Distance Learning Education. Int. J. Learn. Teach. Educ. Res. 2022, 21, 367–400. [Google Scholar] [CrossRef]
- Halkiopoulos, C.; Gkintoni, E. Leveraging AI in E-Learning: Personalized Learning and Adaptive Assessment through Cognitive Neuropsychology—A Systematic Analysis. Electronics 2024, 13, 3762. [Google Scholar] [CrossRef]
- Tsai, W.H.S.; Liu, Y.; Chuan, C.H. How chatbots’ social presence communication enhances consumer engagement: The mediating role of parasocial interaction and dialogue. J. Res. Interact. Mark. 2021, 15, 460–482. [Google Scholar] [CrossRef]
- Harsch, C.; Mueller-Karabil, A.; Buchminskaia, E. Addressing the challenges of interaction in online language courses. System 2021, 103, 102673. [Google Scholar] [CrossRef]
- Alam, A.; Mohanty, A. Facial analytics or virtual avatars: Competencies and design considerations for student-teacher interaction in AI-powered online education for effective classroom engagement. In International Conference on Communication, Networks and Computing; Springer: Berlin/Heidelberg, Germany, 2022; pp. 252–265. [Google Scholar] [CrossRef]
- Seo, K.; Tang, J.; Roll, I.; Fels, S.; Yoon, D. The impact of artificial intelligence on learner-instructor interaction in online learning. Int. J. Educ. Technol. High. Educ. 2021, 18, 54. [Google Scholar] [CrossRef] [PubMed]
- Habermas, J. The Structural Transformation of the Public Sphere: An Inquiry into a Category of Bourgeois Society; MIT Press: Cambridge, MA, USA, 1991. [Google Scholar]
- Keane, J. The Life and Death of Democracy; Simon and Schuster: New York, NY, USA, 2009. [Google Scholar]
- Gasser, U.; Tauscher, C. A comparison of digital policy responses to COVID-19. Digit. Gov. Res. Pract. 2021, 2, 1–11. [Google Scholar]
- Custers, B.; Dechesne, F.; Georgieva, I.; Sears, A.M. The COVID-19 contact tracing app: A privacy and security analysis. Comput. Law Secur. Rev. 2022, 44, 105656. [Google Scholar] [CrossRef]
- De Blasio, E.; Sorice, M. E-democracy and digital activism: From divergent paths toward a new frame. JeDEM—Ejournal Edemocracy Open Gov. 2019, 11, 169–182. [Google Scholar]
- Papacharissi, Z. After Democracy: Imagining our Political Future; Yale University Press: New Haven, CT, USA, 2022. [Google Scholar] [CrossRef]
- Schlaufer, C. Why do nondemocratic regimes promote e-participation? The case of Moscow’s active citizen online voting platform. Governance 2021, 34, 689–708. [Google Scholar] [CrossRef]
- Vidačak, I. Beyond usual suspects? Inclusion and influence of non-state actors in online public consultations in Croatia. Soc. Sci. 2022, 11, 436. [Google Scholar] [CrossRef]
- Daft, R.L.; Lengel, R.H. Organizational information requirements, media richness and structural design. Manag. Sci. 1986, 32, 554–571. [Google Scholar] [CrossRef]
- Short, J.; Williams, E.; Christie, B. The Social Psychology of Telecommunications; John Wiley & Sons: Hoboken, NJ, USA, 1976. [Google Scholar]
- Mitchell, A. Collaboration technology affordances from virtual collaboration in the time of COVID-19 and post-pandemic strategies. Inf. Technol. People 2023, 36, 1982–2008. [Google Scholar] [CrossRef]
- Byrnes, K.G.; Kiely, P.A.; Dunne, C.P.; McDermott, K.W.; Coffey, J.C. Communication, collaboration and contagion: “Virtualisation” of anatomy during COVID-19. Clin. Anat. 2021, 34, 82–89. [Google Scholar] [CrossRef] [PubMed]
- Martin, F.; Borup, J. Online learner engagement: Conceptual definitions, research themes, and supportive practices. Educ. Psychol. 2022, 57, 162–177. [Google Scholar] [CrossRef]
- Battista, E.; Alfiero, S.; Leonidou, E. Remote working and digital transformation during the COVID-19 pandemic: Economic-financial impacts and psychological drivers for employees. J. Bus. Res. 2022, 153, 331–343. [Google Scholar] [CrossRef] [PubMed]
- Franken, E.; Bentley, T.; Shafaei, A.; Farr-Wharton, B.; Onnis, L.A.; Omari, M. Forced flexibility and remote working: Opportunities and challenges in the new normal. J. Manag. Organ. 2021, 27, 1131–1149. [Google Scholar] [CrossRef]
- Ratten, V. The post COVID-19 pandemic era: Changes in teaching and learning methods for management educators. Int. J. Manag. Educ. 2023, 21, 100777. [Google Scholar] [CrossRef]
- Adedoyin, O.B.; Soykan, E. COVID-19 pandemic and online learning: The challenges and opportunities. Interact. Learn. Environ. 2020, 31, 863–875. [Google Scholar] [CrossRef]
- Kodama, M. Digitally transforming work styles in an era of infectious disease. Int. J. Inf. Manag. 2020, 55, 102172. [Google Scholar] [CrossRef]
- Antonacopoulou, E.P.; Georgiadou, A. Leading through social distancing: The future of work, corporations and leadership from home. Gend. Work Organ. 2021, 28, 749–767. [Google Scholar] [CrossRef]
- Zheng, Y.; Walsham, G. Inequality of what? An intersectional approach to digital inequality under COVID-19. Inf. Organ. 2021, 31, 100341. [Google Scholar] [CrossRef]
- Nguyen, M.H.; Gruber, J.; Fuchs, J.; Marler, W.; Hunsaker, A.; Hargittai, E. Changes in digital communication during the COVID-19 global pandemic: Implications for digital inequality and future research. Soc. Media + Soc. 2020, 6, 2056305120948255. [Google Scholar] [CrossRef]
- Harari, T.T.; Sela, Y.; Bareket-Bojmel, L. Gen Z during the COVID-19 crisis: A comparative analysis of the differences between Gen Z and Gen X in resilience, values and attitudes. Curr. Psychol. 2023, 42, 11809–11821. [Google Scholar] [CrossRef] [PubMed]
- Lissitsa, S.; Laor, T. Baby Boomers, Generation X and Generation Y: Identifying generational differences in effects of personality traits on on-demand radio use. Technol. Soc. 2021, 64, 101526. [Google Scholar] [CrossRef]
- Eubanks, D.L.; Palanski, M.; Olabisi, J.; Joinson, A.; Dove, J. Team dynamics in virtual, partially distributed teams: Optimal role fulfillment. Comput. Hum. Behav. 2016, 61, 556–568. [Google Scholar] [CrossRef]
- Karasmanaki, E.; Tsantopoulos, G. Impacts of social distancing during COVID-19 pandemic on the daily life of forestry students. Child. Youth Serv. Rev. 2021, 120, 105781. [Google Scholar] [CrossRef]
- Collins, H.; Leonard-Clarke, W.; Mason-Wilkes, W. Scientific conferences, socialization, and the COVID-19 pandemic: A conceptual and empirical enquiry. Soc. Stud. Sci. 2023, 53, 379–401. [Google Scholar] [CrossRef]
- Embrett, M.; Liu, R.H.; Aubrecht, K.; Koval, A.; Lai, J. Thinking together, working apart: Leveraging a community of practice to facilitate productive and meaningful remote collaboration. Int. J. Health Policy Manag. 2020, 10, 342–348. [Google Scholar] [CrossRef]
- Chiesa, V.; Antony, G.; Wismar, M.; Rechel, B. COVID-19 pandemic: Health impact of staying at home, social distancing and lockdown measures—A systematic review of systematic reviews. J. Public Health 2021, 43, e462–e481. [Google Scholar] [CrossRef]
- Bungsraz, S. The changing role of the critical e-citizen wanting democracy. In Upgrading Political Systems with Purposive Technology: A Performing Democracy; Springer Nature Singapore: Singapore, 2024; pp. 415–497. [Google Scholar] [CrossRef]
- Theodorakopoulos, L.; Theodoropoulou, A.; Halkiopoulos, C. Enhancing Decentralized Decision-Making with Big Data and Blockchain Technology: A Comprehensive Review. Appl. Sci. 2024, 14, 7007. [Google Scholar] [CrossRef]
- Verba, S.; Schlozman, K.L.; Brady, H.E. Voice and Equality: Civic Voluntarism in American Politics; Harvard University Press: Cambridge, MA, USA, 1995. [Google Scholar] [CrossRef]
- An, N.; Yu, Q.; Wang, M. Social media reconstructions of urban identity during the COVID-19 pandemic. Geogr. Res. 2022, 61, 71–80, Portico. [Google Scholar] [CrossRef]
- Kiss, G.; Csukás, M.; Oross, D. Social distancing and participation: The case of participatory budgeting in Budapest, Hungary. In The ‘New Normal’ in Planning, Governance and Participation: Transforming Urban Governance in a Post-Pandemic World; Springer International Publishing: Berlin/Heidelberg, Germany, 2023; pp. 125–137. [Google Scholar] [CrossRef]
- Giotopoulos, K.C.; Michalopoulos, D.; Vonitsanos, G.; Papadopoulos, D.; Giannoukou, I.; Sioutas, S. Dynamic Workload Management System in the Public Sector: A Comparative Analysis. Future Internet 2025, 17, 119. [Google Scholar] [CrossRef]
- Falanga, R.; Cebulla, A.; Principi, A.; Socci, M. The participation of senior citizens in policy-making: Patterning initiatives in Europe. Int. J. Environ. Res. Public Health 2021, 18, 34. [Google Scholar] [CrossRef] [PubMed]
- Newman, J.; Mintrom, M.; O’Neill, D. Digital technologies, artificial intelligence, and bureaucratic transformation. Futures 2022, 136, 102886. [Google Scholar] [CrossRef]
- Kashef, M.; Visvizi, A.; Troisi, O. Smart city as a smart service system: Human-computer interaction and smart city surveillance systems. Comput. Hum. Behav. 2021, 124, 106923. [Google Scholar] [CrossRef]
- Nguyen, M.H.; Hargittai, E.; Marler, W. Digital inequality in communication during a time of physical distancing: The case of COVID-19. Comput. Hum. Behav. 2021, 120, 106717. [Google Scholar] [CrossRef]
- Davies, A.R.; Honeyman, M.; Gann, B. Addressing the digital inverse care law in the time of COVID-19: Potential for digital technology to exacerbate or mitigate health inequalities. J. Med. Internet Res. 2021, 23, e21726. [Google Scholar] [CrossRef]
- Cecchi, M.A.; Grant, S.; Seiler, M.; Turner, N.; Adams, R.; Goffin, K. How COVID-19 impacted the tacit knowledge and social interaction of global NPD project teams. Res.-Technol. Manag. 2022, 65, 41–52. [Google Scholar] [CrossRef]
- Orzeł, B.; Wolniak, R. Digitization in the design and construction industry—Remote work in the context of sustainability: A study from Poland. Sustainability 2022, 14, 1332. [Google Scholar] [CrossRef]
- Morgan, A.; Sibson, R.; Jackson, D. Digital demand and digital deficit: Conceptualising digital literacy and gauging proficiency among higher education students. J. High. Educ. Policy Manag. 2022, 44, 258–275. [Google Scholar] [CrossRef]
- Shanmugasundaram, M.; Tamilarasu, A. The impact of digital technology, social media, and artificial intelligence on cognitive functions: A review. Front. Cogn. 2023, 2, 1203077. [Google Scholar] [CrossRef]
- Katz, V.S.; Jordan, A.B.; Ognyanova, K. Digital inequality, faculty communication, and remote learning experiences during the COVID-19 pandemic: A survey of US undergraduates. PLoS ONE 2021, 16, e0246641. [Google Scholar] [CrossRef]
- Barrero, J.M.; Bloom, N.; Davis, S.J. Internet Access and Its Implications for Productivity, Inequality, and Resilience; Working Paper No. 29102; National Bureau of Economic Research: Cambridge, MA, USA, 2021. [Google Scholar] [CrossRef]
- Li, F. Disconnected in a pandemic: COVID-19 outcomes and the digital divide in the United States. Health Place 2022, 76, 102888. [Google Scholar] [CrossRef] [PubMed]
- Stantcheva, S. Inequalities in the times of a pandemic. Econ. Policy 2022, 37, 409–455. [Google Scholar] [CrossRef]
- Byiringiro, S.; Lacanienta, C.; Clark, R.; Evans, C.; Stevens, S.; Reese, M.; Ouyang, P.; Terkowitz, M.; Weston, C.; Galiatsatos, P.; et al. Digital and virtual strategies to advance community stakeholder engagement in research during COVID-19 pandemic. J. Clin. Transl. Sci. 2022, 6, e110. [Google Scholar] [CrossRef] [PubMed]
- Page, K.R.; Wilson, A.; Phillips, K.H.; Flores-Miller, A.; Vazquez, M.G.; Bigelow, B.F.; Bryan, J.N.; Moore, A.; Tolson, T.; McCann, N.; et al. Responding to the disproportionate impact of COVID-19 among Latinx patients in Baltimore: The JHM Latinx anchor strategy. Health Secur. 2022, 20, 230–237. [Google Scholar] [CrossRef]
- Henni, S.H.; Maurud, S.; Fuglerud, K.S.; Moen, A. Facilitators and barriers of people with impairments related to usability and accessibility of digital health solutions, levels of involvement in the design process and strategies for improvement. BMC Public Health 2022, 22, 704. [Google Scholar] [CrossRef]
- Newman, B.; Joseph, K.; Chauhan, A.; Seale, H.; Li, J.; Manias, E.; Walton, M.; Mears, S.; Jones, B.; Harrison, R. Do patient engagement interventions work for all patients? A systematic review and realist synthesis of interventions to enhance patient safety. Health Expect. 2021, 24, 1905–1923. [Google Scholar] [CrossRef]
- Ralph, L.; Jones, M.; Rowe, M.; Millie, A. Maintaining police-citizen relations on social media during the COVID-19 pandemic. Polic. Soc. 2022, 32, 764–777. [Google Scholar] [CrossRef]
- Atad, E.; Lev-On, A.; Yavetz, G. Diplomacy under fire: Engagement with governmental versus non-governmental messages on social media during armed conflicts. Gov. Inf. Q. 2023, 40, 101835. [Google Scholar] [CrossRef]
- Nasir, V.A.; Keserel, A.C.; Surgit, O.E.; Nalbant, M. Segmenting consumers based on social media advertising perceptions: How does purchase intention differ across segments? Telemat. Inform. 2021, 61, 101687. [Google Scholar] [CrossRef]
- Munsch, A. Millennial and Generation Z digital marketing communication and advertising effectiveness: A qualitative exploration. J. Glob. Sch. Mark. Sci. 2021, 31, 288–303. [Google Scholar] [CrossRef]
- Corder, G.W.; Foreman, D.I. Nonparametric Statistics for Non-Statisticians: A Step-by-Step Approach, 2nd ed.; Wiley: Hoboken, NJ, USA, 2014. [Google Scholar]
- Merenda, P.F.; Clarke, W.V. Self description and personality measurement. J. Clin. Psychol. 1965, 21, 52–56. [Google Scholar] [CrossRef] [PubMed]
- Chigova, E.A.; Plyushch, I.V.; Leskova, I.V. Organization of structured interaction on the base of psychographic characteristics within the model of personality traits DISC. IOP Conf. Ser. Mater. Sci. Eng. 2019, 483, 012097. [Google Scholar] [CrossRef]
- Fredricks, J.A.; Blumenfeld, P.C.; Paris, A.H. School engagement: Potential of the concept, state of the evidence. Rev. Educ. Res. 2004, 74, 59–109. [Google Scholar] [CrossRef]
- Kahu, E.R. Framing student engagement in higher education. Stud. High. Educ. 2013, 38, 758–773. [Google Scholar] [CrossRef]
- Plexousakis, S.S.; Kourkoutas, E.; Giovazolias, T.; Chatira, K.; Nikolopoulos, D. School Bullying and Post-traumatic Stress Disorder Symptoms: The Role of Parental Bonding. Front. Public Health 2019, 7, 75. [Google Scholar] [CrossRef]
- Kowalski, R.M.; Giumetti, G.W.; Schroeder, A.N.; Lattanner, M.R. Bullying in the digital age: A critical review and meta-analysis of cyberbullying research among youth. Psychol. Bull. 2020, 140, 1073–1137. [Google Scholar] [CrossRef]
- Liu, Q.; Lin, D. The impact of distance education on the socialization of college students in the Covid-19 era: Problems in communication and impact on mental health. BMC Med. Educ. 2024, 24, 575. [Google Scholar] [CrossRef]
- Organisation for Economic Co-Operation and Development (OECD). Teleworking During the COVID-19 Pandemic: Risks and Opportunities. 2021. Available online: https://www.oecd.org (accessed on 22 March 2025).
- Vassilopoulos, S.P.; Brouzos, A.; Andreou, E. A Multi-Session Attribution Modification Program for Children with Aggressive Behaviour: Changes in Attributions, Emotional Reaction Estimates, and Self-Reported Aggression. Behav. Cogn. Psychother. 2014, 43, 538–548. [Google Scholar] [CrossRef]
- Vaillancourt, T.; Brittain, H.; Krygsman, A.; Farrell, A.H.; Landon, S.; Pepler, D. School bullying before and during COVID-19: Results from a population-based randomized design. Aggress. Behav. 2021, 47, 557–569. [Google Scholar] [CrossRef]
- Wut, T.M.; Xu, J. Person-to-person interactions in online classroom settings under the impact of COVID-19: A social presence theory perspective. Asia Pac. Educ. Rev. 2021, 22, 371–383. [Google Scholar] [CrossRef]
- Zimmerman, B.J. Becoming a self-regulated learner: An overview. Theory Into Pract. 2002, 41, 64–70. [Google Scholar] [CrossRef]
- Ventrella, E. Privacy in emergency circumstances: Data protection and the COVID-19 pandemic. Eur. J. Law Technol. 2020, 11, 379–393. [Google Scholar] [CrossRef]
- Antonopoulou, H.; Giannoulis, A.; Theodorakopoulos, L.; Halkiopoulos, C. Socio-Cognitive Awareness of Inmates through an Encrypted Innovative Educational Platform. Int. J. Learn. Teach. Educ. Res. 2022, 21, 52–75. [Google Scholar] [CrossRef]
- Yang, M.; Wang, L.; Yang, L.; Yu, J.; Chen, D.; Wang, M.; Dong, H.; Yan, J. Spatial mobility change among older Chinese immigrants during the COVID-19 pandemic: The role of physical, social, and virtual environmental factors. Int. J. Environ. Res. Public Health 2025, 22, 406. [Google Scholar] [CrossRef]
- Watermeyer, R.; Crick, T.; Knight, C.; Goodall, J. COVID-19 and digital disruption in UK universities: Afflictions and affordances of emergency online migration. High. Educ. 2021, 81, 623–641. [Google Scholar] [CrossRef]
- Cone, L.; Brøgger, K.; Berghmans, M.; Decuypere, M.; Förschler, A.; Grimaldi, E.; Hartong, S.; Hillman, T.; Ideland, M.; Landri, P.; et al. Pandemic acceleration: COVID-19 and the emergency digitalization of European education. Eur. Educ. Res. J. 2022, 21, 845–868. [Google Scholar] [CrossRef]
- Rowe, F.; González-Leonardo, M.; Champion, T. Virtual special issue: Internal migration in times of COVID-19. Popul. Space Place 2023, 29, e2652. [Google Scholar] [CrossRef]
- Giotopoulos, K.; Michalopoulos, D.; Karras, A.; Karras, C.; Sioutas, S. Modelling and Analysis of Neuro Fuzzy Employee Ranking System in the Public Sector. Algorithms 2023, 16, 151. [Google Scholar] [CrossRef]
- Grinin, L.; Grinin, A.; Korotayev, A. COVID-19 pandemic as a trigger for the acceleration of the cybernetic revolution, transition from e-government to e-state, and change in social relations. Technol. Forecast. Soc. Change 2022, 175, 121348. [Google Scholar] [CrossRef]
- Michalopoulos, D.; Karras, A.; Karras, C.; Sioutas, S.; Giotopoulos, K.C. Neuro-Fuzzy Employee Ranking System in the Public Sector. In Fuzzy Systems and Data Mining VIII; IOS Press: Amsterdam, The Netherlands, 2022. [Google Scholar] [CrossRef]
- Gousteris, S.; Stamatiou, Y.C.; Halkiopoulos, C.; Antonopoulou, H.; Kostopoulos, N. Secure Distributed Cloud Storage based on the Blockchain Technology and Smart Contracts. Emerg. Sci. J. 2023, 7, 469–479. [Google Scholar] [CrossRef]
- Halkiopoulos, C.; Gkintoni, E.; Aroutzidis, A.; Antonopoulou, H. Advances in Neuroimaging and Deep Learning for Emotion Detection: A Systematic Review of Cognitive Neuroscience and Algorithmic Innovations. Diagnostics 2025, 15, 456. [Google Scholar] [CrossRef] [PubMed]
- Gkintoni, E.; Aroutzidis, A.; Antonopoulou, H.; Halkiopoulos, C. From Neural Networks to Emotional Networks: A Systematic Review of EEG-Based Emotion Recognition in Cognitive Neuroscience and Real-World Applications. Brain Sci. 2025, 15, 220. [Google Scholar] [CrossRef] [PubMed]
- Korkmaz, Ö.; Erer, E.; Erer, D. Internet access and its role on educational inequality during the COVID-19 pandemic. Telecommun. Policy 2022, 46, 102353. [Google Scholar] [CrossRef]
- Stamatiou, Y.C.; Halkiopoulos, C.; Giannoulis, A.; Antonopoulou, H. Utilizing a Restricted Access e-Learning Platform for Reform, Equity, and Self-development in Correctional Facilities. Emerg. Sci. J. 2022, 6, 241–252. [Google Scholar] [CrossRef]
- Halkiopoulos, C.; Papadopoulos, A.; Stamatiou, Y.C.; Theodorakopoulos, L.; Vlachos, V. A Digital Service for Citizens: Multi-Parameter Optimization Model for Cost-Benefit Analysis of Cybercrime and Cyberdefense. Emerg. Sci. J. 2024, 8, 1320–1344. [Google Scholar] [CrossRef]
- Azubuike, O.B.; Adegboye, O.; Quadri, H. Who gets to learn in a pandemic? Exploring the digital divide in remote learning during the COVID-19 pandemic in Nigeria. Int. J. Educ. Res. Open 2021, 2, 100022. [Google Scholar] [CrossRef]
- Imran, A. Why addressing digital inequality should be a priority. Electron. J. Inf. Syst. Dev. Ctries. 2023, 89, e12255. [Google Scholar] [CrossRef]
- Yao, R.; Zhang, W.; Evans, R.; Cao, G.; Rui, T.; Shen, L. Inequities in health care services caused by the adoption of digital health technologies: Scoping review. J. Med. Internet Res. 2022, 24, e34144. [Google Scholar] [CrossRef]
- Giotopoulos, K.C.; Michalopoulos, D.; Vonitsanos, G.; Papadopoulos, D.; Giannoukou, I.; Sioutas, S. Dynamic Workload Management System in the Public Sector. Information 2024, 15, 335. [Google Scholar] [CrossRef]
- Karras, A.; Karras, C.; Giotopoulos, K.C.; Tsolis, D.; Oikonomou, K.; Sioutas, S. Federated Edge Intelligence and Edge Caching Mechanisms. Information 2023, 14, 414. [Google Scholar] [CrossRef]
- Theodorakopoulos, L.; Theodoropoulou, A.; Klavdianos, C. Interactive Viral Marketing Through Big Data Analytics, Influencer Networks, AI Integration, and Ethical Dimensions. J. Theor. Appl. Electron. Commer. Res. 2025, 20, 115. [Google Scholar] [CrossRef]

| Variable Pair | Correlation Coefficient (ρ) | p-Value | n |
|---|---|---|---|
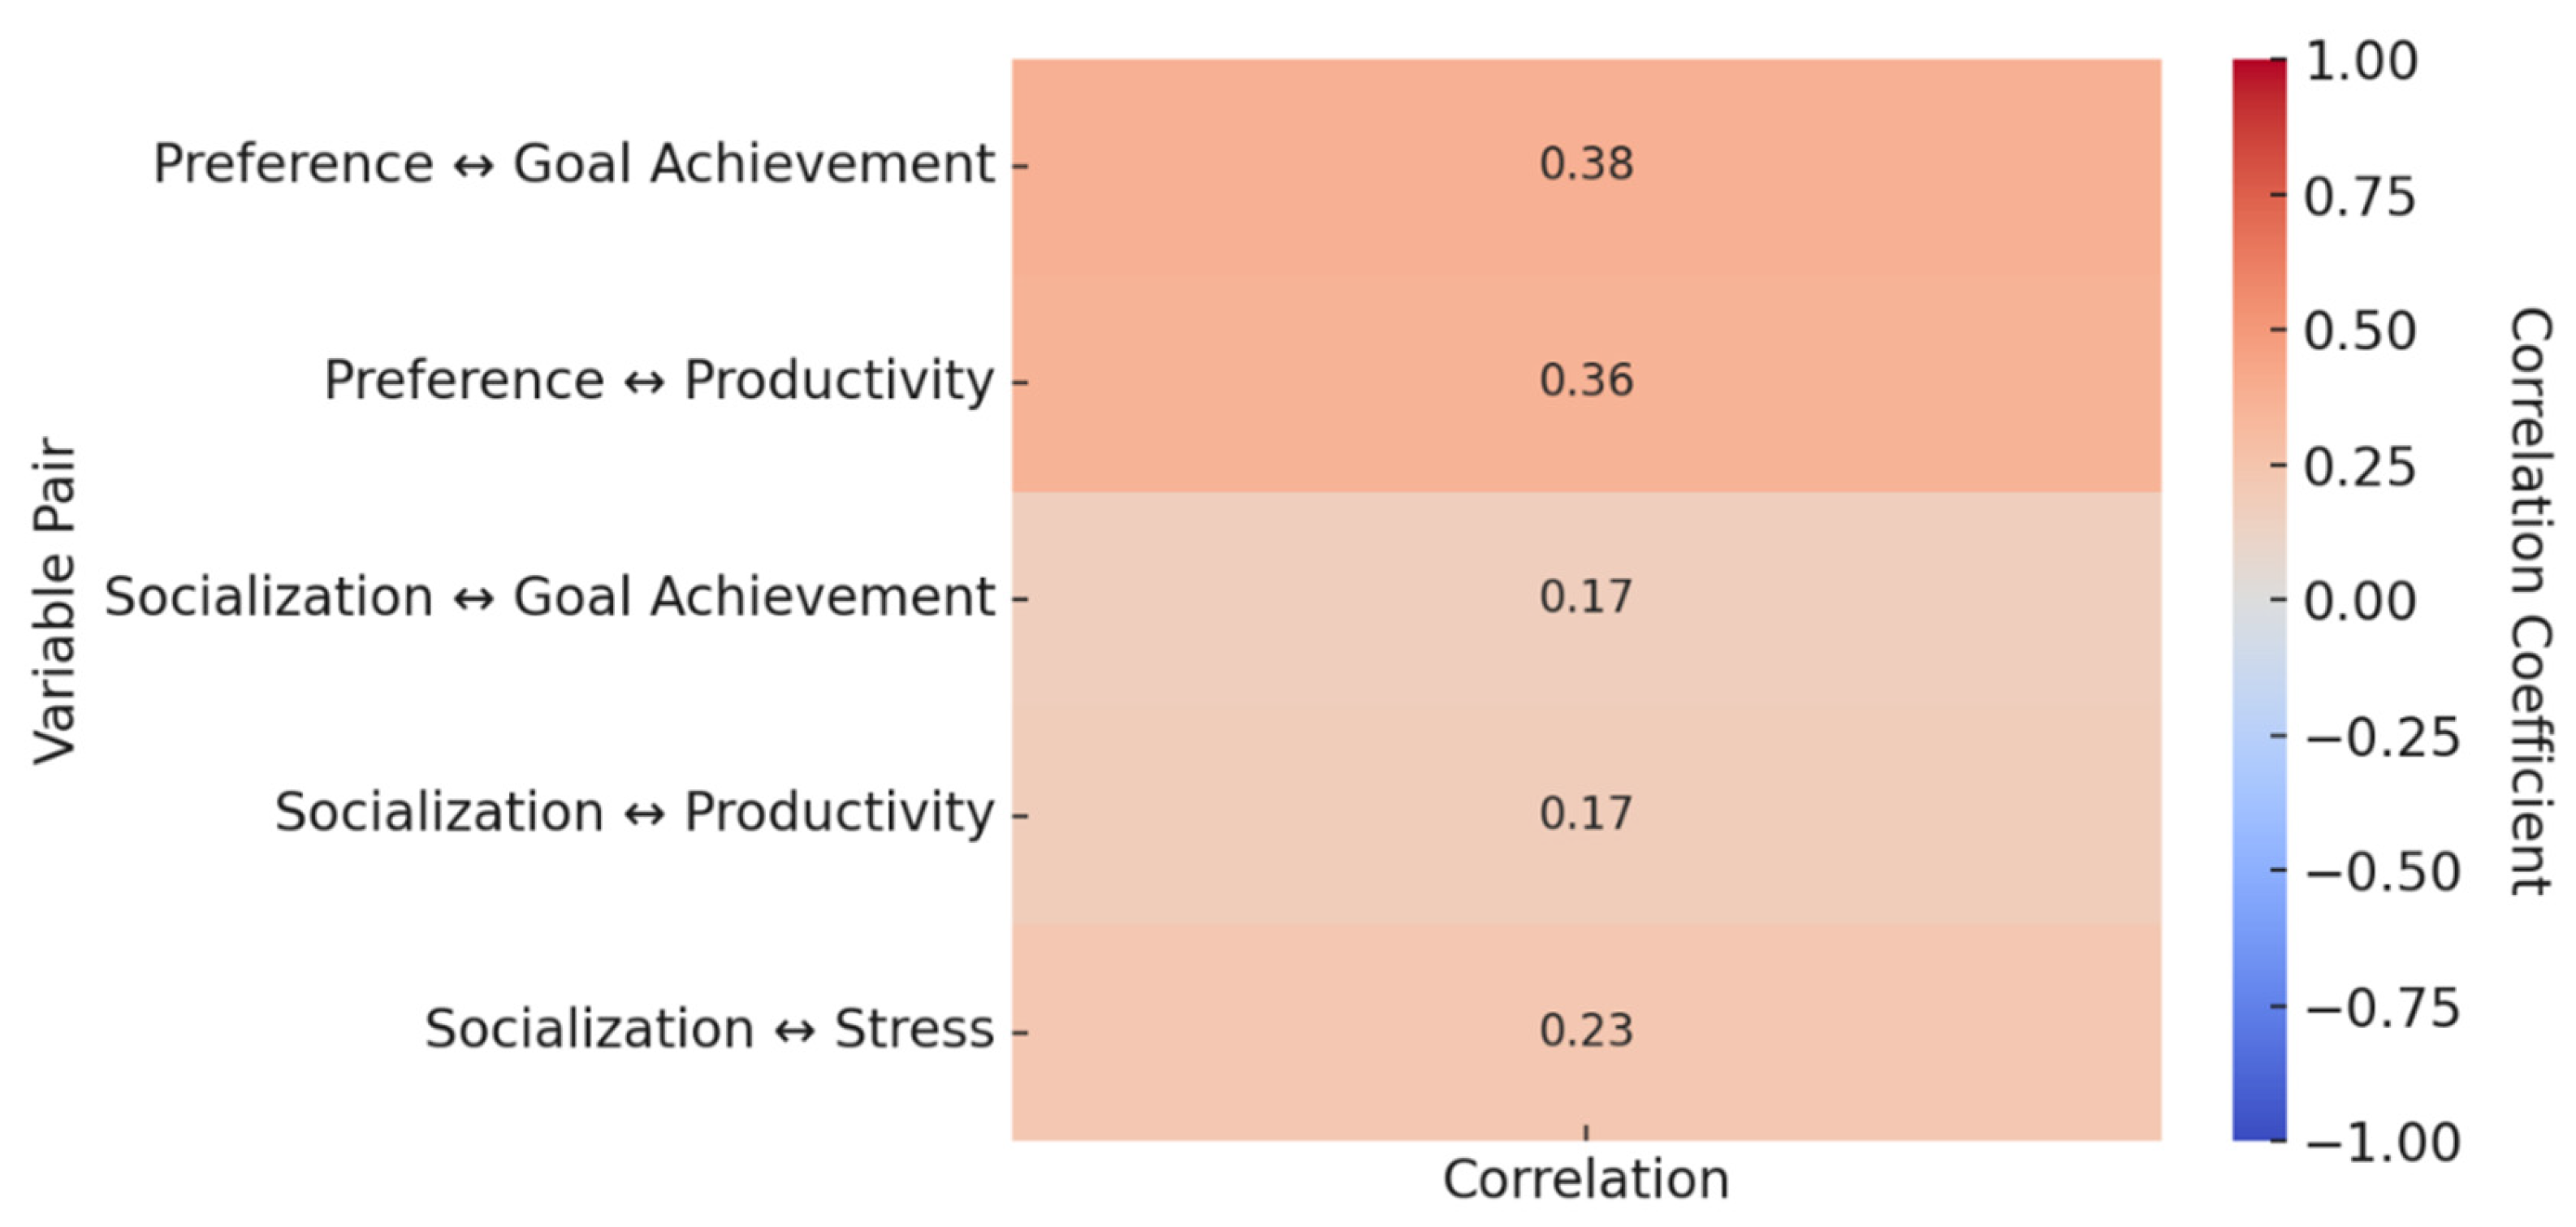
| Preference for Teleworking/e-Learning ↔ Productivity | 0.362 | <0.001 | 374 |
| Preference for Teleworking/e-Learning ↔ Educational Goal Achievement | 0.378 | <0.001 | 742 |
| Impact on Socialization ↔ Teleworking/e-Learning Stress | 0.229 | <0.001 | 374 |
| Impact on Socialization ↔ Productivity | 0.173 | <0.001 | 374 |
| Impact on Socialization ↔ Educational Goal Achievement | 0.167 | <0.001 | 742 |
| Variable Pair | Correlation Coefficient (ρ) | p-Value | n |
|---|---|---|---|
| Communication Effectiveness ↔ Relationship Quality | 0.387 | <0.001 | 1116 |
| Communication Effectiveness ↔ Teleworking/e-Learning Stress | 0.256 | <0.001 | 374 |
| Preference for Teleworking/e-Learning ↔ Communication | 0.324 | <0.001 | 1116 |
| Internet Quality ↔ Productivity | 0.134 | 0.009 | 374 |
| Internet Quality ↔ Educational Goal Achievement | 0.117 | 0.001 | 742 |
| Internet Quality ↔ Preference for Teleworking | 0.100 | <0.001 | 1116 |
| Variable Pair | Statistical Method | Test Value | df | p-Value | Effect Size |
|---|---|---|---|---|---|
| Gender ↔ Preference for Teleworking/e-Learning | Pearson Chi-Square | 4.201 | 2 | 0.122 | V = 0.061 |
| Age ↔ Preference for Teleworking/e-Learning | Pearson Chi-Square | 90.364 | 12 | <0.001 | V = 0.201 |
| Gender ↔ Work–Life Balance | Pearson Chi-Square | 3.779 | 4 | 0.437 | V = 0.071 |
| Age ↔ Work–Life Balance | Pearson Chi-Square | 11.695 | 8 | 0.165 | V = 0.125 |
| Work–Life Balance Changes ↔ Household Cost Impact | Spearman’s rho | 0.024 | - | 0.640 | - |
| Work–Life Balance Changes ↔ Time Savings | Spearman’s rho | 0.224 | - | <0.001 | - |
| Fairness of Compensation ↔ Household Cost Impact | Spearman’s rho | 0.094 | - | 0.123 | - |
| Variable Pair | Statistical Method | Test Value | df | p-Value | Effect Size |
|---|---|---|---|---|---|
| Connection Type ↔ Connectivity Issues | Pearson Chi-Square | 83.195 | 12 | <0.001 | V = 0.157 |
| Community Size ↔ Internet Connectivity Issues | Pearson Chi-Square | 70.723 | 12 | <0.001 | V = 0.145 |
| Community Size ↔ Productivity | Pearson Chi-Square | 27.200 | 9 | 0.001 | V = 0.156 |
| Community Size ↔ Preference | Pearson Chi-Square | 19.711 | 6 | 0.003 | V = 0.094 |
| Device Suitability ↔ Educational Goal Achievement | Spearman’s rho | 0.091 | - | 0.013 | - |
| Device Suitability ↔ Productivity | Spearman’s rho | −0.042 | - | 0.418 | - |
| Connectivity Issues ↔ Productivity | Spearman’s rho | 0.134 | - | 0.009 | - |
| Connectivity Issues ↔ Educational Goal Achievement | Spearman’s rho | 0.117 | - | 0.001 | - |
| Variable Pair | Statistical Method | Test Value | df | p-Value | Effect Size |
|---|---|---|---|---|---|
| DISC Test ↔ Educational Goal Achievement | Pearson Chi-Square | 24.667 | 12 | 0.016 | V = 0.105 |
| DISC Test ↔ Productivity | Pearson Chi-Square | 13.244 | 9 | 0.152 | V = 0.109 |
| DISC Test ↔ Stress Levels | Pearson Chi-Square | 7.290 | 6 | 0.295 | V = 0.099 |
| DISC Test ↔ Work–Life Balance | Pearson Chi-Square | 4.141 | 6 | 0.658 | - |
| DISC Test ↔ Communication Effectiveness | Pearson Chi-Square | 15.595 | 6 | 0.016 | V = 0.084 |
| DISC Test ↔ Relationship Quality | Pearson Chi-Square | 4.783 | 6 | 0.572 | V = 0.046 |
| DISC Test ↔ Socialization Shifts | Pearson Chi-Square | 62.682 | 12 | <0.001 | V = 0.137 |
| DISC Test ↔ Preference for Teleworking/e-Learning | Pearson Chi-Square | 14.930 | 6 | 0.021 | V = 0.082 |
| Research Finding | Statistical Evidence | Effect Size and Practical Importance | Real-World Meaning | Policy Priority Level | Recommended Action |
|---|---|---|---|---|---|
| Rural-Urban Digital Divide | χ2(12) = 70.72, p < 0.001 | V = 0.145—Medium-High (14% of connectivity variation explained) | Rural residents experience significantly more connectivity problems, directly limiting e-democracy participation | HIGH PRIORITY | Immediate rural broadband expansion and infrastructure investment |
| Communication Quality Impact | ρ = 0.387, p < 0.001 | Medium-Large effect (~15% of relationship success explained) | Better virtual communication tools substantially improve democratic engagement and satisfaction | HIGH PRIORITY | Invest in advanced communication platforms and user training programs |
| Age-Related Digital Adaptation | F(4,369) = 8.36, p < 0.001 | η2 = 0.08—Medium (8% of satisfaction variance explained) | Mid-career adults (25–44) adopt best; younger and older adults face distinct challenges | MEDIUM PRIORITY | Develop an age-responsive interface design and targeted support |
| Personality and Virtual Socialization | χ2(12) = 62.68, p < 0.001 | V = 0.137—Medium (~14% of socialization patterns explained) | Different personality types require different virtual interaction approaches | MEDIUM PRIORITY | Include diverse communication styles and interaction options in platform design |
| Family Status and Stress | F(4,369) = 11.27, p < 0.001 | η2 = 0.11—Medium (11% of stress variance explained) | Single parents experience significantly higher stress in virtual environments | MEDIUM PRIORITY | Develop family-friendly virtual participation options and childcare support |
| Gender and Virtual Stress | t(372) = 3.47, p < 0.001 | d = 0.36—Small-Medium effect | Women report higher stress levels in teleworking environments | MEDIUM PRIORITY | Address work–life balance and household responsibility inequities |
| Device Adequacy Impact | ρ = 0.091, p = 0.013 | Small effect (<1% of achievement explained) | Device quality has minimal impact compared to infrastructure and communication factors | LOW PRIORITY | Monitor but focus resources on higher-impact interventions |
| Organizational Support | No significant correlation with major outcomes | Minimal practical impact | Generic organizational support shows limited effectiveness | LOW PRIORITY | Replace generic support with targeted interventions based on the above findings |
Disclaimer/Publisher’s Note: The statements, opinions and data contained in all publications are solely those of the individual author(s) and contributor(s) and not of MDPI and/or the editor(s). MDPI and/or the editor(s) disclaim responsibility for any injury to people or property resulting from any ideas, methods, instructions or products referred to in the content. |
© 2025 by the authors. Licensee MDPI, Basel, Switzerland. This article is an open access article distributed under the terms and conditions of the Creative Commons Attribution (CC BY) license (https://creativecommons.org/licenses/by/4.0/).
Share and Cite
Asimakopoulos, G.; Antonopoulou, H.; Giannoukou, I.; Golfi, A.; Sataraki, I.; Halkiopoulos, C. Virtual Collaboration and E-Democracy During the Pandemic Era: Insights on Digital Engagement, Infrastructure, and Social Dynamics. Information 2025, 16, 492. https://doi.org/10.3390/info16060492
Asimakopoulos G, Antonopoulou H, Giannoukou I, Golfi A, Sataraki I, Halkiopoulos C. Virtual Collaboration and E-Democracy During the Pandemic Era: Insights on Digital Engagement, Infrastructure, and Social Dynamics. Information. 2025; 16(6):492. https://doi.org/10.3390/info16060492
Chicago/Turabian StyleAsimakopoulos, George, Hera Antonopoulou, Ioanna Giannoukou, Antonia Golfi, Ioanna Sataraki, and Constantinos Halkiopoulos. 2025. "Virtual Collaboration and E-Democracy During the Pandemic Era: Insights on Digital Engagement, Infrastructure, and Social Dynamics" Information 16, no. 6: 492. https://doi.org/10.3390/info16060492
APA StyleAsimakopoulos, G., Antonopoulou, H., Giannoukou, I., Golfi, A., Sataraki, I., & Halkiopoulos, C. (2025). Virtual Collaboration and E-Democracy During the Pandemic Era: Insights on Digital Engagement, Infrastructure, and Social Dynamics. Information, 16(6), 492. https://doi.org/10.3390/info16060492