1. Introduction
Systems analysts are responsible for investigating client data and developing plans to improve information systems (
https://esco.ec.europa.eu/en/classification/occupation_main (accessed on 8 February 2025)). Job positions belonging to this category are related to some popular occupations, including data analysts, data scientists, artificial intelligence engineers, as well as green and Information and Communication Technology (ICT) consultants. In total, data science and scientists are associated with applications covering different domains and sectors such as banking, healthcare, sports, and marketing [
1], meaning that systems analysts can be occupied in diverse areas of interest as well. As a result, systems analysts should be considered an important job category for supporting valuable infrastructures and services. Due to the plethora of technical content and various ICT principles surrounding relevant jobs and organizations, it is evident that systems analysts should possess various skills, which may concern project management, databases, system development, and relevant tools and programming languages, e.g., SQL and Microsoft Office [
2]. Complementary to hard and technical skills, jobs of this type can also require soft skills related to analysis and problem-solving, communication, and teamwork [
3].
To study skills concerning a unique occupation or job category, like systems analysts, online job advertisements are the primary data type among other potential resources, e.g., surveys and interviews. For this purpose, a variety of techniques are used for extracting skill analytics, where Natural Language Processing (NLP), statistical methods, machine learning, and graph theory are some of the usual choices [
4,
5,
6,
7]. Among the many use cases of skill information, one of the prevalent relevant objectives concerns skill analytics. In experiments of this type, skills within online job advertisements are studied for evaluating patterns, via skill frequencies and co-frequencies, to address various research directions, such as skill demand and gaps [
4], and group characteristics, e.g., types of skills–competences [
5] and regions [
6,
7].
Since systems analysts constitute an important part of organizations from different domains and variant scopes, both the research and industrial communities may benefit from insights covering the relevant skills demand and respective requirements of the various sectors. Thus, the current study addresses the existing research gaps concerning the current skill demand of systems analysts in Europe as well as the key characteristics of the different sectors associated with jobs of this type. Overall, we aim to provide answers to three Research Questions (RQs) reflecting the aforementioned objectives. To do so, an RShiny tool (
https://github.com/koncharman/ClickTMtool (accessed on 13 February 2025)) that was developed as part of an EU-funded project (
https://skillab-project.eu/ (accessed on 17 February 2025)) is utilized. This tool offers functionalities for conducting content analysis and group comparisons via data importing, topic extraction, statistical analysis, and machine learning.
To fulfill the goals of this study, a dataset comprising online job advertisements from EUROSTAT (
https://ec.europa.eu/eurostat (accessed on 19 February 2025) of systems analysts is collected, where each observation is associated with a set of digital skills (201 overall) and a unique sector (17 distinct sectors are investigated). These skills are annotated based on the European Skills, Competences, Qualifications, and Occupations (ESCO) taxonomy. Next, the main areas of interest (or topics) surrounding these skills are evaluated through skill frequencies and cluster analysis. Furthermore, the similarities and differences between the sectors are detected through statistical analysis and machine learning, where, in the end, the most unique sectors are discovered as well. By extending the previous analysis, the final procedures of the case study include the identification of the key characteristics of each sector along with the key sectors per topic. To this end, the relative frequency of digital skills and skill topics are considered to track unanticipated frequencies and potential strong relations between sectors and concepts. In multiple cases, significant relative frequencies are uncovered and can be studied as baselines for investigating specific skill groups or sectors according to the preferences of a third party, e.g., individuals or organizations.
The main contribution of this study is the provision of insights on the primary skills required from systems analysts in general and within sectors, which can prove useful to both organizations and individuals for multiple purposes. These purposes can be related to creating learning material and pathways, organizing career paths, evaluating skill gaps, and identifying suitable job candidates. Nonetheless, multiple studies focus on specific occupations, like data scientists [
1,
8] and data analysts [
9], instead of gathering insights concerning the job category of systems analysts. Also, while labor market analytics is considered a frequent concept, more specific research directions like sectoral analysis combined with skill-based investigations can be considered a less common subject. Thus, the current study may also provide valuable ideas for future research that can be expanded to other data properties apart from sectors, e.g., countries and occupations.
The remainder of this study is organized as follows:
Section 2 contains the related work associated with projects combining the ESCO taxonomy with online job advertisements.
Section 3 first presents the RQs and dataset of this study (
Section 3.1) as well as the tool and individual methods used to provide answers to these RQs (
Section 3.2), i.e., preprocessing (
Section 3.2.1) and analysis (
Section 3.2.2).
Section 4 demonstrates the results of this study, which are organized according to the main RQs.
Section 5 provides extensive discussion about the insights, potential use cases, and contributions of the presented methods and findings. Finally,
Section 6 concludes the paper and proposes ideas for future work. A list of all abbreviations in the paper can be found in the
Appendix A, in
Table A1.
2. Literature Review
This section presents the related work of the current study concerning the potential use cases of the ESCO taxonomy when it comes to online job advertisements and skills. In general, the information of the ESCO taxonomy is often combined with many data sources to satisfy variant purposes, apart from online job advertisements. These data types may include other relevant taxonomies [
4], resources associated with the labor market demand and supply, e.g., courses [
4,
10,
11], CVs [
10,
11], information and innovations from the literature [
12], and surveys and interviews [
13].
Regarding the main objectives of projects exploring online job advertisements, the ESCO taxonomy can be leveraged as a valuable knowledge base towards extracting the main skills from online job advertisements with the use of NLP techniques [
4,
10,
11,
14]. By conducting experiments of this type, researchers can study the extracted skills and address various objectives related to skill demand [
15] and skill gaps [
14]. When it comes to skill gaps and matching, prior studies also extract skills within online job advertisements and other types of data, e.g., CVs [
10,
11] and courses [
4,
10,
11], to evaluate individuals or potentially improve learning and training material.
Similarly, existing projects are oriented to assist individuals by developing systems and methods with skill or job recommendation mechanisms [
16,
17], which are some ideas that can indeed offer meaningful guidelines and elevate the labor market. Studies of this nature aim at the improvement of individuals, i.e., usually students or employees, by evaluating employees as well as examining job requirements through skill extraction, to ultimately build job profiles. Complementary to improving employee performance, experiments of this type may assist the planning procedures of organizations by detecting the most suitable candidates and creating effective courses concerning job requirements.
One other relevant area of interest is associated with existing taxonomies, which are investigated along with the textual information and skills of online job advertisements. The common task in this case is to utilize the ESCO taxonomy individually or with other ontologies to develop or refine taxonomies/ontologies by analyzing and extracting information from external data sources, including online job advertisements [
18,
19,
20,
21]. The potential changes may concern a variety of purposes, including the assessment of new occupations [
19,
20] and the improvement of recommendation systems [
21], which can lead to establishing new data structures capturing the status of the labor market more accurately.
Regarding data analytics, which is closer to the concepts and outcomes of this study, Giabelli et al. [
6] show that by evaluating the skills and occupations derived from online job advertisements, researchers can extract valuable insights for addressing gaps between a plethora of entities (countries in this case). In this context, Kahlawi et al. [
7] investigate and compare the skill sets required by different occupations and regions and indeed capture some significant similarities and divergences between these different entities. Using similar approaches, Mankevich and Svahn [
15] develop a framework for categorizing job posts with 135 digital competencies to ultimately compare different business units and recruitment types, as well as address the overall skill demand in an automotive company.
Overall, the existing studies show that the skills within online job advertisements can be studied at various levels to uncover similar and distant entities, e.g., regions, occupations, and sectors, and eventually address meaningful research gaps. In addition, researchers have dedicated some of their work to exploring specific types of skills, e.g., digital skills [
14], to offer information covering specific areas of interest. In total, the two aforementioned observations support the significance of the current study when it comes to investigating digital skills within different sectors, as previous works investigated digital skills along with various properties characterizing online job advertisements.
4. Experimental Results
This section presents the main results of this study, reflecting the primary digital skills of system analysts and the key characteristics of each sector. This section is organized according to the presented RQs, where the main skills and skill topics are demonstrated and discussed in
Section 4.1 (RQ
1), the evaluations regarding the potential distinction of each sector are presented in
Section 4.2 (RQ
2), and
Section 4.3 presents the key digital skills and skill topics of each sector (RQ
3).
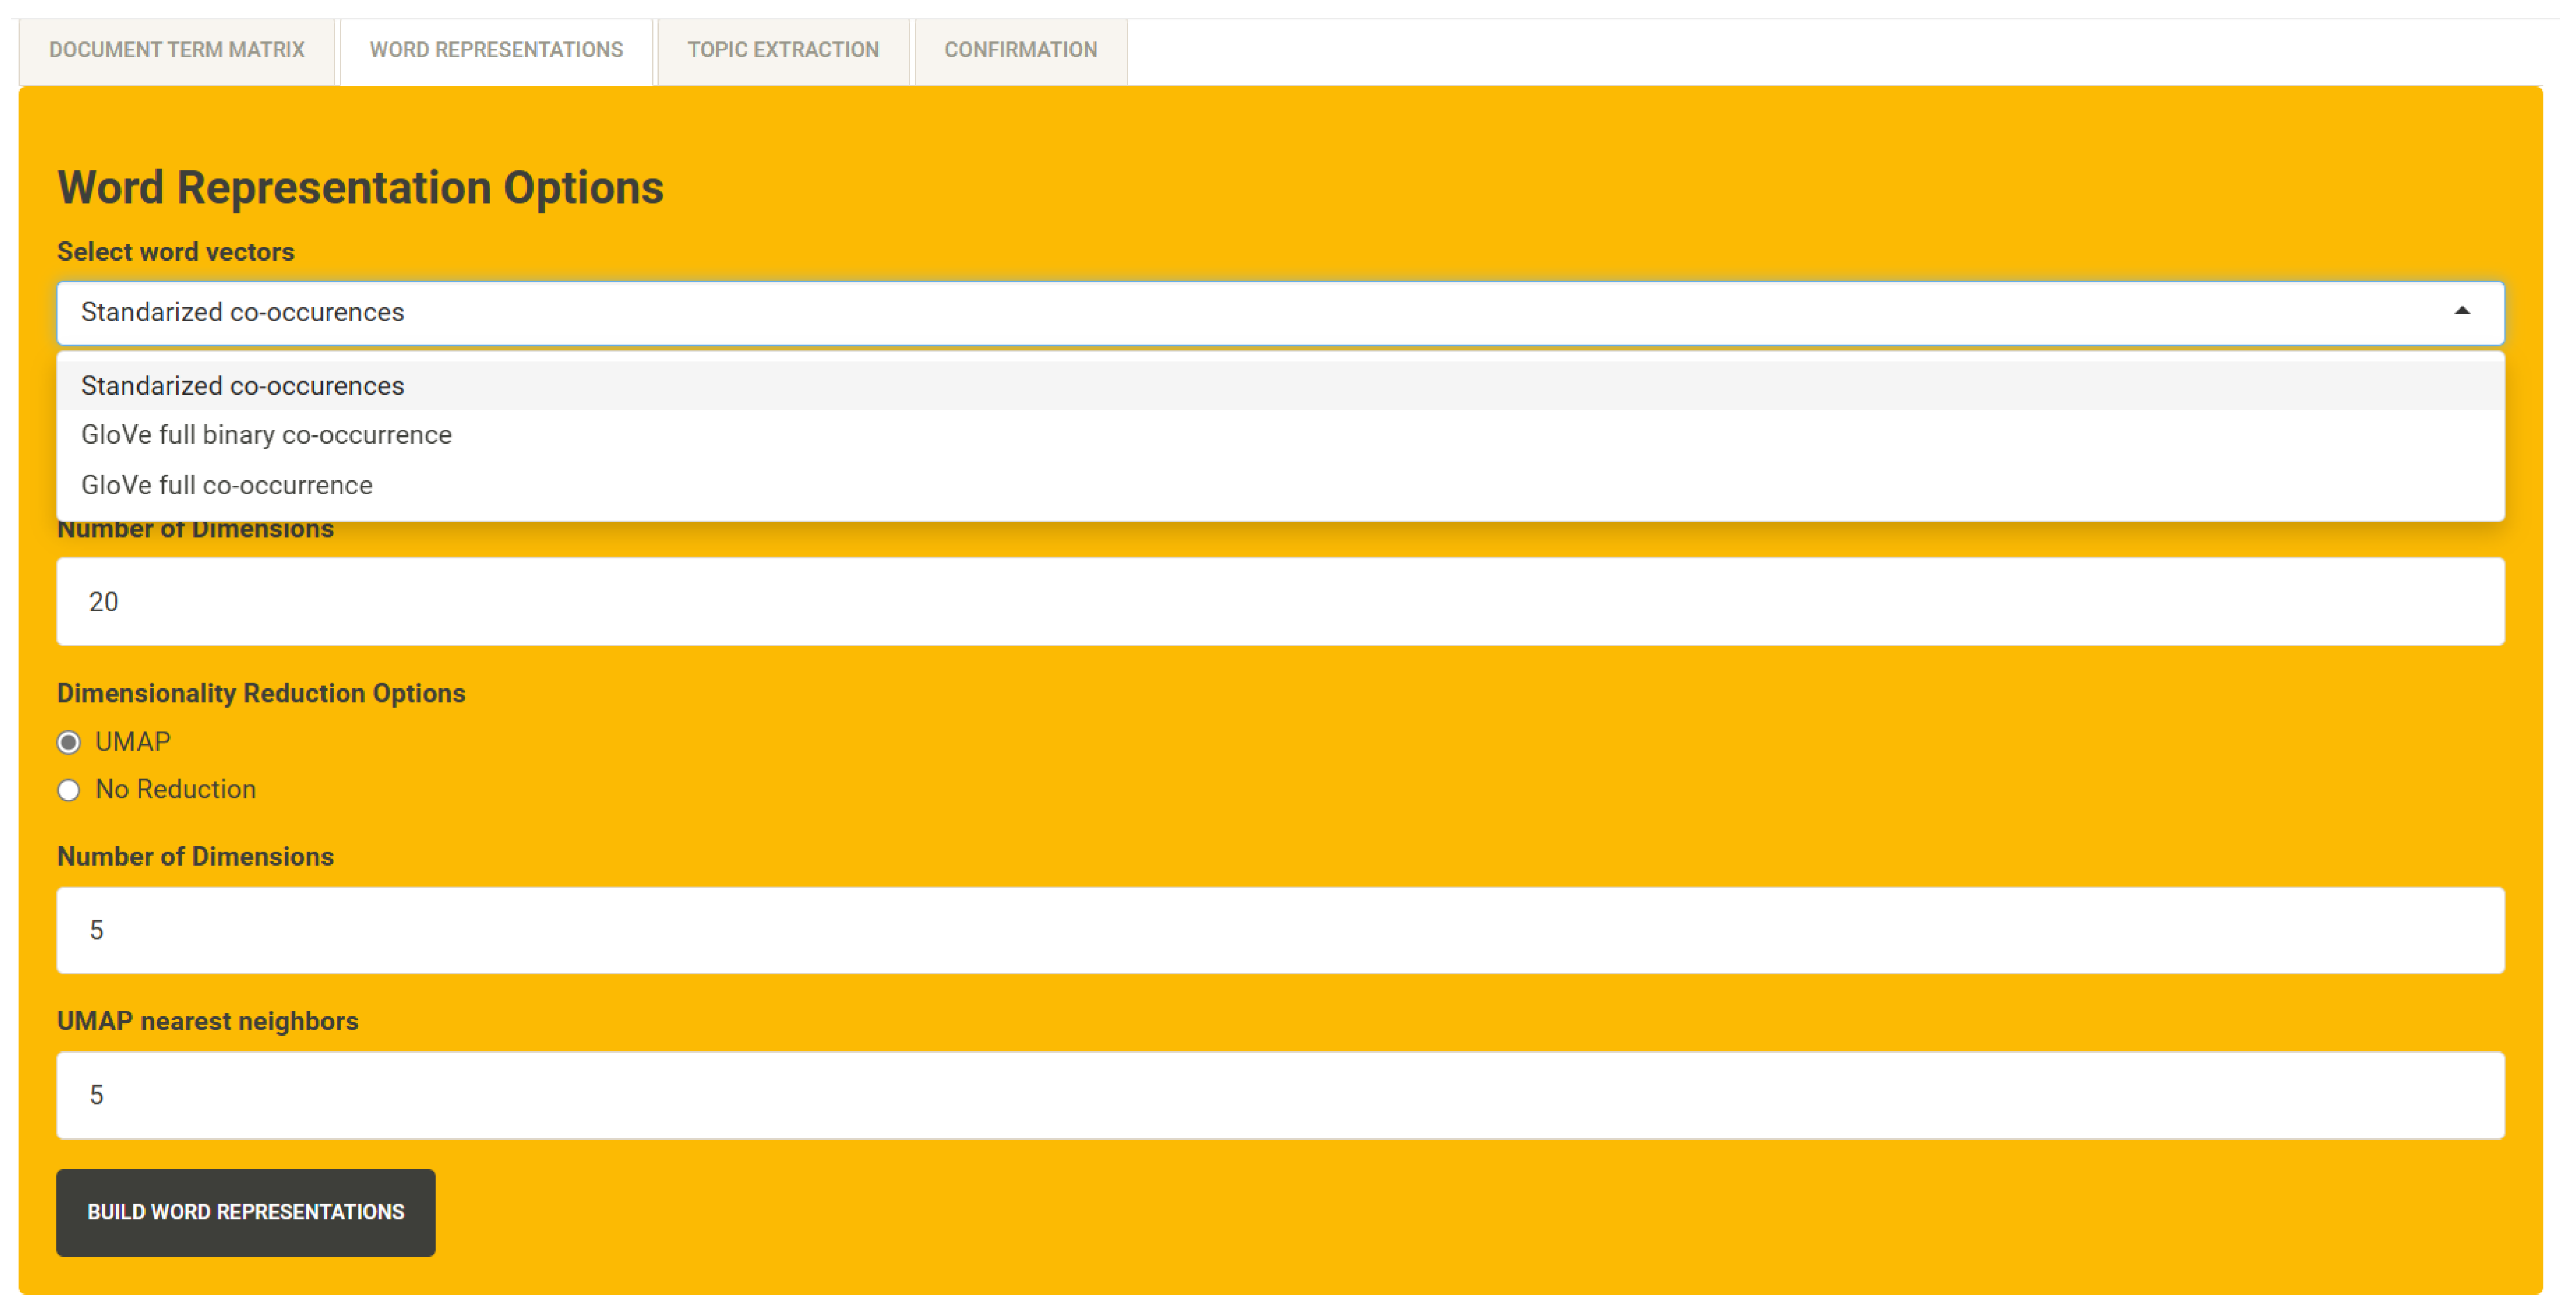
At this point, it is worth providing an inclusive summary of the steps and settings that were followed to create all the necessary data structures, i.e., DTM, TCM, word vectors, and topic models, for creating the session file used in the following experiments. These steps are also discussed in
Section 3.2.1 across the different methodological parts that were followed to establish a session file. Prior to the use of the tool, two datasets were constructed, one storing the sector information and one the skill information (see
Section 3.1). First, the former file was imported to create 17 distinct groups, 1 per sector. Next, instead of proceeding to text preprocessing pipelines for creating a DTM, the second file was imported, which also constitutes a DTM with binary weighting. Furthermore, to establish word vectors, the skill co-occurrences were imported to the UMAP algorithm to project the skills in a new vector space with five dimensions. These skill vectors constituted the inputs to the GMM algorithm, where 29 different models were trained in the range from 2 to 30 topics/clusters to find the optimal one. To evaluate the models, the topic coherence approach in the tool was followed, i.e., NPMI. The later analysis constitutes the final step for creating a session file, as all data structures required for content analysis and group comparison (
Section 3.2.2) were developed at that point, i.e., DTM, TCM, word vectors, and topic models. Regarding the following analysis, the approaches of the tool that were followed to provide answers to the RQs of this study are mentioned across the different subsections.
4.1. Key Skills and Skill Topics (RQ1)
Regarding RQ
1, the most frequent digital skills were first reviewed to identify the primary directions outlining the skill demand of systems analysts (
Table 2). It should be mentioned that the rest of the skills occurred in less than 6000 online job advertisements, which is less than 10% of the dataset. In summary, the table indicates that the primary skill directions mostly concern computer programming (
computer programming,
use scripting programming) and related languages (Java, SQL, Python, PHP), data analysis (
process data,
perform data analysis,
databases,
manage database), office and presentation software (
use Microsoft Office,
office software), and administration, business, and maintenance (
have computer literacy,
business ICT systems,
administer ICT system). Some other areas of interest within the most frequent digital skills include computer science, cloud technologies, hardware, and software specifications.
When it comes to the extracted topics (or skill clusters), the GMM algorithm provided the highest coherence under 12 topics among the 29 models (2 to 30 topics), which corresponds to the model that will be further explored for the rest of this study. Additional details regarding the evaluations of all four algorithms in the range from 2 to 30 topics can be found in the
Appendix A, in
Table A2, where the selected model achieved the highest coherence across the experiments. The main skills per topic are presented in
Table 3, where a comprehensive title is also given according to the core meaning of these skills. In addition, the column prevalence indicates the probability sum of all observations associated with each topic. It should be noted that different numbers of top skills are presented in each case, as significant weight differences between the skills have been observed. For example, in Topic 3, PHP is assigned a weight close to 26%, while the skills
design user interface and
CSS were assigned a weight lower than 6%.
In total, the main content and skills of each topic agree with the previous analysis, while some additional areas of interest were revealed. These directions concern web programming (Topic 3), web analytics (Topic 9), networks (Topic 11), and information security (Topic 12). In addition, the employed clustering approach succeeded at discriminating topics carrying semantic similarities, e.g., Topic 1 and Topic 10, Topic 3 and Topic 9, Topic 5 and Topic 6. These findings make the respective analysis an important one when it comes to understanding the core requirements of systems analysts. Accordingly, systems analysts can be characterized as a demanding category of occupations, as the potential candidates should be specialized in diverse domains requiring different technologies and background knowledge. Moreover, based on the prevalence of each topic, there is a clear separation between major and minor topics, meaning that individuals should prioritize the major ones to compete in the labor market. Based on these evaluations, the requirements related to Topic 1 and Topic 2 can be considered among the primary concerns of systems analysts, followed by Topic 5, Topic 7, and Topic 10.
In summary, the results in this section can offer valuable insights into individuals intending to fill relevant job positions, as the analysis addressed both the most prevalent required skills and skill topics. Thus, the current study can be reviewed for understanding the different directions of systems analysts and selecting specific skills to learn/acquire according to the interests, prior expertise, and preferred job positions of each individual. Undoubtedly, relevant organizations may also benefit from the outcomes of this section by acknowledging the key activities of their competitors to potentially develop new components and compete in the labor market more effectively.
4.2. Similarities and Dissimilarities Between the Sectors (RQ2)
The current section provides the main outcomes concerning the potential distinction of unique sectors through statistical analysis and machine learning models. In the following figure (
Figure 5), a two-dimensional representation of the 17 sectors surrounding systems analysts is demonstrated.
Figure 5 indicates that the
Professional,
scientific and
technical activities can be considered as the most diverse sector, followed by the following: (i)
Public administration and defence;
compulsory social security, (ii)
Electricity, gas, steam and air conditioning supply, (iii)
Human health and social work activities, and (iv)
Financial and insurance activities. With more detail,
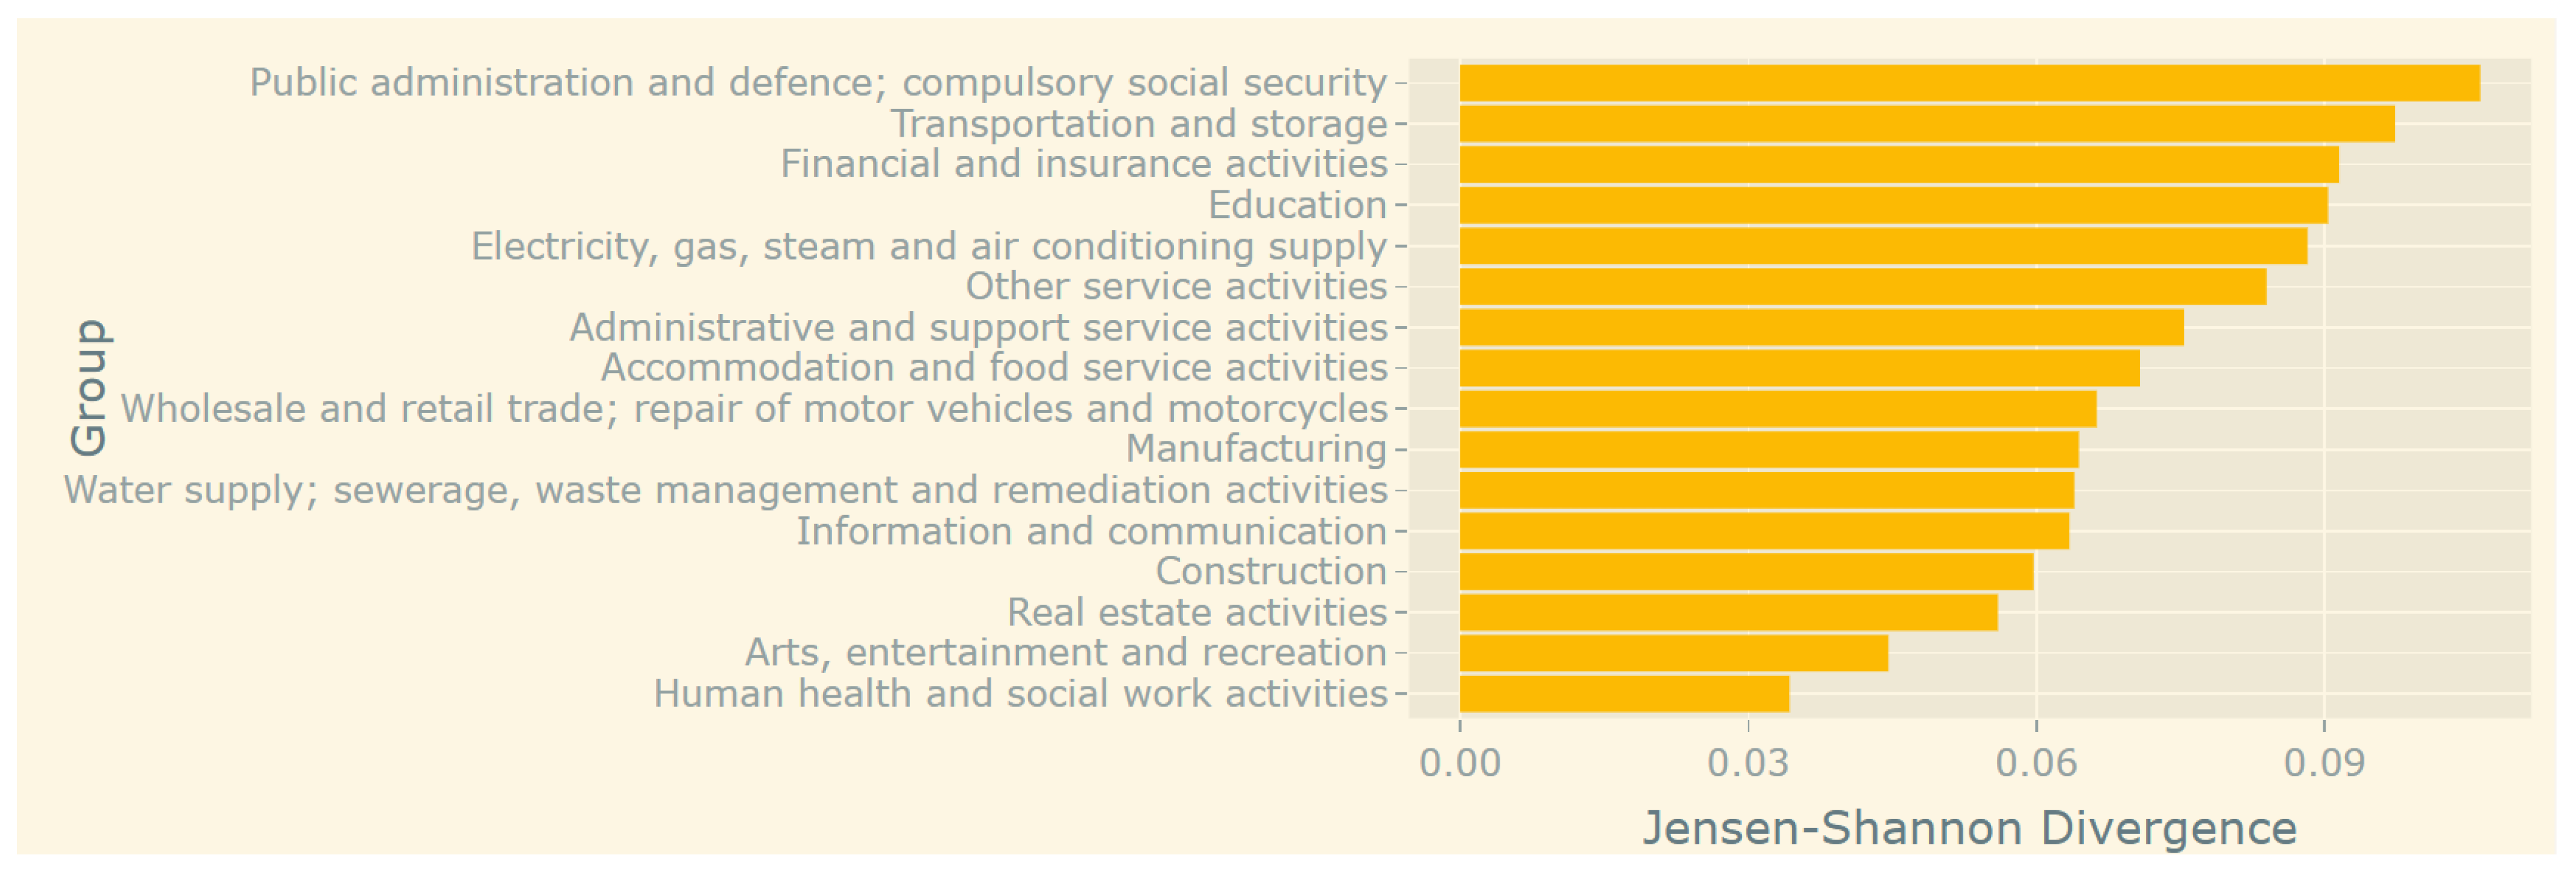
Figure 6 presents the divergence evaluations comparing the
Professional, scientific and technical activities sector and the rest. Overall, the utilized measure ranges from 0 to 1, where values closer to 1 indicate total independency, while values closer to 0 indicate identical probability distributions, i.e., similar sectors/groups. The figure shows that the minimum divergence is higher than 0.03, while the rest of the sectors were associated with at least one lower evaluation. It should be mentioned that when considering all skills, not only the digital ones, the
Electricity, gas, steam and air conditioning supply sector obtained the lowest minimum divergence (close to 0.10) from the other sectors. The other sectors were associated with a minimum divergence close to 0.05 or lower.
To provide sufficient evidence about the potential uniqueness of systems analysts within each sector, the available machine learning capabilities of the developed RShiny tool were utilized as well. First, an experiment without a target group was conducted in an attempt to predict the sector of online job advertisements, where a maximum accuracy close to 33% was observed. When considering that 17 sectors are investigated, the latter outcome indeed shows that the different sectors possibly require unique sets of skills. Hence, it is evident that the divergence levels of the previous analysis can be considered significant.
Moreover, an experiment was conducted for each potential pair of sectors, where the observations of one sector were labeled with values equal to 1 while the observations of the other sector were labeled with values equal to 0. Given the fact that the datasets were balanced across the two potential classes in most experiments (5000 observations each), except for the
Water supply; sewerage, waste management and remediation activities sector, accuracy levels higher than 50% can be considered as significant for providing insights regarding RQ
2. In
Table 4, the main information concerning the accuracy of the models trained with the XGB algorithm is presented, where this algorithm was selected due to its overall high performance compared to the rest in the experiments of this study.
All in all, the experiments show that, in many cases, the accuracy levels were higher than 75%, while the Professional, scientific and technical activities sector is the only one with evaluations higher than 80% in all examined metrics. The latter finding suggests that each sector demands unique combinations of digital skills, which should be thoroughly addressed. It also proves that the detected divergence indicators that were discussed previously are indeed significant in distinguishing online job advertisements across the sectors.
At this point, it should be mentioned that the accuracy levels were significantly increased, with a rate close to 10%, when the rest of the non-digital skills were used in these experiments as well. However, there are some odd ESCO skills that would not provide significant insights when it comes to distinguishing unique sectors, e.g., implement nursing care, read people, and accounting techniques. According to the median and mean accuracy per sector, Electricity, gas, steam and air conditioning supply can also be distinguished as a unique sector, while the Water supply; sewerage, waste management and remediation activities and Transportation and storage sectors are associated with high evaluations as well.
Regarding RQ2, both approaches suggested that the systems analysts associated with Professional, scientific and technical activities can be considered as the sector demanding the most unique combinations of digital skills, followed by the Electricity, gas, steam and air conditioning supply sector. In total, the experiments indicated that all sectors can be usually distinguished from the rest, meaning that individuals with unique combinations of skills should explore the differences between sectors to identify the most suitable ones according to their experience and preferences.
4.3. Key Digital Skills and Topics of Systems Analysts (RQ3)
The current section extends the findings of the previous one by presenting an in-depth analysis of the key skill directions demanded from the different organizations when it comes to systems analysts. To evaluate individual digital skills, the mutual information was first calculated, while the frequency ratio of a skill inside versus outside each sector was also considered to understand whether a skill is associated with higher or lower relative demand in comparison to the other sectors.
Based on these evaluations,
Table 5 presents the skill categories along with the primary programming languages and technologies (or types of technologies) associated with each sector, where a score is provided for each one. For example, in the first sector (
Accommodation and food service activities), the digital skill SQL is 2.6 times more likely to occur in job positions compared to a random position belonging to one of the other sectors. In addition, skill categories were assigned to sectors when either multiple significant skills with semantic similarities are observed, e.g.,
manage database,
databases, or a frequent individual skill was detected. For this purpose, the ESCO taxonomy was manually inspected to find semantic similarities, where some new concepts are also introduced after the inspection of the individual skills and skill categories, e.g., Computer-Aided Engineering (CAE).
All in all, the different areas of interest discussed in
Section 4.1 are also significant in multiple sectors according to the skill evaluations. In addition, the categories associated with Data analysis (seven sectors), ICT systems and projects (seven sectors), and Cyber security (six sectors) were evaluated with high relative frequency in most sectors. Regarding the practical usage of these outcomes, individuals may review the above analysis to identify sectors covering their expertise when it comes to the different areas of interest and technologies.
With more detail, while most sectors were associated with more than one area of interest, the Electricity, gas, steam and air conditioning supply and Manufacturing sectors were related to distinct concepts, i.e., presentation software and web programming, respectively. Furthermore, the Education sector should be considered as the most appropriate sector for Research and innovation activities while the Information and communication sector was proved as the most generic option; i.e., many areas of interest were observed.
In addition, while the Public administration and defence; compulsory social security sector was also associated with multiple skill categories, CAE was evaluated with high relative frequency only within this sector. In total, apart from these observations, which are associated with distinct sectors, individuals may select some unique concepts of their interest with few overlaps, such as Web analytics, Software design and specifications, IoT, and Quality control, to effectively identify and review the sectors with the highest probability of including the desired concepts in relevant job positions.
As the latter experiments were completed through qualitative analysis and manual inspection, the topics extracted from the whole dataset were also evaluated based on the ratio of each topic inside a sector versus outside. Through this analysis, a more structured overview can be provided, as the topics are represented by distinct digital skills and concepts that can cover the entire dataset. Overall, the most significant observations of sectors obtaining the highest and lowest evaluations per topic are presented in
Table 6, where higher evaluations indicate higher demand within a sector than in any other sector, while lower evaluations indicate lower demand.
According to the above table, many topics indicated significant observations with both high and low evaluations. Apart from the extreme observations of Topic 12, which covers a small proportion of the data, the topics concerning Office tasks (Topic 2), Database management (Topic 6), Software specifications and designs and online presentation of multidimensional data (Topic 7), System administration (Topic 8), Web analytics (Topic 9), and Networks (Topic 11) provided the most informative outcomes, with ratios exceeding 1.8. The rest of the maximum evaluations were lower or close to 1.5 and indicate that these topics are not significantly concentrated around unique sectors. Also, it should be noted that the manual inspection from the previous analysis matches the outcomes of this analysis on multiple occasions, including presentation software (Topic 2), web programming (Topic 3), databases (Topic 6), and web analytics (Topic 9). Regarding the lowest evaluations, the Professional, scientific and technical activities and Electricity, gas, steam and air conditioning supply sectors occurred in most topics, which is an observation further explaining their overall divergence from other sectors. On the other hand, the highest evaluations per topic were not concentrated around distinct sectors, as most sectors were evaluated with high relative frequency in at least one topic.
In summary, the experiments of this section pointed out significant associations between the different concepts surrounding systems analysts. Thus, job seekers with unique sets of skills may review the above tables to identify the most suitable sectors, according to their preferences. For example, job seekers who are interested in web analytics (Topic 9) will be guided to explore organizations within the Water supply; sewerage, waste management and remediation activities, Professional, scientific and technical activities and Wholesale and retail trade; repair of motor vehicles and motorcycles sectors according to their activity and requirements. From a different perspective, systems analysts focusing on a specific sector may also review the outcomes of this study to detect the most appropriate skills according to the requirements of relevant job positions. In this context, employees in Administrative and support service activities can be guided into digital skills that primarily concern cybersecurity and networks instead of focusing on other more generic concepts.
5. Discussion
The various characteristics of online job advertisements can be considered an invaluable knowledge base for understanding labor market demand from multiple perspectives covering regional, industrial, and sectoral characteristics. In this spectrum, the current study provided insights regarding the digital ESCO skills required by systems analysts in Europe. The analysis was conducted for a dataset containing 81,432 online job advertisements posted from Q1 to Q3 2024, where each job/observation was associated with a unique sector (17 in total) and a set of digital ESCO skills (201 unique digital skills were detected). The respective outcomes showed that there are different types of skills required by systems analysts, which can be categorized into major (more frequent) and minor (less frequent). In addition, the key differences between the sectors were also addressed by evaluating the frequencies of digital skills and skill topics with each one. Also, this study presented a tool and methods that were utilized to derive the desired outputs, which ultimately led to providing insights covering the three RQs of this study. As the imported dataset followed some standards regardless of its special properties, this tool can be used for other types of data as well.
Regarding the main RQs of this study, the analysis first showed that organizations within the European labor market demand diverse sets of digital skills to cover the requirements of systems analysts (RQ1). To reveal the main digital skills and groups of skills required from job positions of this type, the occurrences and co-occurrences of the detected digital skills were analyzed. The core concepts of the most frequent digital skills within the dataset indicated that the primary duties of systems analysts concern administrative, business, office, and data management tasks along with a variety of programming languages, e.g., PHP, Python, and Java. These concepts were also confirmed by a topic extraction approach, where the GMM algorithm was used to address 12 skill topics/clusters overall. Through this analysis, some less frequent directions were also revealed, including cybersecurity, networks, web analytics, and e-commerce, hence confirming the variety of skills related to systems analysts. In addition, the latter analysis was indeed valuable in understanding the relationships between the different skills by identifying subsets of skills that are more likely to occur or not occur together. On top of that, skills with semantic similarities were also separated into different topics since they covered different concepts, e.g., Developing ICT systems and System administration.
Furthermore, the most unique sectors were detected through two different approaches (RQ2), based on the similarities/dissimilarities between all groups. In the first approach, we calculated probability distributions of skills over the sectors, which were later used to measure the divergence between each pair. Additionally, a two-dimensional projection was provided, using the divergence evaluations, to identify sectors associated with more unanticipated requirements compared to the rest. Briefly, both the projection and the pairwise comparisons indicated that the Professional, scientific and technical activities sector is the most diverging one, as it obtained the highest minimum distance from other sectors and significantly higher distances overall. Going beyond this approach, multiple machine learning experimental setups were also conducted to explore whether the online job advertisements of each sector can be distinguished from the rest or not, with the exclusive use of the required digital skills. In short, the outcomes indicated that the accuracy levels were higher than 75% in most cases, while the Professional, scientific and technical activities sector was distinguished as the most unique sector once again. In addition, the machine learning models trained for modeling all 17 sectors, instead of modeling 2 sectors at a time, achieved high accuracy levels (close to 33%). This finding indicated that the different sectors indeed demand unique sets of skills when it comes to systems analysts.
Since the previous analysis suggested that different sectors require different sets of skills, this study also revealed the most unanticipated areas of interest within each sector and the most relevant to each topic sector (RQ3). Initially, by combining information from the ESCO taxonomy with evaluation approaches based on statistical analysis, i.e., mutual information and frequency ratios, we assigned multiple areas of interest to each sector. At the same time, the most unanticipated technologies and programming languages within each sector were also identified and presented. The outcomes showed that there are some sectors associated with multiple areas of interest, e.g., Information and communication, Human health and social work activities, while there are others with more domain-specific responsibilities, i.e., Electricity, gas, steam and air conditioning supply, and Manufacturing. In a more collective manner, the most relevant to each topic sectors were addressed as well. The analysis revealed that the skills concerning office tasks (Topic 2), database management (Topic 6), software designs and online presentations (Topic 7), system administration (Topic 8), web analytics (Topic 9), and networks (Topic 11) are more frequent in distinct sectors and not balanced across the investigated sectors. Overall, the findings from both approaches indicated that each sector requires distinct sets of skills, hence showing that they should be engaged in different ways by third parties with specific interests in the labor market.
Ultimately, the main implications and contributions of the current study concern the potential future usage of the methods and main findings of the demonstrated experiments. First, individuals aspiring to work as systems analysts may review the presented outcomes to identify the core digital skills required to fulfill a relevant position. When it comes to achieving higher performance, experienced individuals with unique sets of skills and interests can find the most suitable sectors through the demonstrated experiments as well. Similarly, job seekers interested in a specific sector can detect the core differences between the general standards of systems analysts and this sector. Eventually, individuals may possibly increase their value as employees by identifying and focusing on specific sets of skills with higher demand rather than limiting their knowledge to less significant skills. Moreover, organizations requiring systems analysts may also inspect the outcomes of this study to outline the status of the labor market and the needs of immediate competitors, as expressed by each sector. In this way, they can filter their online job advertisements to adapt to the standards of systems analysts, as well as provide familiar and attractive descriptions to job seekers and potential applicants. Also, by evaluating the requirements of immediate competitors, organizations can possibly detect technologies and areas of interest that may adapt to their needs. In this way, third parties can develop or expand both new and existing ideas and products. Finally, both organizations and individuals aiming at establishing effective training courses and learning material can leverage the different outcomes of this study and develop programs focusing on specific significant skills and sets of skills, with respect to the labor market and their unique characteristics, properties, and interests.
When it comes to the employed methods, a tool for conducting content-based comparisons between groups was utilized. Apart from experiments concerning skill demand, the respective methods can be adapted to other applications exploring content-based differences between groups. To implement these methods, researchers may use any kind of dataset containing content features (text usually) as well as create groups based on one or more variables. Afterward, the main offerings of the employed approaches, which can be matched against the RQs of this study, are the following:
Understand the most prevalent concepts within a dataset via NLP and statistical methods (RQ1);
Outline the primary directions with the use of topic analysis (RQ1);
Find similar and distant groups (RQ2);
Identify unique groups with exceptional content mixtures (RQ2);
Measure the degree of separation between groups through machine learning (RQ2);
Evaluate the key features and topics characterizing each group using different evaluation approaches (RQ3).
Author Contributions
Conceptualization, K.C.; methodology, K.C. and K.G.; software, K.C., K.G. and N.M.; validation, K.C., N.M. and L.A; formal analysis, K.C., K.G. and N.M.; investigation, K.C. and K.G.; resources, K.C. and K.G.; data curation, K.C. and L.A.; writing—original draft preparation, K.C. and K.G.; writing—review and editing, N.M. and L.A.; visualization, K.C. and N.M.; supervision, N.M. and L.A.; project administration, L.A. All authors have read and agreed to the published version of the manuscript.
Funding
The research in this paper is part of the PhD dissertation of the first author. This research was funded by the SKILLAB project, under the EU Horizon Europe Framework, grant number 101132663. The authors acknowledge Eurostat and Cedefop for supporting this research by providing access to online job advertisements through the Web Intelligence Hub project.
Institutional Review Board Statement
Not applicable.
Informed Consent Statement
Not applicable.
Data Availability Statement
Conflicts of Interest
The authors declare the following financial interests and/or personal relationships that may be considered potential competing interests: Konstantinos Charmanas, Konstantinos Georgiou, Nikolaos Mittas and Lefteris Angelis report that financial support was provided by SKILLAB, funded by the European Union’s Horizon Europe Framework Programme under grant Agreement No. 101132663.
References
- Lu, J. Data Scientist Knowledge and Skills Evaluation Towards a Data-Driven Research Methodology. In Proceedings of the 23rd European Conference on Research Methodology for Business and Management Studies, Porto, Portugal, 4–5 July 2024; Academic Conferences and Publishing Limited: Reading, UK, 2024. [Google Scholar]
- Lang, G.; Jones, K.; Leonard, L.N. In the know: Desired skills for entry-level systems analyst positions. Issues Inf. Syst. 2015, 16, 142–148. [Google Scholar]
- Ahmed, F.; Capretz, L.F.; Bouktif, S.; Campbell, P. Soft skills and software development: A reflection from the software industry. arXiv 2015, arXiv:1507.06873. [Google Scholar]
- Almotairi, M.; Alabsi, H.Z.; Alqahtani, Y.; Alyami, M.A.; Aljazaeri, M.M.; Song, Y.T. Improving students’ readiness toward the labor market through customized learning. In Proceedings of the International Conference on Software Engineering Research and Applications, Las Vegas, NV, USA, 22–25 May 2022; Springer International Publishing: Cham, Switzerland, 2022; pp. 169–181. [Google Scholar]
- Cosgrove, J.; Sostero, M.; Bertoni, E. Mapping DigComp Digital Competences to the ESCO Skills Framework for Analysis of Digital Skills in EU Online Job Advertisements; Publications Office of the European Union: Luxembourg, 2024. [Google Scholar]
- Giabelli, A.; Malandri, L.; Mercorio, F.; Mezzanzanica, M. GraphLMI: A data driven system for exploring labor market information through graph databases. Multimed. Tools Appl. 2022, 81, 3061–3090. [Google Scholar] [CrossRef]
- Kahlawi, A.; Buzzigoli, L.; Giambona, F.; Grassini, L.; Martelli, C. Online job ads in Italy: A regional analysis of ICT professionals. Stat. Methods Appl. 2024, 33, 609–633. [Google Scholar] [CrossRef]
- Demchenko, Y.; Cuadrado-Gallego, J.J. Data science competences. In The Data Science Framework: A View from the EDISON Project; Springer: Cham, Switzerland, 2020; pp. 9–41. [Google Scholar]
- Skhvediani, A.; Sosnovskikh, S.; Rudskaia, I.; Kudryavtseva, T. Identification and comparative analysis of the skills structure of the data analyst profession in Russia. J. Educ. Bus. 2022, 97, 295–304. [Google Scholar] [CrossRef]
- Kostis, I.A.; Sarafis, D.; Karamitsios, K.; Kotrotsios, K.; Kravari, K.; Badica, C.; Chatzimisios, P. Towards an integrated retrieval system to semantically match cvs, job descriptions and curricula. In Proceedings of the 26th Pan-Hellenic Conference on Informatics, Athens, Greece, 25–27 November 2022; pp. 151–157. [Google Scholar]
- Mason, C.M.; Chen, H.; Evans, D.; Walker, G. Illustrating the application of a skills taxonomy, machine learning and online data to inform career and training decisions. Int. J. Inf. Learn. Technol. 2023, 40, 353–371. [Google Scholar] [CrossRef]
- Chiarello, F.; Fantoni, G.; Hogarth, T.; Giordano, V.; Baltina, L.; Spada, I. Towards ESCO 4.0–Is the European classification of skills in line with Industry 4.0? A text mining approach. Technol. Forecast. Soc. Change 2021, 173, 121177. [Google Scholar] [CrossRef]
- Bagnasco, A.; Catania, G.; Zanini, M.; Pozzi, F.; Aleo, G.; Watson, R.; Stavropoulos, K. Core competencies for family and community nurses: A European e-Delphi study. Nurse Educ. Pract. 2022, 60, 103296. [Google Scholar] [CrossRef]
- Katsis, M.; Papadatos, P.; Rigou, M.; Sirmakessis, S.; Vossos, D. Skills matching to support Europe’s Blue Economy Skills Passport. In Proceedings of the 2023 3rd International Conference on Electrical, Computer, Communications and Mechatronics Engineering (ICECCME), Tenerife, Spain, 19–21 July 2023; pp. 1–6. [Google Scholar]
- Mankevich, V.; Svahn, F. Resourcing Digital Competence in Product Development: A Computational Study of Recruitment at Volvo Cars. In Proceedings of the 54th Hawaii International Conference on System Sciences, Kauai, HI, USA, 5 January 2021. [Google Scholar]
- Nikolaev, I.E. An intelligent method for generating a list of job profile requirements based on neural network language models using ESCO taxonomy and online job corpus. Бизнес-инфoрматика 2023, 17, 71–84. [Google Scholar] [CrossRef]
- Pryima, S.; Rogushina, J.V.; Strokan, V. Use of semantic technologies in the process of recognizing the outcomes of non-formal and informal learning. In Proceedings of the 11th International Conference of Programming (UkrPROG 2018), Kyiv, Ukraine, 22–24 May 2018; pp. 226–235. [Google Scholar]
- Giabelli, A.; Malandri, L.; Mercorio, F.; Mezzanzanica, M.; Seveso, A. NEO: A tool for taxonomy enrichment with new emerging occupations. In Proceedings of the International Semantic Web Conference, Athens, Greece, 2–6 November 2020; Springer International Publishing: Cham, Switzerland, 2020; pp. 568–584. [Google Scholar]
- Giabelli, A.; Malandri, L.; Mercorio, F.; Mezzanzanica, M.; Seveso, A. (2021, May). NEO: A system for identifying new emerging occupation from job ads. In Proceedings of the AAAI Conference on Artificial Intelligence, Vancouver, BC, Canada, 2–9 February 2021; Volume 35, pp. 16035–16037. [Google Scholar]
- Malandri, L.; Mercorio, F.; Mezzanzanica, M.; Nobani, N. Taxoref: Embeddings evaluation for ai-driven taxonomy refinement. In Joint European Conference on Machine Learning and Knowledge Discovery in Databases; Springer International Publishing: Cham, Switzerland, 2021; pp. 612–627. [Google Scholar]
- Pena, P.; Lado, R.T.; Del Hoyo, R.; del Carmen Rodríguez-Hernández, M.; Abadía-Gallego, D. Ontology-quality Evaluation Methodology for Enhancing Semantic Searches and Recommendations: A Case Study. In Proceedings of the 16th International Conference on Web Information Systems and Technologies, Budapest, Hungary, 3–5 November 2020; pp. 277–284. [Google Scholar]
- Gasparetto, A.; Marcuzzo, M.; Zangari, A.; Albarelli, A. A survey on text classification algorithms: From text to predictions. Information 2022, 13, 83. [Google Scholar] [CrossRef]
- Pennington, J.; Socher, R.; Manning, C.D. (2014, October). Glove: Global vectors for word representation. In Proceedings of the 2014 Conference on Empirical Methods in Natural Language Processing (EMNLP), Doha, Qatar, 25–29 October 2014; pp. 1532–1543. [Google Scholar]
- McInnes, L.; Healy, J.; Melville, J. Umap: Uniform manifold approximation and projection for dimension reduction. J. Open Source Softw. 2018, 3, 861. [Google Scholar] [CrossRef]
- Bouma, G. Normalized (pointwise) mutual information in collocation extraction. Proc. GSCL 2009, 30, 31–40. [Google Scholar]
- Dieng, A.B.; Ruiz, F.J.; Blei, D.M. Topic modeling in embedding spaces. Trans. Assoc. Comput. Linguist. 2020, 8, 439–453. [Google Scholar] [CrossRef]
- DeBruine, Z.J.; Melcher, K.; Triche, T.J., Jr. Fast and robust non-negative matrix factorization for single-cell experiments. BioRxiv 2021. [Google Scholar] [CrossRef]
- Lee, D.D.; Seung, H.S. Learning the parts of objects by non-negative matrix factorization. Nature 1999, 401, 788–791. [Google Scholar] [CrossRef]
- Blei, D.M.; Ng, A.Y.; Jordan, M.I. Latent dirichlet allocation. J. Mach. Learn. Res. 2003, 3, 993–1022. [Google Scholar]
- Bezdek, J.C. Objective function clustering. In Pattern Recognition with Fuzzy Objective Function Algorithms; Springer: Boston, MA, USA, 1981; pp. 43–93. [Google Scholar]
- Banfield, J.D.; Raftery, A.E. Model-based Gaussian and non-Gaussian clustering. Biometrics 1993, 49, 803–821. [Google Scholar] [CrossRef]
- Celeux, G.; Govaert, G. Gaussian parsimonious clustering models. Pattern Recognit. 1995, 28, 781–793. [Google Scholar] [CrossRef]
- Fraley, C.; Raftery, A.E. Model-based clustering, discriminant analysis, and density estimation. J. Am. Stat. Assoc. 2002, 97, 611–631. [Google Scholar] [CrossRef]
- Charmanas, K.; Mittas, N.; Angelis, L. Exploitation of vulnerabilities: A topic-based machine learning framework for explaining and predicting exploitation. Information 2023, 14, 403. [Google Scholar] [CrossRef]
- Lin, J. Divergence measures based on the Shannon entropy. IEEE Trans. Inf. Theory 1991, 37, 145–151. [Google Scholar] [CrossRef]
- Cox, T.F.; Cox, M.A. Multidimensional Scaling; CRC Press: Boca Raton, FL, USA, 2000. [Google Scholar]
- Cover, T.M. Elements of Information Theory; John Wiley & Sons: Hoboken, NJ, USA, 1999. [Google Scholar]
- Spearman, C. The proof and measurement of association between two things. Am. J. Psychol. 1904, 15, 72–101. [Google Scholar] [CrossRef]
- Kuhn, M. Building Predictive Models in R Using the caret Package. J. Stat. Softw. 2008, 28, 1–26. [Google Scholar] [CrossRef]
| Disclaimer/Publisher’s Note: The statements, opinions and data contained in all publications are solely those of the individual author(s) and contributor(s) and not of MDPI and/or the editor(s). MDPI and/or the editor(s) disclaim responsibility for any injury to people or property resulting from any ideas, methods, instructions or products referred to in the content. |
© 2025 by the authors. Licensee MDPI, Basel, Switzerland. This article is an open access article distributed under the terms and conditions of the Creative Commons Attribution (CC BY) license (https://creativecommons.org/licenses/by/4.0/).


