

Digitalization and Artificial Intelligence: A Comparative Study of Indices on Digital Competitiveness


Abstract
1. Introduction
2. Literature Review
2.1. Digital Technologies and Competitiveness
2.2. Multi-Index Comparisons and Ranking Differences
2.3. Ranking Reliability and Temporal Dynamics
2.4. The Diversity of Index Methodologies
- The WDCR emphasizes innovation, human capital, and future readiness [9], focusing on knowledge-driven competitiveness.
- The NRI includes governance, inclusivity, and SDG alignment [10], making it particularly relevant for assessing societal impact.
- The AIRI evaluates AI strategies, ethics, and infrastructure [11], offering insight into national-level preparedness for advanced technologies.
- The DQLI focuses on internet affordability, quality, and user experience [12], offering a citizen-centered view of digital wellbeing.
- Digital adoption drives competitiveness (supporting the use of digital indices).
- Index structures differ and affect rankings (supporting H1).
- Reliable indices strongly correlate (supporting H2).
- Country performance evolves over time (supporting H3).
3. Materials and Methods
3.1. Data
3.1.1. The World Digital Competitiveness Ranking (WDCR)
3.1.2. The Network Readiness Index (NRI)
3.1.3. The AI Readiness Index (AIRI)
3.1.4. The Digital Quality of Life Index (DQLI)
3.2. Methods
4. Results
5. Discussion
6. Conclusions
Author Contributions
Funding
Institutional Review Board Statement
Informed Consent Statement
Data Availability Statement
Conflicts of Interest
Abbreviations
| AI | Artificial Intelligence |
| AIRI | AI Readiness Index |
| ANOVA | Analysis of Variance |
| DESI | Digital Economy and Society Index |
| DQLI | Digital Quality of Life Index |
| EU | European Union |
| ICT | Information and Communications Technology |
| NRI | Network Readiness Index |
| R&D | Research and Development |
| SDG | Sustainable Development Goals |
| SME | Small and Medium-sized Enterprises |
| WDCR | World Digital Competitiveness Ranking |
References
- Bruneckienė, J.; Rapsikevičius, J.; Lukauskas, M.; Zykienė, I.; Jucevičius, R. Smart economic development patterns in Europe: Interaction with competitiveness. Compet. Rev. Int. Bus. J. 2023, 33, 302–331. [Google Scholar] [CrossRef]
- OECD. Competition. 2024. Available online: https://www.oecd.org/en/topics/policy-issues/competition.html (accessed on 8 November 2024).
- IMD. World Competitiveness Center. 2024. Available online: https://www.imd.org/centers/wcc/world-competitiveness-center/ (accessed on 5 November 2024).
- Kalinic, I.; Brouthers, K.D. Entrepreneurial orientation, export channel selection, and export performance of SMEs. Int. Bus. Rev. 2022, 31, 101901. [Google Scholar] [CrossRef]
- Popa, S.; Soto-Acosta, P.; Palacios-Marqués, D. A discriminant analysis of high and low-innovative firms: The role of IT, human resources, innovation strategy, intellectual capital and environmental dynamism. J. Knowl. Manag. 2022, 26, 1615–1632. [Google Scholar] [CrossRef]
- Lewandowska, A.; Berniak-Woźny, J.; Ahmad, N. Competitiveness and innovation of small and medium enterprises under Industry 4.0 and 5.0 challenges: A comprehensive bibliometric analysis. Equilibrium. Q. J. Econ. Econ. Policy 2023, 18, 1045–1074. [Google Scholar]
- Averina, T.; Barkalov, S.; Fedorova, I.; Poryadina, V. Impact of digital technologies on the company’s business model. In Proceedings of the XXII International Scientific Conference Energy Management of Municipal Facilities and Sustainable Energy Technologies (EMMFT-2020), E3S Web of Conferences, Voronezh, Russia, 8–10 December 2020. [Google Scholar] [CrossRef]
- Skare, M.; Soriano, D.R. How globalization is changing digital technology adoption: An international perspective. J. Innov. Knowl. 2021, 6, 222–233. [Google Scholar] [CrossRef]
- IMD. World Digital Competitiveness Ranking. 2024. Available online: https://www.imd.org/centers/wcc/world-competitiveness-center/rankings/world-digital-competitiveness-ranking/ (accessed on 18 November 2024).
- Dutta, S.; Lanvin, B. Network Readiness Index 2023; Portulans Institute: Washington, DC, USA, 2023. [Google Scholar]
- Oxford Insights. Government AI Readiness Index. 2024. Available online: https://oxfordinsights.com/ai-readiness/ai-readiness-index/ (accessed on 18 November 2024).
- Surfshark. Digital Quality of Life Index. 2024. Available online: https://surfshark.com/dql2023 (accessed on 18 November 2024).
- Huynh, L.D.; Chen, Y.F.; Erdenebayar, S.; Chao, Y.S. Does Financial Literacy Matter with National Competitiveness? The Role of Digital Capability. Int. J. Innov. Manag. 2024, 12, 13–20. [Google Scholar]
- Kruhlova, O.; Tverdokhlib, K. Ukraine Global and Digital Competitiveness Index. In Proceedings of the IV International Scientific and Practical Conference “An Integrated Approach to Science Modernization: Methods, Models and Multidisciplinarity”, Vinnytsia, Ukraine, 26 August 2022. [Google Scholar] [CrossRef]
- Kolpak, E.; Borisova, V.; Panfilova, E. Vector model of digital economy in the process of increasing the competitiveness of countries and regions. J. Glob. Compet. Governabil. 2021, 15, 104–121. [Google Scholar] [CrossRef]
- Sannikova, I.N.; Prikhodko, E.A.; Muhitdinov, A.A. Assessment of the universities impact on global competitiveness based on rankings. In Proceedings of the 1st International Conference on Environmental Sustainability Management and Green Technologies (ESMGT 2021), E3S Web of Conferences, Novosibirsk, Russia, 30 June–2 July 2021. [Google Scholar] [CrossRef]
- Bánhidi, Z.; Dobos, I. Measuring digital development: Ranking using data envelopment analysis (DEA) and network readiness index (NRI). Cent. Eur. J. Oper. Res. 2024, 32, 1089–1108. [Google Scholar] [CrossRef]
- Tokmergenova, M.; Dobos, I. Analysis of the Network Readiness Index (NRI) Using Multivariate Statistics. Period. Polytech. Soc. Manag. Sci. 2024, 32, 28–36. [Google Scholar] [CrossRef]
- Silva, D.S.; Yamashita, G.H.; Cortimiglia, M.N.; Brust-Renck, P.G.; ten Caten, C.S. Are we ready to assess digital readiness? Exploring digital implications for social progress from the Network Readiness Index. Technol. Soc. 2022, 68, 101875. [Google Scholar] [CrossRef]
- Begum, S. Accelerating Digital Transformation An Analysis of Network Readiness Index 2020 Post COVID-19. Eurasian J. Manag. Soc. Sci. 2021, 2, 29–42. [Google Scholar] [CrossRef]
- Nasution, M.K.; Elveny, M.; Pamucar, D.; Popovic, M.; Gušavac, B.A. Uncovering the Hidden Insights of the Government AI Readiness Index: Application of Fuzzy LMAW and Schweizer-Sklar Weighted Framework. Decis. Mak. Appl. Manag. Eng. 2024, 7, 443–468. [Google Scholar] [CrossRef]
- Nzobonimpa, S.; Savard, J.F. Ready but irresponsible? Analysis of the government artificial intelligence readiness index. Policy Internet 2023, 15, 397–414. [Google Scholar] [CrossRef]
- Kosikova, M.; Matovcikova, D. The Impact of Digital Quality of Life on Artificial Intelligence Development: A Case Study Using the DQL and AIRI Indexes. Econ. Manag. Spectr./Ekon.-Manažérske Spektrum 2024, 18, 24–37. [Google Scholar]
- Stefanovic, D.; Ignjatijevic, S.; Bozovic, I. Analysis of the relationship index of digital skills and economic development. Oditor 2024, 10, 191–245. [Google Scholar] [CrossRef]
- Panzabekova, A.; Kireyeva, A.A.; Satybadin, A.A.; S Sabyr, N. Distribution of ICT and Analysis of the Digital Components of the Quality of Life. J. Distrib. Sci. 2020, 18, 67–77. [Google Scholar] [CrossRef]
- Haykal, S.H.; Makki, M. The impact of digitalization on unemployment during COVID-19 pandemic. In Proceedings of the Digital Economy. Emerging Technologies and Business Innovation, 7th International Conference on Digital Economy, ICDEc 2022, Bucharest, Romania, 9–11 May 2022. [Google Scholar] [CrossRef]
- Cherep, A.; Dashko, I.; Ohrenych, Y. Theoretical and methodological bases of formation of the concept of ensuring socio-economic security of enterprises in the context of digitalisation of business processes. Balt. J. Econ. Stud. 2024, 10, 237–246. [Google Scholar]
- Bacca-Acosta, J.; Gómez-Caicedo, M.I.; Gaitán-Angulo, M.; Robayo-Acuña, P.; Ariza-Salazar, J.; Suárez, Á.L.M.; Villamil, N.O.A. The impact of digital technologies on business competitiveness: A comparison between Latin America and Europe. Compet. Rev. Int. Bus. J. 2023, 33, 22–46. [Google Scholar] [CrossRef]
- Ahmed, R.R.; Streimikiene, D.; Soomro, R.H.; Streimikis, J. Digital transformation and industry 4.0 initiatives for market competitiveness: Business integration management model in the healthcare industry. J. Compet. 2022, 14, 6–24. [Google Scholar] [CrossRef]
- Sui, X.; Jiao, S.; Wang, Y.; Wang, H. Digital transformation and manufacturing company competitiveness. Financ. Res. Lett. 2024, 59, 104683. [Google Scholar] [CrossRef]
- Danurdara, A.B.; Darmawan, H.; Kalsum, E.U. The role of digital innovation and its impact on competitiveness and performance: The case of business hotel in Indonesia. Qual.-Access Success 2021, 22, 179–185. [Google Scholar] [CrossRef]
- Feng, H.; Wang, F.; Song, G.; Liu, L. Digital transformation on enterprise green innovation: Effect and transmission mechanism. Int. J. Environ. Res. Public Health 2022, 19, 10614. [Google Scholar] [CrossRef] [PubMed]
- Xu, J.; Yu, Y.; Zhang, M.; Zhang, J.Z. Impacts of digital transformation on eco-innovation and sustainable performance: Evidence from Chinese manufacturing companies. J. Clean. Prod. 2023, 393, 136278. [Google Scholar] [CrossRef]
- Xie, J.; Zhang, T.; Zhao, J. Research on the mechanism of digital transformation to improve enterprise environmental performance. Ind. Manag. Data Syst. 2023, 123, 3137–3163. [Google Scholar] [CrossRef]
- Castro, C.; Lopes, C. Digital government and sustainable development. J. Knowl. Econ. 2022, 13, 880–903. [Google Scholar] [CrossRef]
- Xu, Q.; Li, X.; Guo, F. Digital transformation and environmental performance: Evidence from Chinese resource-based enterprises. Corp. Soc. Responsib. Environ. Manag. 2023, 30, 1816–1840. [Google Scholar] [CrossRef]
- Martincevic, I. The Correlation between Digital Technology and Digital Competitiveness. Int. J. Qual. Res. 2022, 16, 1–18. [Google Scholar] [CrossRef]
- Stankovic, J.J.; Marjanovic, I.; Drezgic, S.; Popovic, Z. The digital competitiveness of European countries: A multiple-criteria approach. J. Compet. 2021, 13, 117–134. [Google Scholar] [CrossRef]
- Kő, A.; Mitev Ariel, Z.; Kovács, T.; Fehér, P.; Szabó, Z. Digital agility, digital competitiveness, and innovative performance of SMEs. J. Compet. 2022, 14, 78–96. [Google Scholar] [CrossRef]
- Skvarciany, V.; Jureviciene, D. Comprehensive assessment of enterprise digital competitiveness. Prague Econ. Pap. 2024, 33, 220–243. [Google Scholar]
- Borowiecki, R.; Siuta-Tokarska, B.; Maroń, J.; Suder, M.; Thier, A.; Żmija, K. Developing digital economy and society in the light of the issue of digital convergence of the markets in the European Union countries. Energies 2021, 14, 2717. [Google Scholar] [CrossRef]
- Balejová, M. Vysehrad Group on the Way to Digital Economy. In Economic, Political and Legal Issues of International Relations; Hlavová, N., Krkošková, Z., Eds.; Ekonóm: Bratislava, Slovakia, 2015; pp. 25–32. [Google Scholar]
- Soldić-Aleksić, J.; Zečević, A.; Chroneos Krasavac, B. Artificial Intelligence in Agriculture: The Impact on Labor Productivity. Econ. Agric./Ekon. Poljopr. 2024, 71, 957–971. [Google Scholar] [CrossRef]
- Marinaș, L.E.; Păun, C.V.; Diaconescu, M.; Smirna, T.G. Artificial Intelligence Readiness and Employment: A Global Panel Analysis. Econ. Comput. Econ. Cybern. Stud. Res. 2024, 58, 1–18. [Google Scholar] [CrossRef]
- Rizvi, S.K.A.; Rahat, B.; Naqvi, B.; Umar, M. Revolutionizing finance: The synergy of fintech, digital adoption, and innovation. Technol. Forecast. Soc. Change 2024, 200, 123112. [Google Scholar] [CrossRef]
- Danik, N.; Rud, I.; Symonenko, O.; Bilousko, T.; Tsikalo, Y. Directions of the Development of the Digital Economy in the Conditions of Military Conflicts. Financ. Credit. Act. Probl. Theory Pract. 2023, 1, 238–248. [Google Scholar] [CrossRef]
- Sagarik, D. Enhancing digital competitiveness through the lens of digital government among Asian economies. Int. J. Public Adm. Digit. Age 2023, 10, 1–11. [Google Scholar] [CrossRef]
- Laitsou, E.; Kargas, A.; Varoutas, D. Digital competitiveness in the European Union era: The Greek case. Economies 2020, 8, 85. [Google Scholar] [CrossRef]
- Skare, M.; de Obesso, M.D.L.M.; Ribeiro-Navarrete, S. Digital transformation and European small and medium enterprises (SMEs): A comparative study using digital economy and society index data. Int. J. Inf. Manag. 2023, 68, 102594. [Google Scholar] [CrossRef]
- Dutta, S.; Lanvin, B. Network Readiness Index 2024; Portulans Institute: Washington, DC, USA, 2024. [Google Scholar]
- Cavaggioni, L.; Trecroci, A.; Formenti, D.; Hogarth, L.; Tosin, M.; Alberti, G. Seasonal changes in breathing pattern, trunk stabilization, and muscular power in Paralympic swimmers. Adapt. Phys. Act. Q. 2021, 38, 215–231. [Google Scholar] [CrossRef]
- Martin, A.L.; Franklin, A.N.; Perlman, J.E.; Bloomsmith, M.A. Systematic assessment of food item preference and Reinforcer Effectiveness: Enhancements in training laboratory-housed rhesus macaques. Behav. Process. 2018, 157, 445–452. [Google Scholar] [CrossRef]
- He, M.; Xu, J.; Wu, Q.; Wang, X.; Ren, J.; Wang, X.; Xue, H.; Jin, Z. Application of compressed sensing 3D mr Cholangiopancreatography (CS-MRCP) with contact-free physiological monitoring (CFPM) for Pancreaticobiliary Disorders. Acad. Radiol. 2021, 28, S148–S156. [Google Scholar] [CrossRef] [PubMed]
- Brynjolfsson, E.; Rock, D.; Syverson, C. Artificial intelligence and the modern productivity paradox. In The Economics of Artificial Intelligence: An Agenda; Agrawal, A., Gans, J., Goldfarb, A., Eds.; The University of Chicago Press: Chicago, IL, USA, 2019; Volume 23, pp. 23–57. [Google Scholar] [CrossRef]
- Jenčová, S.; Vašaničová, P.; Miškufová, M. Multidimensional Evaluation of EU and Slovakia in the Context of Digital Transformation. Cent. Eur. Bus. Rev. 2023, 12, 65–95. [Google Scholar] [CrossRef]
- Zhu, C.; Li, N.; Ma, J. Impact of CEO overconfidence on enterprise digital transformation: Moderating effect based on digital finance. Financ. Res. Lett. 2024, 59, 104688. [Google Scholar] [CrossRef]
- Reier Forradellas, R.F.; Garay Gallastegui, L.M. Digital transformation and artificial intelligence applied to business: Legal regulations, economic impact and perspective. Laws 2021, 10, 70. [Google Scholar] [CrossRef]

| Factors | Sub-Factors | Criteria |
|---|---|---|
| Knowledge | Talent | Educational assessment PISA-Math |
| International experience | ||
| Foreign highly skilled personnel | ||
| Management of cities | ||
| Digital/Technological skills | ||
| Net flow of international students | ||
| Training and education | Employee training | |
| Total public expenditure on education | ||
| Higher education achievement | ||
| Pupil–teacher ratio (tertiary education) | ||
| Graduates in Sciences | ||
| Women with degrees | ||
| Computer science education index | ||
| Scientific concentration | Total expenditure on R&D (%) | |
| Total R&D personnel per capita | ||
| Female researchers | ||
| R&D productivity by publication | ||
| Scientific and technical employment | ||
| High-tech patent grants | ||
| Robots in Education and R&D | ||
| AI articles | ||
| Technology | Regulatory framework | Starting a business |
| Enforcing contracts | ||
| Immigration laws | ||
| Development and application of tech. | ||
| Scientific research legislation | ||
| Intellectual property rights | ||
| AI policies passed into law | ||
| Capital | IT and media stock market capitalization | |
| Funding for technological development | ||
| Banking and financial services | ||
| Country credit rating | ||
| Venture capital | ||
| Investment in Telecommunications | ||
| Technological framework | Communications technology | |
| Mobile broadband subscribers | ||
| Wireless broadband | ||
| Internet users | ||
| Internet bandwidth speed | ||
| High-tech exports (%) | ||
| Secure internet servers | ||
| Future readiness | Adaptive attitudes | E-Participation |
| Internet retailing | ||
| Tablet possession | ||
| Smartphone possession | ||
| Attitudes toward globalization | ||
| Flexibility and adaptability | ||
| Business agility | Opportunities and threats | |
| World robot distribution | ||
| Agility of companies | ||
| Use of big data and analytics | ||
| Knowledge transfer | ||
| Entrepreneurial fear of failure | ||
| IT integration | E-Government | |
| Public–private partnerships | ||
| Cyber security | ||
| Software piracy | ||
| Government cyber security capacity | ||
| Privacy protection by law exists |
| NRI | |||
|---|---|---|---|
| Technology | People | Governance | Impact |
| Access | Individuals | Trust | Economy |
| Content | Businesses | Regulation | Quality of Life |
| Future Technologies | Governments | Inclusion | SDG Contribution |
| AIRI | ||
|---|---|---|
| Government | Technology Sector | Data and Infrastructure |
| Vision | Human Capital | Data Representativeness |
| Governance and Ethics | Innovation Capacity | Data Availability |
| Digital Capacity | Maturity | Infrastructure |
| Adaptability | ||
| Index | Pillars | Indicators |
|---|---|---|
| DQLI | Internet Affordability | Work time it takes to afford the cheapest mobile internet (seconds) Work time it takes to afford the cheapest fixed internet (minutes) |
| Internet Quality | Mobile speed (Mbps) Broadband speed (Mbps) Mobile internet stability (indexed value) Broadband internet stability (indexed value) Mobile internet speed growth (indexed value) Broadband internet speed growth (indexed value) | |
| Electronic Infrastructure | Individuals using the Internet (per 100 inhabitants) Network readiness | |
| Electronic Security | Cybersecurity (index) Data protection laws (indexed values) | |
| Electronic Government | Online Service Index (index) AI readiness (index) |
| Variable | ANOVA χ2 | p-Value | Kendall’s Coefficient of Concordance rk | Average Rank r |
|---|---|---|---|---|
| Ranks 2024 | 94.8483 | 0.0000 | 0.8469 | 0.7958 |
| Ranks 2023 | 95.4345 | 0.0000 | 0.8521 | 0.8028 |
| Ranks 2022 | 101.1793 | 0.0000 | 0.9034 | 0.8712 |
| Ranks 2021 | 104.9241 | 0.0000 | 0.9368 | 0.9158 |
| Ranks 2020 | 79.3287 | 0.0000 | 0.9444 | 0.9166 |
| Ranks 2019 | 76.7540 | 0.0000 | 0.9137 | 0.8706 |
| Ranks WDCR | 161.0161 | 0.0000 | 0.9584 | 0.9501 |
| Ranks NRI | 165.0483 | 0.0000 | 0.9827 | 0.9789 |
| Ranks AIRI | 160.4736 | 0.0000 | 0.9552 | 0.9462 |
| Ranks DQLI | 99.9448 | 0.0000 | 0.8924 | 0.8565 |
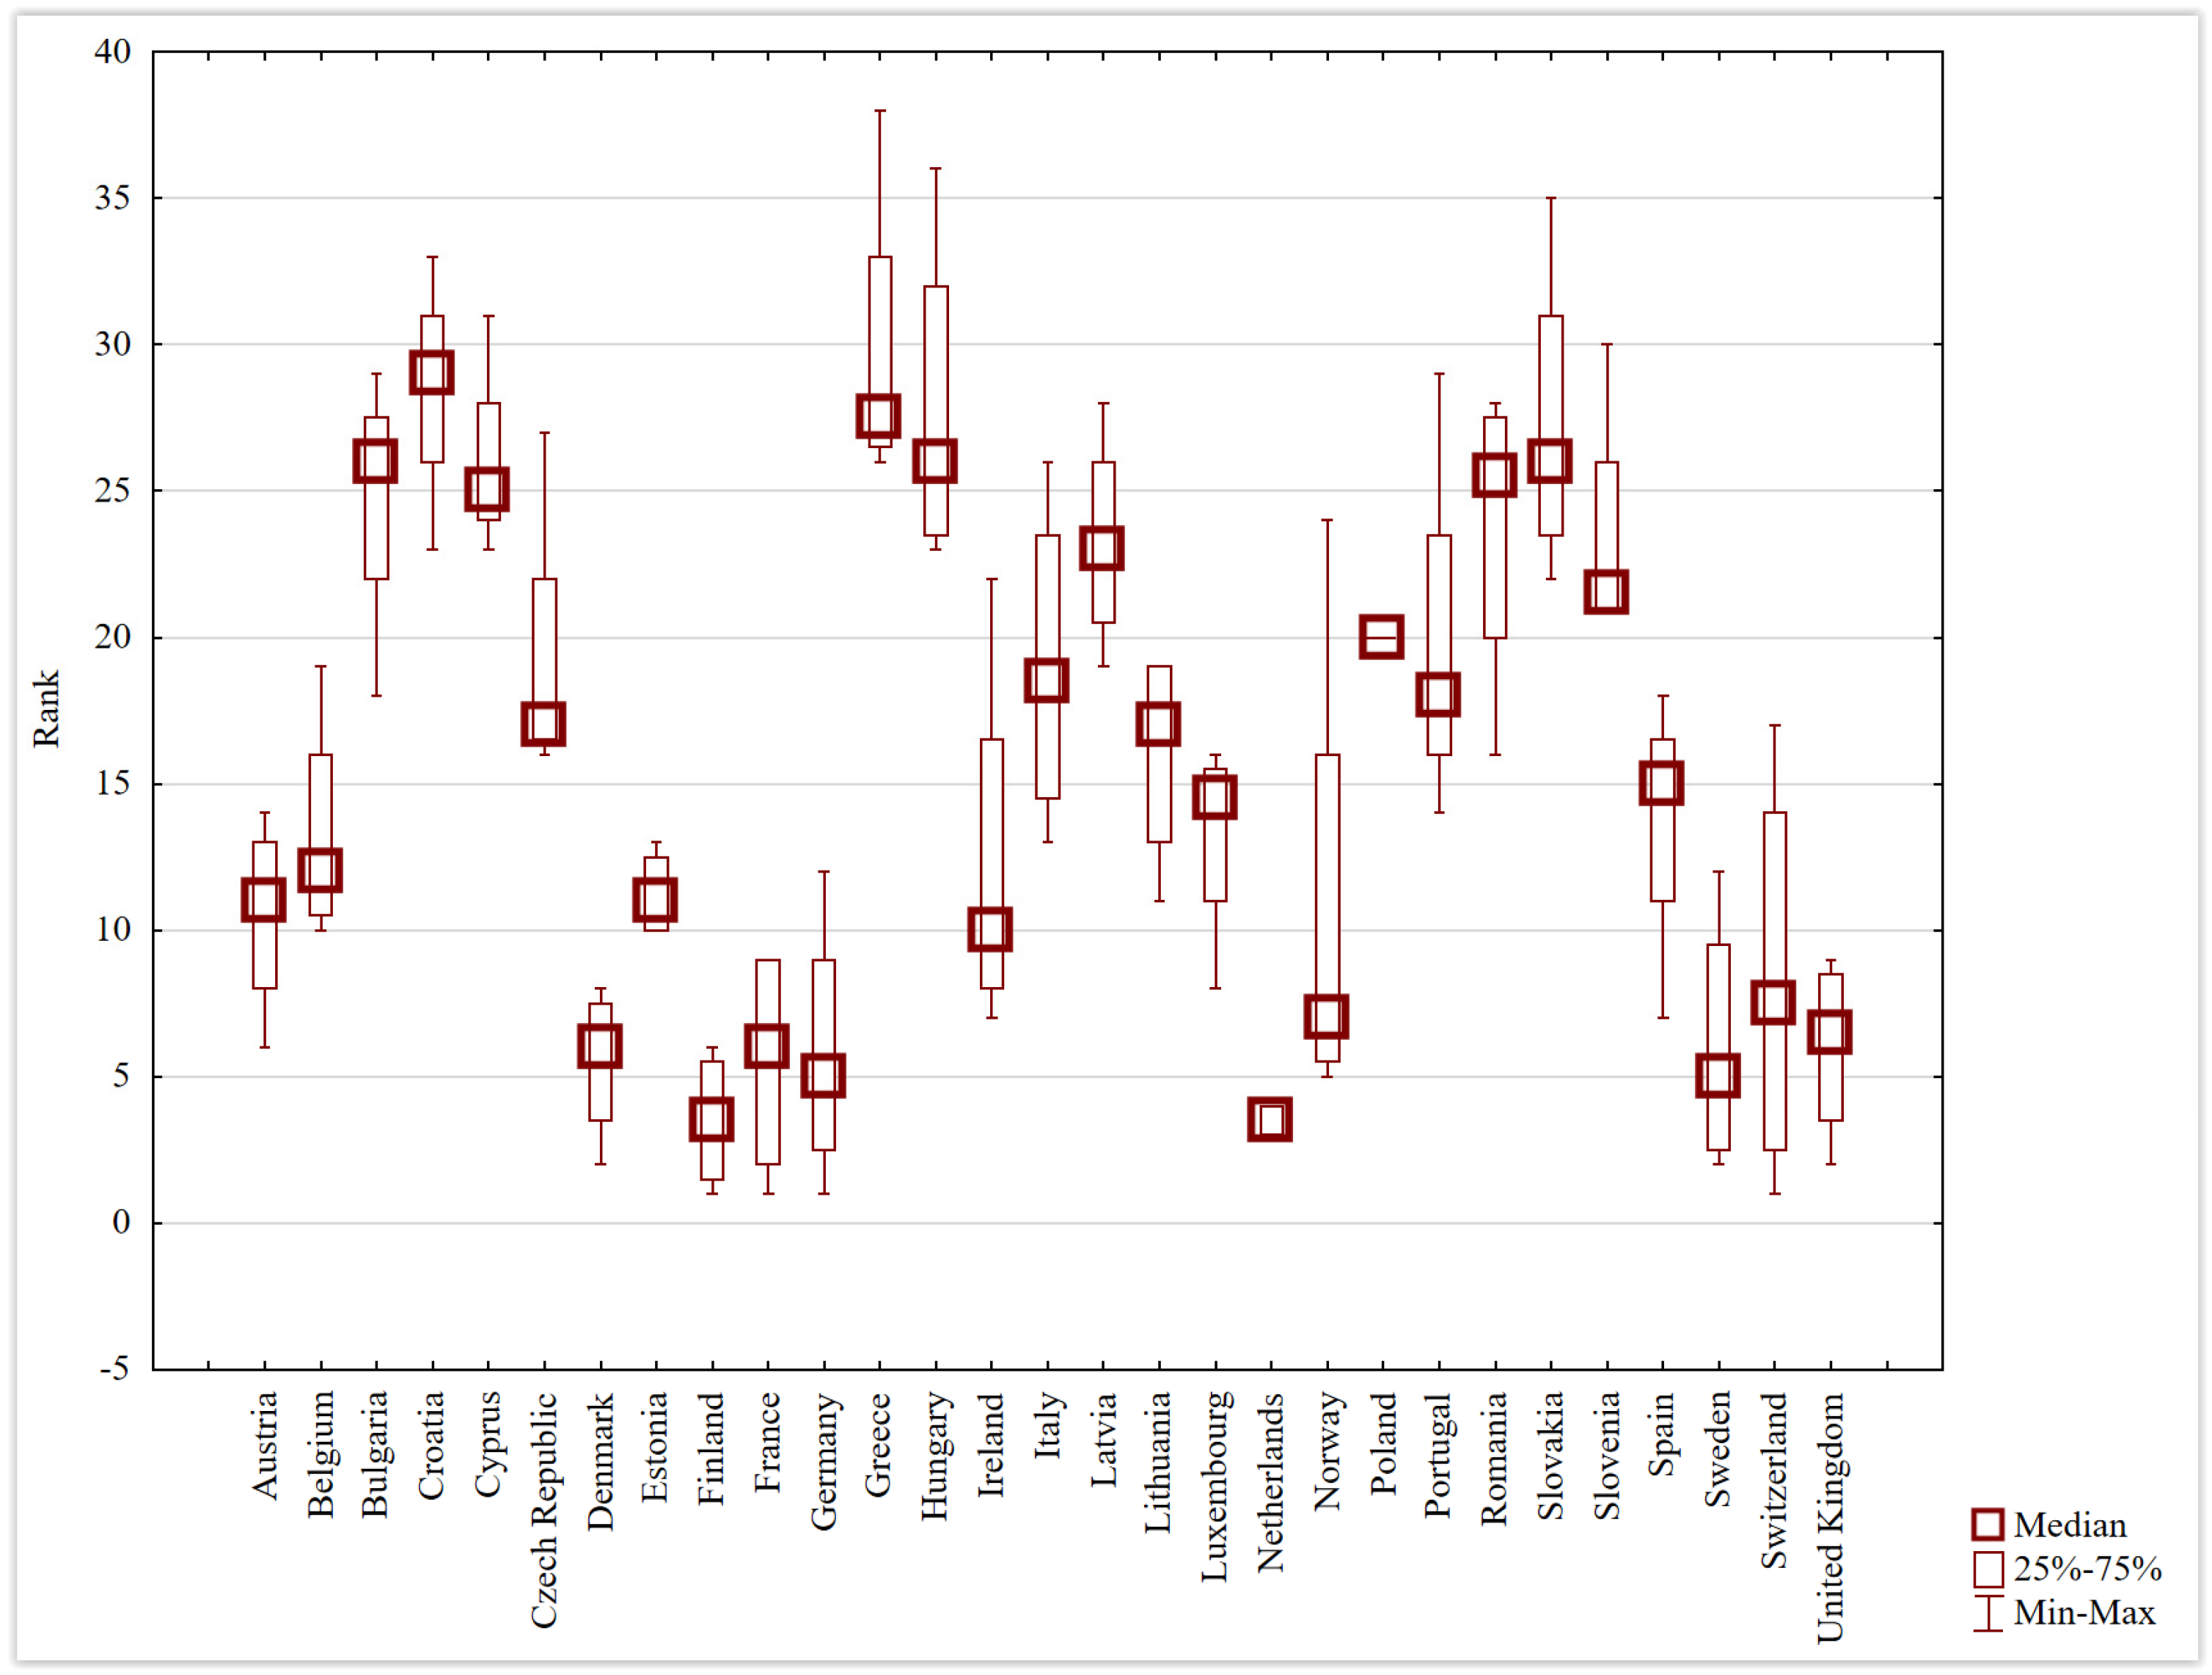
| Country | Average Rank | Sum of Ranks | Mean | Sum | Median | Min | Max | Std. Dev. |
|---|---|---|---|---|---|---|---|---|
| Austria | 10.50 | 42 | 10.50 | 42 | 11.0 | 6 | 14 | 3.4157 |
| Belgium | 12.50 | 50 | 13.25 | 53 | 12.0 | 10 | 19 | 4.0311 |
| Bulgaria | 24.00 | 96 | 24.75 | 99 | 26.0 | 18 | 29 | 4.7170 |
| Croatia | 26.75 | 107 | 28.50 | 114 | 29.0 | 23 | 33 | 4.1231 |
| Cyprus | 24.50 | 98 | 26.00 | 104 | 25.0 | 23 | 31 | 3.4641 |
| Czech Republic | 17.75 | 71 | 19.25 | 77 | 17.0 | 16 | 27 | 5.1881 |
| Denmark | 5.50 | 22 | 5.50 | 22 | 6.0 | 2 | 8 | 2.6458 |
| Estonia | 11.25 | 45 | 11.25 | 45 | 11.0 | 10 | 13 | 1.5000 |
| Finland | 3.50 | 14 | 3.50 | 14 | 3.5 | 1 | 6 | 2.3805 |
| France | 5.50 | 22 | 5.50 | 22 | 6.0 | 1 | 9 | 4.1231 |
| Germany | 5.75 | 23 | 5.75 | 23 | 5.0 | 1 | 12 | 4.6458 |
| Greece | 27.50 | 110 | 29.75 | 119 | 27.5 | 26 | 38 | 5.5603 |
| Hungary | 25.75 | 103 | 27.75 | 111 | 26.0 | 23 | 36 | 5.9090 |
| Ireland | 11.25 | 45 | 12.25 | 49 | 10.0 | 7 | 22 | 6.7020 |
| Italy | 17.50 | 70 | 19.00 | 76 | 18.5 | 13 | 26 | 5.7155 |
| Latvia | 21.75 | 87 | 23.25 | 93 | 23.0 | 19 | 28 | 3.7749 |
| Lithuania | 15.50 | 62 | 16.00 | 64 | 17.0 | 11 | 19 | 3.8297 |
| Luxembourg | 13.25 | 53 | 13.25 | 53 | 14.5 | 8 | 16 | 3.5940 |
| Netherlands | 3.50 | 14 | 3.50 | 14 | 3.5 | 3 | 4 | 0.5774 |
| Norway | 9.50 | 38 | 10.75 | 43 | 7.0 | 5 | 24 | 8.9209 |
| Poland | 19.25 | 77 | 20.00 | 80 | 20.0 | 20 | 20 | 0.0000 |
| Portugal | 18.25 | 73 | 19.75 | 79 | 18.0 | 14 | 29 | 6.4485 |
| Romania | 23.25 | 93 | 23.75 | 95 | 25.5 | 16 | 28 | 5.4391 |
| Slovakia | 25.25 | 101 | 27.25 | 109 | 26.0 | 22 | 35 | 5.5603 |
| Slovenia | 22.00 | 88 | 23.50 | 94 | 21.5 | 21 | 30 | 4.3589 |
| Spain | 13.75 | 55 | 13.75 | 55 | 15.0 | 7 | 18 | 4.7170 |
| Sweden | 6.00 | 24 | 6.00 | 24 | 5.0 | 2 | 12 | 4.5461 |
| Switzerland | 8.25 | 33 | 8.25 | 33 | 7.5 | 1 | 17 | 7.1822 |
| United Kingdom | 6.00 | 24 | 6.00 | 24 | 6.5 | 2 | 9 | 3.1623 |
| WDCR 2024 | NRI 2024 | AIRI 2024 | DQL 2024 | WDCR 2023 | NRI 2023 | AIRI 2023 | DQL 2023 | WDCR 2022 | NRI 2022 | AIRI 2022 | DQL 2022 | WDCR 2021 | NRI 2021 | AIRI 2021 | DQL 2021 | WDCR 2020 | NRI 2020 | AIRI 2020 | DQL 2020 | WDCR 2019 | NRI 2019 | AIRI 2019 | DQL 2019 | |
|---|---|---|---|---|---|---|---|---|---|---|---|---|---|---|---|---|---|---|---|---|---|---|---|---|
| WDCR 2024 | 1.0000 | 0.9158 | 0.8064 | 0.6798 | 0.9512 | 0.9074 | 0.8207 | 0.6970 | 0.9453 | 0.9133 | 0.8478 | 0.8148 | 0.9488 | 0.9163 | 0.8576 | 0.8700 | 0.9365 | 0.9207 | 0.8522 | 0.7384 | 0.9369 | 0.9015 | 0.7808 | 0.6875 |
| NRI 2024 | 1.0000 | 0.9103 | 0.7507 | 0.9207 | 0.9793 | 0.9404 | 0.7369 | 0.9394 | 0.9675 | 0.9409 | 0.8665 | 0.9532 | 0.9675 | 0.9611 | 0.9000 | 0.9379 | 0.9576 | 0.9512 | 0.8090 | 0.9384 | 0.9488 | 0.9128 | 0.7402 | |
| AIRI 2024 | 1.0000 | 0.7118 | 0.8089 | 0.8936 | 0.9704 | 0.6813 | 0.8266 | 0.8773 | 0.9704 | 0.8429 | 0.8419 | 0.8892 | 0.9409 | 0.8419 | 0.8212 | 0.8626 | 0.9266 | 0.7805 | 0.8286 | 0.8626 | 0.9227 | 0.7326 | ||
| DQL 2024 | 1.0000 | 0.6532 | 0.7424 | 0.7675 | 0.9153 | 0.7089 | 0.7064 | 0.7468 | 0.8074 | 0.7015 | 0.7335 | 0.7833 | 0.8163 | 0.7153 | 0.7113 | 0.7867 | 0.7115 | 0.7478 | 0.6695 | 0.7222 | 0.6390 | |||
| WDCR 2023 | 1.0000 | 0.9222 | 0.8177 | 0.6606 | 0.9537 | 0.9350 | 0.8433 | 0.7813 | 0.9429 | 0.9414 | 0.8616 | 0.8305 | 0.9345 | 0.9374 | 0.8433 | 0.7433 | 0.9310 | 0.9236 | 0.7862 | 0.6232 | ||||
| NRI 2023 | 1.0000 | 0.9305 | 0.7419 | 0.9384 | 0.9872 | 0.9197 | 0.8463 | 0.9606 | 0.9857 | 0.9429 | 0.9054 | 0.9360 | 0.9798 | 0.9266 | 0.7783 | 0.9404 | 0.9724 | 0.8778 | 0.7265 | |||||
| AIRI 2023 | 1.0000 | 0.7438 | 0.8576 | 0.9069 | 0.9709 | 0.8704 | 0.8828 | 0.9103 | 0.9645 | 0.8946 | 0.8631 | 0.8990 | 0.9670 | 0.8041 | 0.8586 | 0.8956 | 0.9276 | 0.7436 | ||||||
| DQL 2023 | 1.0000 | 0.7025 | 0.7030 | 0.6990 | 0.8094 | 0.7025 | 0.7296 | 0.7429 | 0.8576 | 0.6798 | 0.7108 | 0.7798 | 0.6902 | 0.7167 | 0.6670 | 0.6951 | 0.6219 | |||||||
| WDCR 2022 | 1.0000 | 0.9414 | 0.8719 | 0.8355 | 0.9645 | 0.9517 | 0.8897 | 0.8631 | 0.9498 | 0.9493 | 0.8833 | 0.7964 | 0.9468 | 0.9340 | 0.8256 | 0.7067 | ||||||||
| NRI 2022 | 1.0000 | 0.8901 | 0.8414 | 0.9655 | 0.9931 | 0.9355 | 0.8926 | 0.9414 | 0.9946 | 0.9182 | 0.7871 | 0.9468 | 0.9872 | 0.8685 | 0.7231 | |||||||||
| AIRI 2022 | 1.0000 | 0.8468 | 0.8833 | 0.9020 | 0.9478 | 0.8576 | 0.8818 | 0.8818 | 0.9291 | 0.8352 | 0.8778 | 0.8734 | 0.9286 | 0.7600 | ||||||||||
| DQL 2022 | 1.0000 | 0.8113 | 0.8567 | 0.8764 | 0.9330 | 0.7921 | 0.8458 | 0.9133 | 0.8396 | 0.8330 | 0.8133 | 0.8532 | 0.8202 | |||||||||||
| WDCR 2021 | 1.0000 | 0.9640 | 0.9143 | 0.8729 | 0.9778 | 0.9734 | 0.9034 | 0.7876 | 0.9665 | 0.9680 | 0.8384 | 0.7026 | ||||||||||||
| NRI 2021 | 1.0000 | 0.9443 | 0.9049 | 0.9399 | 0.9916 | 0.9256 | 0.8117 | 0.9537 | 0.9813 | 0.8808 | 0.7497 | |||||||||||||
| AIRI 2021 | 1.0000 | 0.8941 | 0.8921 | 0.9345 | 0.9793 | 0.8238 | 0.9133 | 0.9197 | 0.9197 | 0.7258 | ||||||||||||||
| DQL 2021 | 1.0000 | 0.8493 | 0.9005 | 0.9256 | 0.8101 | 0.8744 | 0.8754 | 0.8360 | 0.7969 | |||||||||||||||
| WDCR 2020 | 1.0000 | 0.9532 | 0.8759 | 0.8243 | 0.9655 | 0.9374 | 0.8276 | 0.6821 | ||||||||||||||||
| NRI 2020 | 1.0000 | 0.9207 | 0.8128 | 0.9596 | 0.9901 | 0.8527 | 0.7443 | |||||||||||||||||
| AIRI 2020 | 1.0000 | 0.8347 | 0.9034 | 0.9084 | 0.9281 | 0.7504 | ||||||||||||||||||
| DQL 2020 | 1.0000 | 0.8374 | 0.7789 | 0.8402 | 0.8318 | |||||||||||||||||||
| WDCR 2019 | 1.0000 | 0.9429 | 0.8335 | 0.7347 | ||||||||||||||||||||
| NRI 2019 | 1.0000 | 0.8355 | 0.7463 | |||||||||||||||||||||
| AIRI 2019 | 1.0000 | 0.7491 | ||||||||||||||||||||||
| DQL 2019 | 1.0000 |
Disclaimer/Publisher’s Note: The statements, opinions and data contained in all publications are solely those of the individual author(s) and contributor(s) and not of MDPI and/or the editor(s). MDPI and/or the editor(s) disclaim responsibility for any injury to people or property resulting from any ideas, methods, instructions or products referred to in the content. |
© 2025 by the authors. Licensee MDPI, Basel, Switzerland. This article is an open access article distributed under the terms and conditions of the Creative Commons Attribution (CC BY) license (https://creativecommons.org/licenses/by/4.0/).
Share and Cite
Miškufová, M.; Košíková, M.; Vašaničová, P.; Kiseľáková, D. Digitalization and Artificial Intelligence: A Comparative Study of Indices on Digital Competitiveness. Information 2025, 16, 286. https://doi.org/10.3390/info16040286
Miškufová M, Košíková M, Vašaničová P, Kiseľáková D. Digitalization and Artificial Intelligence: A Comparative Study of Indices on Digital Competitiveness. Information. 2025; 16(4):286. https://doi.org/10.3390/info16040286
Chicago/Turabian StyleMiškufová, Marta, Martina Košíková, Petra Vašaničová, and Dana Kiseľáková. 2025. "Digitalization and Artificial Intelligence: A Comparative Study of Indices on Digital Competitiveness" Information 16, no. 4: 286. https://doi.org/10.3390/info16040286
APA StyleMiškufová, M., Košíková, M., Vašaničová, P., & Kiseľáková, D. (2025). Digitalization and Artificial Intelligence: A Comparative Study of Indices on Digital Competitiveness. Information, 16(4), 286. https://doi.org/10.3390/info16040286