Abstract
Problem: Remanufacturers want to increase consumer interest in refurbished products, which motivates the need to understand which product features are important to buyers of refurbished products such as mobile phones. Research Questions: This study addresses two questions. First, which product features are most important for buyers of refurbished iPhones? Second, how do those preferences differ from the preferences of buyers of new iPhones? Methods: Online reviews of iPhones are obtained and converted into a document–term matrix. Using this text model, three subsets of features are identified using statistical analysis of frequency of mention: most frequent, average, and least frequent. A logistic regression (LR) model is then used to identify which features are most predictive of whether a review is for a new or refurbished phone. Results: Buyers of refurbished phones mention battery health, screen/display, shell condition, and brand significantly more often than other features. Directly contrasting reviews of refurbished versus new phones shows that shell condition, brand, speaker, and charger are found to be the most predictive product features indicated in reviews for refurbished phones. Of those, the shell condition is significantly more predictive than the others. Implications: The results identify product features that remanufacturers of iPhones can emphasize to increase customer demand.
1. Introduction
Quantifying how buyers prioritize product features is a difficult but essential task for both manufacturers and remanufacturers. Refurbished products are an environmentally conscious and cost-effective alternative in today’s consumer market, and there is a long-standing need for refurbished product development strategies to increase the proportion of refurbished products on the commercial market [1,2]. These items have been returned to the manufacturer or retailer for various reasons, including minor defects, customer returns, or being used as display models. After undergoing inspection, repair, and quality assurance processes, refurbished products are returned to good condition and sold. By selecting refurbished products, consumers not only save money but also contribute to reducing waste. In addition to environmental factors, some studies demonstrate that remanufacturing and refurbishment can be advantageous business strategies [3,4,5,6].
In this paper, we analyze online reviews to determine what product features are important to buyers of refurbished cell phones and how those preferences differ from those of buyers of new phones. Manufacturers compete based on price, adaptability, and product variety, which are all driven by consumer satisfaction [3,7]. Product innovation research focuses on enhancing consumer satisfaction by optimizing the technical features of products or developing new configurations of various features [8,9]. Traditionally, companies obtain data from sources such as surveys and customer feedback and analyze it using methods such as conjoint analysis, competitor analysis, and user analytics [10], and this has been used for product design for cell phones [11]. However, although some research exists in this area [12], it may be difficult to obtain the appropriate data to apply these methods to refurbished products, even though it is frequently utilized in evaluating the features of new products.
Another source of data for determining customer satisfaction and customer preferences is online reviews. Such text data are a rich source of user-generated content, including real-time unfiltered discussions, which can provide qualitative insights for manufacturers, designers, and remanufacturers about customers’ preferences for product features. A great deal of related prior work exists that utilizes text data. A recent study explores the development characteristics and the trends of industrial product e-commerce using text-mining techniques by analyzing policy documents, industry reports, and standards with natural language processing methods, namely, term frequency-inverse document frequency (TF-IDF), Word2Vec, and latent Dirichlet allocation topic modeling [13]. Amazon reviews of Bluetooth earphones have also been analyzed using topic modeling and association rule mining to identify customer concerns [14]. The authors highlighted how combining these techniques enhances sentiment analysis for the purpose of product improvement [14]. In other related work, online reviews are analyzed to assess customer sentiments and product competitiveness using TF-IDF text mining and k-means clustering to find key customer concerns. Moreover, the authors categorized product competitiveness into four different quadrants: advantage, struggle, opportunity, and waiting areas—guiding businesses to improve products and services based on evolving customer preferences [15]. In another related study, the authors proposed the AgriMFLN model, an improved long short-term memory (LSTM) based deep learning approach for the sentiment analysis of agricultural product reviews. Their model demonstrates superior performance over traditional LSTM, bidirectional long short-term memory, and transformer models, highlighting its effectiveness in classifying customer sentiment [16]. The ERF-XGB model, an ensemble learning approach combining Random Forest and XGBoost, has also been proposed in another study for sentiment classification of product reviews in e-commerce. By optimizing sentiment classification, this approach enhances customer insights, guiding businesses in improving product offerings and service quality [17].
While there exists considerable work that aims to utilize online reviews to understand customer preferences as they relate to new products [18,19,20,21,22], the value of this type of data is arguably even higher for remanufactured products where the availability of consumer research may be sparse; and there does not appear to be a great deal of prior work in this area. In a recent paper, the authors report the data sources of data of the relevant literature that analyzes refurbished products from the perspective of consumer preference and note eight papers based on survey results, two based on eBay data, and only one based on online reviews [23]. This exception is the work of researchers [24] who analyzed customer satisfaction with refurbished iPhones based on reviews obtained from two online sources. Related work also analyzes consumer opinions of refurbished iPhones using text mining of Amazon reviews [25]. However, prior research utilizing online reviews to obtain insights into how customers view refurbished products is indeed sparse. To the best of our knowledge, the present paper is the first to analyze online reviews for the purpose of identifying differences in preferences between buyers of new and refurbished products.
Specifically, this study provides a new approach for prioritization of product features and applies it by analyzing product feature importance for iPhone 11 data. The approach has two components. First, a statistical analysis is used to divide the iPhone features mentioned in the online product reviews into three groups: most frequent, average, and least frequently mentioned product features. Those groups are further contrasted for new versus refurbished buyers. Second, a classification model based on logistics regression is formulated to identify the product features that are the most discriminative between reviews by buyers of refurbished versus new phones when used as independent variables in the model. This provides insights into what features are important to buyers of remanufactured cell phones, and remanufacturers can utilize these insights to develop or repair new and refurbished iPhones in a way that satisfies consumers and increases their intent to purchase.
2. Materials and Methods
This section describes how review data were collected and prepared and how it was analyzed to identify important features for both new and refurbished products.
2.1. Dataset Construction
After evaluating options that included Amazon, Back Market, eBay, and GSMArena, we selected Amazon and GSMArena as our review sources. Amazon was selected as the source for refurbished iPhone reviews due to its many reviews, associated models, and additional information, including dates. Other websites either lacked enough reviews or had reviews that were unorganized and poorly structured. For refurbished iPhone reviews, Amazon stood out as the best source, offering thousands of reviews for each model. Additionally, for new iPhone models, GSMArena provided over a thousand reviews for multiple models, whereas other websites had significantly fewer. Using automated web crawling techniques, we gathered multiple reviews from Amazon for the various refurbished iPhone models, and finally, the refurbished iPhone 11 has been selected as the case study. As the focus of the study is to contrast new versus refurbished phones, we chose to use a single model, namely the iPhone 11, as it was believed that using multiple models might introduce additional complicating factors. The specific model was chosen rather than a more recent model because, at the time of the study, there was a substantial amount of data available for both new and refurbished iPhones of this model. Due to this, questions regarding how consumer preferences differ between models and how consumer preferences may evolve over time will not be investigated. GSMArena was chosen as the source for the new iPhone 11 reviews. From January 2020 to September 2022, refurbished and new iPhone reviews have been collected using web crawling techniques. 3350 Amazon reviews for the refurbished iPhone 11 and 1052 GSMArena reviews for the new iPhone 11 were gathered. We chose a single source for each type of phone to avoid issues that may arise when merging data from distinct sources, but on the other hand we cannot guarantee that the data are representative of all reviews.
The collected review text was preprocessed to convert the unprocessed text into a format suitable for subsequent processing. Among the preprocessing steps we implemented are the following:
- Text Lowercasing: All text has been converted to lowercase to assure consistency.
- Tokenization: The text was tokenized into separate words and punctuation marks.
- Stop word Removal: Common stop words (such as “and” “the” and “is”) were eliminated to reduce dimensionality and eliminate noise.
- Special Character Removal: To simplify the text and emphasize the content, special characters such as emoticons, hashtags, and URLs were removed.
- Lemmatization: considering the context, each term was converted to its Lemma, which is its meaningful base form.
- Stemming: The last few characters of a word were removed or stemmed.
Missing values (reviews without text body) were eliminated from these datasets, resulting in 3322 and 1052 refurbished and new reviews, respectively. The data collection, preprocessing, and analysis have been all conducted using Python 3.11 in Google Colab using libraries including NumPy, Pandas, bs4, Requests, TextBlob, Scikit-learn, Gensim, NLTK, Statistics, and SciPy. Depending on the websites from which we obtained the data, there were multiple columns along with review text, such as dates, star ratings, and profile names, but we excluded all such columns, leaving only the review body. A sample review is shown in Figure 1, which shows both the original review and the processed version after tokenization, stop word removal, lemmatization, stemming, and eliminating tokens with fewer than three letters.
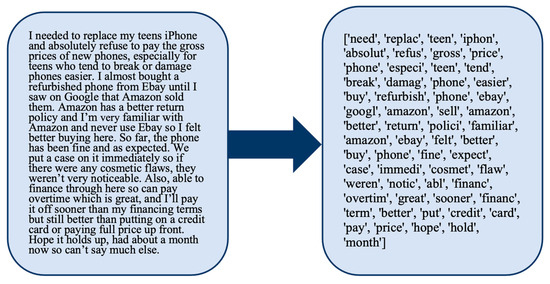
Figure 1.
A sample review in both the original and preprocessed format.
As indicated by the example in Figure 1, a variety of terms represents each review, but for this study, we are not necessarily interested in including all those terms in our model of the review text. The objectives of this study are to identify product features that are important to buyers of refurbished products and to identify which such product features are more important to buyers of refurbished products versus buyers of new products. Thus, we are only interested in including terms that represent product features in our model, and most of the terms shown in the example in Figure 1 will hence be eliminated. We begin by converting the preprocessed review text into analyzable numerical attributes. This procedure is necessary to convert the unprocessed text into a suitable format for further analysis. The set of product features is selected for the review texts, and the features that were mostly discussed in the reviews have been selected for further analysis. As we require tokens with their respective frequencies, we use the document–term–matrix (DTM) model described below.
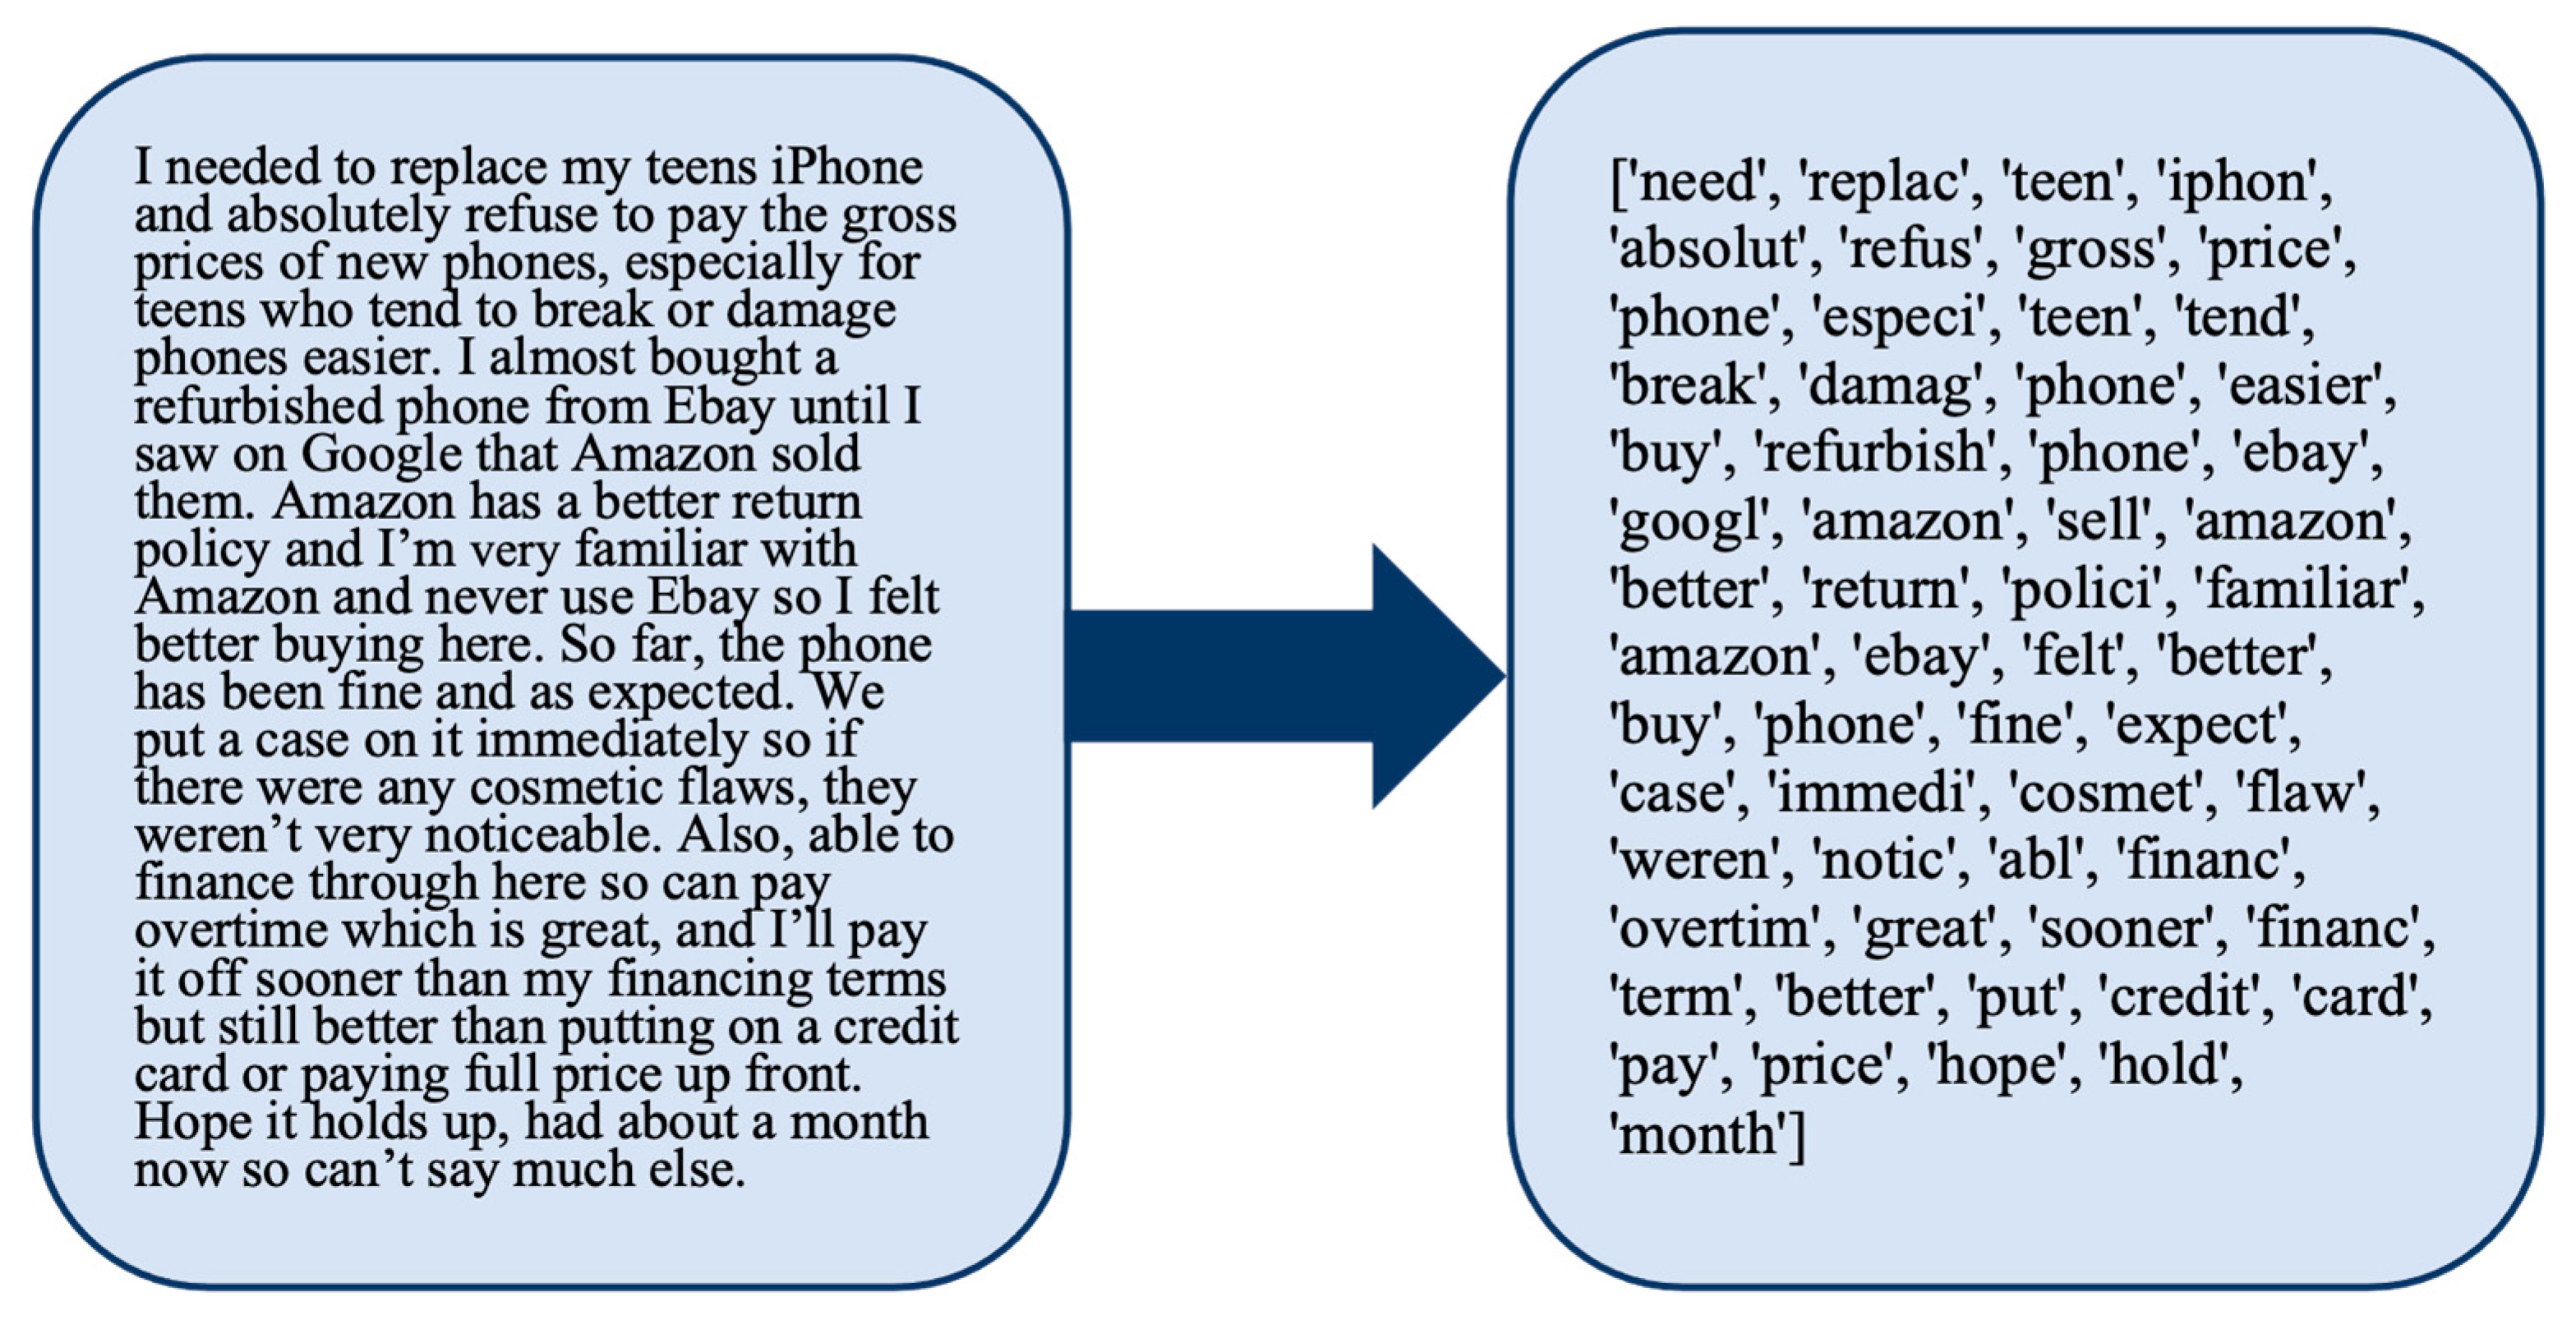
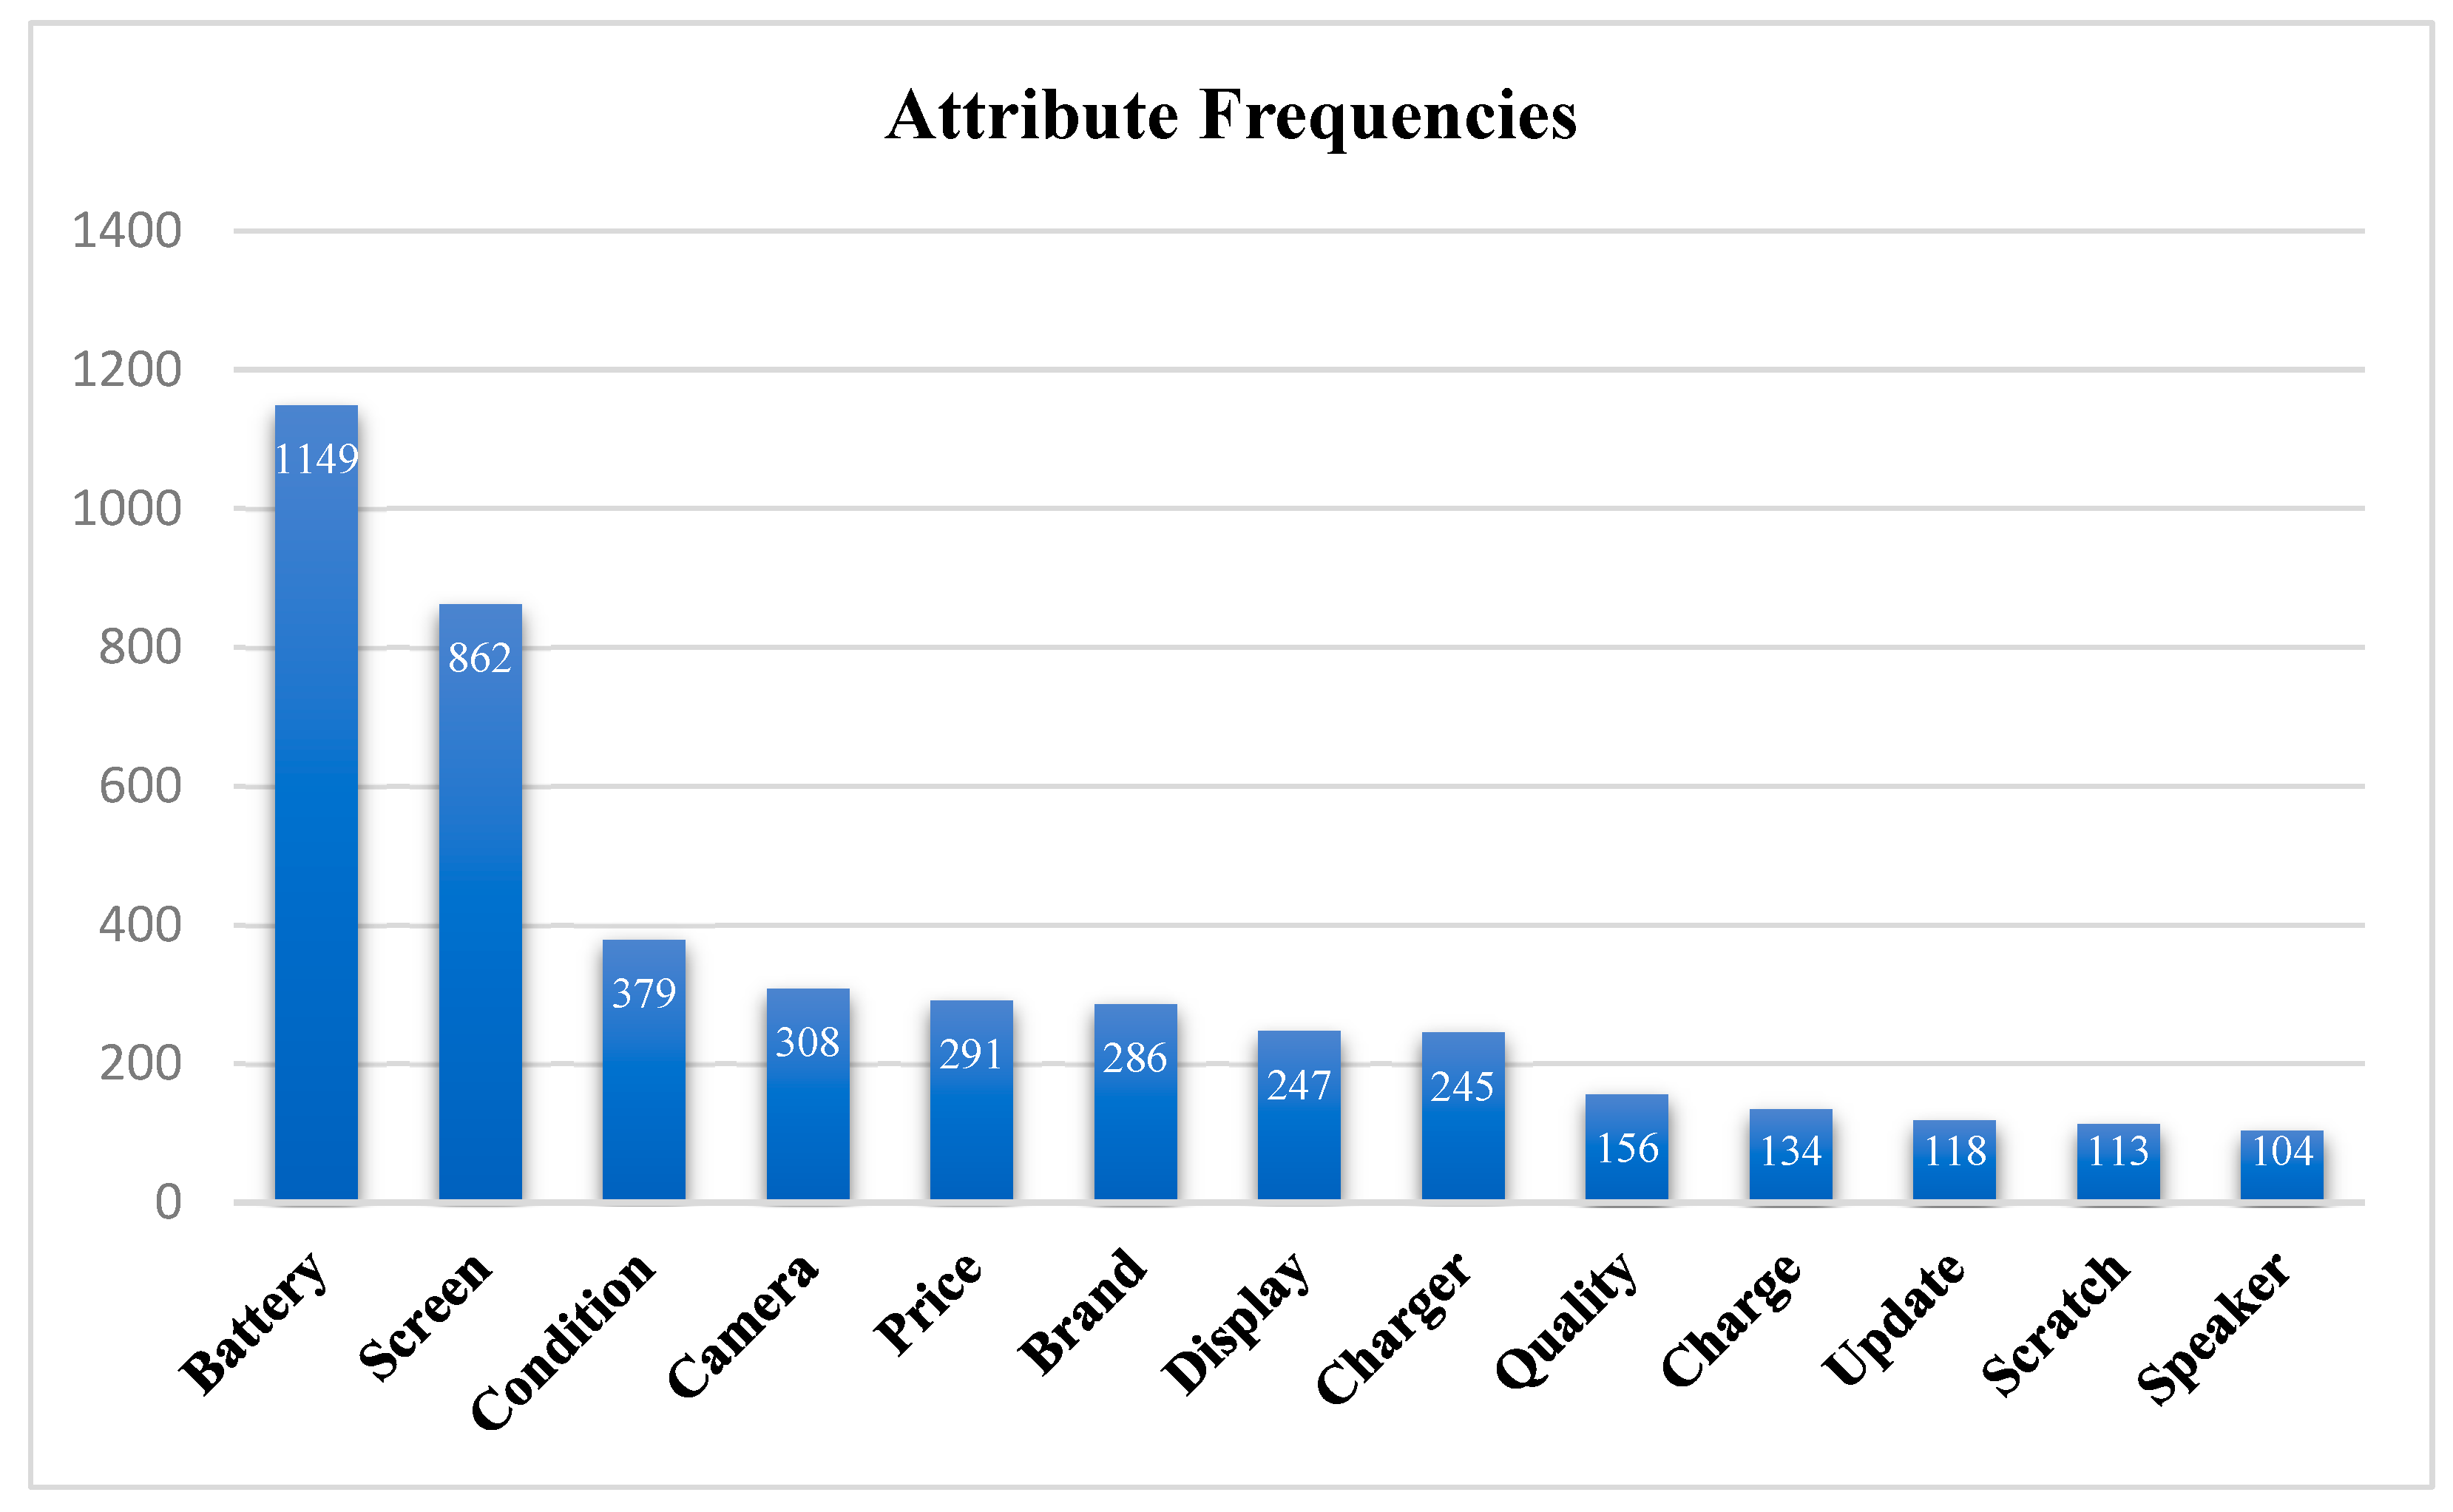
A DTM is a two-dimensional representation in which rows correspond to documents in a corpus (in this problem, each row represents a review), and columns correspond to unique terms or tokens across the entire corpus. Each cell in the matrix contains a numeric value indicating the frequency or significance of a specific term in a particular document. The DTM condenses textual data into a structured format readily usable for quantitative analysis. This method can display the frequency of various terms throughout an entire document where documents are combinations of different terms, and it can assist us in identifying some of the most frequent features across all reviews. For this purpose, the general DTM has been generated from all the reviews, and all the terms in the DTM have been checked to separate the terms representing product features from the whole set of terms. Forty-eight terms have been chosen as such features (or attributes) of the iPhone, and their frequencies in the reviews have been found. Among all these terms, we have focused on the most frequent ones, repeated more than one hundred times. This reduced set includes thirteen product features, which are shown in Figure 2.

Figure 2.
Frequencies of features with at least one hundred occurrences in the combined reviews for new and refurbished phones.
The attributes and features shown in Figure 2 are the most frequent ones according to the reviews, and they will be further analyzed to cast light on the differences in consumer priorities when deciding whether to purchase a new iPhone or a refurbished one. From this list of thirteen features, we note that some refer to very similar, if not identical, concepts. They may have been used interchangeably and refer to the same iPhone component or functionality, and we thus choose to merge those features into one. Specifically, we merged charge and battery into one feature called battery health, we merged screen and display into one feature called screen/display, and we merged condition and scratch into one feature called shell condition. We thus end up with ten product features that capture all the occurrences shown in Figure 2.
Even though the DTM contains values that indicate the frequency of tokens in each document, to answer the questions posed in this study the most significant factor is whether it contains each token. In other words, the presence or absence of a token (product feature) is more significant than the number of times it appears in the document. Therefore, values greater than one are replaced with one, while values equal to zero or one remain unmodified.
2.2. Determining Feature Importance
In this section, we describe the methods employed to analyze the data. The first part identifies subsets of product features according to their frequency of mention and is applied to reviews for refurbished and new phones separately. The second part sets up a classification problem to discriminate reviews of the two types and uses this model to identify the most discriminative features.
The first part of the analysis partitions the set of product features into one of three groups: high proportion of occurrences (), average (), and low proportion of occurrences () in reviews at significance level , for reviews of both refurbished and new phones separately. To determine the appropriate group for each feature, we calculate the proportion of reviews that mention each feature , and calculate the median proportion and compare the frequency of each feature with this median value. Features with proportions that are significantly higher than the median are placed in the high-proportion group, and similarly, a low-proportion group is constructed. Those feature that are not statistically significant from the median are placed in the average proportion group. Mathematically, these feature subsets are defined as follows:
The underlying statistical model for the hypothesis testing is to view the number of occurrences of each feature as a binomial random variable with parameters and , where is the success probability, and denotes the number of documents. When is large, and is not too small, the binomial distribution is sufficiently approximated with a normal distribution, and z-tests are appropriate for hypothesis testing, which we will do here since all the values are sufficiently large.
After partitioning the set of features into and , we check for overlap by testing if the values of two features from different groups are statistically distinct from one another. Thus, we identify the closest pairs of features from different groups and compare them to determine whether the difference between their values are statistically different from zero. For instance, the feature with the minimum value from the high proportion of occurrences group is compared with the feature with the maximum value from the average proportion of occurrences group .
These two features are compared with their values to check the accuracy of their grouping. If the difference between the features values is statistically different from 0, and they were placed in different groups correctly.
Although the three categories of features for refurbished and new iPhones provide insight into the relative significance of features, these do not directly determine if a feature is more important for buyers of refurbished versus new phones. To identify such features directly, we formulate a classification problem. The response variable is the type of review; that is, if the review is for a refurbished phone and if the review is for a new phone, . The explanatory variables describe the presence of a feature and the polarity of the review, that is, the estimated strength of emotions of the reviewer. If a feature is not mentioned, then , . Suppose feature is mentioned, then is assigned a discrete value between 1 and 5 based on the absolute value of the polarity of review . The polarity measure ranges from −1 (extremely negative) to +1 (extremely positive) and the review text’s polarity was calculated using the Text Blob library in Python. If the absolute value of the polarity is less than 0.2, , and similarly, absolute polarities less than 0.4, 0.6, 0.8, and 1 are transformed to 2, 3, 4, and 5.
While any standard classification algorithm could be applied to this problem, since the interpretation of product feature importance is of primary importance, we use logistics regression (LR). Each independent variable corresponds to a product feature. The dependent variable indicates if the product review is for a refurbished product () or a new product (). We then assume a linear model relates the type of review and the product features:
In other words, the underlying statistical model is a LR model with an intercept , a main effect for each feature and no interaction terms. This model enables us to determine the significance of the relationship of the independent variables (product features) with the dependent variable (type of review). Specifically, we use the Wald test statistics to calculate -values for each feature . The features coefficients are divided into three groups: significant explanatory features indicating refurbished iPhones (), significant explanatory features indicating new iPhones (), and features that do not have a strong relationship with the response variable () at significance level .
For further interpretation, odds ratio are used to measure the relationship between the feature and the likelihood of the event , that is, the likelihood that the review is for a refurbished product.
3. Results
The proportions for the ten different features mentioned in the reviews of refurbished and new iPhone 11 are reported in Table 1. The median proportions equal 0.057 and 0.035 for reviews of refurbished and new phones, respectively. The three groups of features that are mentioned significantly more frequently than the median, significantly less frequently than the median, and indistinguishable from the median are shown in Table 2 for both types of reviews. To verify if the groups are distinct, the features with the closest proportions were also compared. For example, for reviews of refurbished phones, the proportion for the camera feature was compared to the charger feature and the hypothesis test indicated that and this difference is significant at the significance level used throughout. The remaining differences were similarly found significant, and we conclude that three statistically different groups of features have been identified for each type of product review. Thus, based on the frequency of mentions in online reviews, buyers of refurbished iPhone 11s mentioned battery health, screen/display, shell condition, and brand significantly more often than other features. The first of those also had significantly frequent mentions in reviews of new phones, whereas the latter two had significantly few mentions.

Table 1.
The proportion of reviews mentioning each feature for reviews of both refurbished and new iPhones. The larger proportion is boldfaced for each feature.
Table 2.
Three categories of refurbished and new iPhone 11 features were constructed by comparing the proportion of reviews ( = p-value) that mention the feature to the median proportion across all features. Frequent has and infrequent has .
The results reported in Table 1 and Table 2 can be contrasted between reviews of new and refurbished products. For example, it may be interesting that the camera is a frequently mentioned feature in reviews of new phones, whereas it is less frequently mentioned for refurbished phones and vice versa for shell condition. However, as the results are obtained separately from each set of reviews, these results do not directly tell us if a feature is predictive of the type of review. Such results, however, are obtained from the LR model that classifies reviews as either for refurbished or new phones. Those results are reported in Table 3.
Table 3.
The regression coefficients and odds ratios of the logistic regression model for classifying reviews as reviews of refurbished versus new iPhones. Significant negative coefficients indicate the feature predicts the review is for a new iPhone, and vice versa for significant positive coefficients.
From Table 3, we observe that at a significance level of , the set of features that predicts refurbished product reviews is , indicating that these four features are more associated with reviews of refurbished phones. The estimated odds ratios for those features are 1.5, 1.9, 1.9, and 4.9, respectively. The first three are statistically indistinguishable according to the reported confidence intervals, but the odd ratio for the shell condition is significantly higher than the others. On the other hand, , indicating that these two features are more associated with reviews of new phones and their odds ratios are not statistically different from each other. Finally, , indicating the same interest in those features for both sets of buyers.
4. Discussion
The results reported in Table 2 suggest that battery health, screen/display, shell condition, and brand are mentioned significantly more often than the other features studied in online reviews of buyers of refurbished iPhone 11 and can be taken as an indication of which features are most important to such buyers. In contrast, battery health, screen/display, camera, and price are most frequently mentioned in online reviews of the new iPhone 11. Both sets of reviewers frequently mention battery health and screen/display. But whereas camera and price appear more frequently in reviews for new products, shell condition and brand are more frequently mentioned by buyers of refurbished phones.
The results reported in Table 3 indicate that refurbished iPhone buyers are relatively more concerned with the charger, brand, speakers, and shell condition, whereas new iPhone buyers are more concerned with the camera and screen/display. Price, quality, update, and battery health are not significant predictors of the review type, but this does not imply they are unimportant. In fact, battery health is the most frequently mentioned feature by both groups (Table 1). In other words, it is a poor predictor of differences because it is very important to both groups of buyers. It is also noteworthy that price is not a significant predictor of differences, even though it is in the subset of most frequently mentioned features for new phones and only in the average subset for refurbished phones. However, a closer look at Table 1 reveals that it has an almost identical proportion of mention for both groups, explaining why it is a poor predictor.
Remanufacturers can use these results to prioritize product features, both in their refurbishing work and in promoting the refurbished products to potential buyers. In many cases a potential buyer may be contemplating if a refurbished product should be purchased (at a lower price) versus a new product. To reach such potential buyers it is useful for the remanufacturing to know that, for example, their customer base may be more concerned with the speakers, shell condition, and charger versus the phone camera and display. Based on this information, the refurbishing process could hence verify that the speakers are operational, correctly describe the shell condition and that the phone is packaged with a functioning charger. All of this could then be communicated to the potential buyer. As a limitation, it should be noted that these specific recommendations apply to the iPhone 11 only, and we have not studied how preferences vary between models or how customer preferences may change over time. This would be an important future study.
The method proposed is a general and interpretable framework to assist in the prioritization of product features based on the importance of features to consumers as determined by an analysis of online user reviews. The uniqueness of the framework stems from its focus on discriminating between refurbished and brand-new product user reviews. This framework can be enhanced in the future to overcome its current limitations. Due to the huge number of terms available in DTM, it is extremely time-consuming to examine each one for features. In the future, other methods will be investigated to expedite and simplify the extraction of features from reviews. Moreover, because the review text can be shorter or longer and may differ based on the reviewer’s personal tastes, we intend to develop a more effective method for text analysis by considering the addition of a new phase that focuses on standardizing the review texts. By modifying the review text, we will lose the sentiments behind it, but we will be able to limit or eliminate the impact of the reviewer’s individual tastes on the final output. In addition, we will incorporate the sentiments of the features into our analysis when using logistic regression rather than the polarity of the entire review. In a review, for instance, more than one feature may have been mentioned with differing sentiments, but in this study, the overall polarity of the review was used for analysis, whereas evaluating each feature along with its associated sentiments could produce more accurate results. Finally, our framework must be further evaluated on additional products to confirm its applicability and validity.
Author Contributions
Conceptualization, G.E.O.K. and A.A.; methodology, S.O. and A.A.; software, A.A.; validation, A.A.; formal analysis, S.O. and A.A.; investigation, G.E.O.K., A.A. and S.O.; resources, G.E.O.K.; data curation, A.A.; writing—original draft preparation, A.A. and S.O.; writing—review and editing, G.E.O.K., A.A. and S.O.; visualization, A.A.; supervision, S.O.; project administration, G.E.O.K.; funding acquisition, G.E.O.K. All authors have read and agreed to the published version of the manuscript.
Funding
The authors gratefully acknowledge the support by the U.S. Department of Energy’s Office of Energy Efficiency and Renewable Energy (EERE) under the Advanced Manufacturing Office award number DE-EE 0007897 awarded to the REMADE Institute, a Division of Sustainable Manufacturing Innovation Alliance Corp. under the REMADE Institute project number 19-01-DE-01.
Institutional Review Board Statement
Not applicable.
Informed Consent Statement
Not applicable.
Data Availability Statement
The data presented in this study are available in GitHub at https://github.com/Atefeha1995/Data-Finding-Features-Refurbished-iPhones (accessed on 10 February 2025). These data were derived from the following resources available in the public domain: Amazon at https://www.amazon.com, and GSMArena at https://www.gsmarena.com.
Conflicts of Interest
The authors declare no conflicts of interest.
Abbreviations
| LR | Logistics Regression |
| TF-IDF | Term Frequency-Inverse Document Frequency |
| LSTM | Long Short-Term Memory |
| DTM | Document–Term Matrix |
References
- Jiménez-Parra, B.; Rubio, S.; Vicente-Molina, M.A. Key drivers in the behavior of potential consumers of remanufactured products: A study on laptops in Spain. J. Clean. Prod. 2014, 85, 488–496. [Google Scholar]
- Souza, G.C. Closed-loop supply chains: A critical review, and future research. Decis. Sci. 2013, 44, 7–38. [Google Scholar]
- Agard, B.; Kusiak, A. Data-mining-based methodology for the design of product families. Int. J. Prod. Res. 2004, 42, 2955–2969. [Google Scholar] [CrossRef]
- Harms, R.; Linton, J.D. Willingness to pay for eco-certified refurbished products: The effects of environmental attitudes and knowledge. J. Ind. Ecol. 2016, 20, 893–904. [Google Scholar]
- Ovchinnikov, A.; Blass, V.; Raz, G. Economic and environmental assessment of remanufacturing strategies for product+ service firms. Prod. Oper. Manag. 2014, 23, 744–761. [Google Scholar] [CrossRef]
- Saidani, M.; Liu, X.; Huey, D.; Kim, H.; Wang, P.; Anisi, A.; Kremer, G.; Greenlee, A.; Shannon, T. Calculator for sustainable tradeoff optimization in multi-generational product family development considering Re-X performances. In Technology Innovation for the Circular Economy: Recycling, Remanufacturing, Design, Systems Analysis and Logistics; John Wiley & Sons, Inc.: Hoboken, NJ, USA, 2024; pp. 157–169. [Google Scholar]
- Anisi, A.; Kremer, G.O.; Olafsson, S. Insights from dynamic pricing scenarios for multiple-generation product lines with an agent-based model using text mining and sentiment analysis. Int. J. Adv. Prod. Res. 2024, 1, 24–45. [Google Scholar] [CrossRef]
- Dou, R.; Li, W.; Nan, G.; Wang, X.; Zhou, Y. How can manufacturers make decisions on product appearance design? A research on optimal design based on customers’ emotional satisfaction. J. Manag. Sci. Eng. 2021, 6, 177–196. [Google Scholar] [CrossRef]
- Okudan, G.E.; Chiu, M.C.; Kim, T.H. Perceived feature utility-based product family design: A mobile phone case study. J. Intell. Manuf. 2013, 24, 935–949. [Google Scholar] [CrossRef]
- Agarwal, J.; DeSarbo, W.S.; Malhotra, N.K.; Rao, V.R. An interdisciplinary review of research in conjoint analysis: Recent developments and directions for future research. Cust. Needs Solut. 2015, 2, 19–40. [Google Scholar]
- Kim, T.H.; Okudan, G.L.E.; Chiu, M.C. Product family design through customer perceived utility. In Proceedings of the International Design Engineering Technical Conferences and Computers and Information in Engineering Conference, Montreal, QC, Canada, 15–18 August 2010; Volume 44144, pp. 39–47. [Google Scholar]
- Wallner, T.S.; Magnier, L.; Mugge, R. Do consumers mind contamination by previous users? A choice-based conjoint analysis to explore strategies that improve consumers’ choice for refurbished products. Resour. Conserv. Recycl. 2022, 177, 105998. [Google Scholar] [CrossRef]
- Sun, Z.; Zong, Q.; Mao, Y.; Wu, G. Exploring the features and trends of industrial product e-commerce in China using text-mining approaches. Information 2024, 15, 712. [Google Scholar] [CrossRef]
- Maidar, U.; Ra, M.; Yoo, D. A cross-product analysis of earphone reviews using contextual topic modeling and association rule mining. J. Theor. Appl. Electron. Commer. Res. 2024, 19, 3498–3519. [Google Scholar] [CrossRef]
- Wen, Z.; Chen, Y.; Liu, H.; Liang, Z. Text mining-based approach for customer sentiment and product competitiveness using composite online review data. J. Theor. Appl. Electron. Commer. Res. 2024, 19, 1776–1792. [Google Scholar] [CrossRef]
- Liu, R.; Wang, H.; Li, Y. AgriMFLN: Mixing features LSTM networks for sentiment analysis of agricultural product reviews. Appl. Sci. 2023, 13, 6262. [Google Scholar] [CrossRef]
- Alghazzawi, D.M.; Alquraishee, A.G.A.; Badri, S.K.; Hasan, S.H. ERF-XGB: Ensemble random forest-based XGboost for accurate prediction and classification of e-commerce product review. Sustainability 2023, 15, 7076. [Google Scholar] [CrossRef]
- Jin, J.; Jia, D.; Chen, K. Mining online reviews with a Kansei-integrated Kano model for innovative product design. Int. J. Prod. Res. 2022, 60, 6708–6727. [Google Scholar] [CrossRef]
- Joung, J.; Kim, H.M. Explainable neural network-based approach to Kano categorisation of product features from online reviews. Int. J. Prod. Res. 2022, 60, 7053–7073. [Google Scholar] [CrossRef]
- Newman, A.; Bavik, Y.L.; Mount, M.; Shao, B. Data collection via online platforms: Challenges and recommendations for future research. Appl. Psychol. 2021, 70, 1380–1402. [Google Scholar] [CrossRef]
- Zhang, J.; Wang, Y.; Xie, T. Software feature refinement prioritization based on online user review mining. Inf. Softw. Technol. 2019, 108, 30–34. [Google Scholar] [CrossRef]
- Zhang, L.; Chu, X.; Xue, D. Identification of the to-be-improved product features based on online reviews for product redesign. Int. J. Prod. Res. 2019, 57, 2464–2479. [Google Scholar] [CrossRef]
- Alyahya, M.; Agag, G.; Aliedan, M.; Abdelmoety, Z.H. Understanding the factors affecting consumers’ behavior when purchasing refurbished products: A chaordic perspective. J. Retail. Consum. Serv. 2023, 75, 103492. [Google Scholar]
- Nasiri, M.S.; Shokouhyar, S. Actual consumers’ response to purchase refurbished smartphones: Exploring perceived value from product reviews in online retailing. J. Retail. Consum. Serv. 2021, 62, 102652. [Google Scholar]
- Seifian, A.; Shokouhyar, S.; Bahrami, M. Exploring customers’ purchasing behavior toward refurbished mobile phones: A cross-cultural opinion mining of Amazon reviews. Environ. Dev. Sustain. 2024, 26, 28131–28159. [Google Scholar]
Disclaimer/Publisher’s Note: The statements, opinions and data contained in all publications are solely those of the individual author(s) and contributor(s) and not of MDPI and/or the editor(s). MDPI and/or the editor(s) disclaim responsibility for any injury to people or property resulting from any ideas, methods, instructions or products referred to in the content. |
© 2025 by the authors. Licensee MDPI, Basel, Switzerland. This article is an open access article distributed under the terms and conditions of the Creative Commons Attribution (CC BY) license (https://creativecommons.org/licenses/by/4.0/).