Article

A Robust, Multi-Criteria Customer Satisfaction Analysis Framework for Airline Service Provider Evaluation

by
Athanasios P. Vavatsikos
*,
Anastasia S. Saridou
,
Antonios Mavridis
,
Despoina Ioakeimidou
and
Prodromos D. Chatzoglou
Production and Management Engineering Department, Democritus University of Thrace, 67 100 Xanthi, Greece
*
Author to whom correspondence should be addressed.
Information 2025, 16(4), 272; https://doi.org/10.3390/info16040272
Submission received: 19 February 2025 / Revised: 20 March 2025 / Accepted: 26 March 2025 / Published: 28 March 2025

Abstract

:
This research introduces a novel framework that allows the comparative evaluation of airlines based on passengers’ flight experiences. The proposed framework combines a typical and a simulation-based extension of the AHP in a group decision-making environment to elicit rankings of various airlines. The first option (T-AHP) generates rankings by combining individual passengers’ preferences using the geometric mean synthesis rule. The second option (S-AHP) simulates the stochastic characteristics of the responses, aiming to handle the inherent uncertainty and the variety of preferences obtained by the customers. The rankings are derived by mapping the decision space according to the evaluation criteria implemented and passengers’ preference dimensions. The proposed options are illustrated through a case study where four airlines are evaluated using 51 satisfaction dimensions (sub-criteria). Although the derived results indicate similar rankings, those obtained by the S-AHP option are more stable and robust, with greater discriminatory capacity compared to those of its typical counterpart (T-AHP).

1. Introduction

In the current turbulent times, airlines struggle to respond to the barriers of various global factors, such as the COVID-19 pandemic and the recent dramatic increase in fuel prices. Airlines have long realized that the provision of high-quality services is one of the few battles that is almost solely in their hands and can be used as their main weapon against the competition [1,2], since it significantly affects passengers’ attitudes, behaviors [3,4], satisfaction [4,5,6] and, in the long run, loyalty—a significant parameter of service effectiveness for the airline industry [3,7,8] and market share [9]. Therefore, it is crucial for their survival, as airlines need to be able not only to understand the factors that contribute to customers’ satisfaction but to also realign their strategies in order to increase their passenger numbers and long-term profitability [10]. Quality is a rather confusing term that is usually interpreted in various ways, based on the conceptual context in which it is addressed. Further, service quality refers to the difference (positive or negative) that exists between customers’ initial expectations and their perception of the actual service they received [11]. As far as the aviation industry is concerned, service quality refers to all the interactions (before, during and after the flight) between the airline and its customers, which will shape customers’ perceptions (overall experience) and enhance the image of the carrier [12].
Previous comparative studies have confirmed that passengers flying with a FSC (full-service carrier) are generally more satisfied (with the services they receive) than passengers traveling with a LCC (low-cost carrier) [13]. Although this is an expected finding, it is important to understand the factors that contribute to this result. In particular, Chen and Chang [14], investigating the differences in the factors affecting passengers’ choice between a Chinese FSC and LCC, found that the provided service was not an important factor for those passengers who chose LCCs, in contrast to those choosing FSCs. Further, Jiang and Zhang [15] also focused on the Chinese aviation sector (they analyzed four Chinese airlines), studying the links between service quality, customer satisfaction and confidence in the airlines. They concluded that, although service quality indeed affects customers’ satisfaction, this is not always accompanied by greater confidence. Actually, for LCCs, “service quality may not be a good indicator for predicting customer loyalty” [16]. Furthermore, in contrast to ticket pricing, FSCs fell short of expectations. Actually, there was a significant difference in the perception of value for money between passengers of FSCs and LCCs [17,18]. Thus, although low traveling cost offered by LCCs might be a crucial parameter affecting the selection of these carriers by a considerable number of customers [19], as it was expected, most LCCs’ passengers select their flight also on the basis that these airlines have a high safety reputation [19,20,21].
In addition, Rajaguru [11], using the means–end chain theory and the price sensitivity theory, compared the quality of services to the money that passengers of FSCs and LCCs had paid, and confirmed the sensitivity of LCC passengers to the value-for-money factor. This is also suggested by Shen and Yahya [22] who claim that FSC passengers are less price-sensitive. Further, Han et al. [23] found that although lounge facilities are affecting the selection of an airline, luxury lounges are considered necessary for passengers flying with an FSC, in contrast to the anticipation of LCC passengers. Similarly, although tangibles and in-flight service quality are important for FSC passengers [24], the expectations of LCC passengers for the same services are rather low [25]. This is actually the main reason why LCCs pay less attention to these factors [24]. However, it seems that given the post-flight service offered by FSCs, the frequent-flyer program—which provides to its members a number of benefits and discounts—makes up lost ground against LCCs [26] and increase passengers’ loyalty [27]. Finally, there are empirical studies which have found that significant differences do exist between FSCs and LCCs in all the pre-, in-, and post-flight services offered [28]. However, passengers’ intentions in traveling with either FSCs or LCCs are not directly affected by value for money and/or service quality, “but they are mediated through the chronological path of customer satisfaction and airline image” [18,22]. It should be stressed, though, that the impact of satisfaction on image and behavioral intention is higher in LCCs [18].
When it comes to multiple-criteria decision analysis (MCDA) methods, Tsaur et al. [29] introduced a hybrid Fuzzy AHP-TOPSIS to deal with imprecise evaluator knowledge, using 15 evaluation criteria in order to evaluate the performance of three airlines. In the same direction, Liou and Chuang [30] integrated a Fuzzy AHP-Fuzzy Rating option to evaluate the performance of eight airlines incorporating the responses of 446 passengers. The group extension of the typical AHP has been implemented by Singh [31] to obtain the ranking of three candidate airlines considering 23 evaluation criteria. The 171 responses to an AHP standard-type questionnaire were combined in terms of geometric mean to generate single pairwise comparison matrices. In the same line, Budimčević et al. [32] integrated the responses of 200 customers to evaluate three airlines. A hybrid Fuzzy AHP-TOPSIS model was also utilized by Bae et al. [33] to rank ten airlines according to their performance in financial and operational ratios. Finally, without specifying the passenger sample interviewed, nor the method for combining their preferences, Al Awadh [34] evaluated three airlines using twenty-two evaluation criteria.
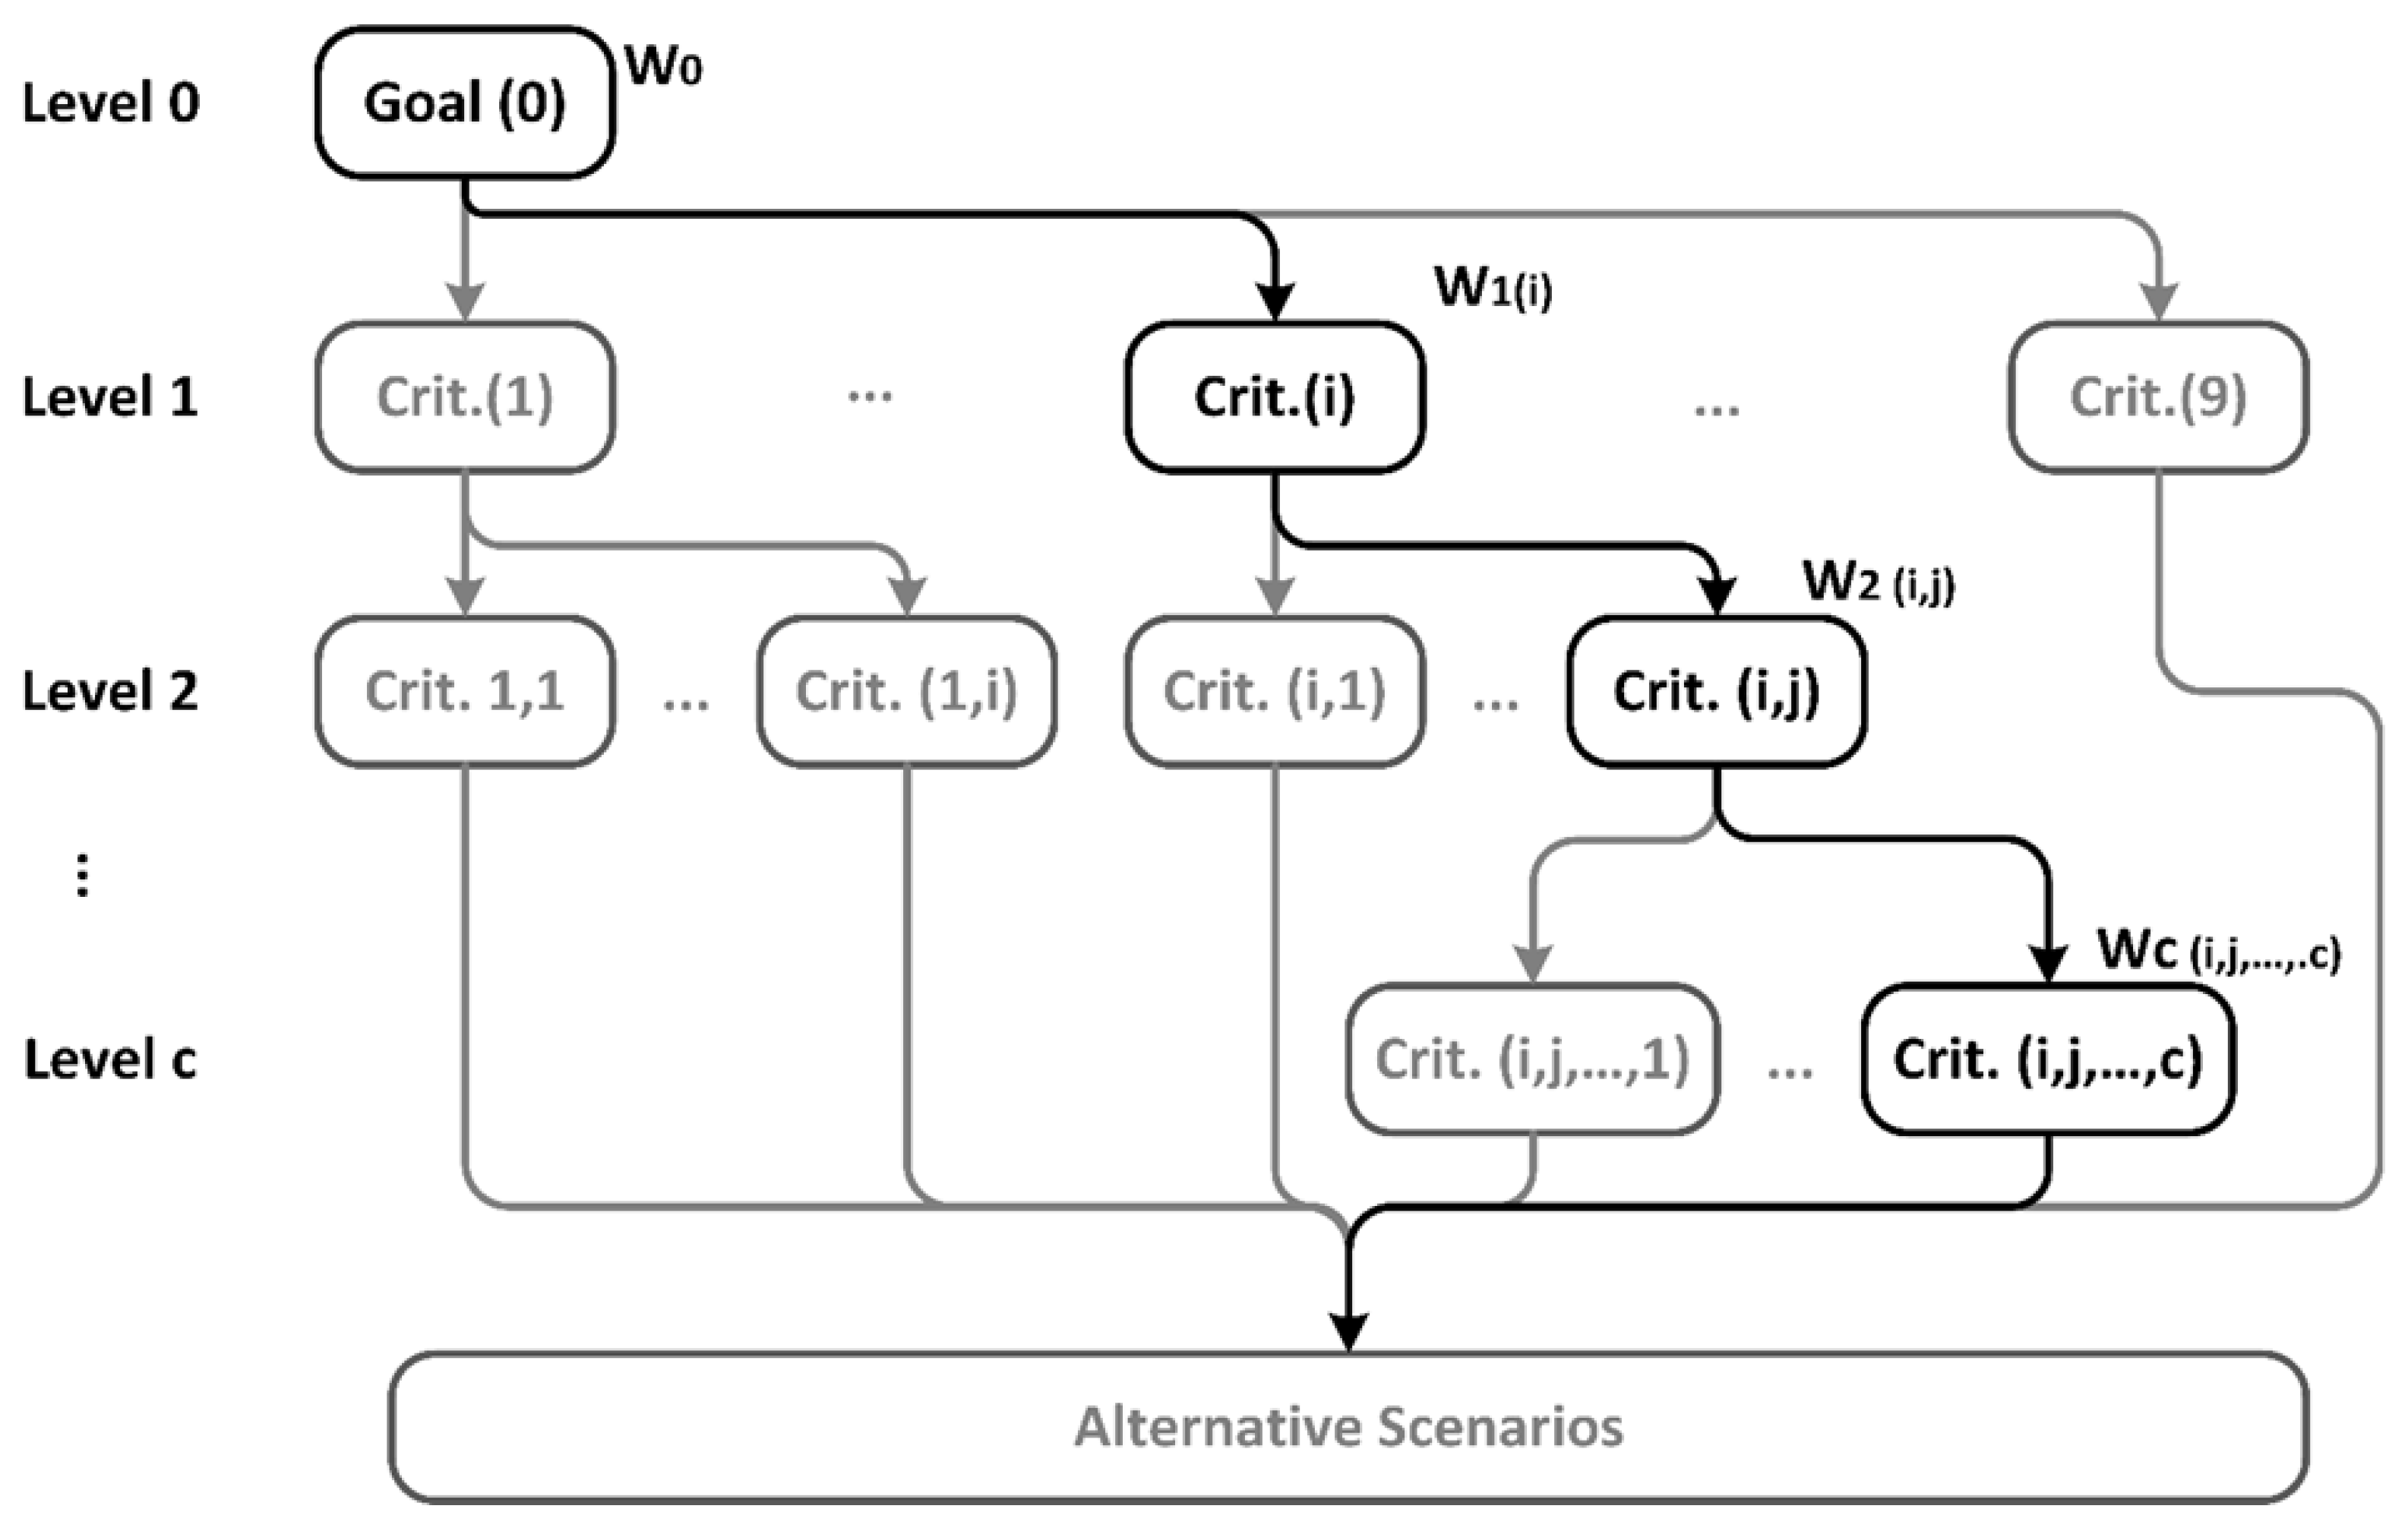
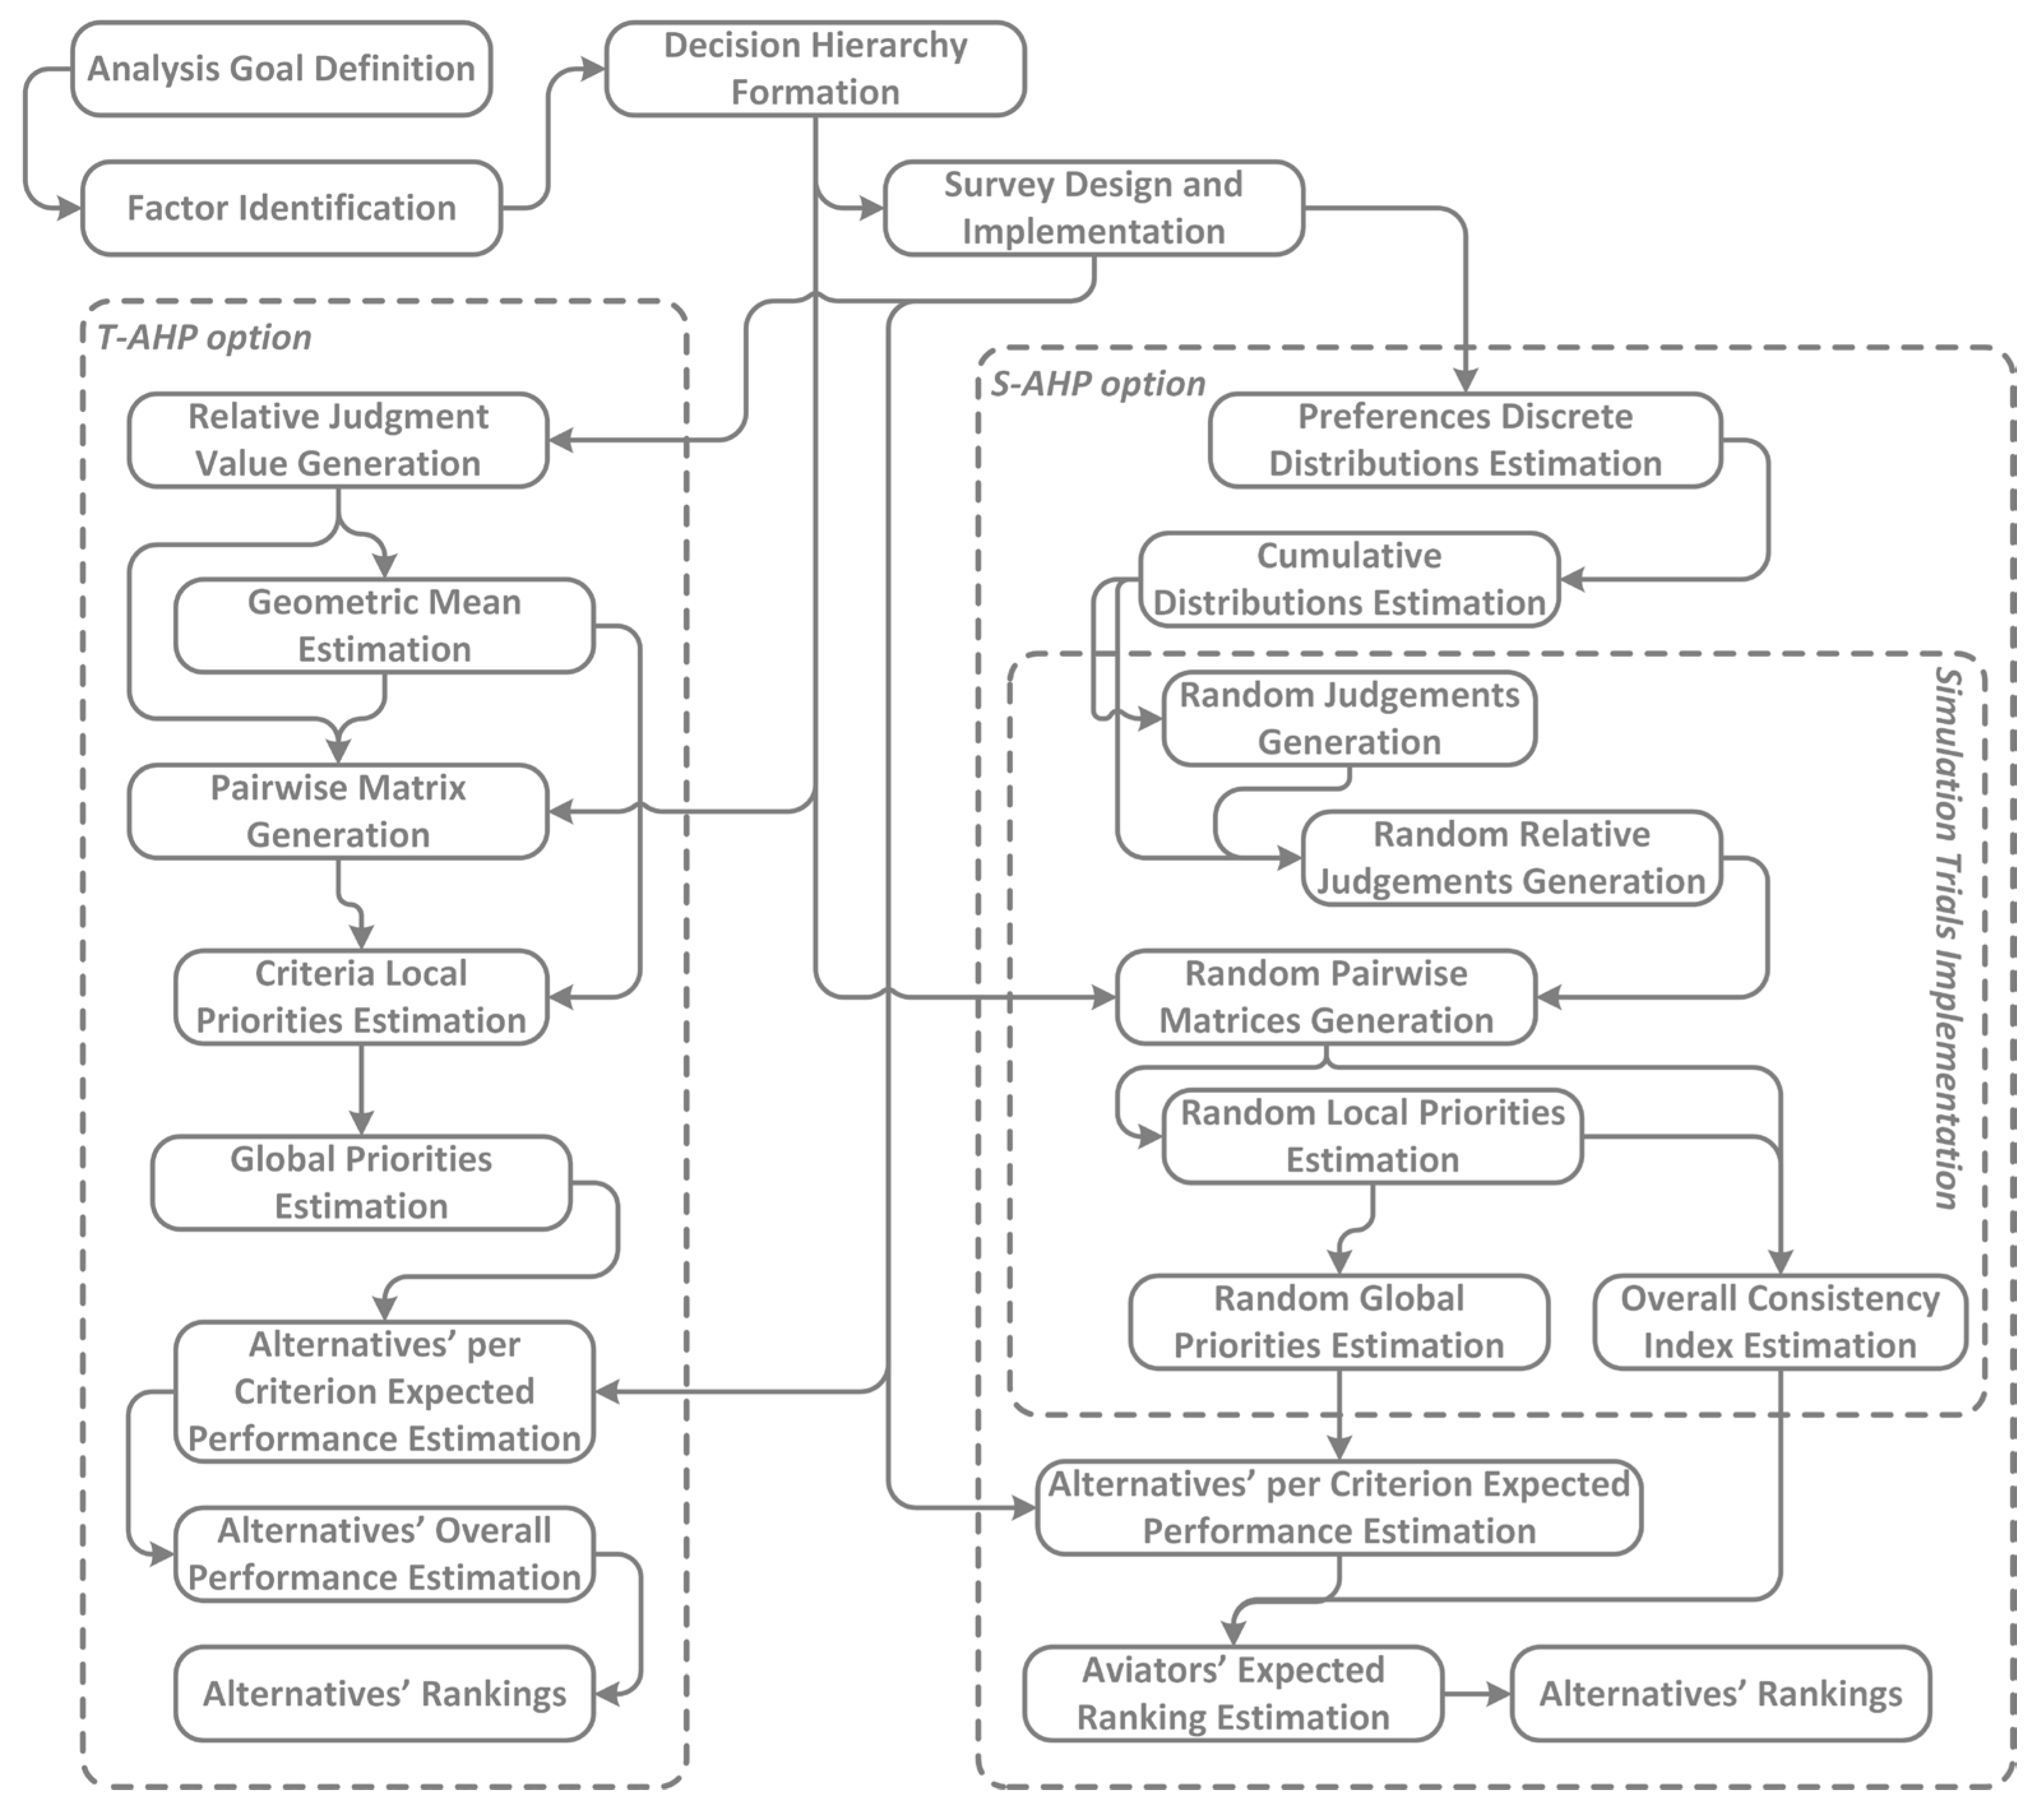
In this research, the problem of customer satisfaction in the airline industry is also treated as a Group Multi-Criteria Decision-Making (GMCDM) problem using the Analytic Hierarchy Process (AHP) method. AHP has been selected among other well-established MCDM methods due to its capacity to address a/problem formation, b/criterion weight elicitation and alternative standardization in a unified environment and c/its ability to sufficiently assist integration with simulation options. AHP is used to combine passengers’ opinions and perceptions of various evaluation criteria to produce satisfaction indices (SIs) that allow airlines to be ranked. The decision framework developed allows the transformation of standard questionnaire survey responses into relative judgments and examines two AHP options. For the first typical AHP (T-AHP), pairwise comparison matrices are obtained using the geometric mean of passenger responses and a single rank is obtained without further investigation of the stochastic decision environment. In the second option, local weights are established using Monte Carlo simulation (S-AHP), where multiple rounds of AHP estimation are performed according to the stochastic characteristics of the derived responses. In this way, S-AHP identifies possible decision outcomes and generates various indices that support coherent decision-making in stochastic environments by examining the stability and the robustness of the rankings obtained with respect to the simulation trials. Both T-AHP and S-AHP are implemented in a real case study, supported by a questionnaire survey conducted at the two main international airports in Greece, and passengers were asked to indicate their preferences at arrival. The analysis performed and the results discussed in detail identify the S-AHP option as more efficient in terms of the quality of rankings generated and its ability to provide decision-makers with significant insights into the performance of candidate airlines.

2. Materials and Methods

2.1. Analytic Hierarchy Process

The proposed methodological framework addresses the problem of airline provider evaluation as a multi-criteria decision-making framework based on passengers’ judgments according to their recent traveling experience. For that reason, the Analytic Hierarchy Process (AHP) [35] has been utilized due to its ability to estimate absolute preference measurements (priorities) using ratio judgment scales. In that manner, AHP is capable of allowing the evaluation of specific alternatives using both tangible and intangible attributes [36].
The hierarchical structure of the decision problem is of significant value as it allows consistent comparative evaluation of the decision elements since they belong to the same level of importance. Using decision hierarchies, AHP is capable of estimating local weights ( w i ) by comparing their elements in pairs (criteria, sub-criteria and alternatives). In detail, this is achieved by forming pairwise comparison matrices B i j = b i j n × n to evaluate the child elements of the hierarchy with respect to their importance in satisfying their parent element. Each position of the B i j facilitates the importance b i j of the row element i t h when compared with the element of the j t h column. Although evaluations are performed using linguistic variables, the AHP fundamental scale of preferences assigns a numeric value to each one of them using the odd values in the range 1–9, where 1 denotes equal importance and 9 extremely strong importance, respectively. Additionally, the intermediate values denote moderate ( b i j = 3 ), strong ( b i j = 5 ) and very strong ( b i j = 7 ) importance [37]. As a result, pairwise comparison matrices are positive and reciprocals to their diagonal since b i i = 1 and b j i = 1 / b i j . Then, local weights can be obtained by solving the system of Equation (2). According to AHP, a single solution exists when the criteria weight vector equals the principal eigenvector of pairwise comparisons matrix ( e g e n B i j ). Various options exist to estimate the eigen vector of B i j . Among them, the option of the row average normalized by the sum of the columns (Equation (2)) is the most popular principally due to its simplicity [38].
Local weights provide the importance of the decision elements with respect to their parent node satisfaction. To obtain the importance for the goal of the analysis, local weights of the child nodes are weighted with the local weights of their parent nodes for each one of the hierarchy’s branches using Equation (3). Since the hierarchies developed do not have the same number of levels for every criterion examined, W c C denotes the elements sited in the last position of each one of the hierarchy’s branches (Figure 1) and form the evaluation criteria set C of the analysis. Their number c , along with the alternatives number m , defines the dimension of the multi-criteria decision matrix.
b i j n × n × w i n × 1 = λ m a x × w i n × 1
w i = e g e n B i j = j = 1 n b i j / i = 1 n b i j n
W c C = w i × w i , j × × w i , j , , c
When the transition property holds, Equation (4) is validated for every one of the elements of the pairwise comparison matrix B i j . In such cases, A i j is perfectly consistent and the eigenvalue λ m a x equals the dimension n of the B i j . Thus, their normalized difference (Equation (5)) provides a measurement that indicates the existence of inconsistent judgments, named consistency index (CI). Consistency ratio (CR) provides a normalized expression of CI (Equation (6)) taking into consideration A i j dimension by dividing CI with the random inconsistency ratio (RI) provided in relation to n . An overall average C R ¯ for the decision problem can be estimated by dividing the weighted average C I ¯ by the corresponding weighted average R I ¯ (Equation (7)) [39]. Although AHP adopts different acceptable CR levels, based on the B i j size, the generic rule of C R , C R ¯ < 10 % is widely implemented [40].
b i j = b i r × b r j
C I = λ m a x n n 1
C R = C I R I
C R ¯ = C I ¯ R I ¯ = c = 1 C w c 1 × C I c c = 1 C w c 1 × R I c
S a = c C W c × x a c s
x a c s = x a c a = 1 m x a c
x a c s = 1 / x a c a = 1 m 1 / x a c
S a = c C W c × r t a c
In AHP, the per-criterion performances are combined using the weighted linear combination as a decision rule. For an alternative a A that belongs to the set of feasible alternatives A , the weighted sum of their standardized performances is obtained allowing address selection, sorting and ranking decision-making problematics [41]. For quantitative criteria, conventionally AHP is implemented using pairwise comparisons matrices, where alternatives are evaluated according to their importance for each one of the evaluation criterion c . Additionally, for quantitative criteria, AHP uses the percentage score by dividing the individual performances by their sum [42]. In detail, for m evaluation alternatives, Equations (9) and (10) provide the standardized performance for ascending and descending criterion types, respectively [43]. In that manner, the standardized performance occurs as a relative measurement since it is estimated in relation to the performances of every considered alternative. However, this approach should be considered for closed decision-making environments where the set of alternatives is considered fixed and no other alternatives are expected to be considered in the future. On the other hand, the ratings normalization option is adopted in open systems where the set of examined alternatives is subject to change [44]. Using ratings, a scale of preference intensity levels ( t ) is introduced and every alternative is allocated a level of intensity according to DMs’ preferences. Consequently, the predefined value r t is assigned to the alternative. To ensure commensurability, a single scale should be adopted for all the analysis evaluation criteria. In accordance with Equation (8), the overall performance of an alternative a is obtained using Equation (11), where r a t c denotes the rating value r t assigned to a because it is rated at the t t h intensity level when evaluated for the c t h criterion.

2.2. Proposed Framework

Commonly, customer satisfaction evaluation studies are implemented by conducting questionnaire surveys. Such surveys aim to collect information from users of a product or a service based to their responses to various aspects that are considered significant. In doing so, customers convey their satisfaction using an ascending scale of linguistic variables. In that manner, a business gains significant insights to assist decision-making. The current research proposes a framework that aims to evaluate the performance of airline service providers in terms of multi-criteria evaluation. The implemented analysis criteria correspond to the aspects evaluated by the passengers, while the passengers correspond to the decision-makers of the analysis. Thus, the framework is designed to assist GMCDM processes where a single score should be obtained for every examined provider based on the opinions of their customers. Moreover, the framework is developed to transform the responses gathered from questionnaires into comparative judgments in order to estimate local and global criteria weights using AHP. On the other hand, aviation provider evaluation is obtained using a rating option where passengers evaluate the performance of the provider they have just used against the analysis criteria, which avoids the collection of responses for services they have not experienced by the time they have been questioned. As a result, airline firms are evaluated based on the recent travel experience of their customers.
The proposed framework facilitates two options, and their implementation step sequence is illustrated in Figure 2. The first option consists of the typical AHP (T-AHP) implementation for GMCDM, while the second (S-AHP), using Monte Carlo Simulation, is a robust extension. Steps not included in the dashed frames are common to both options. The process is initialized with the definition of the analysis goal and the identification of the factors that contribute the most to the analysis goal satisfaction. Then, a decision hierarchy is developed to form a decision structure of objectives (criteria) and subobjectives (sub-criteria) that represent the decision analysis dimensions of the satisfaction aspects. At the last step, a questionnaire is developed to assist the evaluation based on passengers’ perceptions. Given that the evaluation process aims to estimate criteria importance (weights) and candidate alternative performance relative to the evaluation criteria, two Likert scales were developed (Table 1). The criteria evaluation intensity scale v t is used to assess the analysis criteria in terms of importance to their parent node, while the under-evaluated airline providers are rated using the satisfaction intensity scale r t .
Using the T-AHP, relative judgments for every pair i , j of the analysis criteria are estimated as the ratio of the derived response values for every k questioned customer (Equation (12)). Thus, pairwise comparison matrices are reciprocals (Equation (13)) of the principal diagonal whose elements equals to 1 (Equation (14)), while b i j k 1 / 9 9 holds the properties of the original AHP. Then, pairwise comparison tables B i j are established with the estimation of the group-based judgments b i j g , using the geometric mean of the k decision-makers’ opinions that are involved in the process (Equation (15)). Since every evaluation is expressed in quantitative terms, pairwise comparison matrices present zero inconsistency, and local weights are estimated in terms of their percentage performance using the elements of the first column (Equation (16)) [45]. Global weights of the evaluation criteria with respect to the analysis goal are then estimated using Equation (3).
b i j k = v i t k / v j t k
b j i k = v j t k / v i t k = 1 / b i j k
b i i k = v i t k / v i t k = 1
b i j g = k = 1 K b i j k K = k = 1 K v t i k / v t j k K = 1 / k = 1 K v t j k / v t i k K = 1 / b j i g
w i = b i 1 g i = 1 n b i 1 g
On the other hand, passengers express their satisfaction to the evaluation criteria using satisfaction intensity scale r t . Thus, for the k t h passenger the aviator m receives a score r t i k m , which corresponds to the value r t of the satisfaction level received t for the i t h evaluation criterion. Consequently, for every aviator and for each one of the evaluation criteria, a discrete probability density function can be obtained (Equation (17)), where p t i m is the probability that an aviator m receives the satisfaction value r t to the i t h criterion. Under the concept of probabilistic additive weighting [46], the expected per-criterion satisfaction S m i and the overall satisfaction S m of the examined aviators can be estimated using Equations (18) and (19), respectively.
p t i m = p r t i m = p t i m X = r t i m = N r t i k m N k
S m i = t p t i m × r t i m
S m = i W i × S m i = i t W i × p t i m × r t i m
The second option (S-AHP) is a robust decision-making framework which takes advantage of the feedback provided by the passengers and aims to evaluate the stability of the examined airlines’ performances based on the stochastic characteristics of the derived responses. Criterion weights are obtained by performing Monte Carlo simulation, where relative judgments in each trial are randomly generated using the density distribution functions as estimated by the responses to the questionnaires selected. From the responses collected, the density distribution function of the importance intensity scale values v t i can be derived as the ratio of the passengers k that selected the intensity level t (to denote the importance v t i of the i t h criterion) divided by the total number of responders (Equation (20)). Equivalently, the cumulative distribution function P t i is obtained using Equation (21) and provides the basis for generating sample value scale numbers. The latter is achieved using the inverse cumulative distribution function to match randomly generated P t i values in the field 0 , 1 with their corresponding values of the criterion importance scale v t i r a n d (Equation (22)).
p t i = p v t i = p t i X = v t i = N v t i k N k
P t i = P v t i = t p t i = P t i X v t i
v t i r a n d = 1 , P t i r a n d t = 1 1 p t i v t , t = 1 t 1 p t i < P t i r a n d t = 1 t p t i 9 , t = 1 4 p t i < P t i r a n d 1
For every trial, random pairwise comparison matrices B i j r a n d = b i j r a n d n × n are formed and, like the T-AHP option, random relative importance is estimated using Equation (23). Then, the local weights for every pair of criteria in the same cluster are derived using Equation (24), while the global weights can be obtained using Equation (3). Since b i j r a n d are randomly generated, the overall weighted average consistency ratio C R ¯ is estimated and trials that present consistency ratios greater than 10% are rejected. For the rest of the trials, the score of an examined alternative is estimated adopting the concept of the previous options using Equations (18) and (19), with the difference that the global weights equal the weight generated in each one of the simulation trials. As soon as a sufficient number of trials are implemented, the expected satisfaction index S I m e x p of the m t h alternative is estimated as the average score of the performances obtained in every trial r (Equation (25)).
b i j r a n d = v t i r a n d / v t j r a n d
w i r a n d = j = 1 n b i j r a n d i = 1 n b i j r a n d n
S I m e x p = r i t W r i × p t i m × r t i m R

3. Case Study

3.1. Flight Service Satisfaction Dimensions

Olya and Al-ansi [47] emphatically stress that travelers take into consideration a rather large number of factors (mainly concerning pre- and post-flight services) [48] before they take their final decisions, thus highlighting the complexity of their behavior and actions. This view is in line with complexity theory which is found to be useful in describing the behavioral responses of travelers [49,50]. Further, the utility theory suggests that passengers buy airline services having a given level of expectations which are formed on a number of implicit service promises, such as “fair” price, tangibles and intangibles [51].
The model that has been most widely used for measuring service quality in the industry is “SERVQUAL” [52]. It includes twenty-two sub-criteria divided into five main criteria (tangibles, reliability, responsiveness, assurance and empathy) [53]. Based on this model, quality is based on subjective evaluation, since a service is perceived by the customer as an experience rather than as a physical component. However, SERVQUAL is not an airline sector-specific model. Thus, Ali et al. [54] assessed a modified version called AIRQUAL in Pakistan and found that passengers’ satisfaction can be explained by all five main service quality dimensions of the model. At the same time, Hussain et al. [55] used an altered model to assess an airline operating from Dubai, as Rahim [56] did for the Nigerian airline sector and Jiang et al. [57] also did for China’s domestic airline sector. AIRQUAL was also used by Shen and Yahya [22] in Southeast Asia. Further, Al Ghamdi [58] used another modified version, the nine-dimensional ASQUAL, to assess the service quality of Saudi Arabian Airlines. Finally, Gupta [2] attempted to rank the criteria of service quality using the best–worst method and, then, to classify airlines based on these criteria while applying the VIKOR (Vlse Kriterijuska Optimizacija I Komoromisno Resenje) methodology. It emerged that “tangibles” is the main dimension/feature of an airline and that service quality has a significant impact on the number of passengers attracted by a carrier.
In an attempt to assess the features that affect airlines’ attractiveness, Medina-Muñoz et al. [26] found that passengers place safety, punctuality and cost high in their list of priorities, as well as services provided during the flight. Similar are the results of the study of Kurtulmusoglu et al. [59], who found that prices, punctuality and booking convenience are among the most significant factors for choosing an airline. However, Namukasa [1] found that not only the services offered during the flight but also those offered before and after the flight, significantly affect passenger satisfaction and loyalty. It is not surprising that ticket prices and extra charges (e.g., in the case of changing seat or flight date, charges for luggage size or weight) are considered as two of the main reasons for selecting an airline [60]. Passenger behavior and loyalty, as well as the image of an airline, are all directly affected by the value-for-money perception of passengers [11,12,15].
Turning, first, our attention to the pre-flight services, Medina-Muñoz et al. [26] suggest that passengers’ rating of an airline is affected by the routes and the airports that the airline flies from/to. This is also confirmed by other studies [61], where two more factors, frequency and availability of flights, are found to play a significant role in the assessment of an airline by passengers. Further, many studies have highlighted the importance of the natural environment of an airport [62,63], its general attractiveness [64], the clear queuing instructions [65], accurate terminal information [66], lounge facilities [23] and, of course, the speed and comfort of the check-in process [62]. Finally, the use of information technologies can make passengers’ pre-flight experience more convenient and save them time and money [67].
As far as the in-flight service quality is concerned, it is found that it has a direct and significant effect on passenger satisfaction [68], especially the “tangibles” (comfort, cleanliness, and quality of food and beverages) [28,69]. However, the most important are still reliability and, mainly, safety [26,28,70], which obviously is the most fundamental and the one that provides airlines with a significant competitive advantage. Further, staff behavior (courtesy and responsiveness), appearance and professionalism also affect passenger satisfaction [69,71]. Moreover, focusing on the post-flight service quality, it has been confirmed by many studies that disembarkation, the speed of luggage collection [72], handling of personal belongings (lost or damaged luggage, etc.) [73], and the handling of passenger complains, refunds [74] and benefits [75] also affect passengers’ overall flight experience and carriers’ brand name/image, which, in turn, affects airline selection [19,76]. Finally, travel choices are also affected by the previous experiences that passengers have had [77,78], their personal characteristics (socio-demographics, etc.) [79,80], as well as whether they are members of a frequent-flyer program [70] (members usually perceive the airline of their choice as safer).

3.2. Evaluation Model

The proposed framework was implemented in a real-world case study to assist customer satisfaction analysis for aviators (service providers). The decision models take into consideration 51 evaluation criteria organized in a four-level hierarchical structure (Figure 3). The decision hierarchy is formed using five principal criteria. The first and the fifth criterion directly consists of the parent nodes of the evaluation criteria selected for the evaluation of the alternatives examined. On the contrary, the second, third and fourth criterion are further subdivided into three sub-criteria in order to subdivide decision elements into dimensions that can be efficiently handled by the AHP. It is noted that AHP suggests that pairwise comparison matrices should not exceed the ninth dimension [81]. The adopted formation demands the development of fifteen pairwise comparison matrices in total to obtain the local weights of the decision elements.
The fifty-one evaluation criteria for measuring both the first- and second-level features of the study have been adopted from various sources. More specifically, for pricing policy we have adapted the dimensions used by Rajaguru [11] and Tsafarakis et al. [82], for pre-flight service quality those used by Tsafarakis et al. [82] and Chou et al. [74], for in-flight service quality those used by Gupta [2], Rajaguru [11], Perçin [69], Namukasa [1] and Nejati et al. [83], for post-flight service quality those used by Gupta [2], Tsafarakis et al. [82], Namukasa [1] and Chou et al. [74], and for past experience those used by Babbar and Koufteros [84]. The questionnaires used by some of the airlines were also taken into consideration. For the collection of the necessary primary data, a structured questionnaire was developed. It included sixty-five close-ended questions for measuring the importance ( v t ) of the criteria, sub-criteria and evaluation criteria incorporated into this study, and fourteen more questions for recording the demographic characteristics of the participants. Finally, satisfaction related to the evaluation criteria was measured including fifty-one questions using the satisfaction intensity scale r t .
The data collection took place at the two largest Greek international airports (Athens and Thessaloniki). The sampling approach adopted was the judgment sampling approach [85]. The sample size consisted of 675 passengers, mainly women (53.8%) and well educated (64% hold a bachelor’s degree). They have permanent residency in Greece (60.9%), Germany (14.7%), the U.K. (6.2%) and the USA (3.6%). Further, their last flight was with Aegean Airlines (44.4%), Ryanair (19.6%) and Lufthansa (12.9%), while they fly on average once every three months (37.3%) or every six months (29.8%), mainly for pleasure/holidays (63.1%). Finally, they stated that the main reason for selecting the airline of their last trip was the ticket price (26.2%), availability (12.4%), quality (9.3%) and safety (7.1%), or a combination of these (security and quality 10.2%). Those who are members of a frequent-flyer program corresponded to only 28.4% of the total.
The five principal criteria are (a) pricing policy (C1), (b) pre-flight service quality criterion (C2), (c) in-flight service quality (C3), (d) post-flight service (C4) and (e) past experience (C5). Considering their opinions (Table 2), the vast majority of the passengers agree on the importance of these factors (87.95%, 74.67%, 85.78%, 81.00% and 85.20%, respectively).

3.3. Analysis Criteria

Pricing policy criterion (C1) is formed using four evaluation variables (items). Probabilities for the importance scale levels of the answers provided by the passengers interviewed are illustrated in Table A1. An interesting finding concerning this set of variables is that passengers are almost equally divided into three parts, since low to very low importance recorded a probability of 37.3% (item C1.3).
Further, pre-flight service quality is defined by measuring an aviator’s performance against various criteria that are grouped in three second-level criteria. Satisfaction is ascertained regarding the services and information obtained from the aviators’ websites (C2.1) (measured using four items), the flight schedule and routes (destinations) (C2.2) (measured using four items), and the pre-flight experience (C2.3) (measured using seven items). In general, both second-level criteria and evaluation criteria are considered of high importance by the majority of the passengers. The only exception was the efficiency of the boarding process (C2.3.4), indicating that this criterion does not contribute significantly to airline evaluation.
In total, seventeen evaluation criteria were taken into account for the evaluation of the airline performance based on the satisfaction derived from their in-flight experience. Evaluation criteria are grouped into three categories forming the “Airplane” (C3.1) (8 items), “Crew” (C3.2) (5 items) and “Security” (C3.3) (4 items). In general, the implemented criteria are considered of high importance by the passengers. However, criteria C3.1.4 and C3.2.4 do not achieve significant importance since either the majority of the passengers did not use the aforementioned services, or they had no experiences which warranted mentioning the behavior of the crew members.
As far as the post-flight quality of the provided services is concerned, it was measured using nine evaluation variables (items) organized into three sub-criteria. In detail, passengers were asked to evaluate the frequent-flyer program (C4.1) (3 items), disembarkation (C4.2) (3 items), and complaint handling (C4.3) (3 items). In general, the total of the implemented criteria is considered of moderate to high importance. Finally, aiming to bring into the analysis how passengers value previous experiences of using the same airline, six evaluation criteria were considered. Their goal was to counterbalance dissatisfaction exclusively owed to passengers’ last traveling experience with the specific airline company.

3.4. Alternatives Profiles

The research examines the performance of four alternative airline services providers (Alt1, Alt2, Alt3 and Alt4) through the use of 568 (84.15%) questionnaires (out of the total 675 questionnaires initially collected). These airlines are those with a higher market share (flying from/to Greece). More specifically, two are local and two are foreign airlines, while three of them are FSCs and one an LCC. For each one of the analysis criteria, the expected satisfaction S m i performance was calculated in order to investigate whether an obvious solution exists and, if so, there was no need for further analysis. The results presented in Figure 4 show that there is no such ranking for all the analysis criteria. However, with the naked eye, it can be seen that Alt2 outperforms in the third and fifth evaluation criteria and records moderate performances with respect to the second and fourth criteria. The third alternative is competitive to options Alt1 and Alt4 in criteria 2, 3, 4 and 5, and falls short in the first criterion.

4. Results and Discussion

Initially, exploratory factor analysis was performed (using principal component analysis) with standard varimax rotation, using, as a selection criterion, an eigenvalue score greater than one. To validate the one-dimensional structure of the scales, Kaiser–Meyer–Olkin (KMO) was used to test the sampling adequacy, while convergent validity was tested using the item loadings and, finally, internal consistency of the factors was measured using Cronbach’s α. The scores for all tests and all factors and subfactors were within acceptable range, indicating that the factors and subfactors are valid and reliable (Table 3).
The descriptive statistical analysis shows (Table 3) that the quality of the services provided in-flight is that which passengers were more satisfied with (4.07). In contrast, the factor they were the least happy with was the pricing policy of the airline (3.46). As far as the subfactors are concerned, they were very satisfied with the level of security (4.39), the crew (4.26) and the website (4.27).
Finally, ANOVA analysis indicated that there is a significant difference in the arithmetic mean score of the factors and subfactors based on the reason (price, safety, quality and availability) each airline was chosen, as well as their membership (or lack thereof) in a frequent-flyer program. The country of permanent residency (Greece or elsewhere), the age group and the frequency of travel are also some characteristics that differentiate the mean score of some (relatively few) factors and subfactors.
A deterministic AHP option using the geometric mean operator (T-AHP) indicates that the overall global weights of the primary (first-level) criteria almost equally contribute to the analysis goal (Table 4). The simulation trials were executed by generating 5000 trials, where the differences in the obtained expected performance results remained constant up to the fifth decimal place. Estimations of the average overall inconsistency ( C R ¯ ) in every simulation trial indicated that the maximum acceptable threshold of 10% was violated in 1.963 (39.26%) of the total trials implemented. The expected C R ¯ e x p (average of the per-trial C R ¯ ) in the total and in the accepted trials has been found (9.83% and 7.51%, respectively). However, on the first occasion, C R ¯ falls into the range 3.16 % ,   49.6 % , while for the accepted trials C R ¯ ranges between 3.16 % ,   10 % . Although the analysis should be performed on the accepted trials, results for both S-AHP variants will be generated to investigate the quality of the derived rankings with respect to both the number of rounds generated and the impact of inconsistent judgments.
Table 4 also reveals that the expected criteria weights, estimated by averaging the weights generated in the trials of both S-AHP variants, are almost equivalent to those derived by using the geometric mean option (T-AHP). In detail, the root mean square of the deviations among the T-AHP and S-AHP variants are 1.091% and 0.985%, respectively, while the simulation variants produce more closely related results with a 0.143% root mean square deviation. However, the minimum and maximum derived criteria weight values indicate that the decision space has a significant range in each dimension (criterion).
According to the T-AHP option, Alt3 is ranked first, recording an SI of 3.717, followed by Alt4 with an SI of 3.675. Alternatives 1 and 2 are in third and fourth place, registering a performance of 3.602 and 3.181, respectively (Table 5). On the other hand, estimation of the expected SIs for each alternative, generated as the average of the values estimated at the simulation trials (Equation (25)), yielded the same ranking order for the simulation variants no matter if the consistency check was omitted or not. In detail, both variants indicate that Alt1 is ranked first, followed by Alt3, while Alt4 and Alt2 are ranked in third and fourth place. Summarizing, the difference in the observed ranking orders is because Alt1 manages to climb to the first-rank position in S-AHP variants although the specific airline was ranked third using T-AHP.
Table 5 indicates that the T-AHP-estimated SIs fall between the minimum and maximum estimated values of the simulation trials generated. Thus, there is evidence that T-AHP ranking may also occur in the simulation trials. Moreover, the estimated SI magnitude for Alt1, Alt3 and Alt4 remains too close for both T-AHP and S-AHP especially, leaving space to develop an argument regarding the existence of practically equivalent alternatives. In contrast to the geometric mean option (T-AHP), where a single SI is obtained, S-AHP variants are capable of investigating the stability of the results to various changes regarding both criteria and alternative performances. A simulation of passengers’ responses enables an investigation with respect to both the stability of the derived solution and the quality of the ranking orders obtained.
An approach to quantify the stability related to the performance of the examined alternatives in simulation trials is to estimate the distribution of the expected score that will be generated. Such an analysis, focused on the 3037 consistent trials, is highlighted in Table 6. The results presented in percentages and the counted trials indicate the following: (a) Alt2 is not a competitive alternative as its maximum performance is lower than the other alternatives’ minimum. Its most counted performances fall into the range 3.1 , 3.2 ; (b) Alt4 is ranked third since its most counted performances fall into the range 3.6 , 3.7 ; Alt4 records a significant number of trials that fall into the range 3.7 , 3.8 . Τhis number is lower than that of Alt3, which is ranked second although it records the highest observed performance (3.878); (c) Alt1 is ranked first since it dominates the satisfaction level in the range 3.7 , 3.8 . At the same time, its performances remain, with only one exception, constantly above 3.6 and it records the highest minimum and expected observed S I performances.
To address the previous issues, the S-AHP option also allows further investigation of the extent to which high satisfaction performance ensures higher rankings by examining the rankings derived in each trial. In particular, the unique rankings derived from the 5000 trials of the simulation can be obtained in order to investigate the stability of the result derived and to estimate the robustness of the ranking obtained by both T-AHP and S-AHP. Table 7 summarizes the results of such an analysis and indicates that the 3037 consistent trials generate only six possible rankings. As expected, the most counted ranking order is the one already indicated by the S-AHP option, which occurs as a result of 1785 trials, corresponding to a percentage of 58.78%. The second most common ranking is the one where Alt3 prevails over Alt1 with a significantly lower appearance probability (30.16%). It is noticed that the ranking order of the T-AHP is assigned to only 0.26% of the simulation trials, highlighting that the T-AHP in the current analysis does not generate a robust solution to the evaluation problem.
The ranking appearance probability analysis also indicates that Alt1 is ranked first at R1 and R3 unique rankings. Thus, Alt1 is ranked first among a total of 2076 trials, which results in an overall 68.36% probability of a first-ranking appearance. Additionally, Alt1 records a 31.31% and a 0.33% probability of a second- and third-ranking appearance. The analysis also validates that Alt2 is constantly ranked in the last position. Alt4 is commonly ranked third (88.94%), while in the first position there has been found only 37 trials with a probability of 1.22%. Alt3 is ranked second for 58.84% of the trials and records the second highest number of trials for which it is ranked first (924). An overall index adopted to provide a synopsis of the simulation rankings order analysis can be reached as the satisfaction expected rank ( S E R ) using Equation (26). The lower the index, the higher the level of customer satisfaction. Table 8 summarizes the results of the airline ranking appearance in the simulation trials.
S E R i = r p r × R r
The proposed framework has the capacity to support sectorial analysis by partitioning the sample dataset in terms of gender, age, income, etc. Such an analysis can provide significant insights with respect to various aspects of satisfaction that may occur based on passenger profiles. To estimate different attitudes and differentiations in SIs among the genders, the dataset has been queried accordingly and both T-AHP and S-AHP were used to estimate the SIs and the ability of the examined alternatives to be ranked in a certain position. With respect to the simulation option, 5000 trials were implemented and SIs were obtained for both the total number of trials as well as for those that fall into the accepted level of inconsistency. The comparative analysis between the clusters studied, in relation to the overall estimates previously discussed, was applied to the accepted trials to ensure consistency. However, it is noted that the results derived from the total trials present strong similarities. From the total of 5000 trials, the corresponding number of accepted trials were 3925 for males and 2457 for females.
The analysis results (Table 9) indicate that similar SI estimations were generated for the geometric mean and the simulation options, which results in the same alternative ranking for every group of responders. However, these rankings are different for each group of respondents, and they also differ from those of the overall analysis. For the male passengers, the 3014 (76.79%) consistent trials indicate a single ranking according to which Alt4 and Alt2 are ranked third and fourth, while Alt1 and Alt3 are additionally ranked second and first. Nevertheless, for the remaining 23.21% (911 trials) Alt1 has better performance compared to Alt3, and they switch positions. Consequently, the S E R index stands in favor of Alt3 recording a performance of 1.232. The analysis of the female passengers returns almost (99.02%) a single ranking with Alt3 and Alt2 in third and fourth places with certainty. Alt4 is now in first place and Alt1 remains in second place. As observed, male passengers are most satisfied with Alt3 airline, while female passengers are most satisfied with Alt4. Irrespective of gender, both genders agree that Alt1 is the second-best option and Alt2 is in fourth place. The analysis at this stage verifies the overall analysis results, where Alt1 is ranked first, because the same alternative is consistently ranked second, while Alt3 and Alt4 switch places among the first- and third-ranking order. Finally, Alt3 outranks Alt4 in second place in the overall rankings since Alt3 is ranked first with respect to the male cluster, which provides more consistent judgments and, thus, it is overrepresented in the overall trial analysis.

5. Summary and Conclusions

This research proposes a novel decision framework for evaluating airline service provision based on passenger satisfaction. The proposed framework approaches customer satisfaction analysis as a multi-criteria decision analysis problem and uses AHP to estimate SIs. To support the implementation of the AHP, a modification was developed to allow the extraction of relative judgments from a single questionnaire survey, which is the most common way of collecting customer perceptions regarding the quality of the services they receive. The responses were then coded using a five-point Likert scale based on the AHPs’ fundamental scale of preferences, with the aim of maintaining the original properties of the methodology.
As a GMCDM approach, two options are integrated into the analysis. In the typical T-AHP option, global pairwise comparison judgments are estimated using the geometric mean of the individual judgments received, while in the second, the stochastic characteristics of the responses collected are used to build a Monte Carlo simulation-based AHP (S-AHP) version. To minimize the effect of the rank reversal phenomenon, the analysis is conducted as an open system using the ratings option based on which of the alternatives’ expected performance relative to the analysis criteria has been estimated.
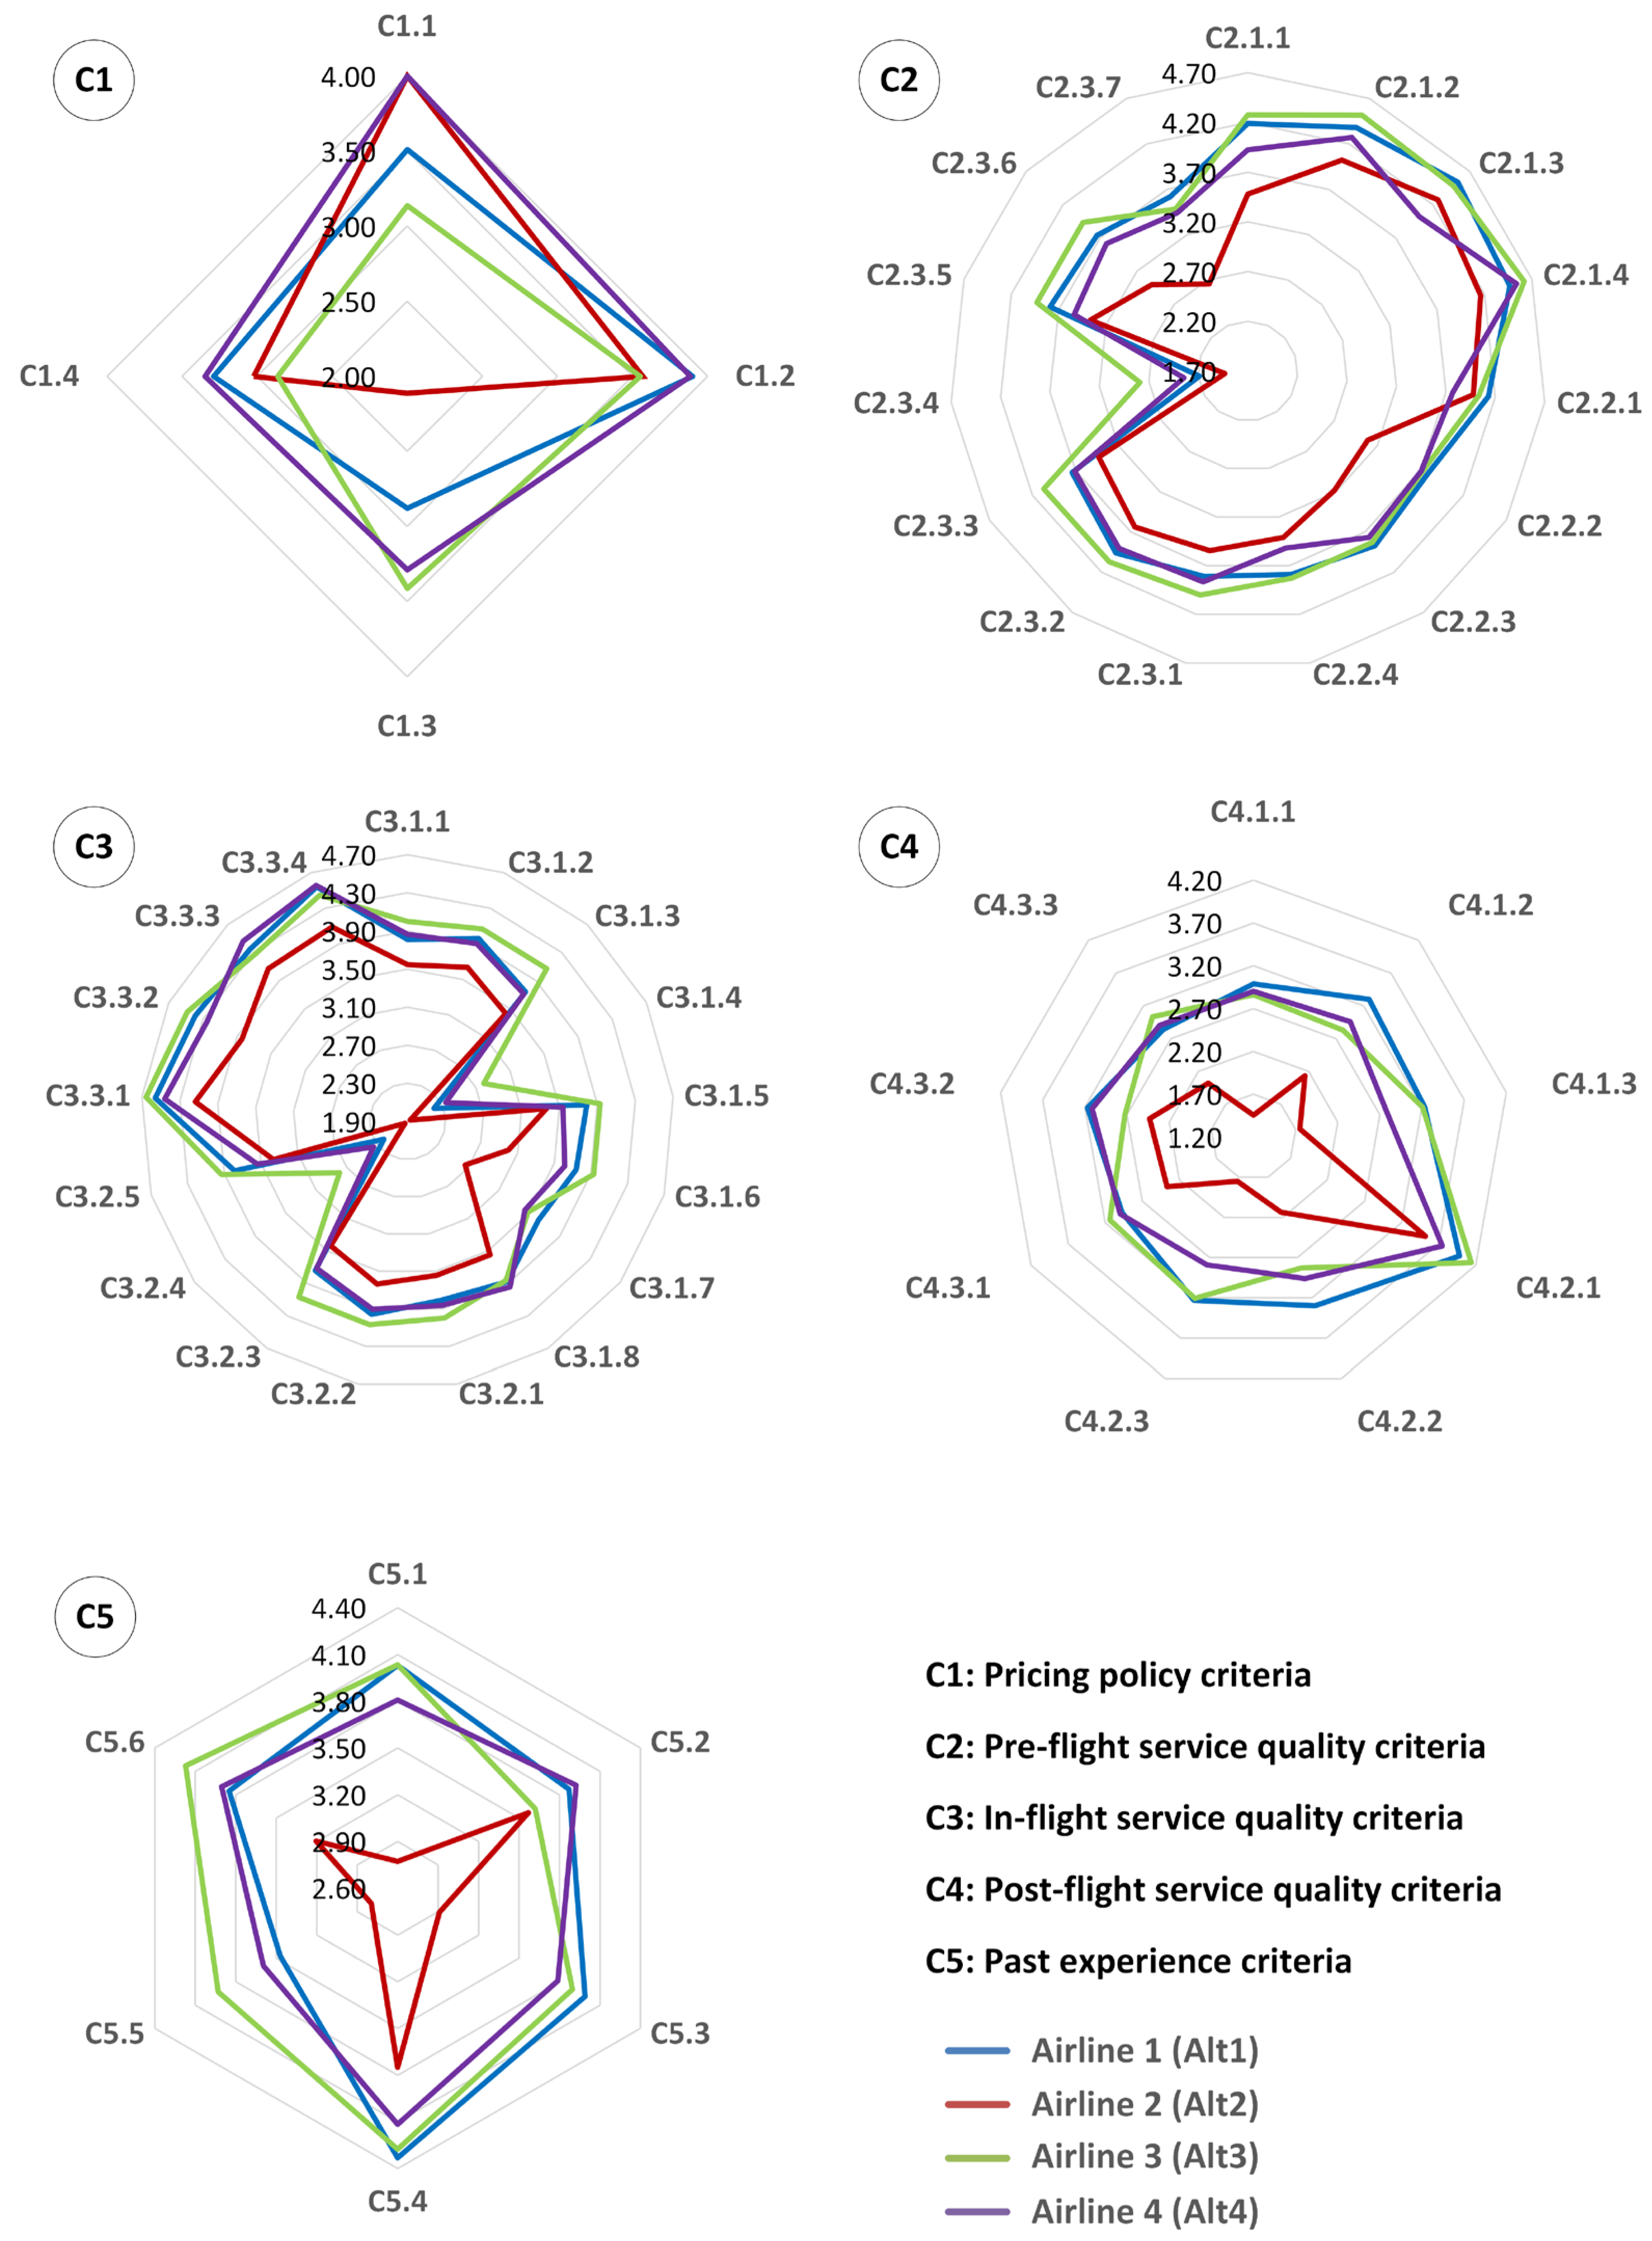
The analysis is supported by the responses of a questionnaire survey conducted in the two main airports in Greece. Four airline service providers were examined; three of them are FSCs (Alt1, Alt3 and Alt4), and one an LCC (Alt2). According to the responses collected from 675 passengers, not a single ranking based on the analysis criteria has occurred. LCC airline (Alt2) is ranked first (along with Alt4) for the ticket price criterion (C1.1) and records moderate performance for the seasonal offers and discounts (C1.4) criterion. Apart from the online check-in (C2.1.3) and destination (C2.2.1) criteria, for which it is ranked third, Alt2 is constantly ranked fourth. Consequently, FSCs dominate the first three positions of the analysis. Alt4 is ranked first for 6 evaluation criteria, second for 17 and third for 26. Alt3 dominates the first ranking order regarding its expected performance since it is ranked first for 30 evaluation criteria. On the other hand, Alt1 is ranked first for 15 evaluation criteria, but it presents a more balanced performance at the second and third ranking orders. In detail, Alt1 is ranked second for 23 evaluation criteria and third for 13 of them.
Since the lack of an obvious solution has been verified, an alternative comparative evaluation could only be reached by combining criteria weights and their satisfaction performances. In the current research, both T-AHP and S-AHP have been implemented to obtain the rankings of the alternatives examined. The results derived indicate common rankings, similar SIs, and expected SI estimations for the T-AHP and the S-AHP with and without consistency constraint implementation in the trials under consideration. However, T-AHP implementation may lead to low differences in the SIs and that may provoke disagreement or doubts regarding the ranking obtained. In this research, T-AHP generates an efficient ranking order but not a robust solution, indicating that in a stochastic decision environment the simulation-based extension of the AHP is more efficient in generating candidate alternative rankings. In particular, the ranking order obtained by the T-AHP has been reached in only 8 out of the 3037 consistent rounds of the S-AHP and Alt1, which is ranked third, climbs to first place in the simulation-based extension since the specific airline company is ranked first in 68,36% of the accepted trials. Moreover, the introduced Satisfaction Expected Rankings (SER) index, which effectively summarizes the results of the simulation trials, also ensures the first position for Alt1, the second for Alt3, the third for Alt4 and the fourth for Alt2.
By exploiting the potential of the S-AHP to provide a mapping of the decision space, a family of indices can be extracted to ensure final decisions. Such indices have been included in the present research to ensure a robust decision framework. In particular, SI descriptive statistics and probability distributions, together with the rank order probabilities and SER index estimates obtained for each alternative considered, provide a clearer picture of their final rankings. In this way, the S-AHP produces more robust rankings, which is of great importance, especially when valuable companies are being evaluated. The proposed methodological framework can be used to produce reports on the breakdown of respondents by gender, age, etc., providing useful insights for managers and administrator officials of the airline sector. As a customer satisfaction methodology, it can be further enriched by SWOT-like analysis to highlight strengths, weaknesses, opportunities and threads in a criterion-by-criterion basis to enrich its potential as a decision-making tool.

5.1. Limitations

The sample size is relatively small and, consequently, it may not be representative of all airline passengers flying from/to Greece. Further, the data collection process took place in the two main Greek international airports and, as a result, a large percentage (2/3) of the sample mainly consisted of passengers with Greek origins. Thus, the findings may have been affected by cultural or other country-specific factors and, therefore, generalization should be made with caution.

5.2. Impact Statement

Air travel accounts for more than half of all international travel, so the contribution of airlines to the tourism industry is unanimously recognized as crucial. An important dimension that enriches the complementary nature of the tourism and air transport industries is the analysis of passenger satisfaction. Although it is very difficult to define passenger satisfaction, it is certain that satisfied customers ensure successful businesses. In the airline industry, satisfaction is related to different dimensions. This study builds a decision model that enumerates satisfaction dimensions and transforms them into criteria in order to treat airline evaluation as a multi-criteria decision analysis problem. The analysis performed acts as a benchmarking procedure, highlighting the strengths and weaknesses of the airlines studied, while also able to provide results by partitioning the sample dataset to support sectoral performance analysis. Combined with Monte Carlo simulation, it generates robust rankings based on the stochastic characteristics of passenger responses.

Author Contributions

Conceptualization, A.P.V., A.M. and P.D.C.; methodology, A.P.V., A.S.S., A.M. and P.D.C.; validation, A.P.V., A.S.S. and D.I.; formal analysis, P.D.C.; investigation, A.P.V. and A.M.; resources, A.P.V.; data curation, A.S.S. and D.I.; writing—original draft preparation, A.P.V., A.M. and P.D.C.; writing—review and editing, A.S.S. and P.D.C.; visualization, A.P.V. and A.S.S.; supervision, P.D.C.; project administration, P.D.C. All authors have read and agreed to the published version of the manuscript.

Funding

This research received no external funding.

Institutional Review Board Statement

Ethical review and approval were waived for this study due to the use of anonymous surveys and the absence of sensitive information or personal identifiers.

Informed Consent Statement

Not applicable.

Data Availability Statement

The data presented in this study are available on request from the corresponding author.

Acknowledgments

We are indebted to the anonymous reviewers, whose comments helped us to improve the presentation.

Conflicts of Interest

The authors declare no conflicts of interest.

Abbreviations

The following abbreviations are used in this manuscript:
AHPAnalytic hierarchy process
AIRQUALService Quality in Airline Industry
ANOVAAnalysis of variance
CIConsistency index
CRConsistency ratio
DMDecision-maker
FSCFull-service carrier
GMCDMGroup Multi-Criteria Decision-Making
KMOKaiser–Meyer–Olkin
LCCLow-cost carrier
MCDAMultiple-criteria decision analysis
SERSatisfaction Expected Rankings
SERVQUALService Quality
SISatisfaction index
SWOTStrengths Weaknesses Opportunities Threats
TOPSISTechnique for Order of Preference Similarity to Ideal Solution
VIKORVlse Kriterijuska Optimizacija I Komoromisno Resenje

Appendix A

Table A1. Importance preference scale probability distribution function.
Importance Levels
Low Importance Values 1 to 3Moderate Importance Values 4 to 6High Importance Values 7 to 9
Pricing Policy
C1.1—Ticket price (in relation to the seat)11.56%28.00%60.44%
C1.2—Quality/price (value for money)7.56%26.22%66.22%
C1.3—Additional charges (e.g., baggage charges)37.33%28.89%33.78%
C1.4—Seasonal offers and discounts (loyalty miles)21.78%33.78%44.44%
Pre-flight Service Quality
C2.1—Information included in the website4.89%16.00%79.11%
C2.1.1—Travel information4.00%22.67%73.33%
C2.1.2—Online booking process2.22%12.00%85.78%
C2.1.3—Online check-in procedure4.89%7.56%87.56%
C2.1.4—Security of financial transactions1.78%8.00%90.22%
C2.2—Flight schedule and routes (destinations)1.78%8.44%89.78%
C2.2.1—Destinations3.56%18.67%77.78%
C2.2.2—Distance between airport and city center12.00%25.78%62.22%
C2.2.3—Flight schedules8.00%28.00%64.00%
C2.2.4—Frequency of flights10.22%28.44%61.33%
C2.3—Pre-flight experience2.67%23.11%74.22%
C2.3.1—Waiting time for check-in9.33%22.22%68.44%
C2.3.2—Services provided during the check-in8.44%21.33%70.22%
C2.3.3—Airport services (e.g., lounges, shops)11.56%22.67%65.78%
C2.3.4—Efficiency of the boarding process66.67%33.33%0.00%
C2.3.5—Efficiency of the embarkation process8.44%21.33%70.22%
C2.3.6—Services during the embarkation procedure11.11%28.89%60.00%
C2.3.7—Response to emergencies (e.g., cancelations, delays)19.56%27.11%53.33%
In-Flight Service Quality
C3.1—Airplane0.44%9.33%90.22%
C3.1.1—Physical characteristics of the aircraft (e.g., size, age)9.33%22.22%68.44%
C3.1.2—Available legroom8.44%21.33%70.22%
C3.1.3—Cabin cleanliness11.56%22.67%65.78%
C3.1.4—Bathroom cleanliness66.67%32.89%0.44%
C3.1.5—Seat comfort and cleanliness9.33%25.33%65.33%
C3.1.6—In-flight entertainment (e.g., newspapers, screens)11.11%28.89%60.00%
C3.1.7—Quality of the food or snacks on board19.56%27.11%53.33%
C3.1.8—Available cabin baggage space4.44%24.89%70.67%
C3.2—Crew1.33%10.22%88.44%
C3.2.1—Crew appearance and elegance9.33%22.22%68.44%
C3.2.2—Professional skills (e.g., use of foreign languages)8.44%21.33%70.22%
C3.2.3—Courtesy 11.56%22.67%65.78%
C3.2.4—Willingness and speed of response66.67%32.89%0.44%
C3.2.5—Approach in unexpected situations9.33%25.33%65.33%
C3.3—Security0.45%2.68%96.88%
C3.3.1—Compliance with safety rules during take-off and landing0.44%7.11%92.44%
C3.3.2—Absence of in-flight problems5.33%8.89%85.78%
C3.3.3—Necessary safety equipment on board2.22%10.22%87.56%
C3.3.4—Safety instructions given by the crew1.33%6.22%92.44%
Post-Flight Service Quality
C4.1—Frequent-flyer program13.27%25.59%61.14%
C4.1.1—Rewards32.44%30.67%36.89%
C4.1.2—Updates for offers and discounts27.11%26.67%46.22%
C4.1.3—Network of international partners28.89%27.56%43.56%
C4.2—Disembarkation3.11%17.78%79.11%
C4.2.1—Efficiency of the disembarkation process5.33%23.56%71.11%
C4.2.2—Baggage collection time27.11%26.67%46.22%
C4.2.3—Luggage management (e.g., damage, lost luggage)28.89%27.56%43.56%
C4.3—Complaint handling1.81%12.67%85.52%
C4.3.1—Management of personal complaints28.89%24.89%46.22%
C4.3.2—Speed of response to personal concerns28.00%24.44%47.56%
C4.3.3—Compensation policy in case of loss or damage 33.78%26.67%39.56%
Past Experience
C5.1—I enjoy flying with this airline11.11%23.56%65.33%
C5.2—I get good value for money from this airline9.33%23.11%67.56%
C5.3—I am satisfied with the way the airline takes care of me12.00%23.11%64.89%
C5.4—I am satisfied with the airline’s member of staff4.44%14.67%80.89%
C5.5—This airline values customer feedback10.53%22.81%66.67%
C5.6—My expectations from the airline were met12.00%14.67%73.33%

References

  1. Namukasa, J. The Influence of Airline Service Quality on Passenger Satisfaction and Loyalty: The Case of Uganda Airline Industry. TQM J. 2013, 25, 520–532. [Google Scholar] [CrossRef]
  2. Gupta, H. Evaluating Service Quality of Airline Industry Using Hybrid Best Worst Method and VIKOR. J. Air Transp. Manag. 2018, 68, 35–47. [Google Scholar] [CrossRef]
  3. Batouei, A.; Iranmanesh, M.; Nikbin, D.; Hyun, S.S. Flight Anxiety: Investigating the Role of Airline Service Quality and Flight Crew’s Competence. Asia Pac. J. Tour. Res. 2019, 24, 710–724. [Google Scholar] [CrossRef]
  4. Prentice, C.; Correia Loureiro, S.M. An Asymmetrical Approach to Understanding Configurations of Customer Loyalty in the Airline Industry. J. Retail. Consum. Serv. 2017, 38, 96–107. [Google Scholar] [CrossRef]
  5. Shah, F.T.; Syed, Z.; Imam, A.; Raza, A. The Impact of Airline Service Quality on Passengers’ Behavioral Intentions Using Passenger Satisfaction as a Mediator. J. Air Transp. Manag. 2020, 85, 101815. [Google Scholar] [CrossRef]
  6. Brochado, A.; Rita, P.; Oliveira, C.; Oliveira, F. Airline Passengers’ Perceptions of Service Quality: Themes in Online Reviews. Int. J. Contemp. Hosp. Manag. 2019, 31, 855–873. [Google Scholar] [CrossRef]
  7. Hwang, E.; Baloglu, S.; Tanford, S. Building Loyalty through Reward Programs: The Influence of Perceptions of Fairness and Brand Attachment. Int. J. Hosp. Manag. 2019, 76, 19–28. [Google Scholar] [CrossRef]
  8. Bezerra, G.C.L.; Gomes, C.F. Determinants of Passenger Loyalty in Multi-Airport Regions: Implications for Tourism Destination. Tour. Manag. Perspect. 2019, 31, 145–158. [Google Scholar] [CrossRef]
  9. Tahanisaz, S.; Shokuhyar, S. Evaluation of Passenger Satisfaction with Service Quality: A Consecutive Method Applied to the Airline Industry. J. Air Transp. Manag. 2020, 83, 101764. [Google Scholar] [CrossRef]
  10. Mikulić, J.; Prebežac, D. What Drives Passenger Loyalty to Traditional and Low-Cost Airlines? A Formative Partial Least Squares Approach. J. Air Transp. Manag. 2011, 17, 237–240. [Google Scholar] [CrossRef]
  11. Rajaguru, R. Role of Value for Money and Service Quality on Behavioural Intention: A Study of Full Service and Low Cost Airlines. J. Air Transp. Manag. 2016, 53, 114–122. [Google Scholar] [CrossRef]
  12. Oh, H.; Kim, K. Customer Satisfaction, Service Quality, and Customer Value: Years 2000–2015. Int. J. Contemp. Hosp. Manag. 2017, 29, 2–29. [Google Scholar] [CrossRef]
  13. Suhartanto, D.; Noor, A. Customer Satisfaction in the Airline Industry: The Role of Service Quality and Price. In Proceedings of the Asia Tourism Forum Conference, Bandung, Indonesia, 8–10 May 2012; Volume 6, pp. 1–12. [Google Scholar]
  14. Chen, F.-Y.; Chang, Y.-H. Examining Airline Service Quality from a Process Perspective. J. Air Transp. Manag. 2005, 11, 79–87. [Google Scholar] [CrossRef]
  15. Jiang, H.; Zhang, Y. An Investigation of Service Quality, Customer Satisfaction and Loyalty in China’s Airline Market. J. Air Transp. Manag. 2016, 57, 80–88. [Google Scholar] [CrossRef]
  16. Prentice, C.; Hsiao, A.; Wang, X.; Loureiro, S.M.C. Mind, Service Quality, Relationship with Airlines. J. Strateg. Mark. 2023, 31, 212–234. [Google Scholar] [CrossRef]
  17. Chiou, Y.-C.; Chen, Y.-H. Factors Influencing the Intentions of Passengers Regarding Full Service and Low Cost Carriers: A Note. J. Air Transp. Manag. 2010, 16, 226–228. [Google Scholar] [CrossRef]
  18. Kusumawardani, A.M.; Aruan, D.T.H. Comparing the Effects of Service Quality and Value-for-Money on Customer Satisfaction, Airline Image and Behavioural Intention between Full-Service and Low-Cost Airlines: Evidence from Indonesia. Int. J. Tour. Policy 2019, 9, 27. [Google Scholar] [CrossRef]
  19. Lin, H.-F.; Huang, Y.-W. Using Analytic Network Process to Measure the Determinants of Low Cost Carriers Purchase Intentions: A Comparison of Potential and Current Customers. J. Air Transp. Manag. 2015, 49, 9–16. [Google Scholar] [CrossRef]
  20. Chang, L.-Y.; Hung, S.-C. Adoption and Loyalty toward Low Cost Carriers: The Case of Taipei–Singapore Passengers. Transp. Res. Part E Logist. Transp. Rev. 2013, 50, 29–36. [Google Scholar] [CrossRef]
  21. El Haddad, R. Exploring Service Quality of Low Cost Airlines. Serv. Mark. Q. 2019, 40, 301–315. [Google Scholar] [CrossRef]
  22. Shen, C.; Yahya, Y. The Impact of Service Quality and Price on Passengers’ Loyalty towards Low-Cost Airlines: The Southeast Asia Perspective. J. Air Transp. Manag. 2021, 91, 101966. [Google Scholar] [CrossRef]
  23. Han, S.; Ham, S.; Yang, I.; Baek, S. Passengers’ Perceptions of Airline Lounges: Importance of Attributes That Determine Usage and Service Quality Measurement. Tour. Manag. 2012, 33, 1103–1111. [Google Scholar] [CrossRef]
  24. Kos Koklic, M.; Kukar-Kinney, M.; Vegelj, S. An Investigation of Customer Satisfaction with Low-Cost and Full-Service Airline Companies. J. Bus. Res. 2017, 80, 188–196. [Google Scholar] [CrossRef]
  25. Curras-Perez, R.; Sanchez-Garcia, I. Antecedents and Consequences of Consumer Commitment in Traditional and Low-Cost Airlines. J. Travel Tour. Mark. 2016, 33, 899–911. [Google Scholar] [CrossRef]
  26. Medina-Muñoz, D.R.; Medina-Muñoz, R.D.; Suárez-Cabrera, M.Á. Determining Important Attributes for Assessing the Attractiveness of Airlines. J. Air Transp. Manag. 2018, 70, 45–56. [Google Scholar] [CrossRef]
  27. Vlachos, I.; Lin, Z. Drivers of Airline Loyalty: Evidence from the Business Travelers in China. Transp. Res. Part E Logist. Transp. Rev. 2014, 71, 1–17. [Google Scholar] [CrossRef]
  28. Hamid, M.S.B.S.; Baxter, G.; Wild, G. Passenger perceptions towards service quality of airlines based in singapore. Int. Rev. Manag. Mark. 2021, 11, 78–91. [Google Scholar] [CrossRef]
  29. Tsaur, S.-H.; Chang, T.-Y.; Yen, C.-H. The Evaluation of Airline Service Quality by Fuzzy MCDM. Tour. Manag. 2002, 23, 107–115. [Google Scholar] [CrossRef]
  30. Liou, J.J.H.; Chuang, M.-L. Evaluating Corporate Image and Reputation Using Fuzzy MCDM Approach in Airline Market. Qual Quant 2010, 44, 1079–1091. [Google Scholar] [CrossRef]
  31. Singh, A.K. Competitive Service Quality Benchmarking in Airline Industry Using AHP. Benchmarking Int. J. 2016, 23, 768–791. [Google Scholar] [CrossRef]
  32. Budimčevič, K.; Marcikić-Horvat, A.; Mimović, P. Measuring performance of middle east airlines—Ahp approach. Int. J. Anal. Hierarchy Process 2018, 10, 391–408. [Google Scholar] [CrossRef]
  33. Bae, K.-H.G.; Gupta, A.; Mau, R. Comparative Analysis of Airline Financial and Operational Performances: A Fuzzy AHP and TOPSIS Integrated Approach. Decis. Sci. Lett. 2021, 10, 361–374. [Google Scholar] [CrossRef]
  34. Al Awadh, M. Assessing the Quality of Sustainable Airline Services Utilizing the Multicriteria Decision-Making Approach. Sustainability 2023, 15, 7044. [Google Scholar] [CrossRef]
  35. Saaty, T.L. A Scaling Method for Priorities in Hierarchical Structures. J. Math. Psychol. 1977, 15, 234–281. [Google Scholar] [CrossRef]
  36. Saaty, T.L. Axiomatic Foundation of the Analytic Hierarchy Process. Manag. Sci. 1986, 32, 841–855. [Google Scholar] [CrossRef]
  37. Saaty, T.L. The Analytic Hierarchy and Analytic Network Processes for the Measurement of Intangible Criteria and for Decision-Making. In Multiple Criteria Decision Analysis: State of the Art Surveys; International Series in Operations Research & Management Science; Springer: New York, NY, USA, 2005; Volume 78, pp. 345–405. ISBN 978-0-387-23067-2. [Google Scholar]
  38. Ishizaka, A.; Labib, A. Review of the Main Developments in the Analytic Hierarchy Process. Expert Syst. Appl. 2011, 38, S0957417411006701. [Google Scholar] [CrossRef]
  39. Teknomo, K. Analytic Hierarchy Process (AHP) Tutorial. Available online: https://people.revoledu.com/kardi/tutorial/AHP/ (accessed on 18 January 2023).
  40. Saaty, T.L. Analytic Hierarchy Process. In Encyclopedia of Operations Research and Management Science; Gass, S.I., Harris, C.M., Eds.; Springer US: New York, NY, USA, 2001; pp. 19–28. ISBN 978-0-7923-7827-3. [Google Scholar]
  41. Roy, B. Paradigms and Challenges. In Multiple Criteria Decision Analysis: State of the Art Surveys; International Series in Operations Research & Management Science; Springer: New York, NY, USA, 2005; Volume 78, pp. 3–24. ISBN 978-0-387-23067-2. [Google Scholar]
  42. Ishizaka, A.; Nemery, P. A Multi-Criteria Group Decision Framework for Partner Grouping When Sharing Facilities. Group Decis. Negot. 2013, 22, 773–799. [Google Scholar] [CrossRef]
  43. Vafaei, N.; Ribeiro, R.A.; Camarinha-Matos, L.M. Normalization Techniques for Multi-Criteria Decision Making: Analytical Hierarchy Process Case Study. In Technological Innovation for Cyber-Physical Systems; Camarinha-Matos, L.M., Falcão, A.J., Vafaei, N., Najdi, S., Eds.; IFIP Advances in Information and Communication Technology; Springer International Publishing: Cham, Switzerland, 2016; Volume 470, pp. 261–269. ISBN 978-3-319-31164-7. [Google Scholar]
  44. Forman, E.H.; Selly, M.A. Decision by Objectives: How to Convince Others That You Are Right; World Scientific: River Edge, NJ, USA, 2001; ISBN 978-981-02-4143-8. [Google Scholar]
  45. Ishizaka, A.; Lusti, M. How to Derive Priorities in AHP: A Comparative Study. Cent. Eur. J. Oper. Res. 2006, 14, 387–400. [Google Scholar] [CrossRef]
  46. Malczewski, J. GIS and Multicriteria Decision Analysis; Wiley: New York, NY, USA; Weinheim, Germany, 1999; ISBN 978-0-471-32944-2. [Google Scholar]
  47. Olya, H.G.T.; Al-ansi, A. Risk Assessment of Halal Products and Services: Implication for Tourism Industry. Tour. Manag. 2018, 65, 279–291. [Google Scholar] [CrossRef]
  48. Mohd-Any, A.A.; Mutum, D.S.; Ghazali, E.M.; Mohamed-Zulkifli, L. To Fly or Not to Fly? An Empirical Study of Trust, Post-Recovery Satisfaction and Loyalty of Malaysia Airlines Passengers. J. Serv. Theory Pract. 2019, 29, 661–690. [Google Scholar] [CrossRef]
  49. Woodside, A.G. Embracing the Complexity Turn in Management Research for Modeling Multiple Realities. In The Complexity Turn; Woodside, A.G., Ed.; Springer International Publishing: Cham, Switzerland, 2017; pp. 1–19. ISBN 978-3-319-47026-9. [Google Scholar]
  50. Taheri, B.; Olya, H.; Ali, F.; Gannon, M.J. Understanding the Influence of Airport Servicescape on Traveler Dissatisfaction and Misbehavior. J. Travel Res. 2020, 59, 1008–1028. [Google Scholar] [CrossRef]
  51. Xu, X.; Liu, W.; Gursoy, D. The Impacts of Service Failure and Recovery Efforts on Airline Customers’ Emotions and Satisfaction. J. Travel Res. 2019, 58, 1034–1051. [Google Scholar] [CrossRef]
  52. Parasuraman, A.; Zeithaml, V.A.; Berry, L.L. A Conceptual Model of Service Quality and Its Implications for Future Research. J. Mark. 1985, 49, 41–50. [Google Scholar] [CrossRef]
  53. Park, J.-W.; Robertson, R.; Wu, C.-L. Modelling the Impact of Airline Service Quality and Marketing Variables on Passengers’ Future Behavioural Intentions. Transp. Plan. Technol. 2006, 29, 359–381. [Google Scholar] [CrossRef]
  54. Ali, F.; Dey, B.L.; Filieri, R. An Assessment of Service Quality and Resulting Customer Satisfaction in Pakistan International Airlines: Findings from Foreigners and Overseas Pakistani Customers. Int. J. Qual. Reliab. Manag. 2015, 32, 486–502. [Google Scholar] [CrossRef]
  55. Hussain, R.; Al Nasser, A.; Hussain, Y.K. Service Quality and Customer Satisfaction of a UAE-Based Airline: An Empirical Investigation. J. Air Transp. Manag. 2015, 42, 167–175. [Google Scholar] [CrossRef]
  56. Rahim, A.G. Perceived Service Quality and Customer Loyalty: The Mediating Effect of Passenger Satisfaction in the Nigerian Airline Industry. Int. J. Manag. Econ. 2016, 52, 94–117. [Google Scholar] [CrossRef]
  57. Jiang, H.; Baxter, G.S.; Wild, G. A study of china’s major domestic airlines’ service quality at shanghai’s hongqiao and pudong international airports. Aviation 2017, 21, 143–154. [Google Scholar] [CrossRef]
  58. AlGhamdi, H.A. Saudi Airlines Service Quality: Passengers’ Perceptions toward SAUDIA Operational Procedures Pre-Flight Services: An Empirical Investigation. Int. J. Bus. Manag. 2019, 15, 122. [Google Scholar] [CrossRef]
  59. Kurtulmuşoğlu, F.B.; Can, G.F.; Tolon, M. A Voice in the Skies: Listening to Airline Passenger Preferences. J. Air Transp. Manag. 2016, 57, 130–137. [Google Scholar] [CrossRef]
  60. Dolnicar, S.; Grabler, K.; Grün, B.; Kulnig, A. Key Drivers of Airline Loyalty. Tour. Manag. 2011, 32, 1020–1026. [Google Scholar] [CrossRef] [PubMed]
  61. Kim, S.-B.; Park, J.-W. A Study on the Importance of Airline Selection Attributes by Airline Type: An Emphasis on the Difference of Opinion in between Korean and Overseas Aviation Experts. J. Air Transp. Manag. 2017, 60, 76–83. [Google Scholar] [CrossRef]
  62. Bezerra, G.C.L.; Gomes, C.F. The Effects of Service Quality Dimensions and Passenger Characteristics on Passenger’s Overall Satisfaction with an Airport. J. Air Transp. Manag. 2015, 44–45, 77–81. [Google Scholar] [CrossRef]
  63. Bogicevic, V.; Yang, W.; Cobanoglu, C.; Bilgihan, A.; Bujisic, M. Traveler Anxiety and Enjoyment: The Effect of Airport Environment on Traveler’s Emotions. J. Air Transp. Manag. 2016, 57, 122–129. [Google Scholar] [CrossRef]
  64. Alfakhri, D.; Harness, D.; Nicholson, J.; Harness, T. The Role of Aesthetics and Design in Hotelscape: A Phenomenological Investigation of Cosmopolitan Consumers. J. Bus. Res. 2018, 85, 523–531. [Google Scholar] [CrossRef]
  65. Jensen, Ø.; Li, Y.; Uysal, M. Visitors’ Satisfaction at Managed Tourist Attractions in Northern Norway: Do on-Site Factors Matter? Tour. Manag. 2017, 63, 277–286. [Google Scholar] [CrossRef]
  66. Brida, J.G.; Moreno-Izquierdo, L.; Zapata-Aguirre, S. Customer Perception of Service Quality: The Role of Information and Communication Technologies (ICTs) at Airport Functional Areas. Tour. Manag. Perspect. 2016, 20, 209–216. [Google Scholar] [CrossRef]
  67. Castillo-Manzano, J.I.; López-Valpuesta, L. Check-in Services and Passenger Behaviour: Self Service Technologies in Airport Systems. Comput. Hum. Behav. 2013, 29, 2431–2437. [Google Scholar] [CrossRef]
  68. Ng, S.I.; Sambasivan, M.; Zubaidah, S. Antecedents and Outcomes of Flight Attendants’ Job Satisfaction. J. Air Transp. Manag. 2011, 17, 309–313. [Google Scholar] [CrossRef]
  69. Perçin, S. Evaluating Airline Service Quality Using a Combined Fuzzy Decision-Making Approach. J. Air Transp. Manag. 2018, 68, 48–60. [Google Scholar] [CrossRef]
  70. Shiwakoti, N.; Jiang, H.; Nguyen, A.D. Passengers’ Perception of Safety and Its Relationship with Demographics, Service Quality, Satisfaction and Loyalty in Airlines Sector—A Case Study of Vietnam to Australia Route. Transp. Policy 2022, 124, 194–202. [Google Scholar] [CrossRef]
  71. Woo, G.J.; Jun, J.-K. How to Create a Profitable Boothscape? Int. J. Contemp. Hosp. Manag. 2017, 29, 966–985. [Google Scholar] [CrossRef]
  72. Fodness, D.; Murray, B. Passengers’ Expectations of Airport Service Quality. J. Serv. Mark. 2007, 21, 492–506. [Google Scholar] [CrossRef]
  73. Laming, C.; Mason, K. Customer Experience—An Analysis of the Concept and Its Performance in Airline Brands. Res. Transp. Bus. Manag. 2014, 10, 15–25. [Google Scholar] [CrossRef]
  74. Chou, C.-C.; Liu, L.-J.; Huang, S.-F.; Yih, J.-M.; Han, T.-C. An Evaluation of Airline Service Quality Using the Fuzzy Weighted SERVQUAL Method. Appl. Soft Comput. 2011, 11, 2117–2128. [Google Scholar] [CrossRef]
  75. Palmer, A.; Bejou, D. Retrospective: Service Failure and Loyalty: An Exploratory Empirical Study of Airline Customers. J. Serv. Mark. 2016, 30, 480–484. [Google Scholar] [CrossRef]
  76. Chen, A.C.-H.; Chen, S.K.; Ma, C.-L. Brand Experience and Customer Equity Prediction. In Advances in Business and Management Forecasting; Lawrence, K.D., Klimberg, R.K., Eds.; Emerald Group Publishing Limited: Leeds, UK, 2016; Volume 11, pp. 19–38. ISBN 978-1-78635-534-8. [Google Scholar]
  77. Oppewal, H.; Huybers, T.; Crouch, G.I. Tourist Destination and Experience Choice: A Choice Experimental Analysis of Decision Sequence Effects. Tour. Manag. 2015, 48, 467–476. [Google Scholar] [CrossRef]
  78. Crouch, G.I.; Huybers, T.; Oppewal, H. Inferring Future Vacation Experience Preference from Past Vacation Choice: A Latent Class Analysis. J. Travel Res. 2016, 55, 574–587. [Google Scholar] [CrossRef]
  79. Chen, H.-T.; Chao, C.-C. Airline Choice by Passengers from Taiwan and China: A Case Study of Outgoing Passengers from Kaohsiung International Airport. J. Air Transp. Manag. 2015, 49, 53–63. [Google Scholar] [CrossRef]
  80. Yaylali, M.; Çelik, A.K.; Dilek, Ö. Analyzing Key Socio-Economic and Socio-Demographic Drivers of Domestic Passengers’ Airline Choice Behavior in Turkey Using Multinomial and Mixed Logit Models. Transp. Lett. 2016, 8, 121–130. [Google Scholar] [CrossRef]
  81. Saaty, T.L. Decision Making for Leaders: The Analytic Hierarchy Process for Decisions in a Complex World, 3rd ed.; 5. Print; RWS: Pittsburgh, PA, USA, 2012; ISBN 978-0-9620317-8-6. [Google Scholar]
  82. Tsafarakis, S.; Kokotas, T.; Pantouvakis, A. A Multiple Criteria Approach for Airline Passenger Satisfaction Measurement and Service Quality Improvement. J. Air Transp. Manag. 2018, 68, 61–75. [Google Scholar] [CrossRef]
  83. Nejati, M.; Nejati, M.; Shafaei, A. Ranking Airlines’ Service Quality Factors Using a Fuzzy Approach: Study of the Iranian Society. Int. J. Qual. Reliab. Manag. 2009, 26, 247–260. [Google Scholar] [CrossRef]
  84. Babbar, S.; Koufteros, X. The Human Element in Airline Service Quality: Contact Personnel and the Customer. Int. J. Oper. Prod. Manag. 2008, 28, 804–830. [Google Scholar] [CrossRef]
  85. Wrenn, B.; Stevens, R.E.; Loudon, D.L. Marketing Research; Routledge: London, UK, 2013; ISBN 978-1-135-17852-9. [Google Scholar]
Figure 1. Decision elements’ hierarchical structure.
Information 16 00272 g001
Figure 2. T-AHP (left) and S-AHP (right) implementation sequence.
Information 16 00272 g002
Figure 3. Candidate airline evaluation hierarchical model.
Information 16 00272 g003
Figure 4. Expected satisfaction level for the examined alternatives per evaluation criterion.
Information 16 00272 g004
Table 1. Criteria and alternatives’ evaluation scales.
Criteria Importance Intensity Levels *Satisfaction Intensity Levels
t Linguistic VariablesValue Scale (vt)Linguistic VariablesValue Scale (rt)
1Very Low Importance1Very Dissatisfied1
2Low Importance3Dissatisfied2
3Moderate Importance5Neutral3
4High Importance7Satisfied4
5Very High Importance9Very Satisfied5
* If needed, even values can also be considered to assist compensation among the linguistic variables.
Table 2. The probability distribution function of the importance preference scale for the primary analysis criteria.
Importance Levels
Low Importance
Values 1 to 3
Moderate Importance
Values 4 to 6
High Importance
Values 7 to 9
C1—Pricing policy evaluation criterion0.89%11.16%87.95%
C2—Pre-flight service quality criterion2.67%22.67%74.67%
C3—In-flight service quality criterion1.33%12.89%85.78%
C4—Post-flight service criterion4.52%14.48%81.00%
C5—Past experience criterion1.35%13.45%85.20%
Table 3. Exploratory factor analysis results.
KMOTVEFactor LoadingsCronbach’s αLevel of SatisfactionSignificance for Satisfaction
Factors MeanStdMeanStd
C1: Pricing Policy0.71655,2300.579–0.8580.7763.460.7318.351.600
C2: Pre-flight service quality0.65261,6720.791–0.8270.6893.930.5347.631.902
C2.1: Website0.82464,1140.652–0.8890.8574.270.6417.591.958
C2.2: Flight schedule and routes0.84262,4550.631–0.8760.8403.780.6578.371.573
C2.3: Airport services0.87862,3000.719–0.8270.9873.730.7397.651.846
C3: In-flight service quality0.70374,4890.820–0.8920.8214.070.6018.231.711
C3.1: Airplane0.90257,5040.692–0.8480.9033.560.7618.261.518
C3.2: Crew0.86974,9040.853–0.9040.9334.260.7168.361.653
C3.3: Security0.88371,5050.811–0.8910.8964.390.6179.361.180
C4: Post-flight service quality0.69072,5640.797–0.8830.8113.680.6997.681.857
C4.1: Frequent-flyer program0.82264,8830.840–0.9120.8883.590.7736.772.512
C4.2: Disembarkation0.74873,2640.783–0.9470.8703.750.8347.801.868
C4.3: Complaint handling0.84684,4080.882–0.9440.9373.580.9328.151.724
C5: Past experience0.71659,6780.545–0.8420.7493.440.8268.071.706
Table 4. Local weights generated by T-AHP and S-AHP versions for the analysis of first- and second-level criteria (%).
T-AHP LocalS-AHP (Total Trials)S-AHP (Accepted Trials)
Criteria MinExpMaxMinExpMax
C1: Pricing policy20.977.4921.4643.5910.9921.3639.01
C2: Pre-flight service quality19.016.9418.5837.467.7418.7433.28
C2.1: Website31.866.2531.0460.148.3731.1360.14
C2.2: Flight schedule and routes35.7315.0036.9481.8215.0036.7280.91
C2.3: Airport services32.415.9432.0363.255.9432.1563.25
C3: In-flight service quality20.577.7320.7539.2710.9020.8235.33
C3.1: Airplane33.0514.2433.1663.2714.2432.9863.27
C3.2: Crew31.9711.4031.2762.8412.8131.3462.84
C3.3: Security34.9812.7135.5763.2714.1735.6760.31
C4: Post-flight service quality19.197.2918.6937.827.4818.7336.67
C4.1: Frequent-flyer program28.195.5225.3156.055.5225.5655.80
C4.2: Disembarkation35.138.9636.1878.448.9636.0778.44
C4.3: Complaint handling36.689.5638.5177.789.5638.3677.78
C5: Past experience20.2510.9620.5241.8211.2820.3433.47
Table 5. SIs for the estimation options examined.
Geometric Mean OptionAirline 1Airline 2Airline 3Airline 4
Satisfaction Index3.6023.1813.7073.675
Ranking3rd4th1st2nd
Simulation Option (Total Trials)Airline 1Airline 2Airline 3Airline 4
Satisfaction Index (Minimum)3.5372.8023.4683.442
Satisfaction Index (Expected)3.7163.1823.7073.676
Satisfaction Index (Maximum)3.8643.3683.9063.814
Ranking1st4th2nd3rd
Simulation Option (Accepted Trials)Airline 1Airline 2Airline 3Airline 4
Satisfaction Index (Minimum)3.5922.9523.5363.522
Satisfaction Index (Expected)3.7173.1843.7073.677
Satisfaction Index (Maximum)3.8213.3363.8473.778
Ranking1st4th2nd3rd
Table 6. Examined alternative scenarios’ SI distributions.
Satisfaction Index (N of trials)
RangeAirline 1Airline 2Airline 3Airline 4
2.9to3.0-0.03% (1)--
3.0to3.1-5.60% (170)--
3.1to3.2-56.87% (1727)--
3.2to3.3-36.65% (1113)--
3.3to3.4-0.86% (26)--
3.5to3.60.03% (1)-0.49% (15)1.09% (33)
3.6to3.730.29% (920)-41.82% (1270)75.70% (2299)
3.7to3.868.98% (2095)-56.34% (1711)23.31% (705)
3.8to3.90.69% (21)-1.35% (41)-
Table 7. Simulation ranking appearance probability analysis.
Unique Simulation Ranking Analysis
Ranking IDAirline 1Airline 2Airline 3Airline 4# of TrialsProbability of Appearance (%)
R11423178558.78
R2241391630.16
R314322919.58
R42431351.15
R5341280.26
R6342120.07
Table 8. Appearance probability of alternatives’ ranking order.
Alternatives’ Ranking Order Probability (N of Trials)
RankAirline 1Airline 2Airline 3Airline 4
Ranked 1st68.36% (2076)-30.42% (924)1.22% (37)
Ranked 2nd31.31% (951)-58.84% (1787)9.85% (299)
Ranked 3rd0.33% (10)-10.73% (326)88.94% (2701)
Ranked 4th-100% (3037)--
S E R index1.3204.0001.8032.877
Table 9. AHP-based group SIs and alternative ranking evaluation per gender.
MalesFemales
Airline 1Airline 2Airline 3Airline 4Airline 1Airline 2Airline 3Airline 4
SI Option 1 *3.7173.0013.7333.5443.5253.2693.4813.690
SI Option 2 **3.8343.1143.8483.6623.6403.2693.4773.689
SI Option 2 ***3.8353.1153.8493.6643.6403.2723.4773.689
Ranked 1st23.21%-76.79%-0.98%--99.02%
Ranked 2nd76.79%-23.21%-99.02%--0.98%
Ranked 3rd---100%-0.04%99.96%-
Ranked 4th-100%---99.96%0.04%-
S E R index1.7684.0001.2323.0001.9904.0003.0001.010
Rankings2nd4th1st3rd2nd4th 3rd 1st
* T-AHP, ** S-AHP (total trials), *** S-AHP (accepted trials).
Disclaimer/Publisher’s Note: The statements, opinions and data contained in all publications are solely those of the individual author(s) and contributor(s) and not of MDPI and/or the editor(s). MDPI and/or the editor(s) disclaim responsibility for any injury to people or property resulting from any ideas, methods, instructions or products referred to in the content.

