
GSAF: An ML-Based Sentiment Analytics Framework for Understanding Contemporary Public Sentiment and Trends on Key Societal Issues


Abstract

1. Introduction
2. Motivation
3. Contribution
3.1. Innovations of GSAF
- 1.
- Real-Time State-Level Sentiment Mapping: GSAF uniquely visualizes sentiment at the granular state level in real time, enabling policymakers, researchers, and businesses to quickly identify regional variations and tailor interventions or strategies accordingly.
- 2.
- Interactive and User-Driven Exploration: The platform allows users to interactively filter and explore sentiment by specific keywords, emotions, and timeframes, enabling customized insights tailored to user needs.
- 3.
- Comprehensive Emotion Classification: Leveraging the NRC Emotion Lexicon, GSAF provides comprehensive categorization of tweets into multiple emotional dimensions, surpassing traditional binary sentiment classification. This richer emotional categorization allows deeper insights into public moods and reactions.
- 4.
- Scalable Data Processing and Visualization: With a robust workflow designed to handle millions of tweets efficiently, GSAF is capable of real-time sentiment visualization through scalable algorithms, optimizing both data retrieval and processing speeds.
3.2. Research Questions and Hypotheses
- 1.
- RQ1: How can we develop a generalized framework for real-time sentiment analysis that captures nuanced emotional states (e.g., anger, joy, trust) from social media data?
- 2.
- RQ2: What are the most effective caching techniques for reducing computational latency in large-scale sentiment analysis applications?
- 3.
- RQ3: How does public sentiment vary across different U.S. states, and what factors contribute to these variations?
4. Workflow of Interactive Platform
| Algorithm 1: Pseudo-code of the workflow of our developed interactive platform. |
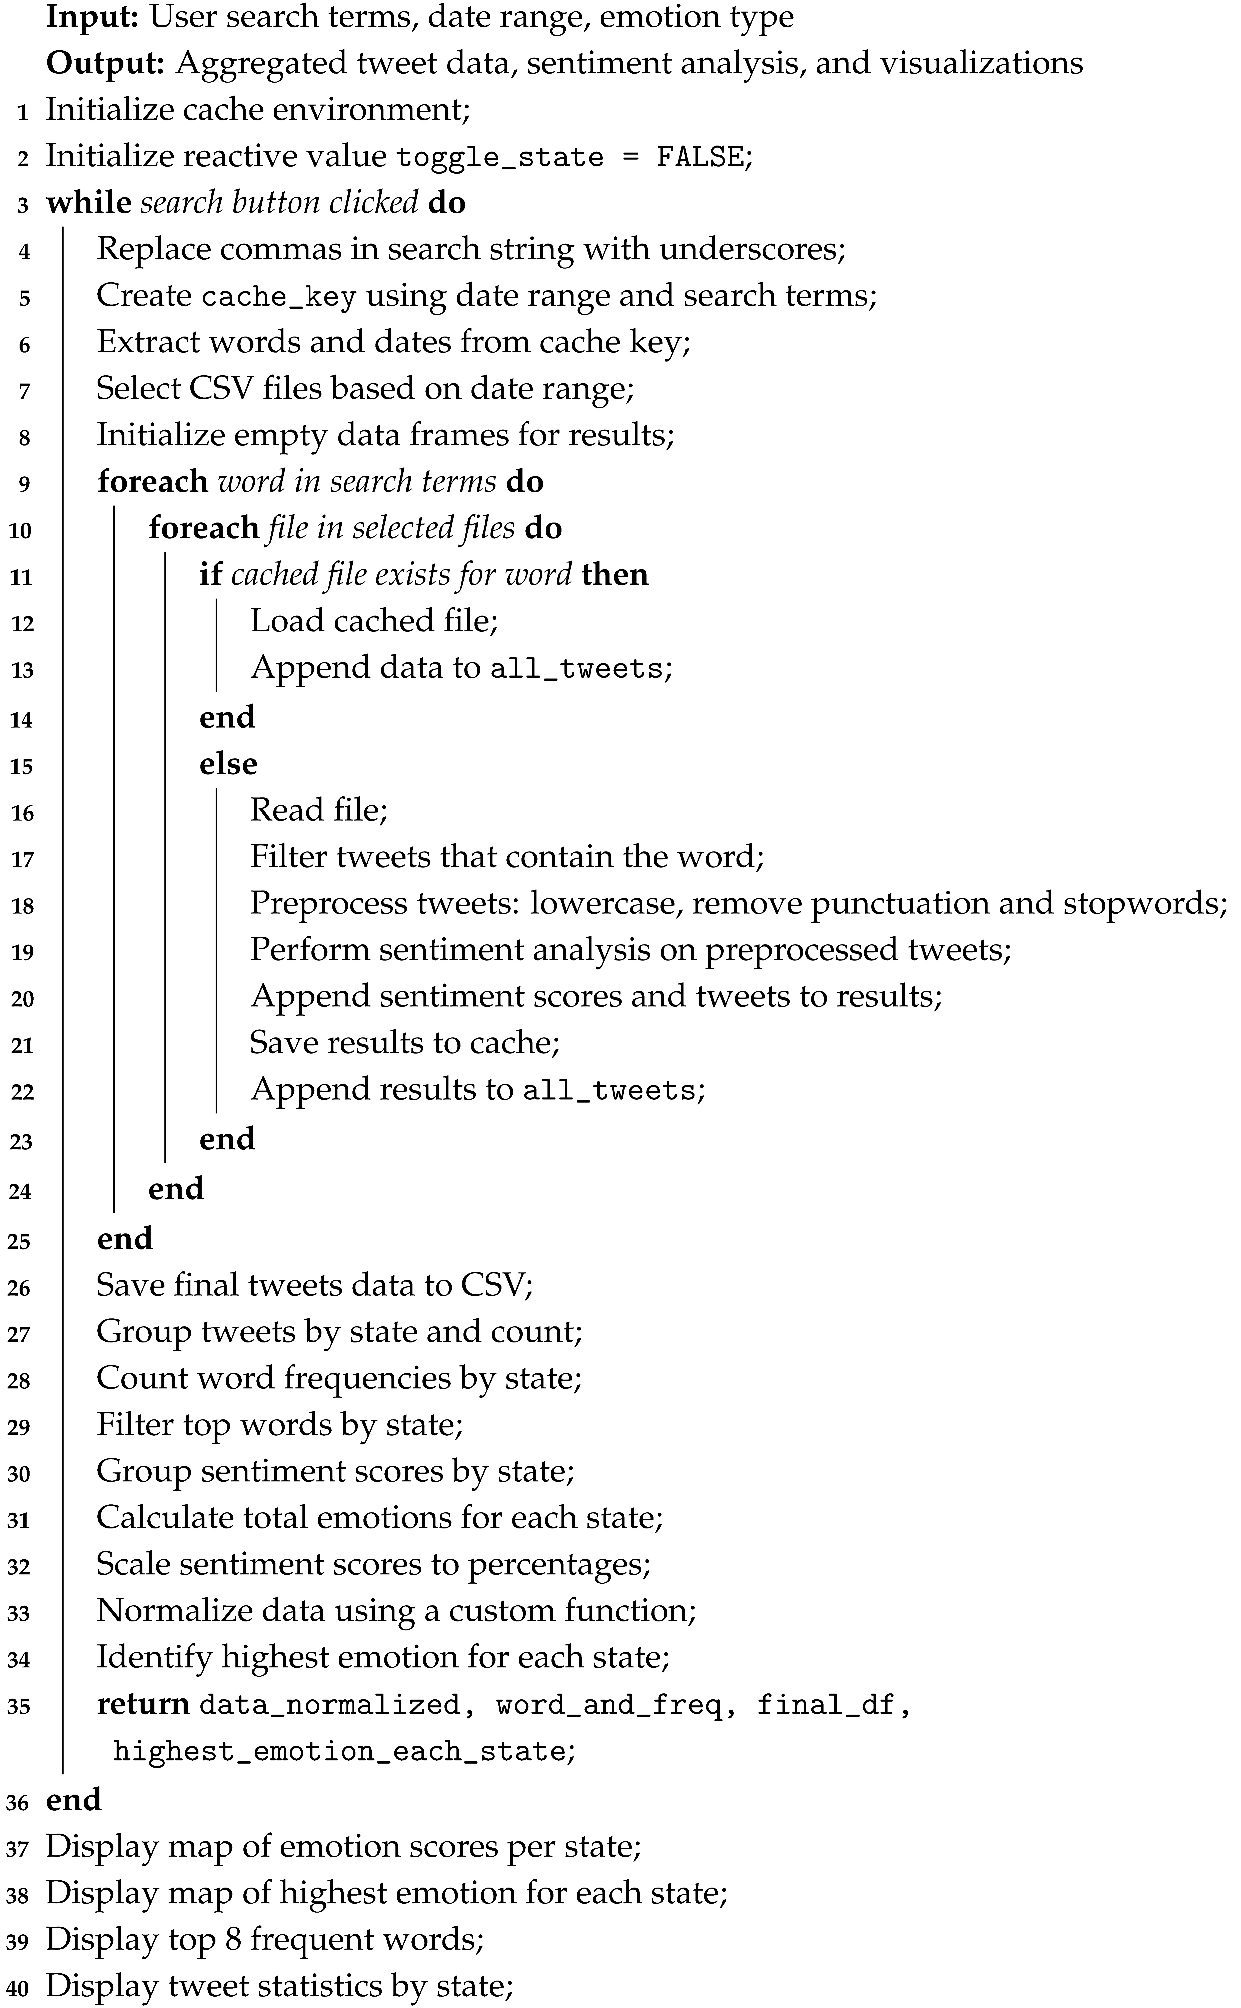 |
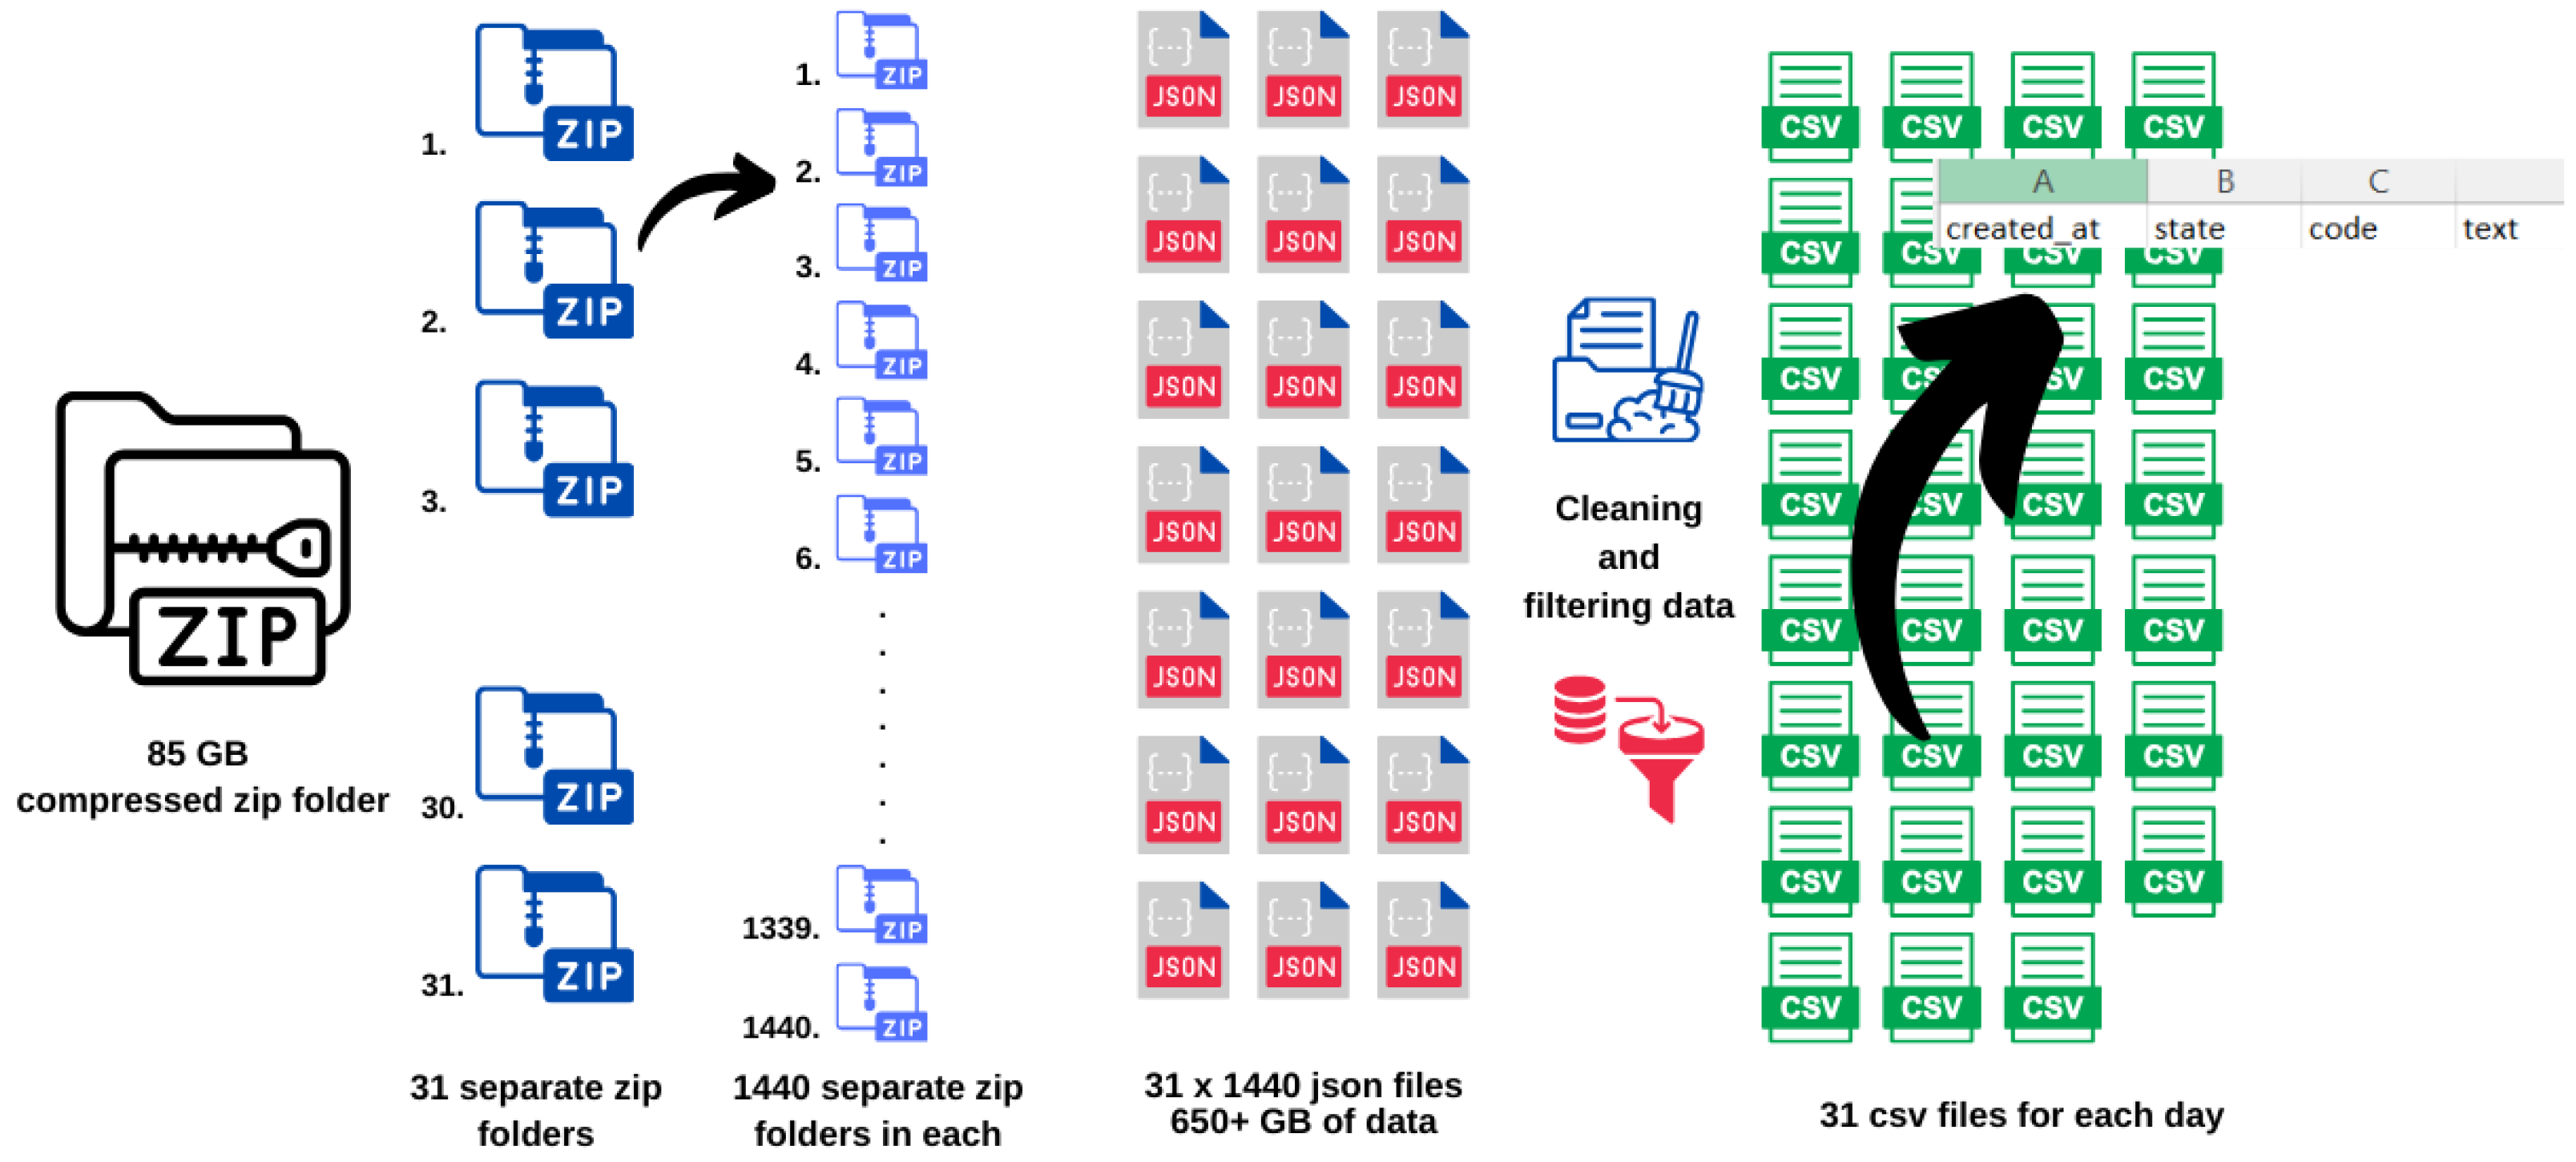
4.1. Data Collection and Prepossessing
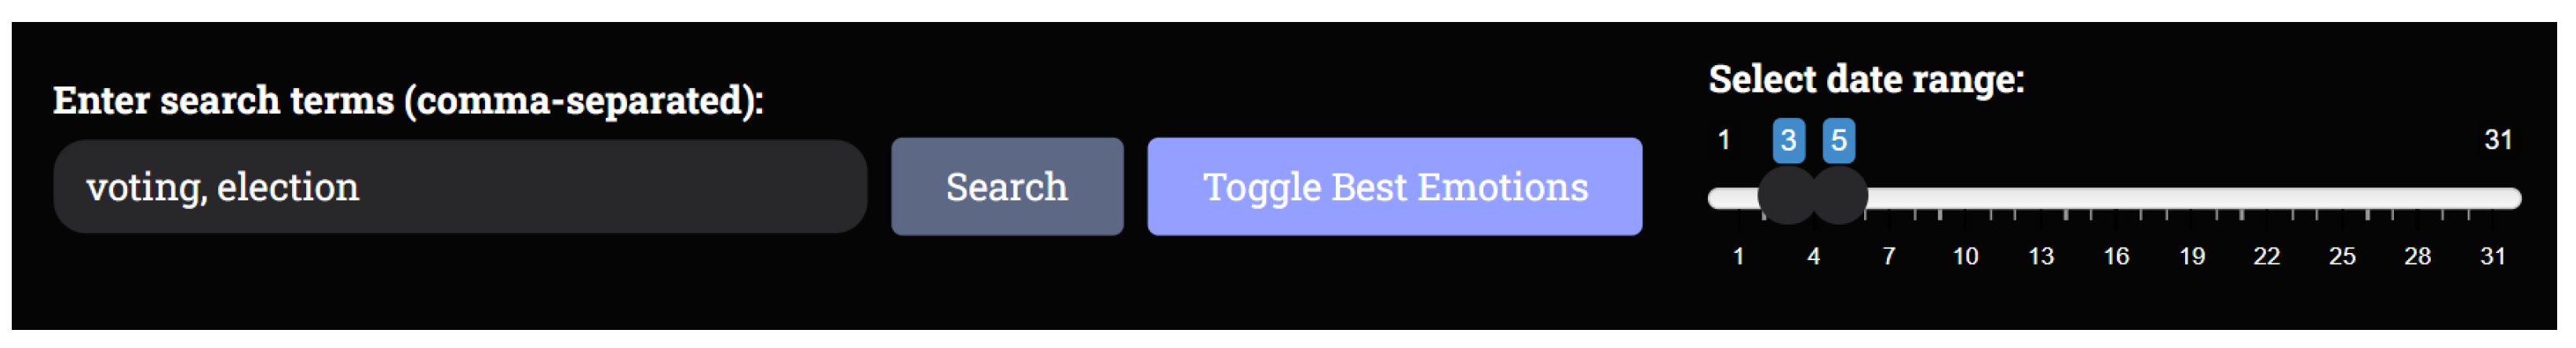
4.2. Searching Tweets by Keyword
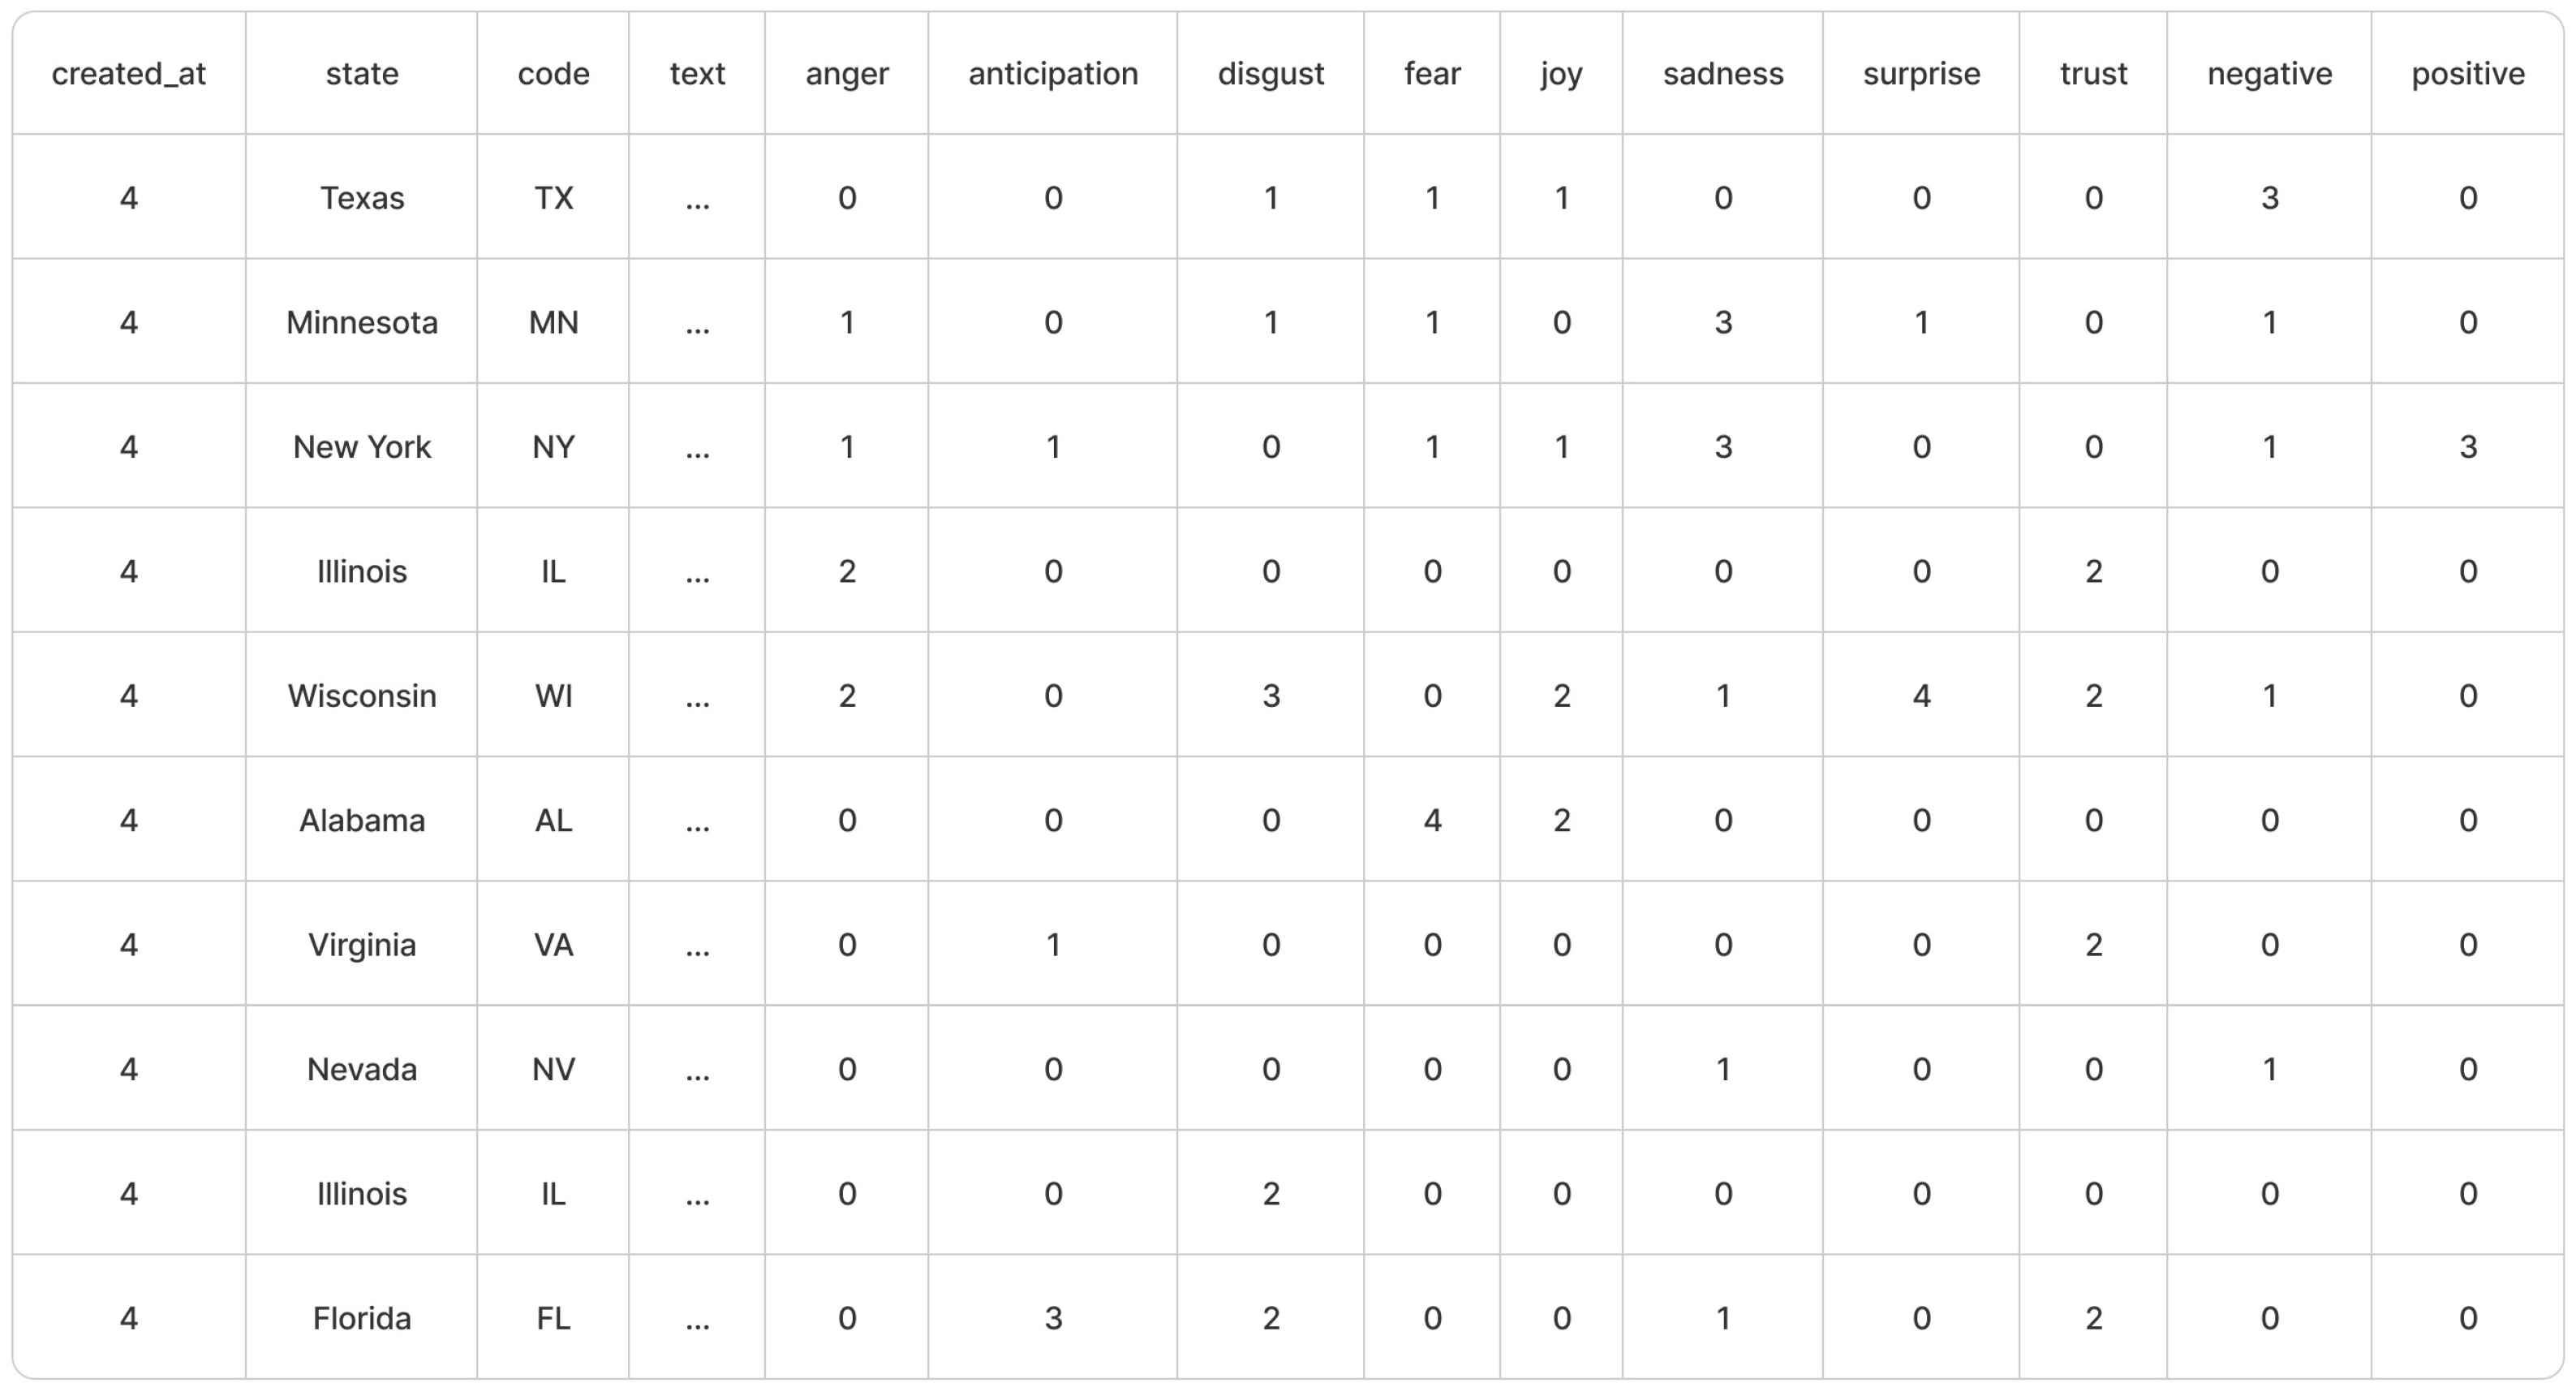
4.3. Applying Sentiment Analysis and Tokenization
4.4. Plotting on a Map
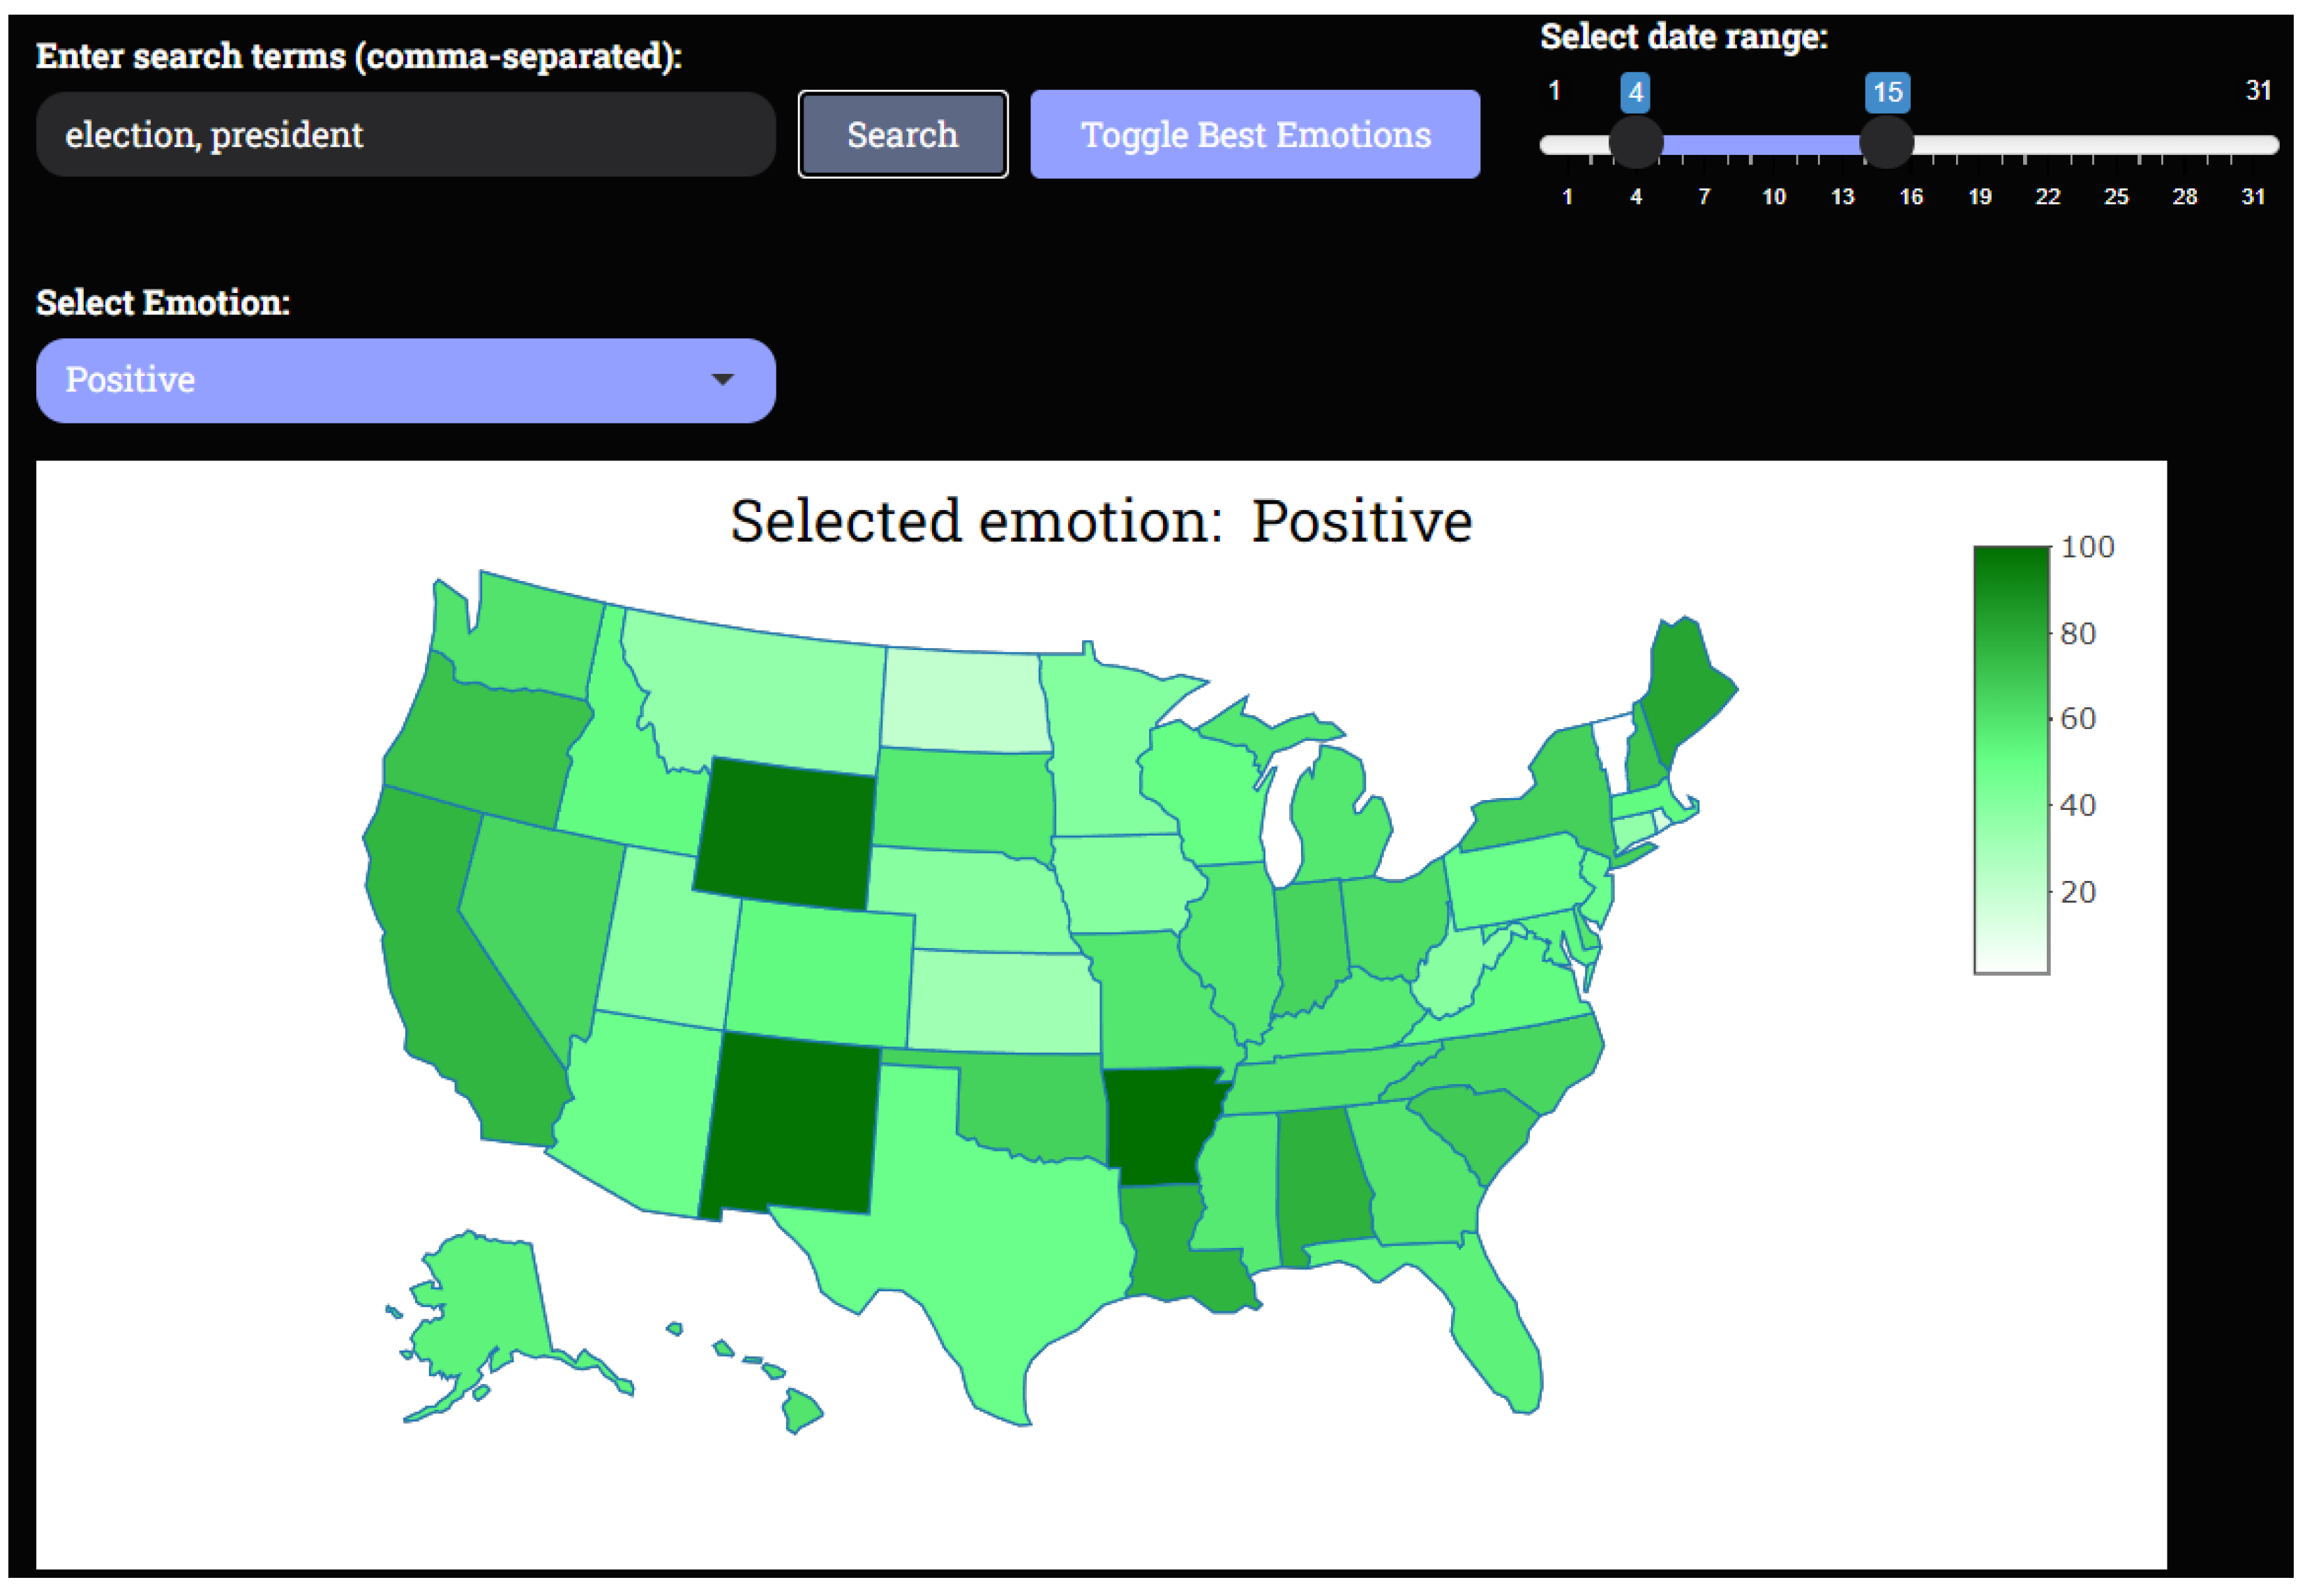
- Emotion-specific choropleth map: Users can select specific emotions—such as anger, joy, sadness, or trust—from a dropdown menu. Based on this selection, the application generates a choropleth map, where the intensity of color in each state represents the sentiment score for that emotion. The z parameter in the plot_ly function is mapped to the sentiment score for the chosen emotion, and a custom color scale is applied to enhance visual differentiation between high and low sentiment scores. The higher the sentiment score for a specific emotion, the darker the corresponding color on the map, giving users an immediate visual representation of the emotional climate across the United States. A few example for positive, trust, negative emotions can be seen in Figure 5 and Figure 6.
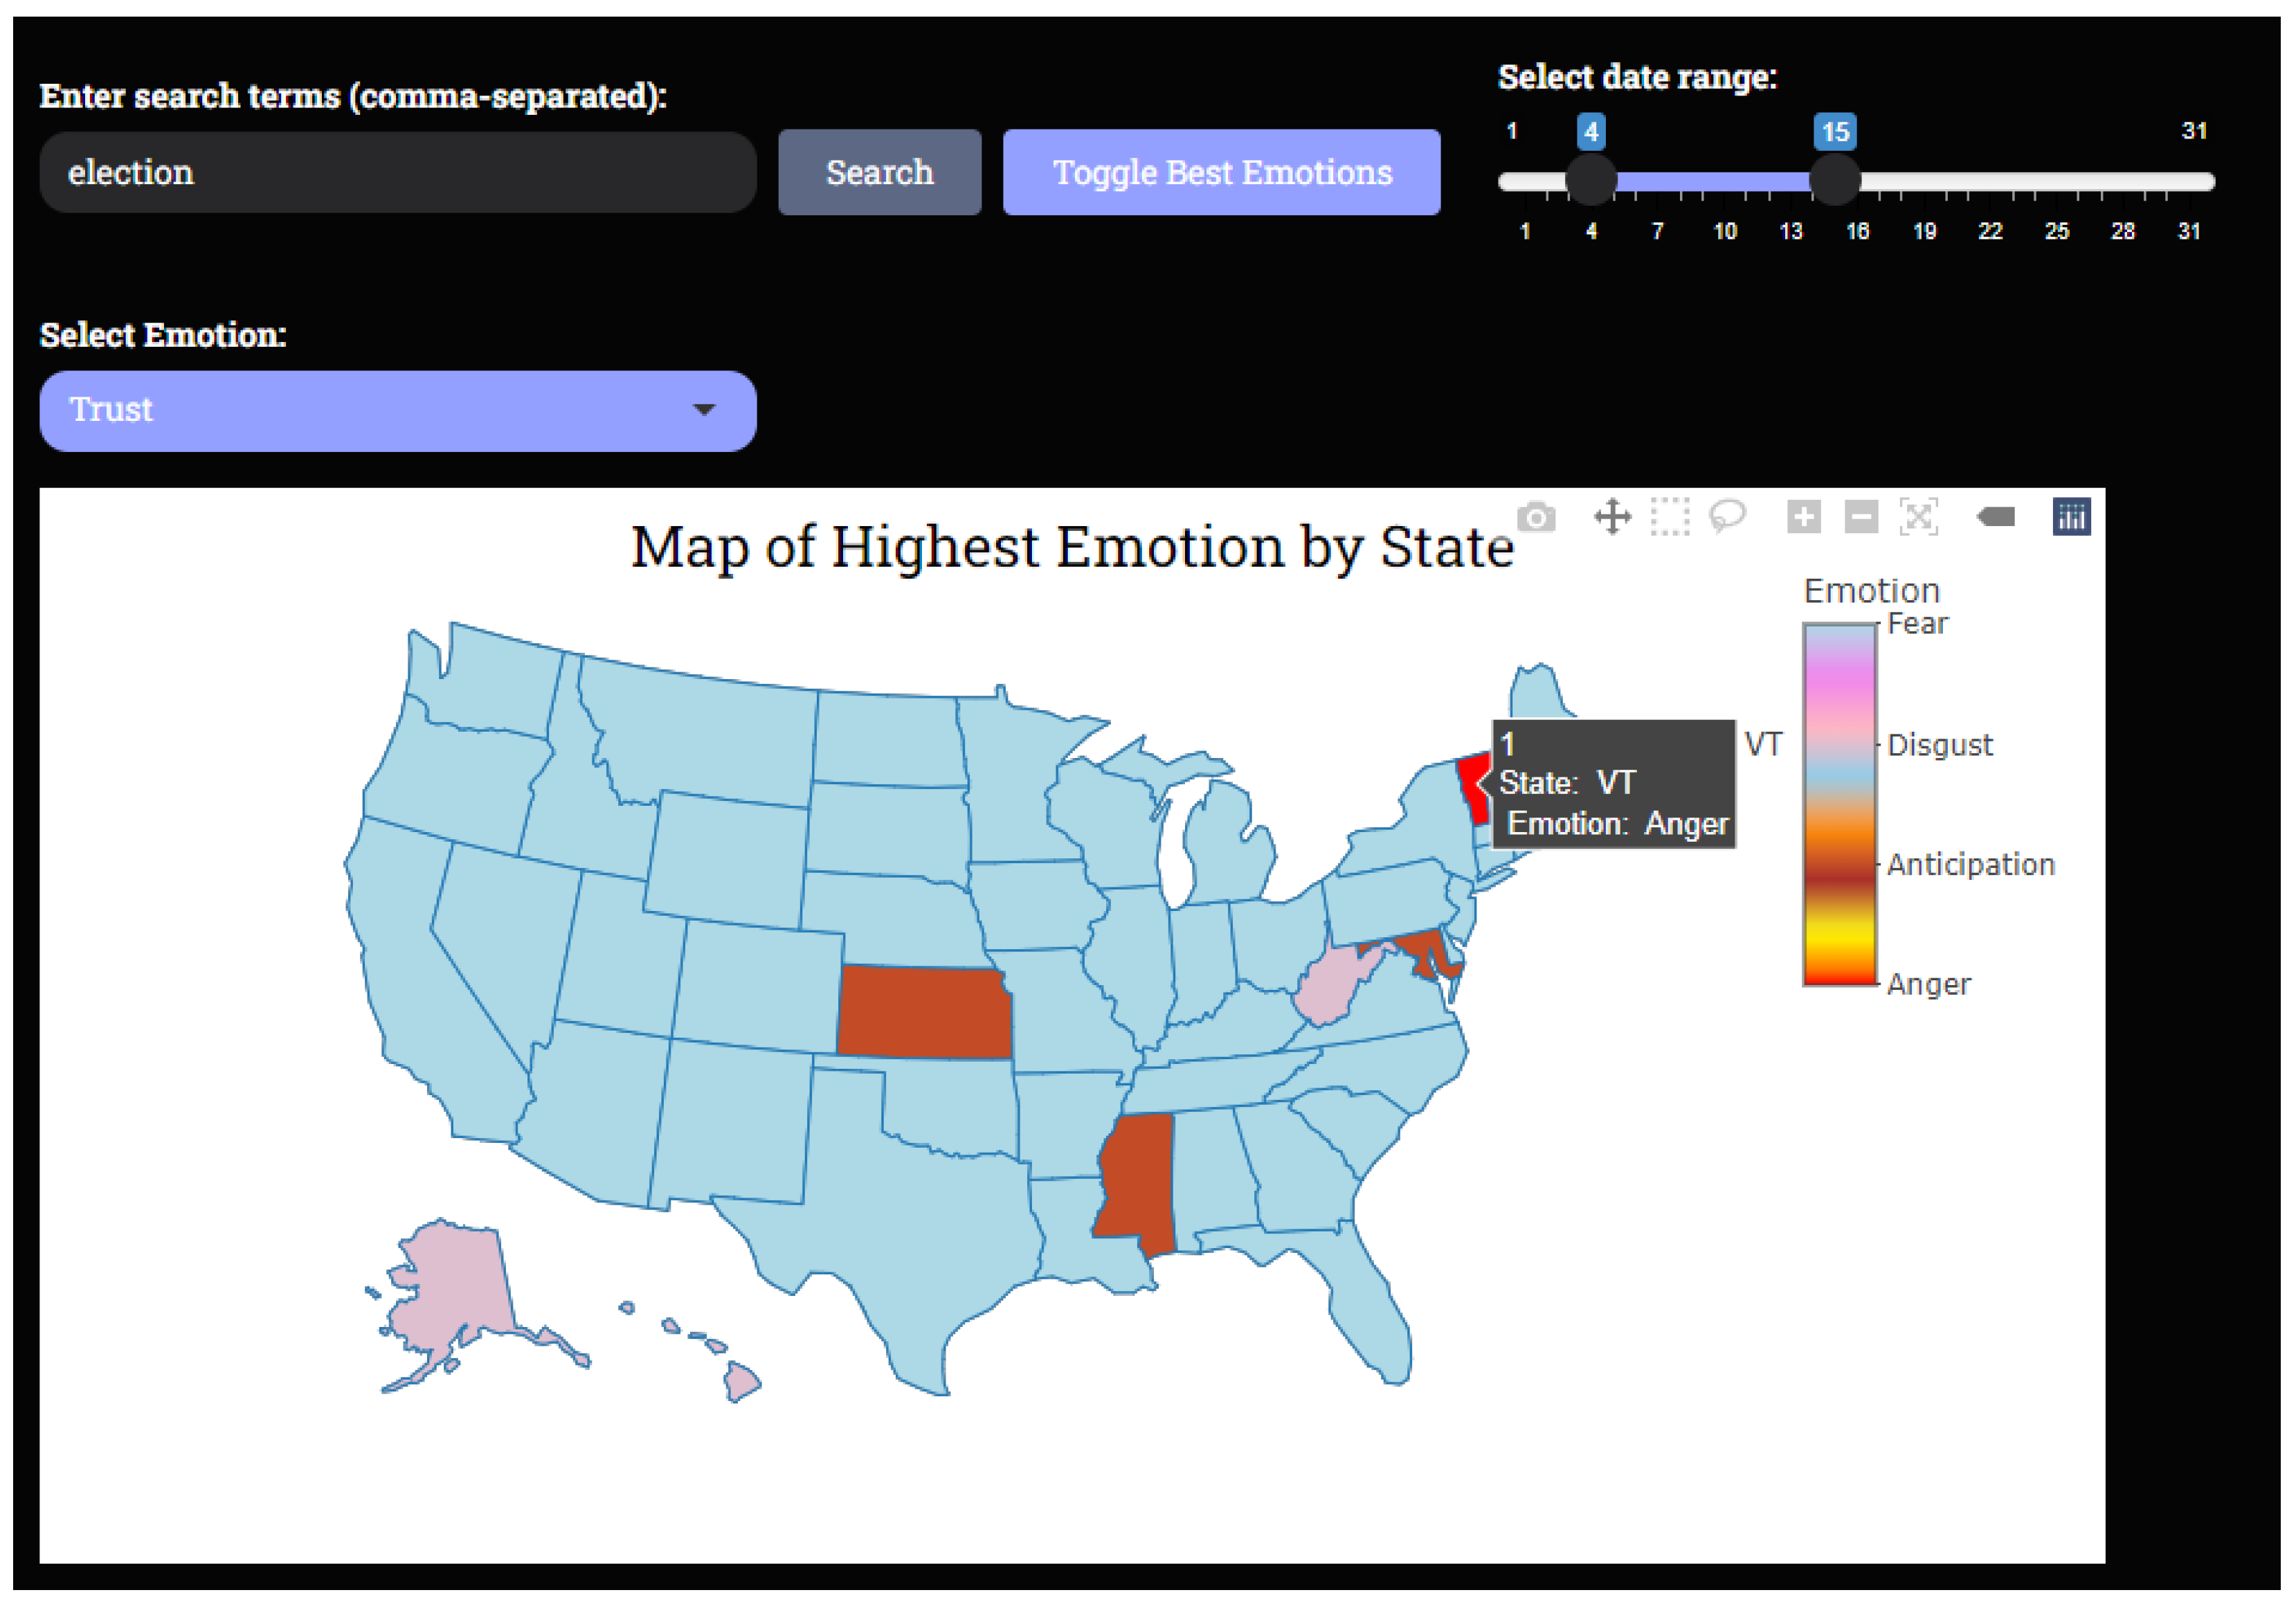
- Dominant emotion map: Additionally, users can also view a map that highlights the predominant emotion in each state. This map uses color to represent the dominant emotion for every state, allowing users to quickly identify which emotion (anger, joy, fear, etc.) is most prevalent in each region. The script calculates the highest sentiment score for each state across all emotions, and this dominant emotion is displayed with a distinct color on the map. A predefined color scheme is used for each emotion to provide a clear and consistent visual cue, making it easy to distinguish emotional trends on a national scale. A few examples of trust, positive, and negative emotions can be seen in Figure 7.
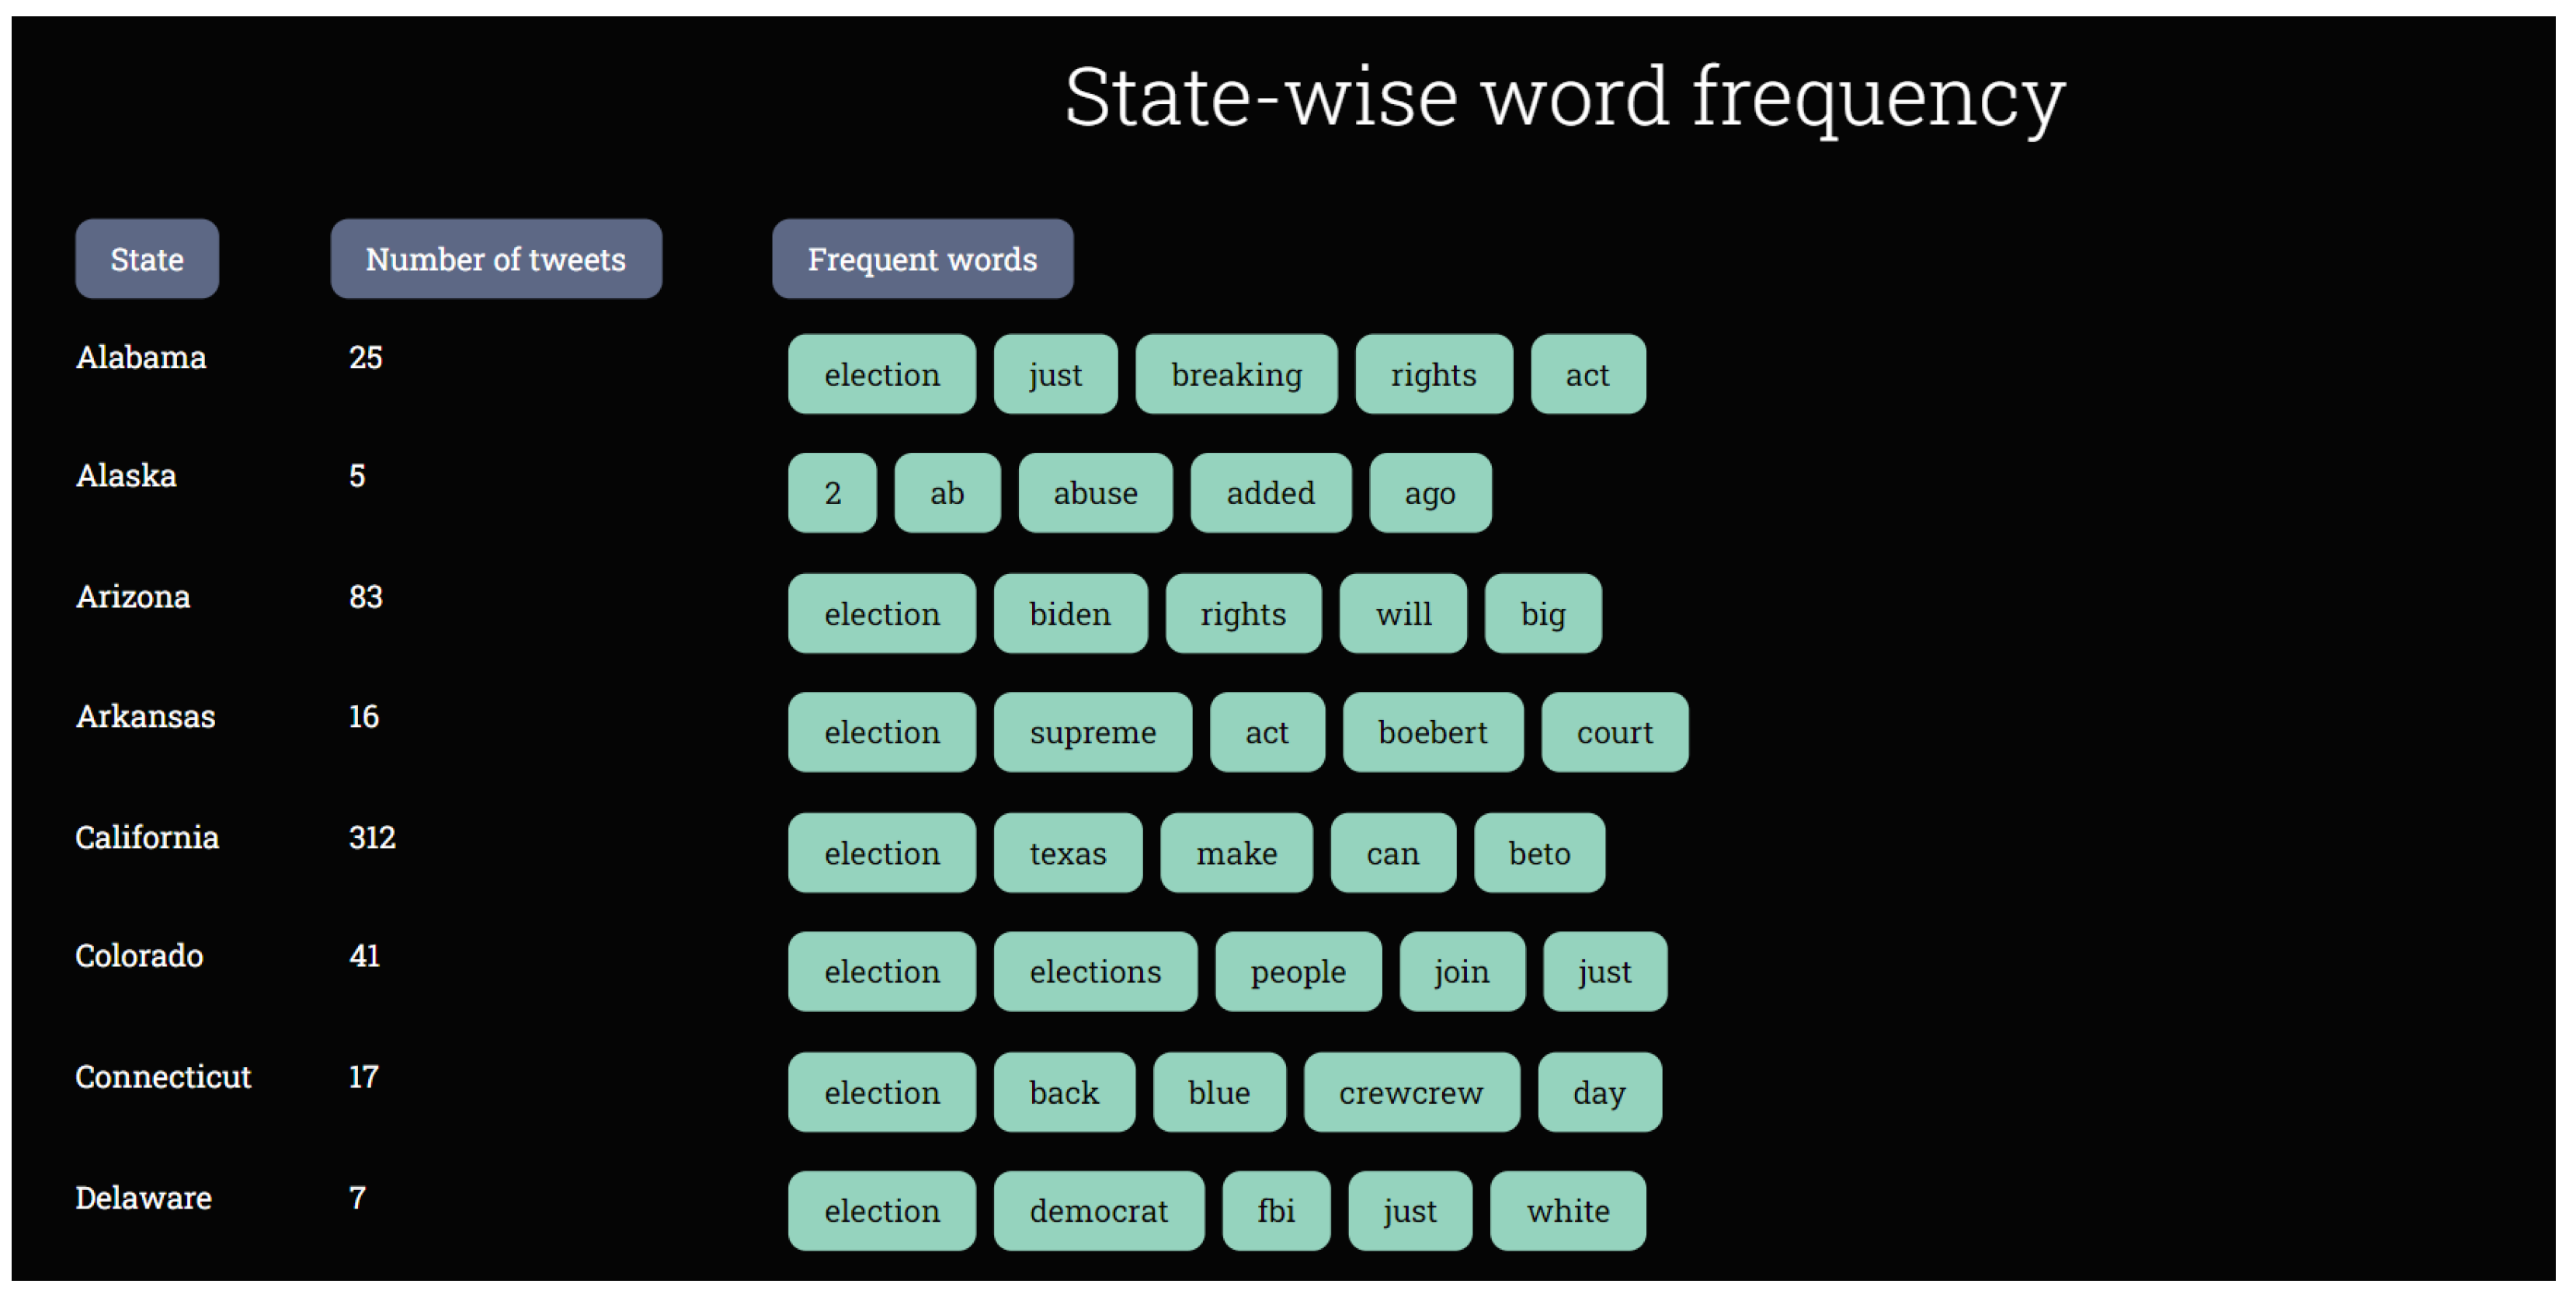
- State-wise word frequency and top 8 words: In addition to the previously mentioned display of maps, we also have 2 features that try to grasp the emotion and overall sentiment of the words with respect to their corresponding states. Firstly we have the State-wise word frequency table that takes into account the top 5 most common words from each state as shown in Figure 8. This will help us know what words are used in the tweets, and when we look at the top 5 words, we can sometimes come to a conclusion of what event(s) have happened or what emotion is being shown for that particular state. Lastly, in addition to this, we also have the display of the top 8 most frequent words overall which gives us an insight into which keywords are currently trending across the states.
5. Methodology
5.1. Keyword Selection and Analysis
- Keyword: The primary term used to filter tweets for analysis.
- Example Tweet: A representative tweet containing the keyword, illustrating the type of content analyzed.
- Time Period: The timeframe during which tweets were collected and analyzed.
- Background: A brief explanation of the societal or political context surrounding the keyword.
5.2. Machine Learning Approach
5.3. Underlying Algorithms
5.4. Choice of Tools
5.5. Data Preprocessing
- Tokenization: We broke down the text into individual words or tokens using the unnest_tokens function from the tidytext package.
- Normalization: To ensure uniformity across the dataset, all text was converted to lowercase using tm_map with the content_transformer(tolower) function.
- Stop word Removal: Common English stop words that do not carry significant meaning were removed using the removeWords function from the tm package with the stopwords(“english”) list.
5.6. Sentiment Analysis Approach
5.7. Advantages and Limitations
- Simplicity and Efficiency: It is easy to implement and computationally less intensive, making it suitable for large datasets.
- No Training Data Required: Eliminates the need for annotated datasets, which can be costly and time-consuming to produce.
- Interpretability: Provides clear mappings between words and emotions, enhancing the interpretability of results.
- Context Insensitivity: May not account for context, idioms, or colloquial expressions common in social media.
- Negation Handling: Struggles with phrases where negation alters sentiment (e.g., “not happy”).
- Sarcasm and Irony: Ineffective in detecting sarcasm or ironic statements, which can lead to misinterpretation.
5.8. Integration with Machine Learning Framework
- Automated Feature Extraction: The processes of tokenization, normalization, and stop word removal automate the extraction of relevant features from textual data, a fundamental aspect of machine learning pipelines.
- Scalability and Efficiency: Managing over 3 million tweets requires an approach that is both scalable and efficient, characteristics inherent to many machine learning algorithms.
- Data-Driven Insights: Aggregating and normalizing sentiment scores across different states facilitates data-driven decision-making and insights, a core objective in machine learning applications.
- Potential for Future ML Integration: The structured sentiment scores and emotional categorizations can serve as input features for more complex supervised or unsupervised machine learning models, such as clustering or classification algorithms, enhancing the depth of analysis.
6. Cache Techniques Analysis
6.1. Cache Metrics Explanation
6.1.1. Hit Count
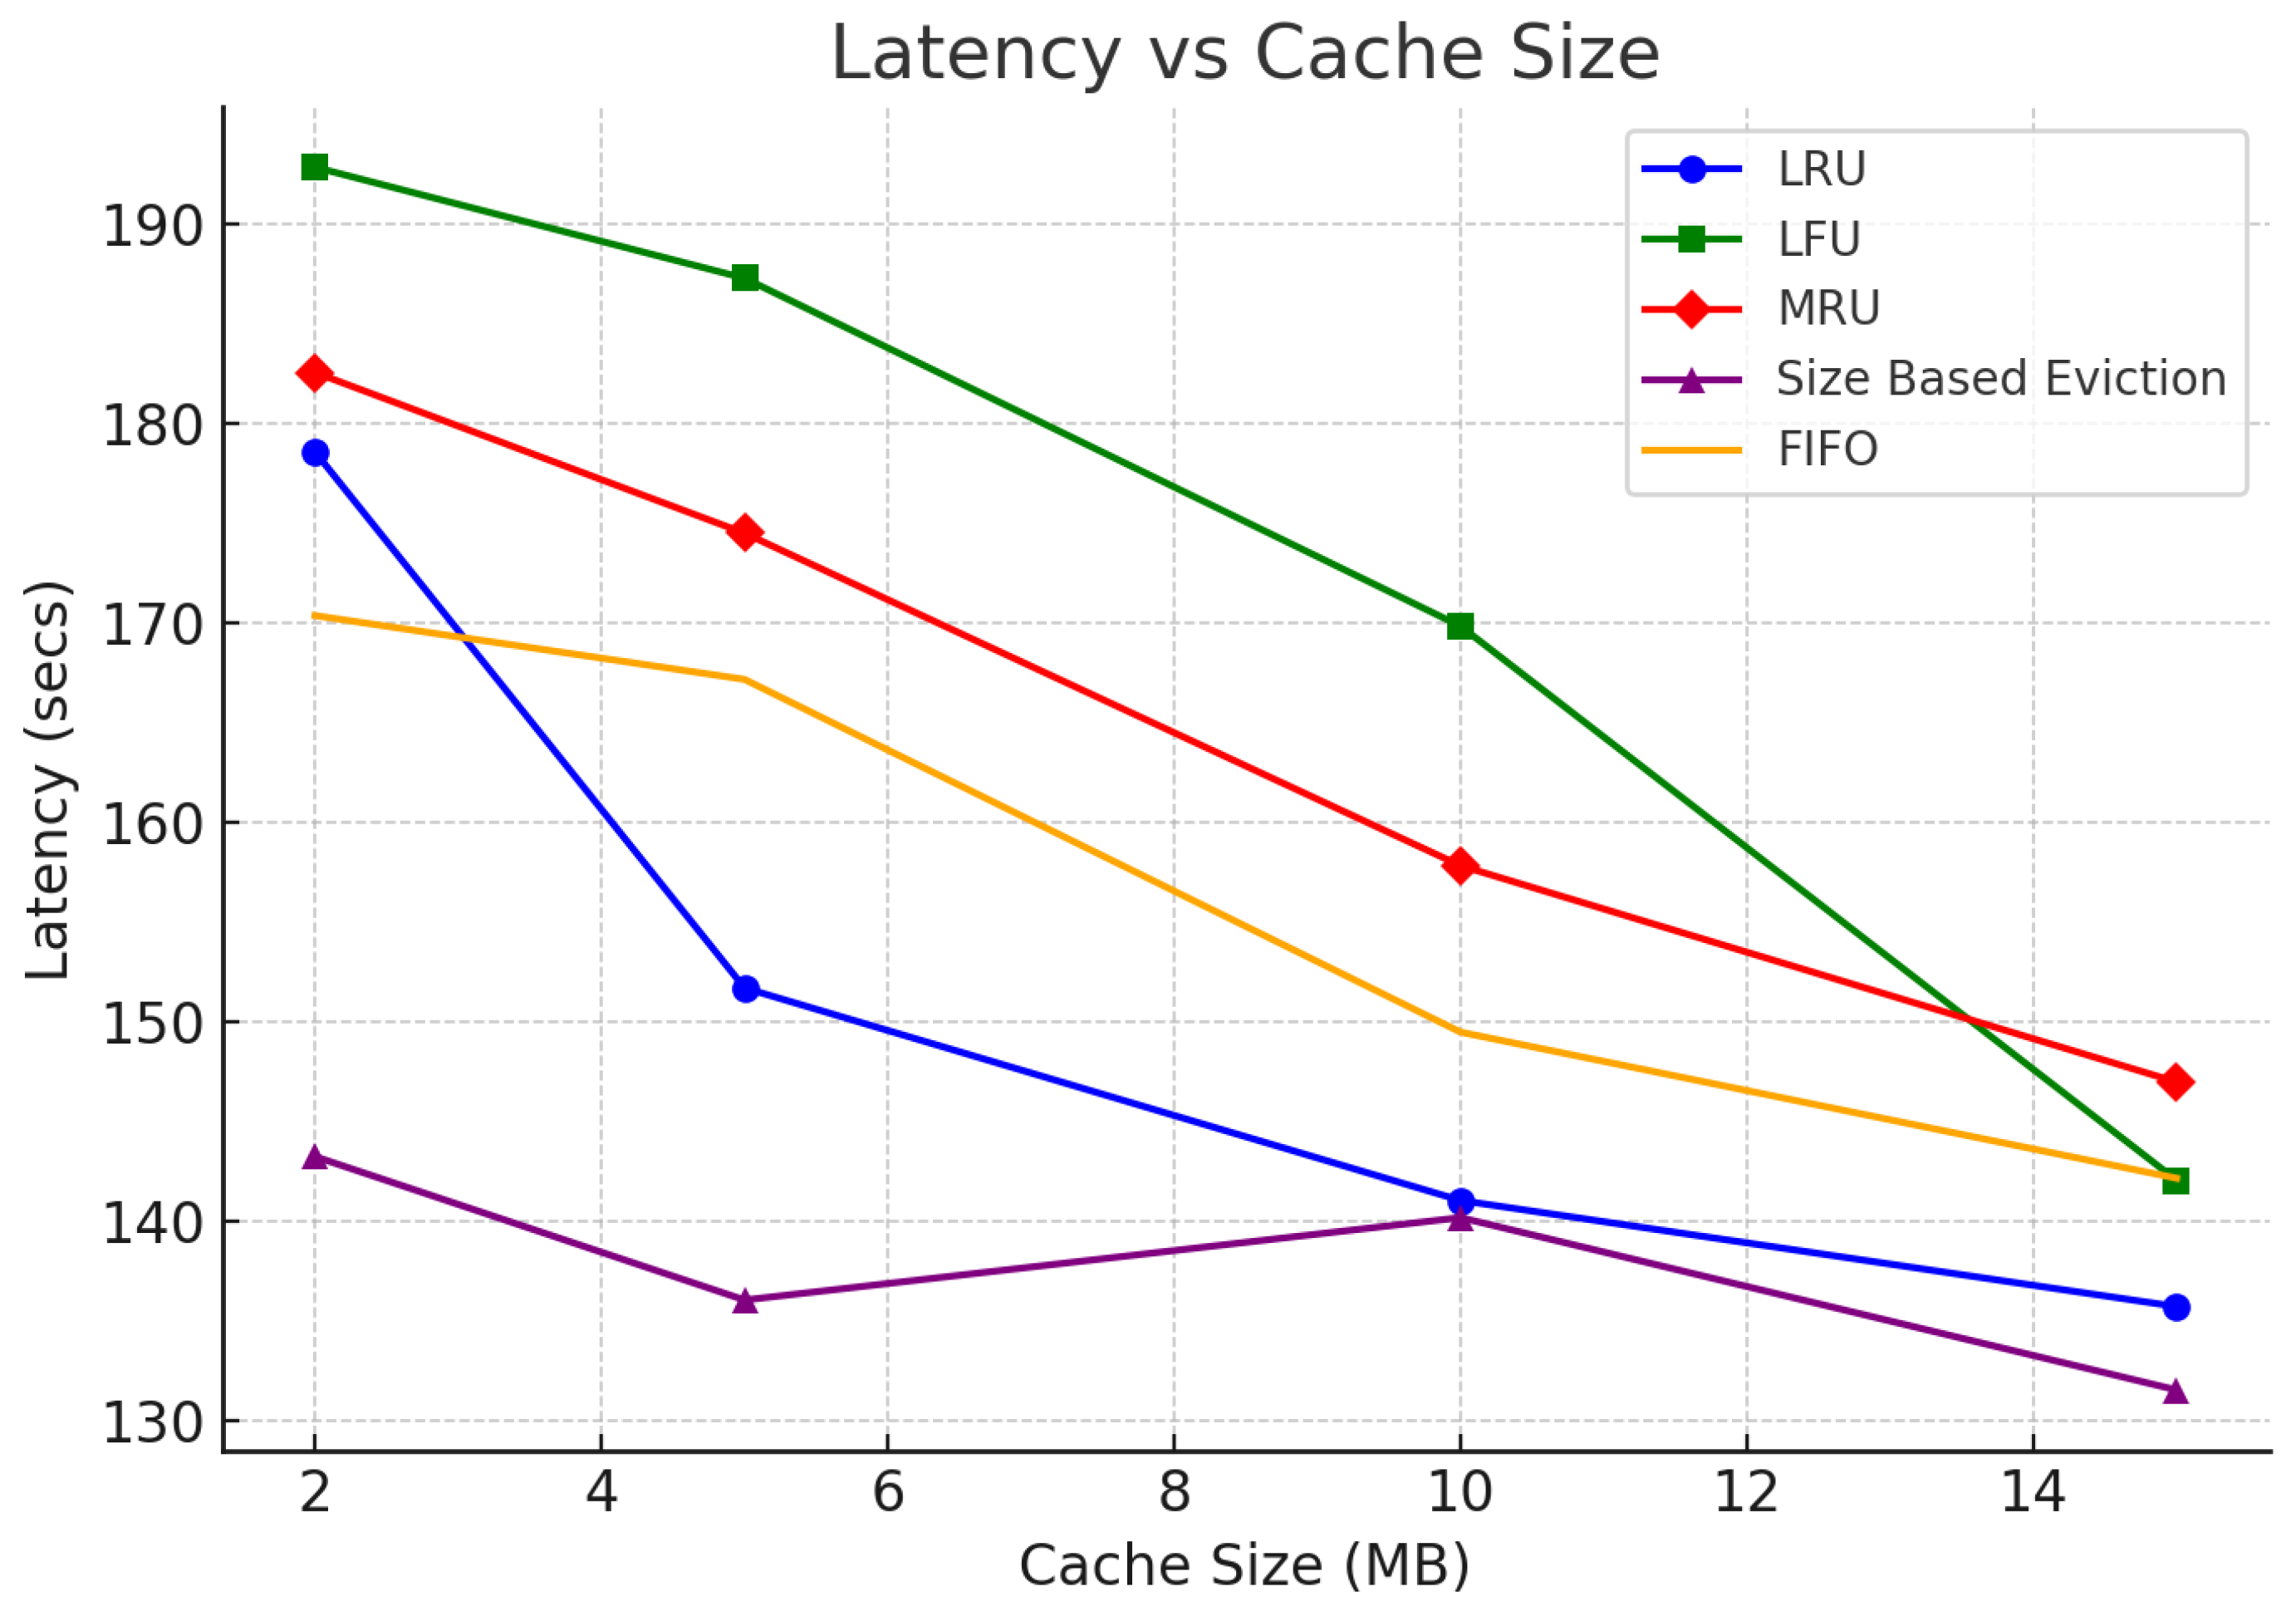
6.1.2. Latency
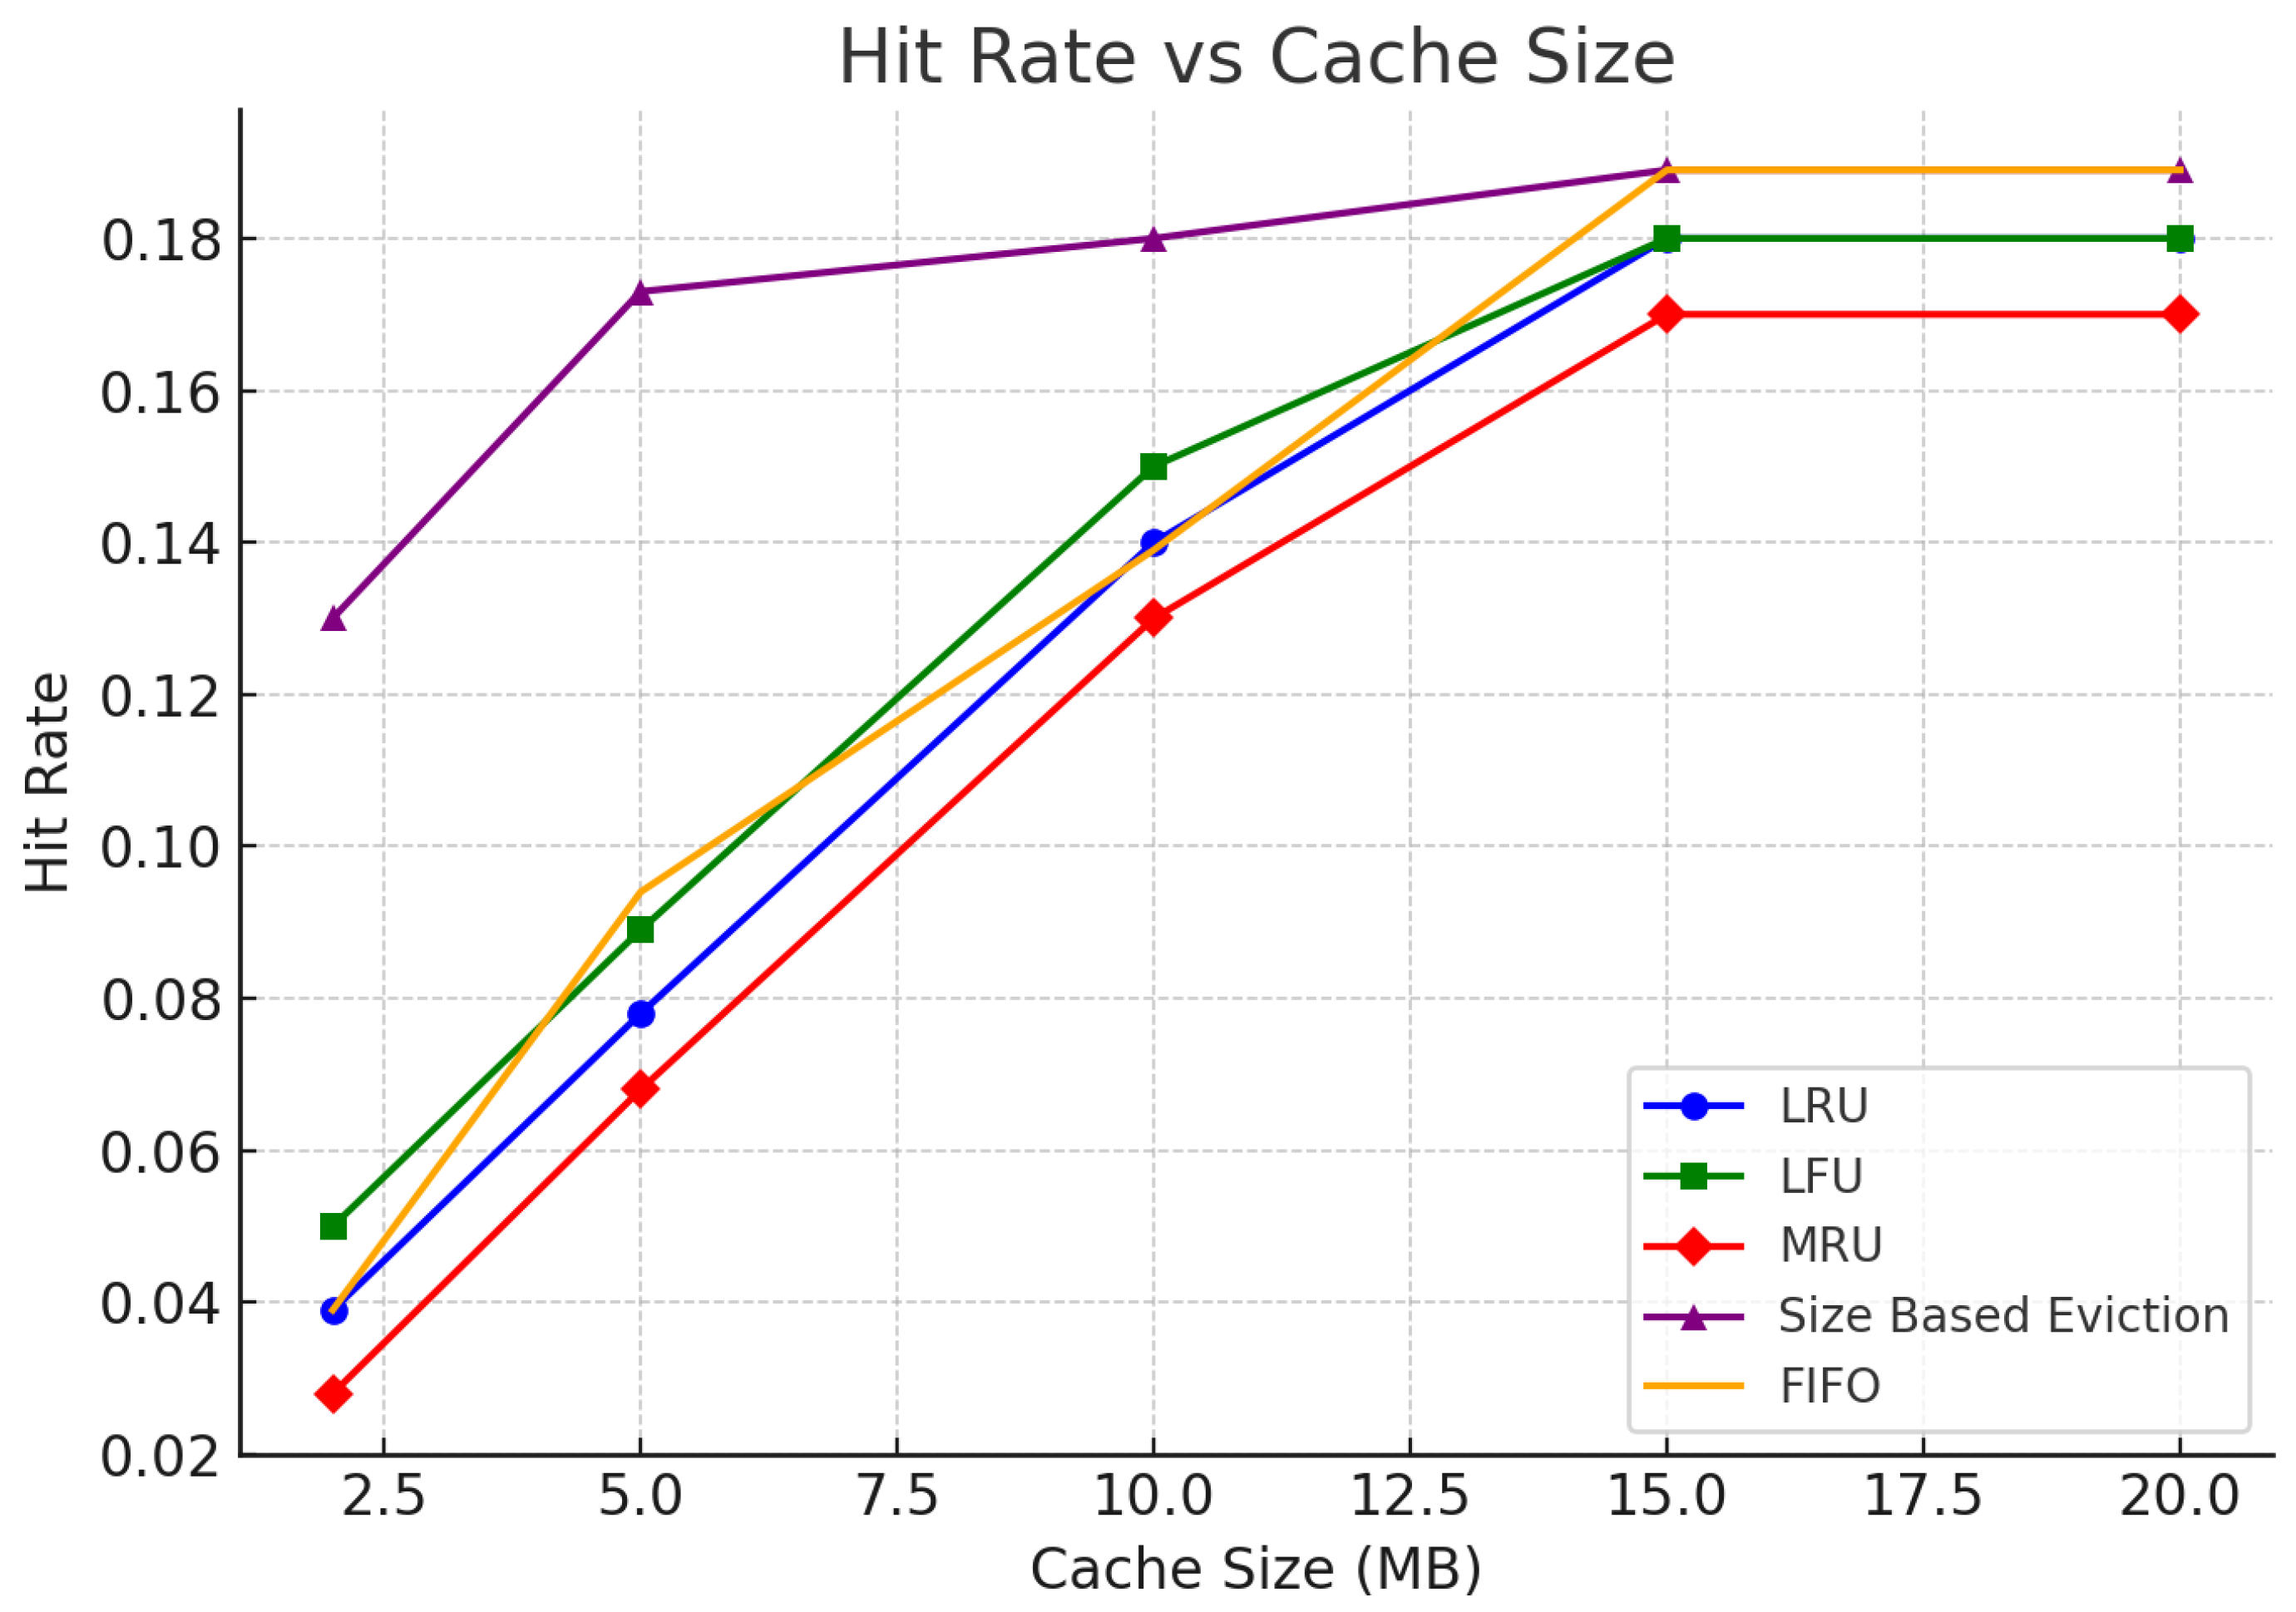
6.1.3. Hit Rate
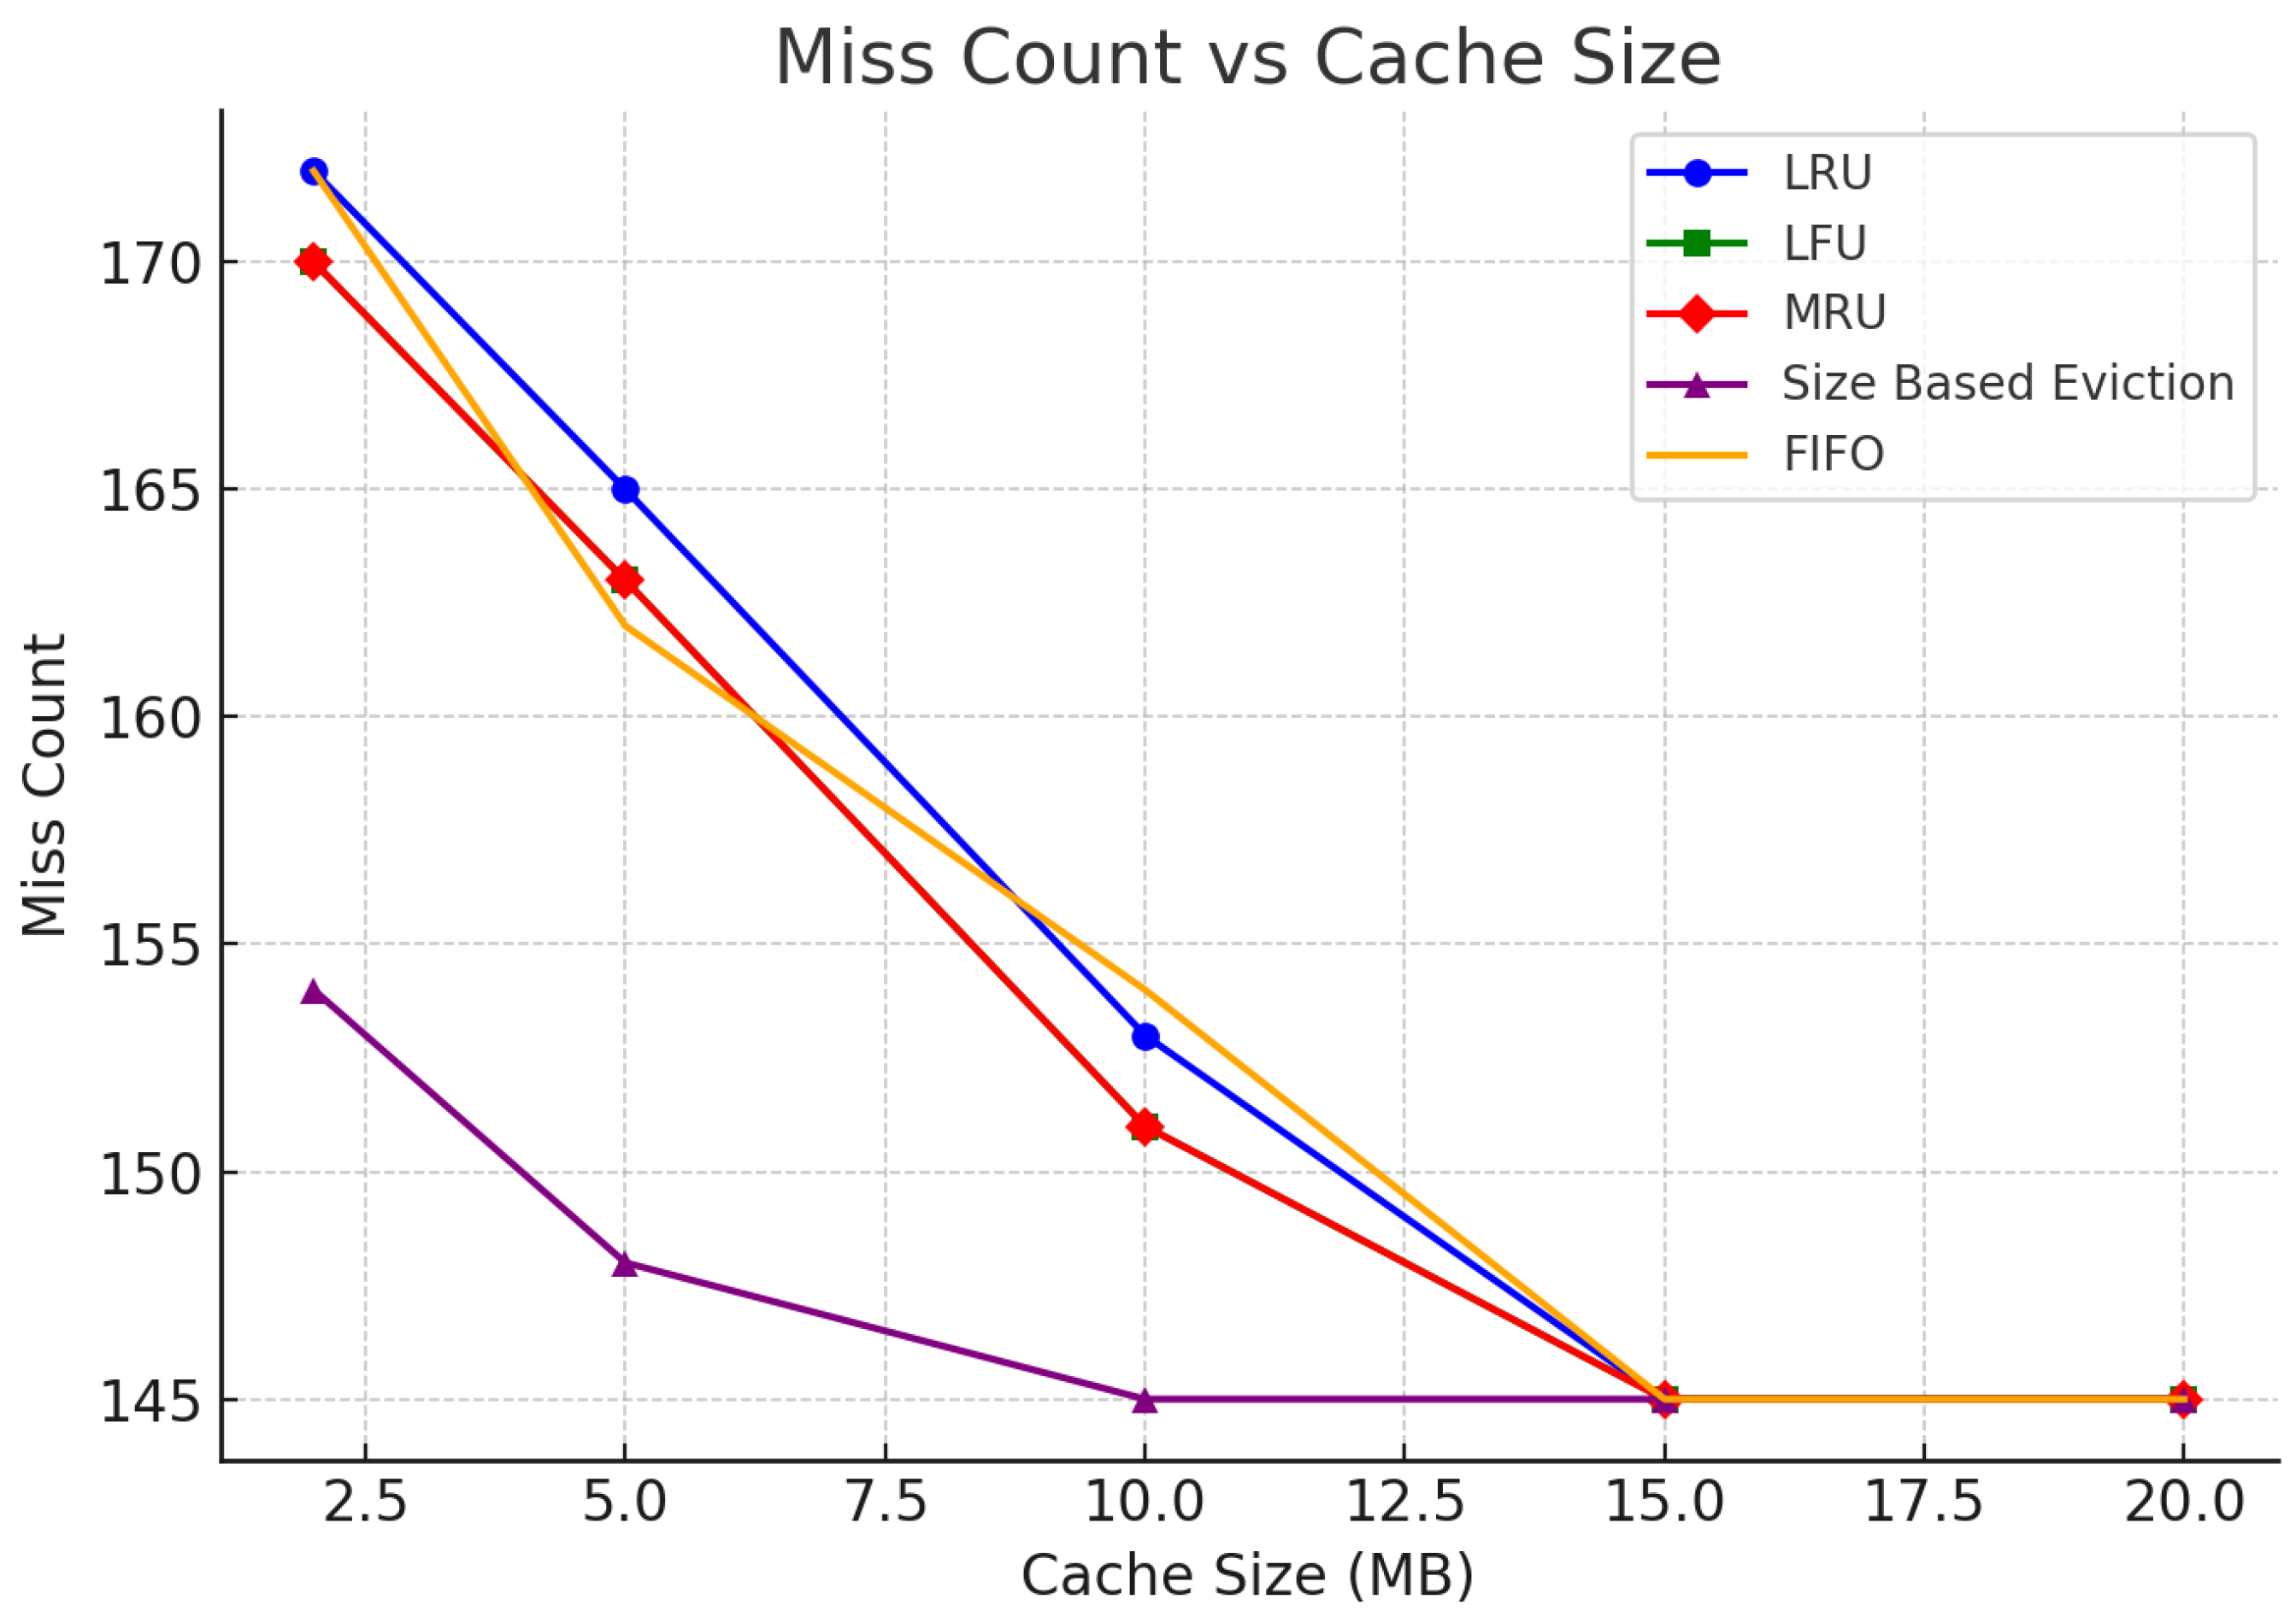
6.1.4. Miss Count
6.1.5. Removal Count
6.2. Discussion
6.2.1. Impact of Search Queries on Cache Analysis
6.2.2. Effect of Date Ranges on Cache Efficiency
6.2.3. Analysis of Unique Search Terms
6.3. Latency with and Without Cache
6.4. Sentiment Scores for Different Emotions
6.5. Summary
- Best Performers: Size-Based Eviction and LRU emerge as the best caching strategies for this project. Both techniques handle repeated queries and overlapping date ranges efficiently, leading to higher hit rates and lower cache misses. Size-Based Eviction, in particular, is highly efficient due to the small size of search terms.
- Worst Performers: MRU and FIFO are less efficient for repeated queries, overlapping dates, and unique search terms. These techniques lead to higher miss rates and don’t leverage the frequency or recency of the data effectively.
7. Results
7.1. Emotional Breakdown and State-Wise Sentiment
7.2. Dominant Emotion Mapping
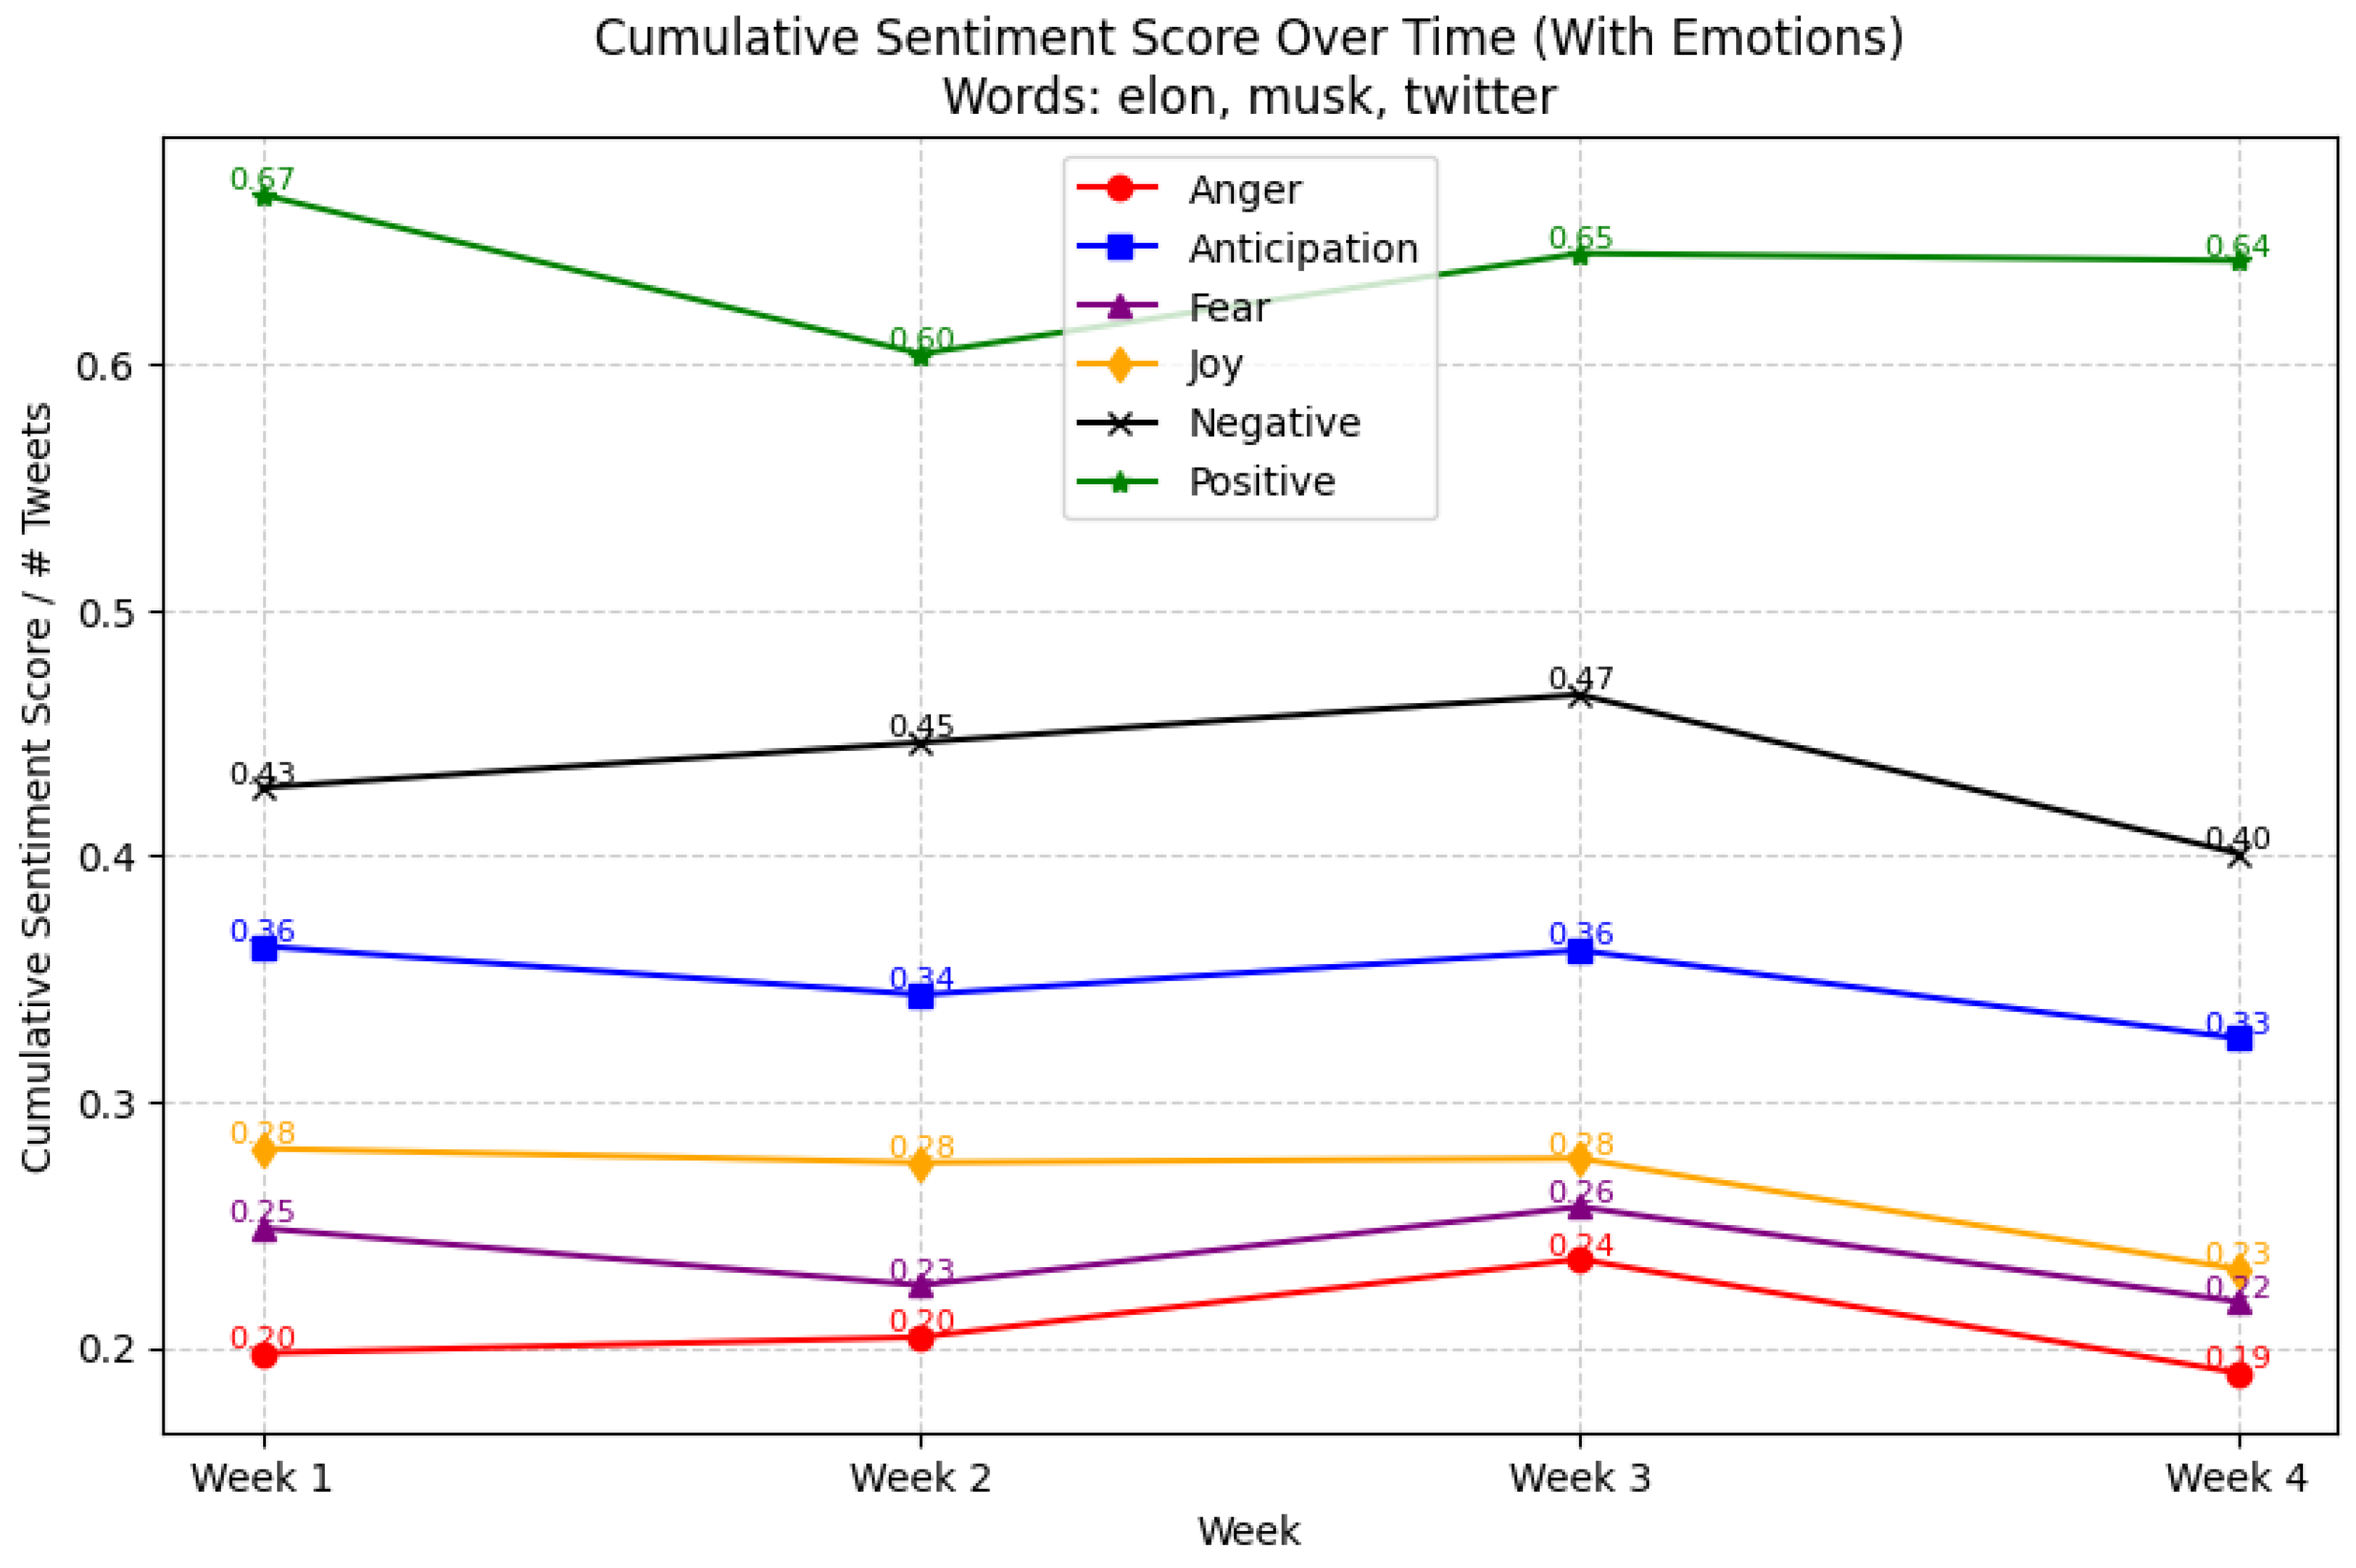
7.3. Sentiment Trends over Time
7.4. Keyword-Specific Sentiment
7.5. Scalability and Limitations
7.5.1. Scalability
7.5.2. Limitations
8. Applications of Findings in Real-World Scenarios
8.1. Policymaking
8.2. Marketing and Business Strategy
8.3. Public Health Campaigns
8.4. Value for Stakeholders
- Government officials can monitor public sentiment to adjust policies and communication strategies based on real-time feedback.
- Companies and marketers can optimize their marketing strategies, tailor customer engagement, and anticipate potential issues based on consumer sentiment.
- Researchers and social scientists can use sentiment data to study social behaviors, trends, and emotional responses to various societal events, helping to predict future shifts in public opinion.
9. Conclusions and Future Work
Author Contributions
Funding
Institutional Review Board Statement
Informed Consent Statement
Data Availability Statement
Conflicts of Interest
Abbreviations
| LRU | Least Recently Used |
| LFU | Least Frequently Used |
| MRU | Most Recently Used |
| FIFO | First-In-First-Out |
| GSAF | Generalized Sentiment Analytics Framework |
| NLP | Natural Language Processing |
| SaaS | Software as a Service |
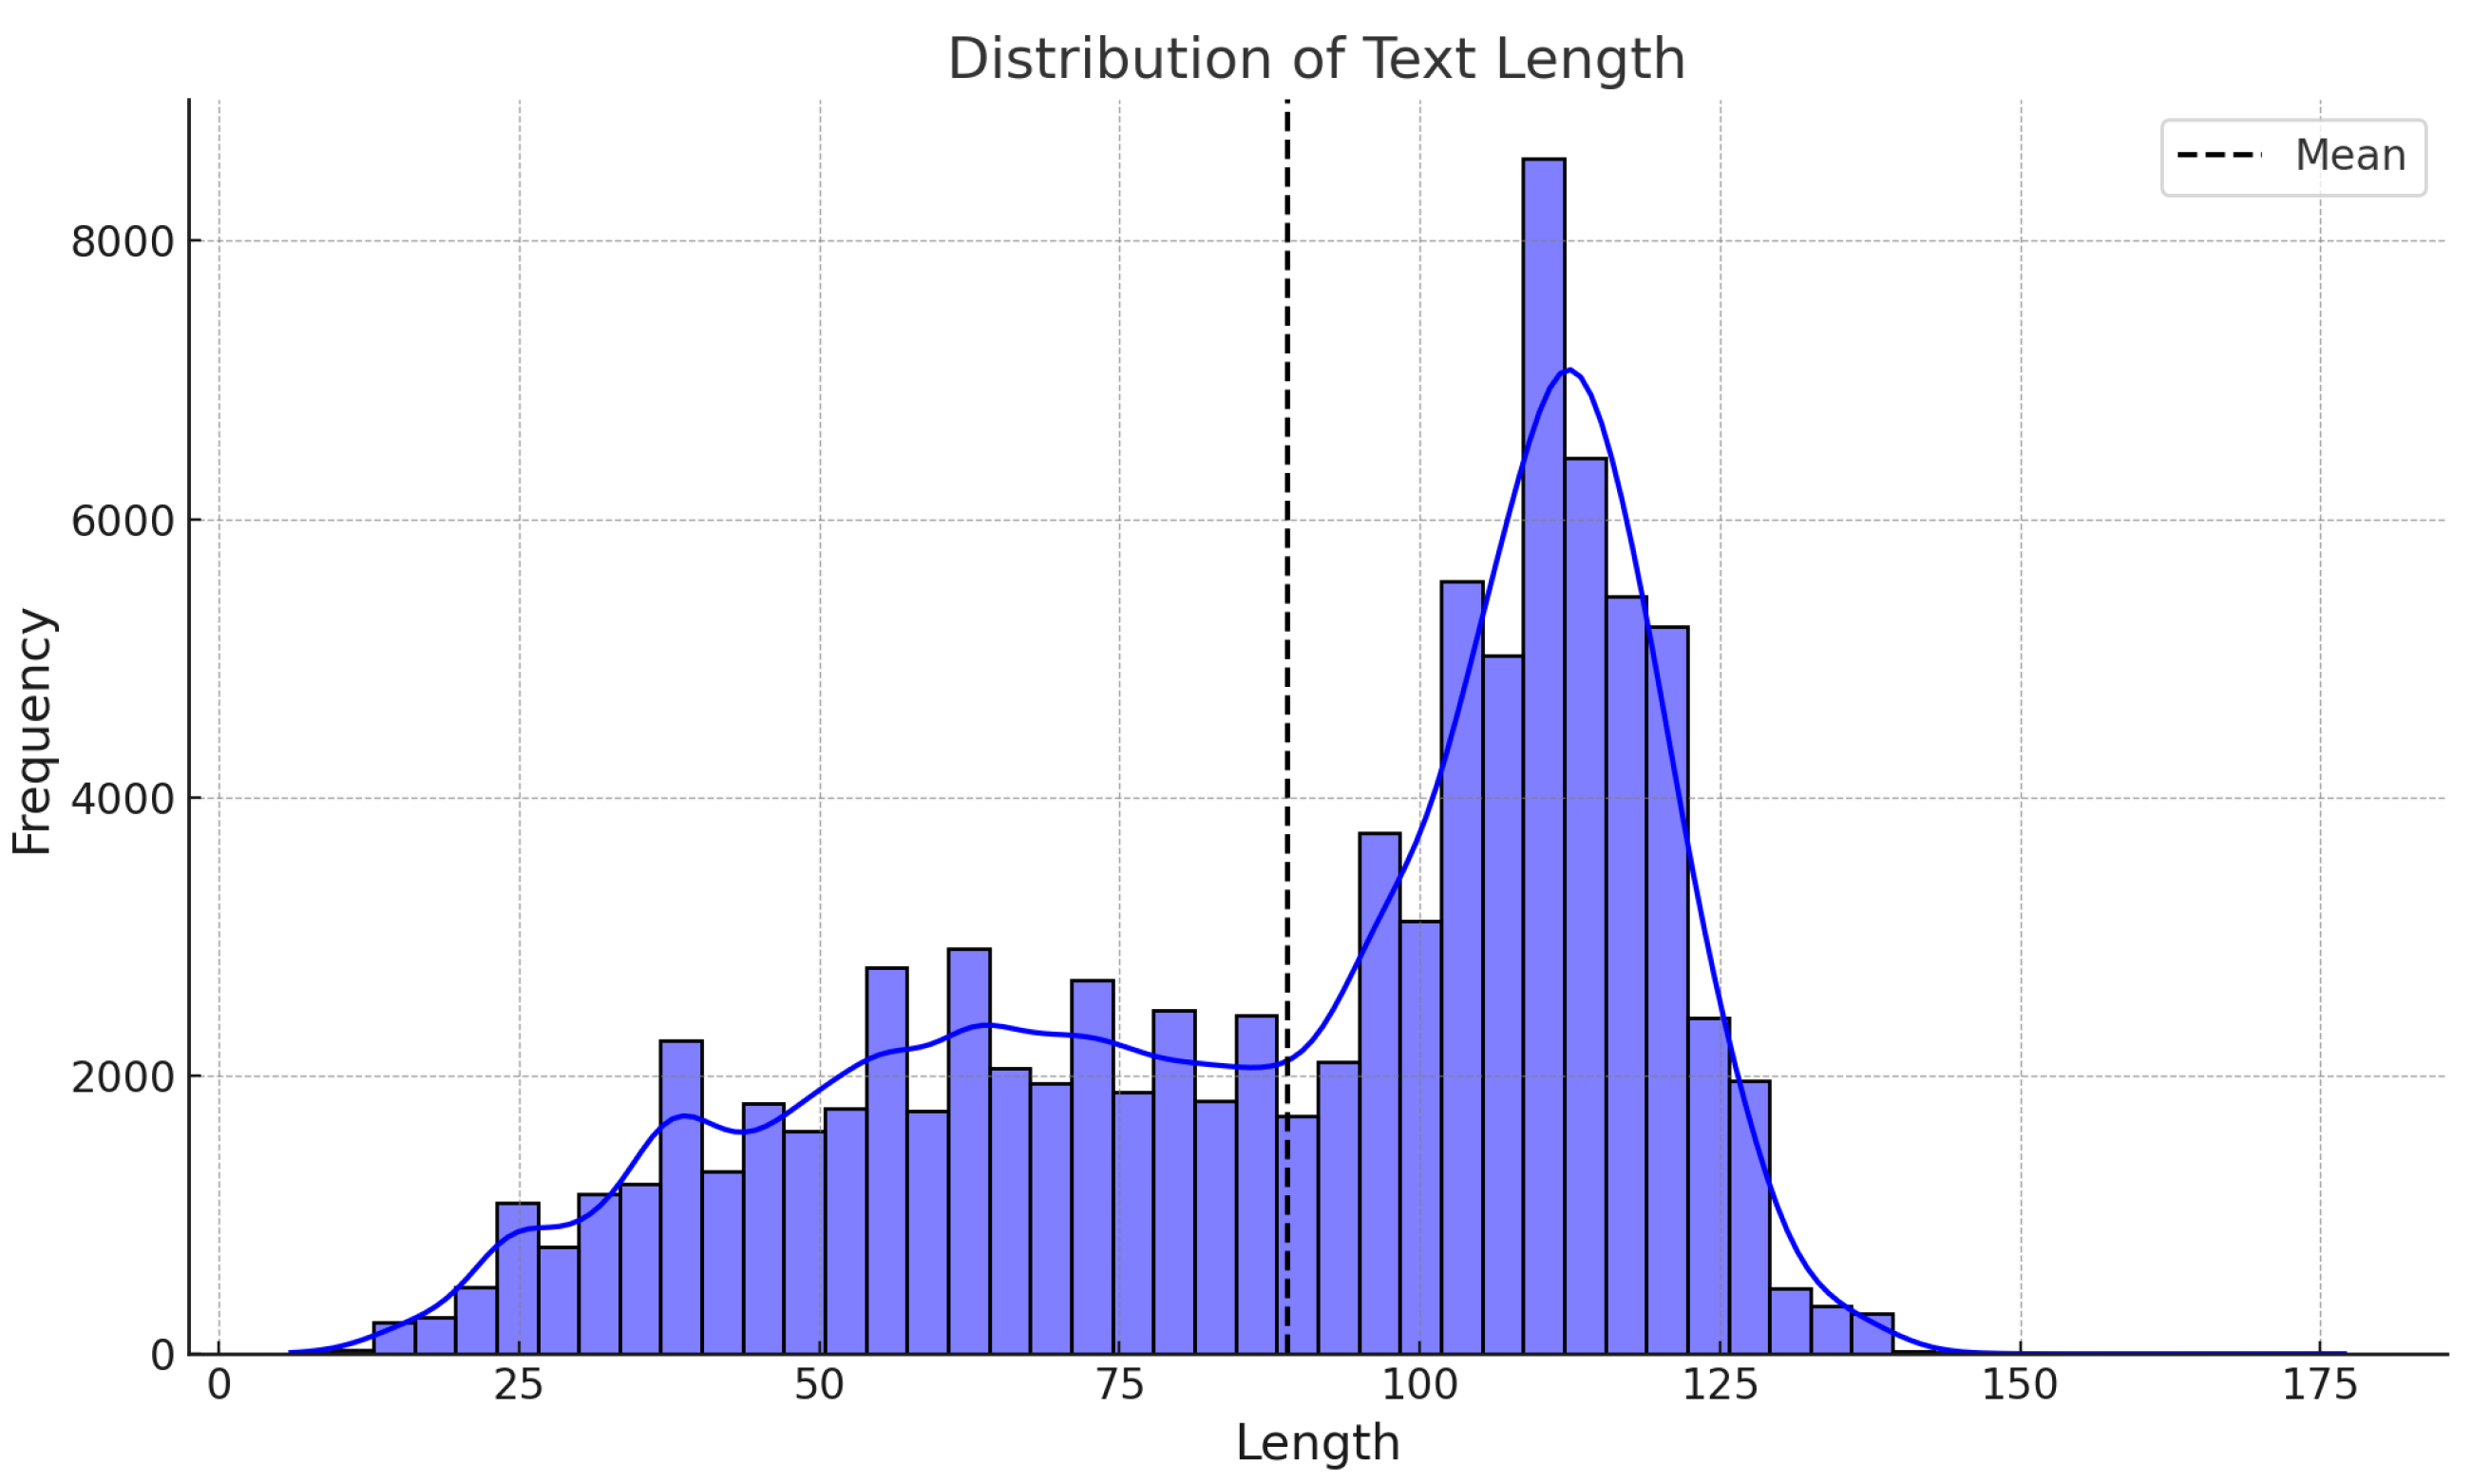
Appendix A. Exploratory Data Analysis
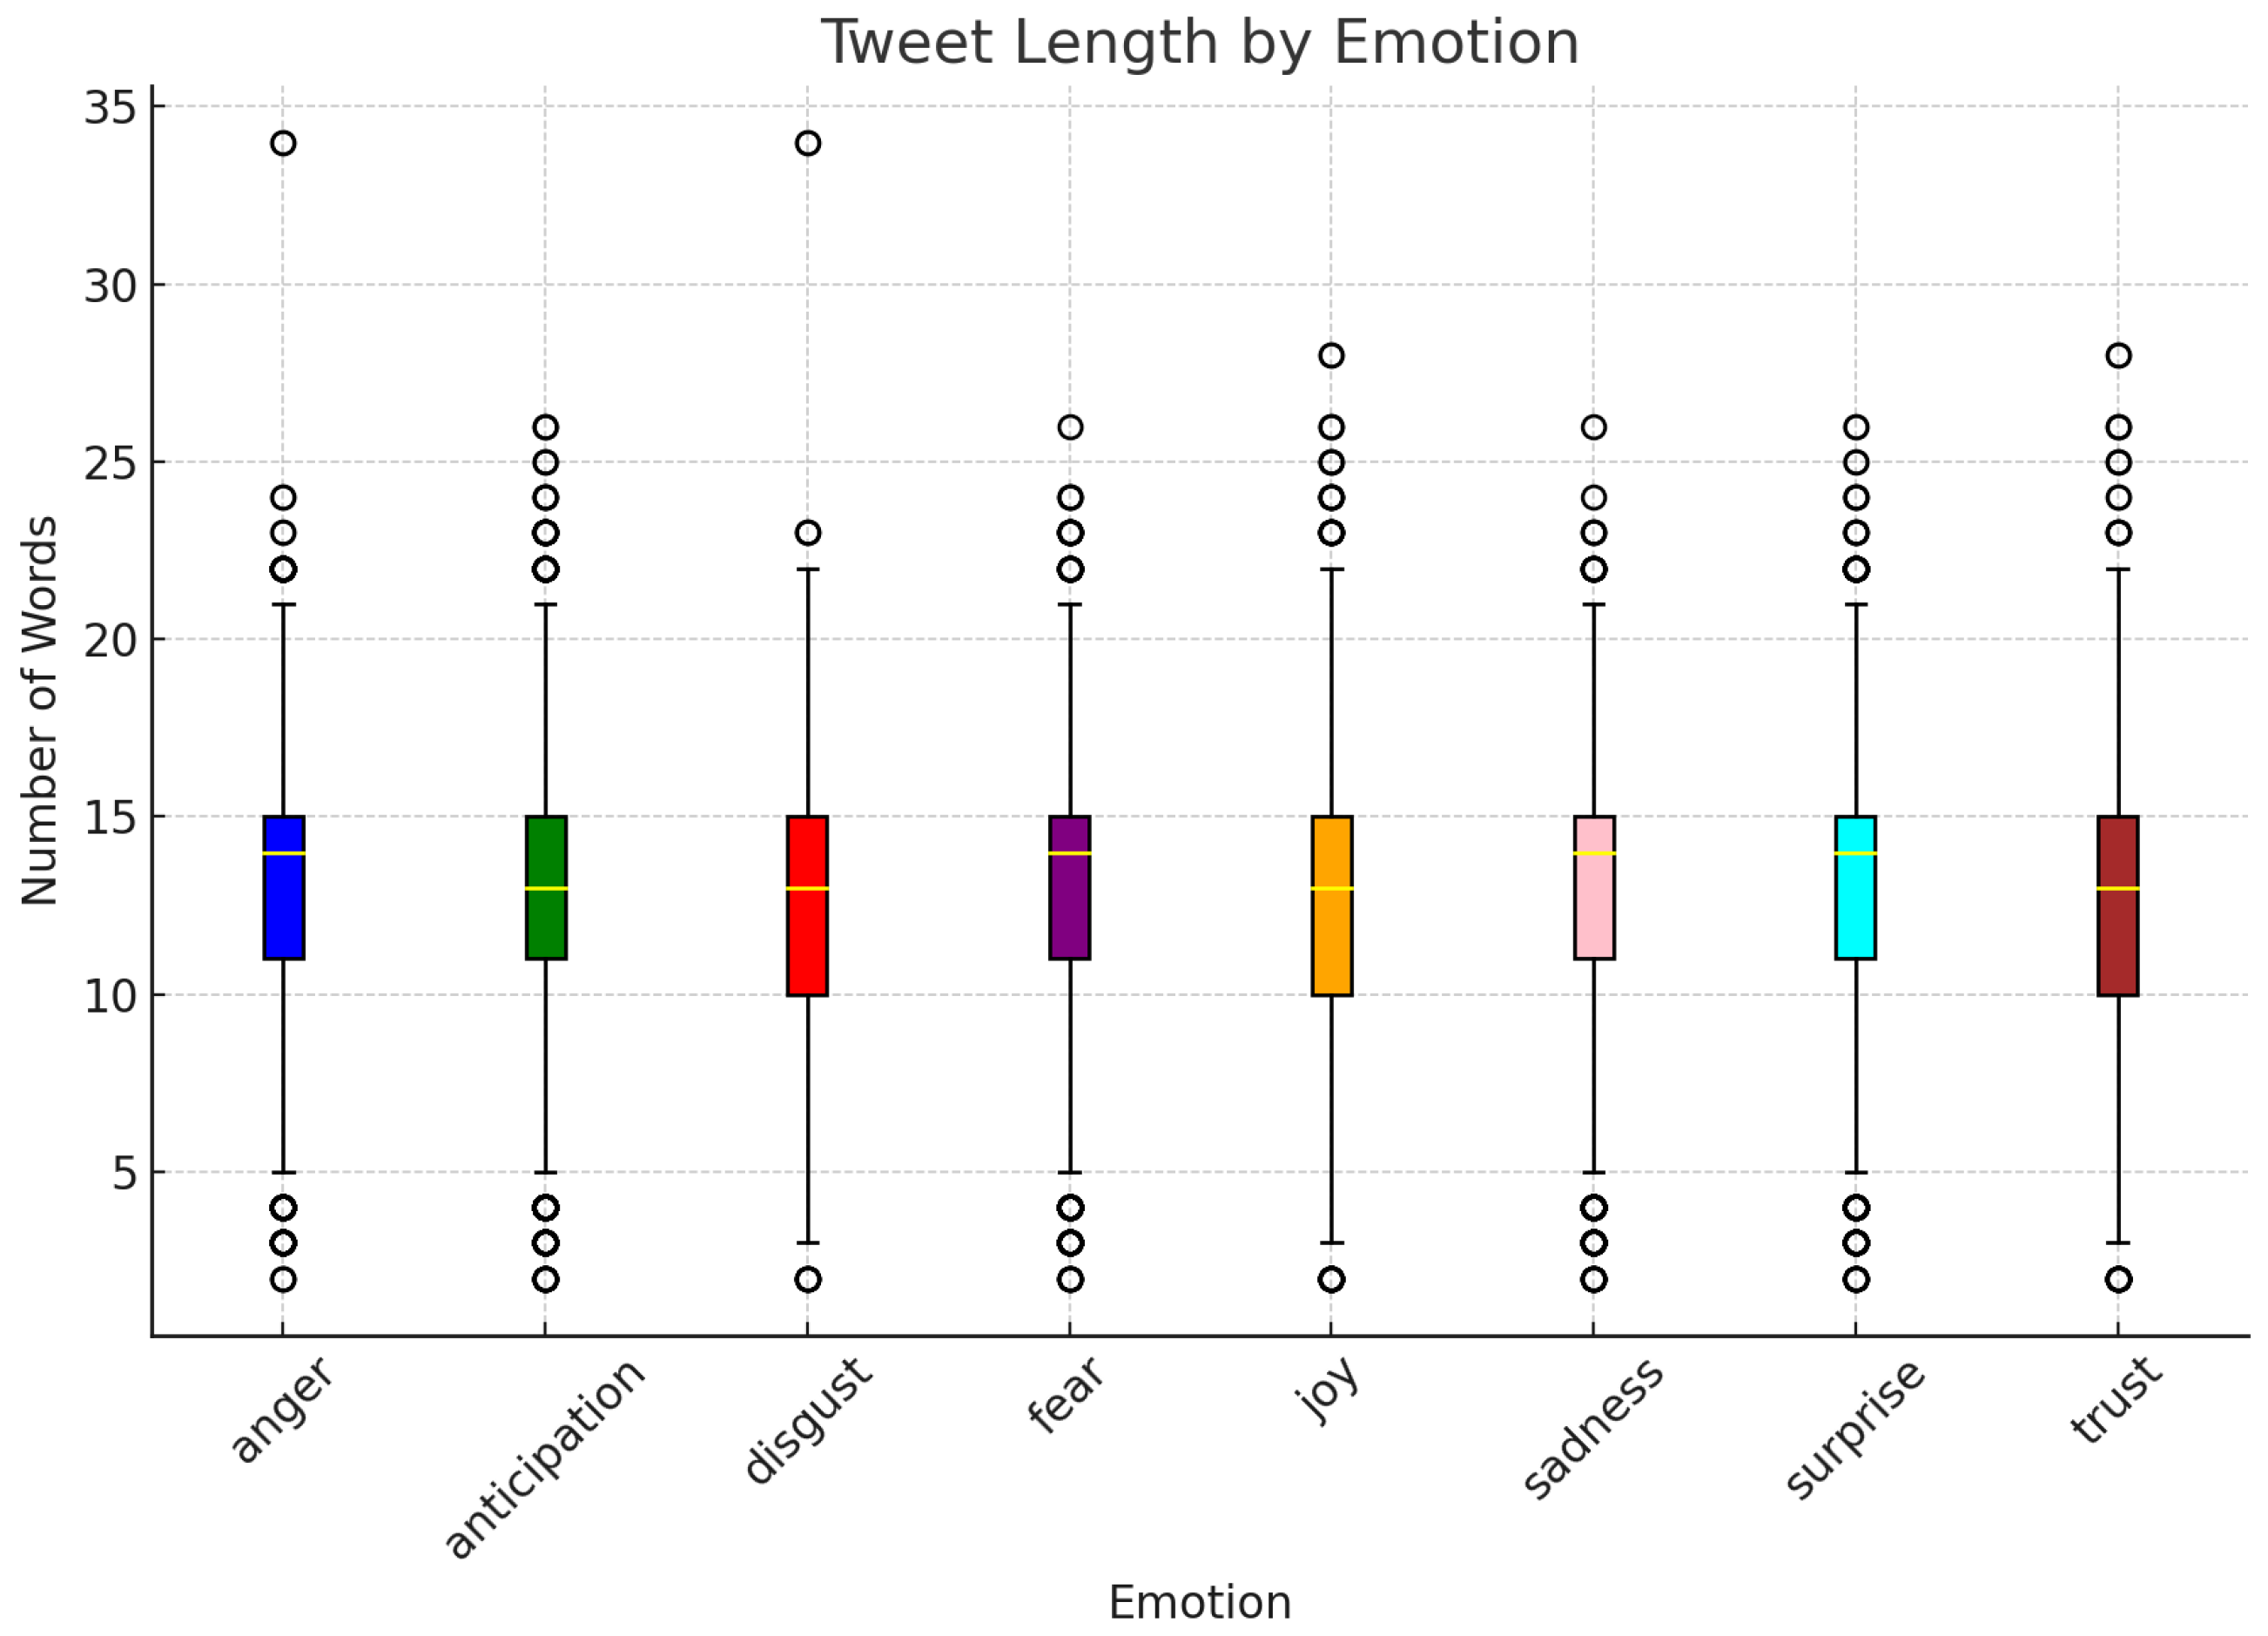
Appendix A.1. Tweet Length vs. Emotion
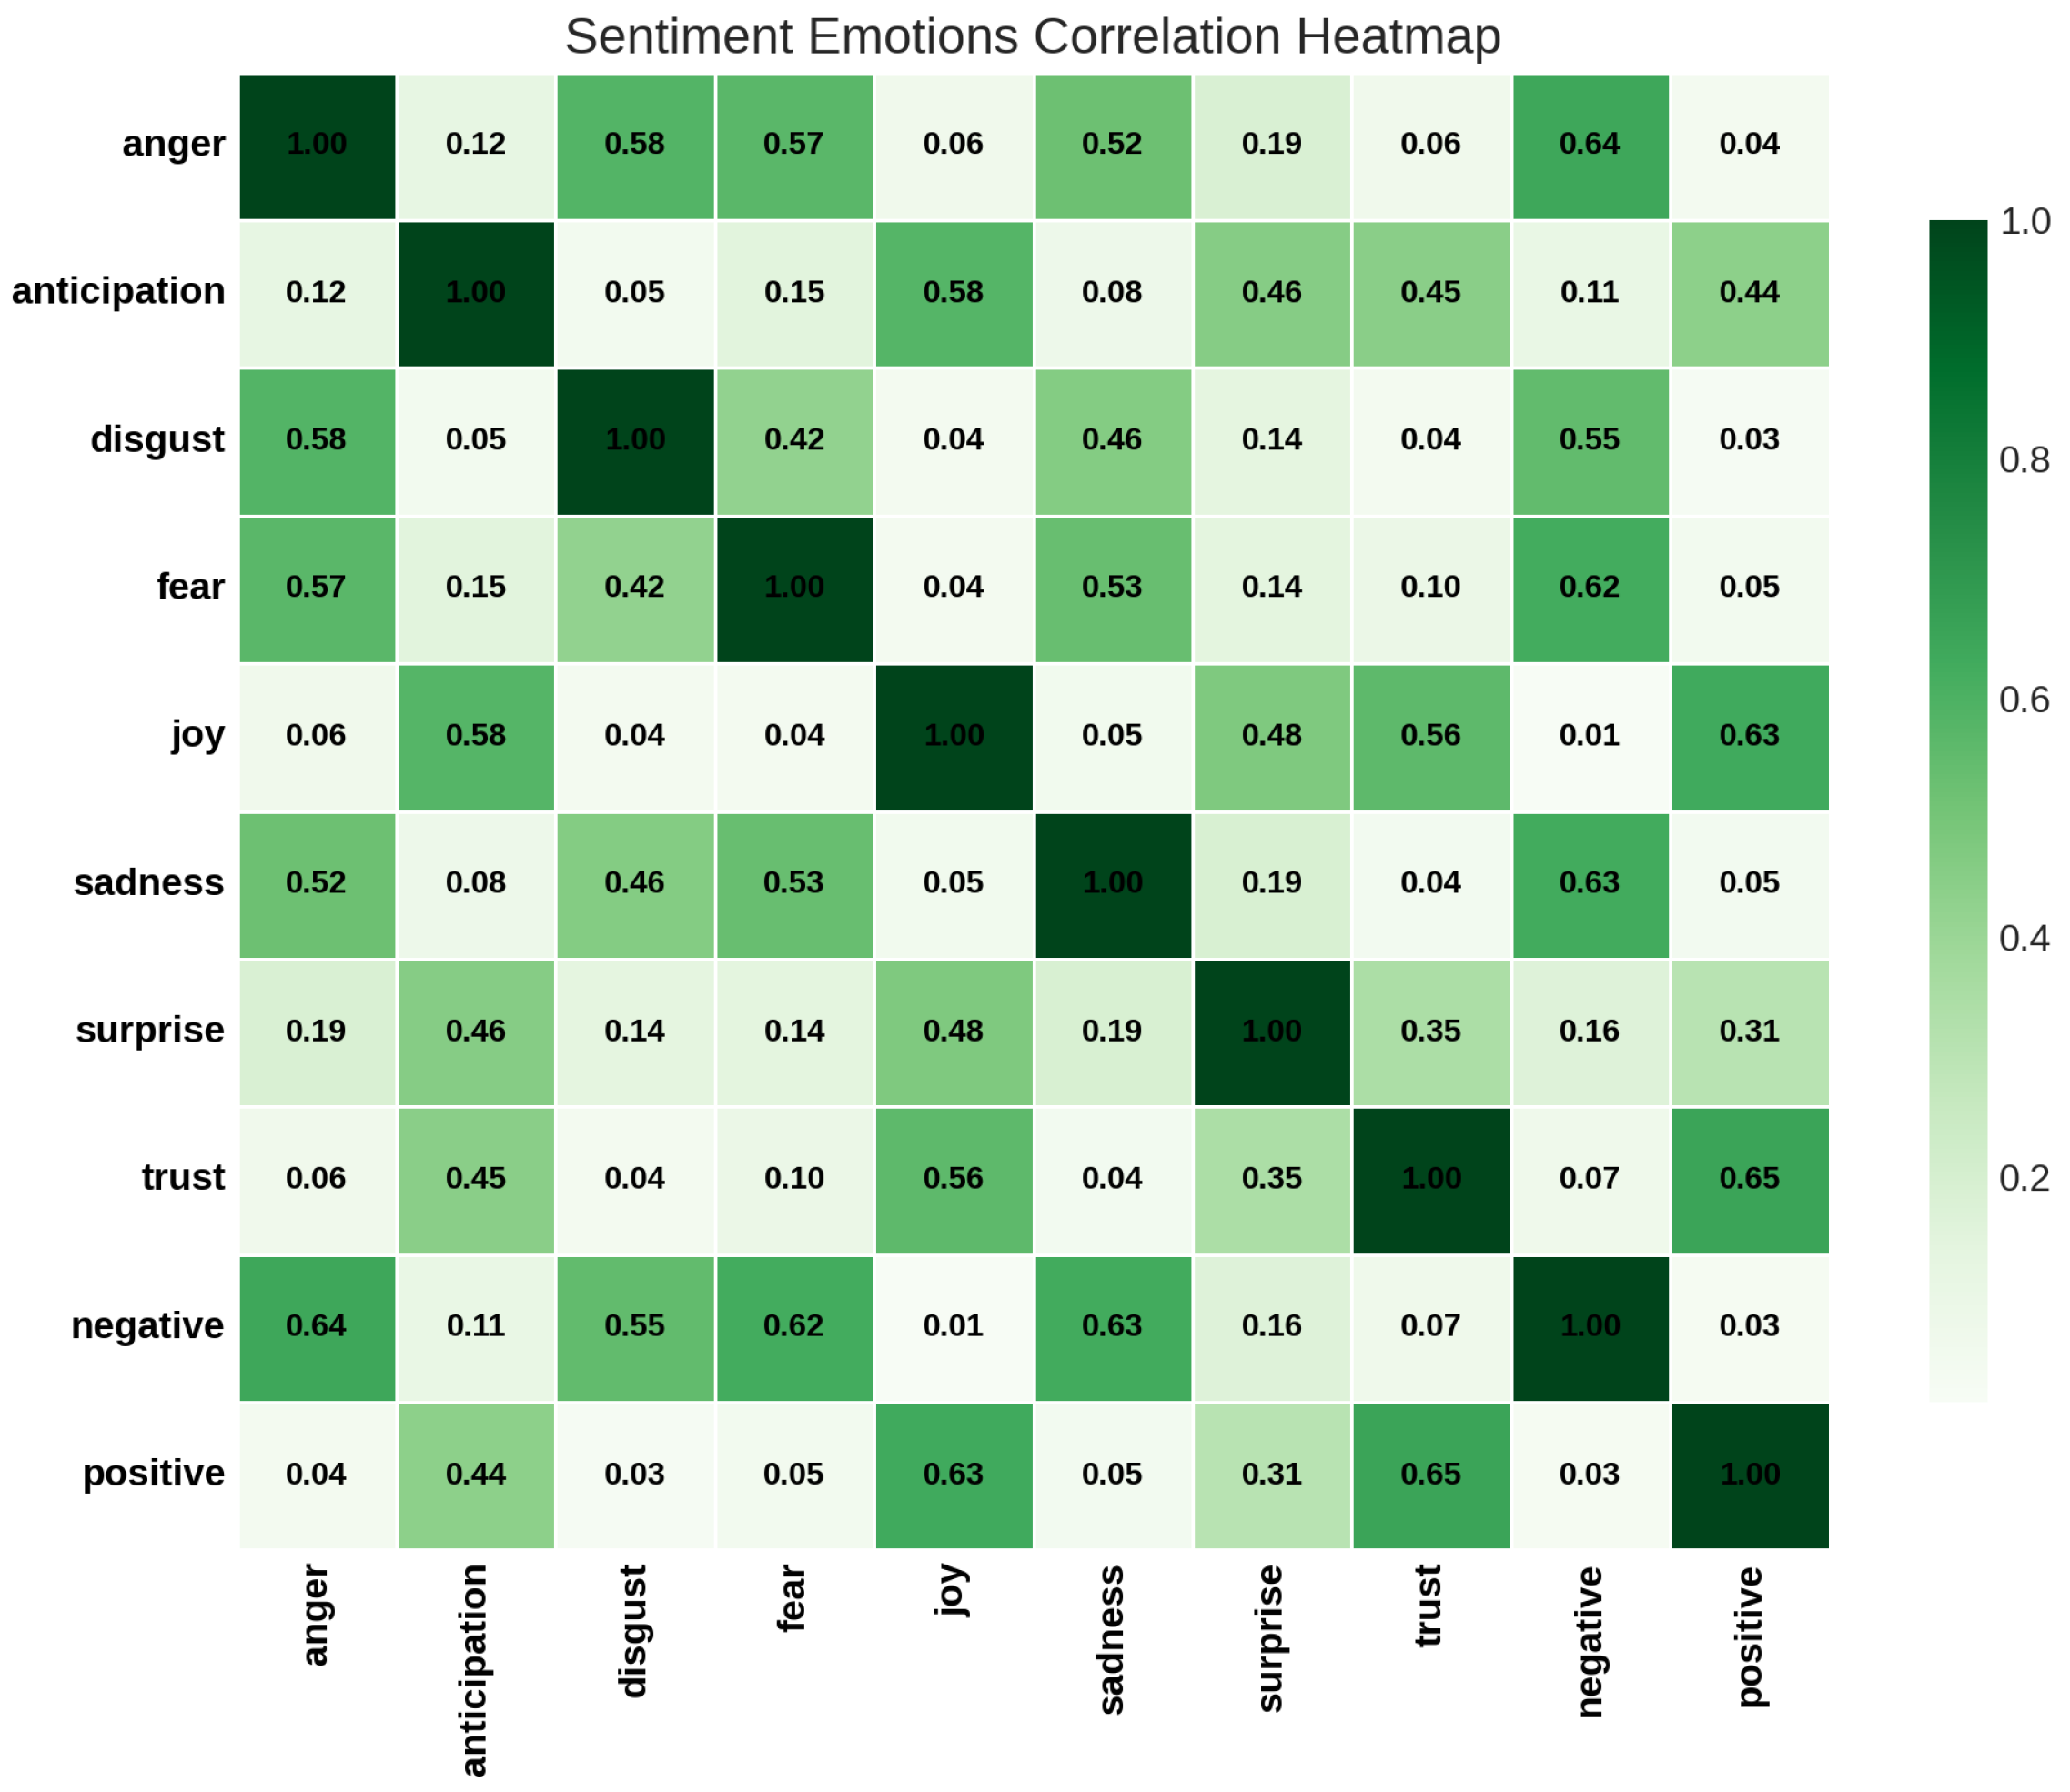
Appendix A.2. Correlation of Emotions
- Strong correlations between negative emotions like anger, fear, and sadness.
- Positive emotions such as joy and trust show a significant correlation, reflecting their shared influence in optimistic tweets.
Appendix A.3. Insights from Correlations
- Strong Correlation Among Negative Emotions:
- -
- Anger, Fear, and Sadness: These emotions show a strong positive correlation, as they often co-occur in tweets expressing distress, frustration, or negativity. For instance, tweets about tragic events may evoke both sadness and fear simultaneously.
- -
- Disgust and Anger: Disgust is highly correlated with anger, reflecting the overlap in contexts where individuals express moral outrage or aversion.
- Positive Emotion Interconnections:
- -
- Joy and Trust: A strong positive correlation exists between these emotions, likely because they are associated with optimistic or hopeful tweets. For example, joyful tweets often convey trust in others or in a situation, such as during celebrations or positive announcements.
- Emotion Intensities and Polarization:
- -
- The correlation between negative and positive emotions is very low (near zero), highlighting the distinct contexts in which these emotions occur. This suggests that tweets are typically polarized—either expressing strong negativity or positivity, rather than a mix of both.
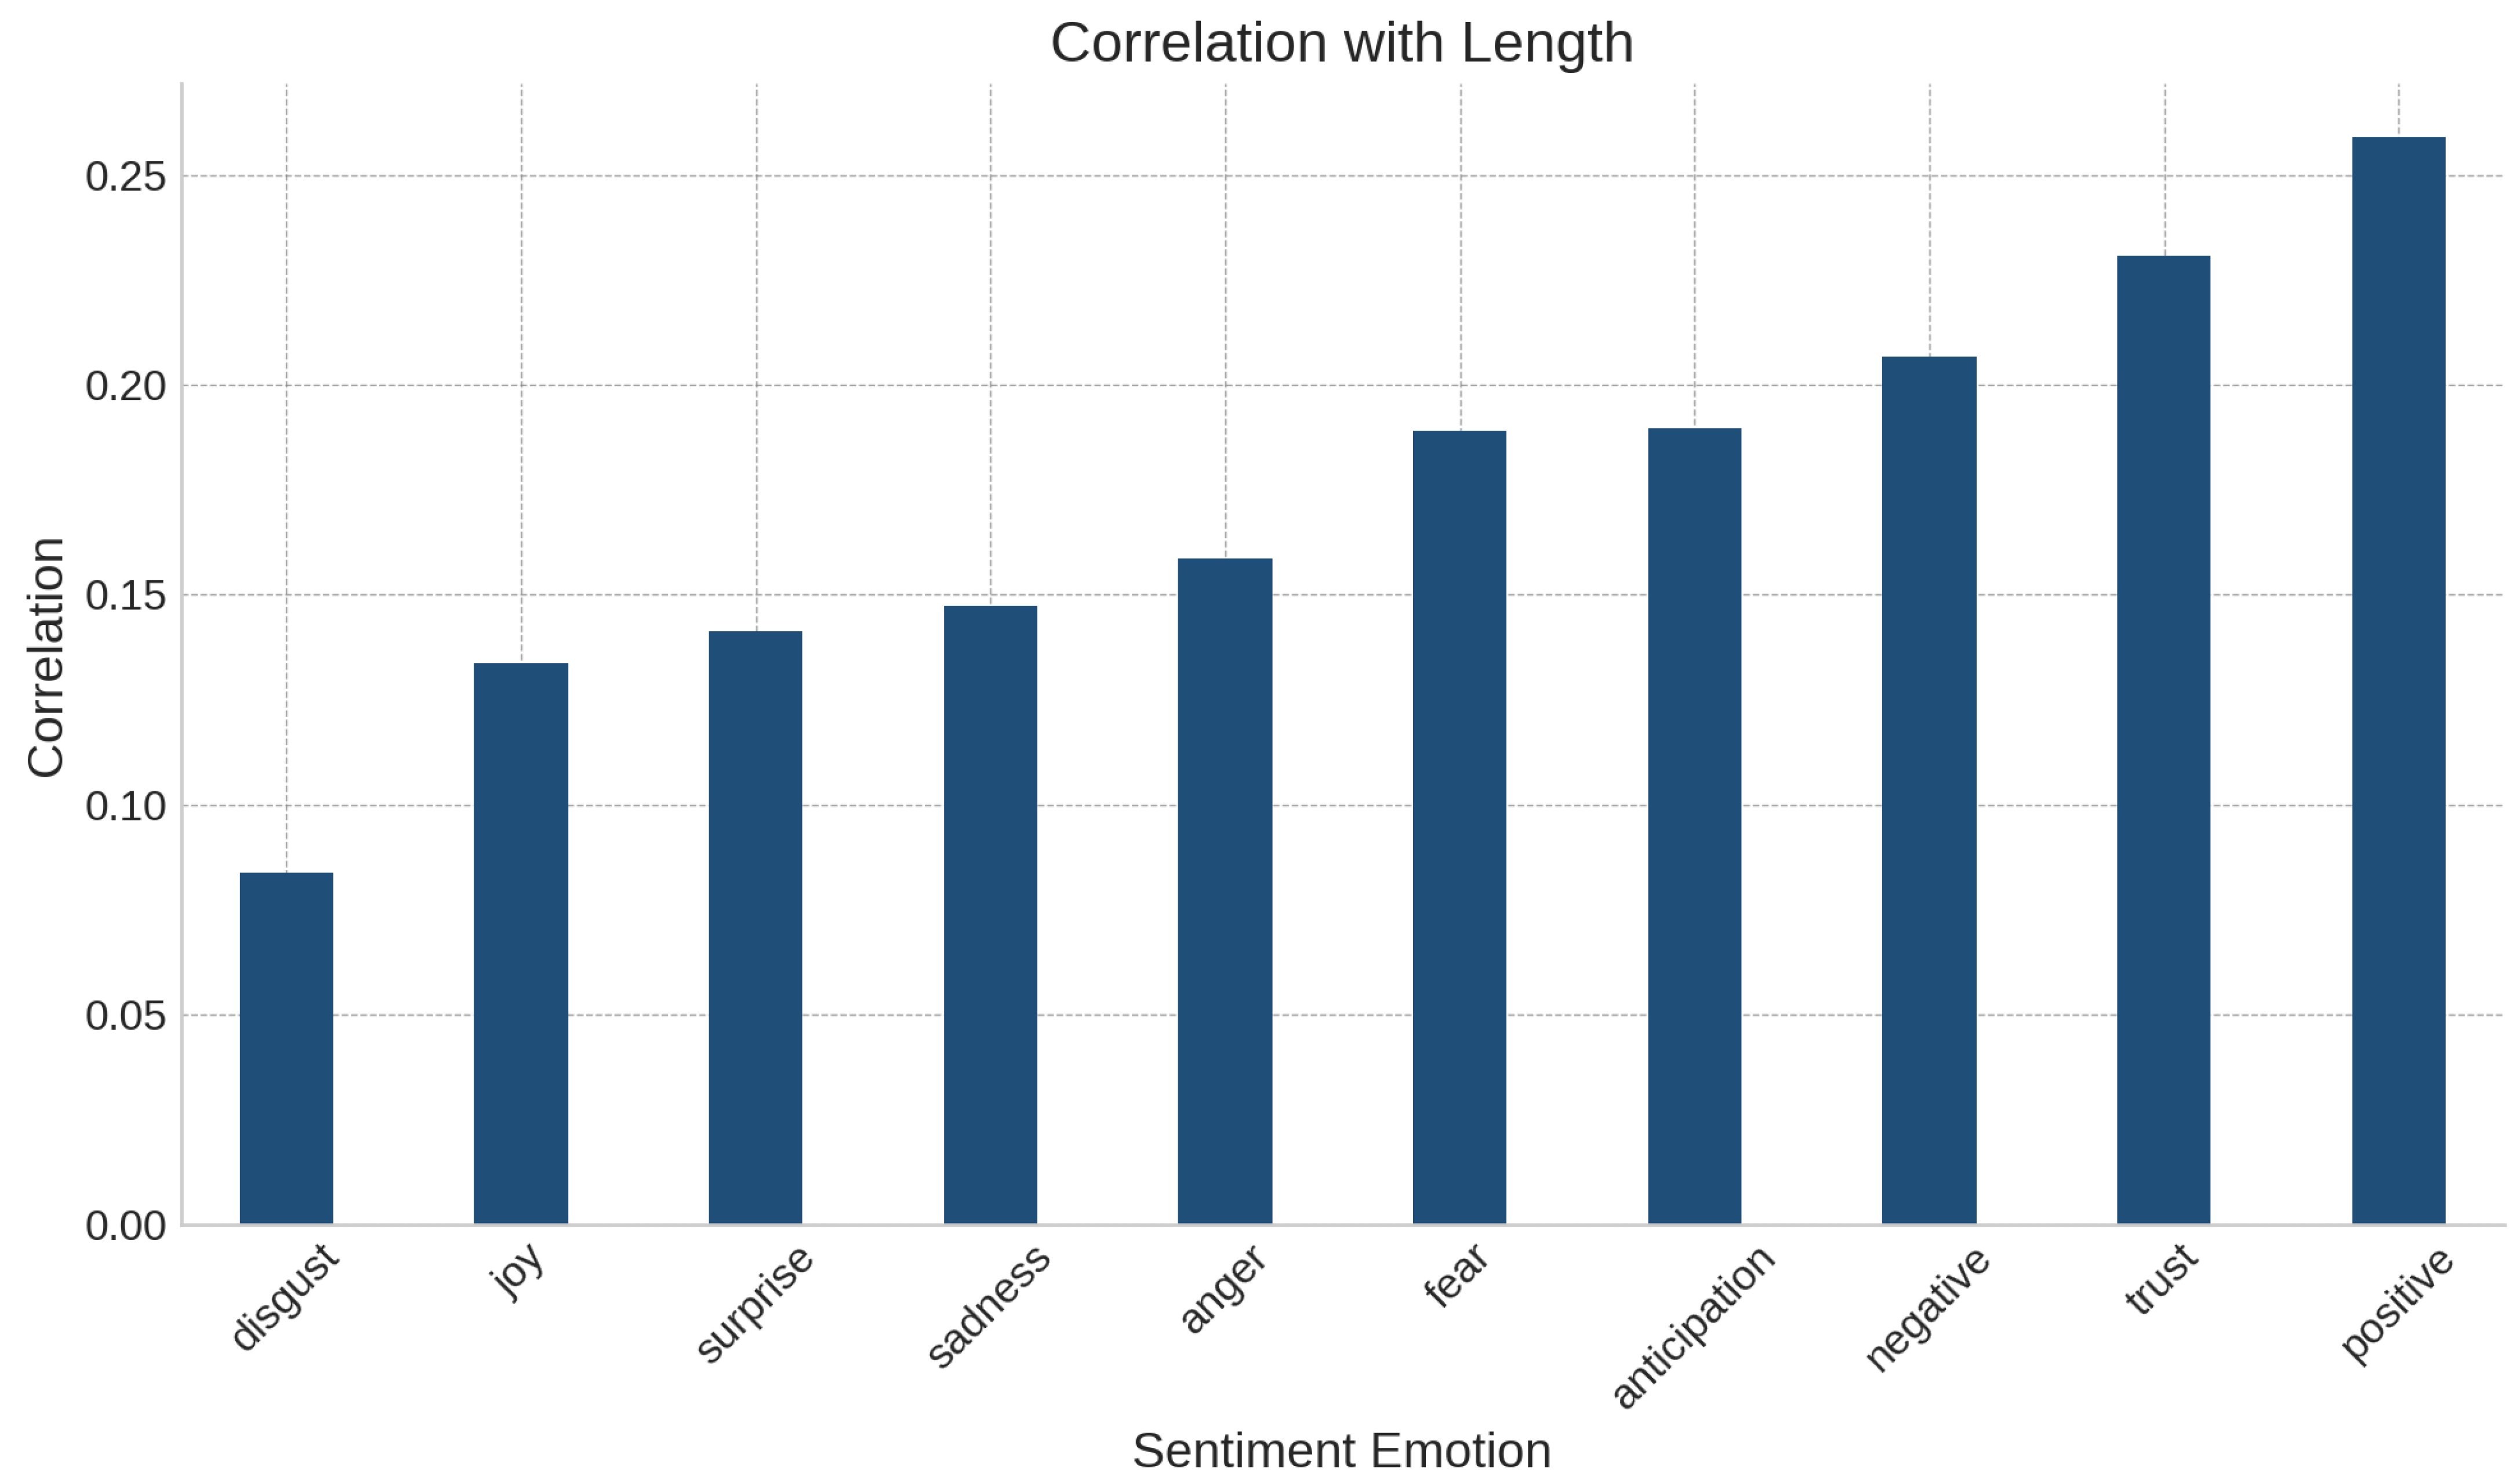
- Tweet Length and Positive Emotions:
- -
- Positive emotions, such as joy and trust, show a higher correlation with longer tweet lengths. This may be because positive sentiments often involve descriptive, celebratory, or explanatory tweets, which require more words to articulate.
- Negative Emotions and Conciseness:
- -
- Negative emotions like anger, disgust, and fear tend to have weaker correlations with tweet length, implying that these sentiments are often expressed more concisely. For example, short and sharp expressions like “This is horrible!” or “I’m scared” might dominate such tweets.
- Anticipation and Surprise:
- -
- Moderate correlations between anticipation and other emotions, such as trust and joy, suggest that this emotion often accompanies optimism.
- -
- Similarly, surprise correlates moderately with both positive and negative emotions, indicating its versatility in different contexts (e.g., “I’m shocked!” could be used positively or negatively).
- General Trend Between Emotions and Length:
- -
- Emotions that require detailed context or explanation (e.g., joy, trust) tend to have higher correlations with length, whereas emotions that are reactive or instinctive (e.g., anger, disgust) often result in shorter tweets.
Appendix A.4. Weekly Trends of Emotions
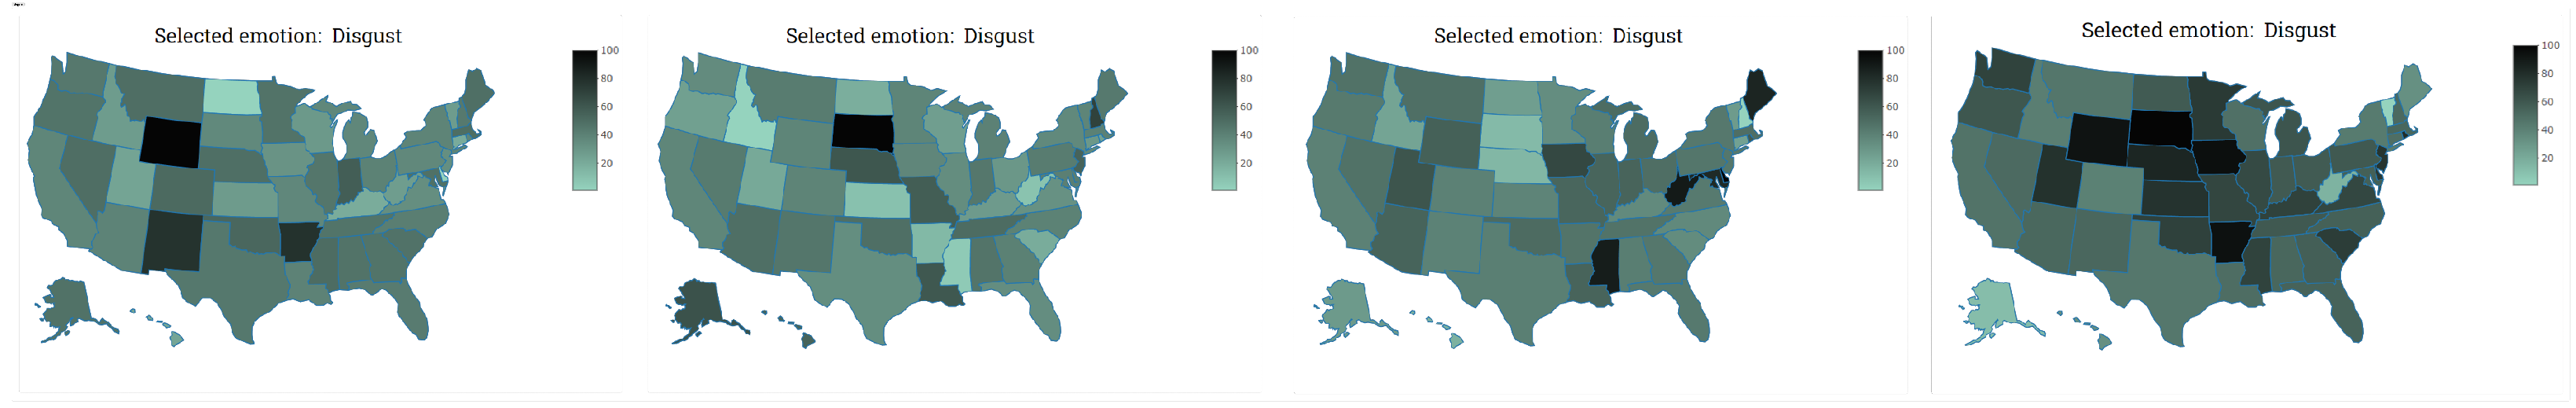
- Disgust: As shown in Figure A6, the emotion of disgust was highly prevalent in certain regions, likely reflecting strong negative reactions to specific policy changes or controversial announcements made during the transition.
- Fear: The maps in Figure A7 reveal that fear was more geographically distributed, with notable spikes in areas where users expressed uncertainty about the future of the platform or their personal data security.
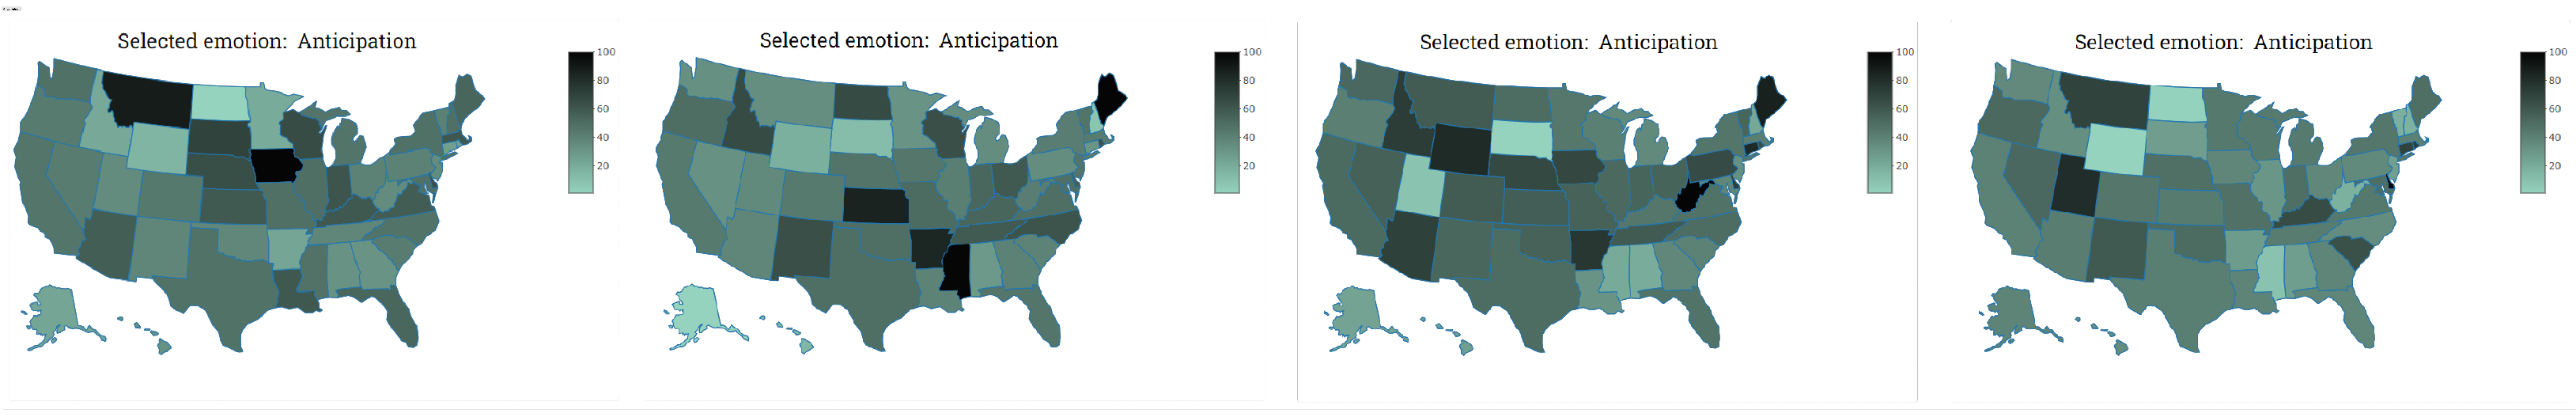
- Anticipation: Finally, Figure A5 illustrates regions with heightened anticipation, where users expressed eagerness for future updates or changes to the platform under Musk’s leadership.

References
- Zimbra, D.; Abbasi, A.; Zeng, D.; Chen, H. The State-of-the-Art in Twitter Sentiment Analysis: A Review and Benchmark Evaluation. ACM Trans. Manag. Inf. Syst. 2018, 9, 5. [Google Scholar] [CrossRef]
- Giachanou, A.; Crestani, F. Like It or Not: A Survey of Twitter Sentiment Analysis Methods. ACM Comput. Surv. 2016, 49, 2–28. [Google Scholar] [CrossRef]
- Samuel, J.; Ali, G.G.M.N.; Rahman, M.M.; Esawi, E.; Samuel, Y. COVID-19 Public Sentiment Insights and Machine Learning for Tweets Classification. Information 2020, 11. [Google Scholar] [CrossRef]
- Mohammad, S.M.; Turney, P.D. Crowdsourcing a Word–Emotion Association Lexicon. Comput. Intell. 2013. Available online: https://api.semanticscholar.org/CorpusID:9388645 (accessed on 24 January 2025).
- Hutto, C.J.; Gilbert, E. VADER: A Parsimonious Rule-Based Model for Sentiment Analysis of Social Media Text. In Proceedings of the International AAAI Conference on Web and Social Media, Ann Arbor, MI, USA, 1–4 June 2014. [Google Scholar]
- Taboada, M.; Brooke, J.; Tofiloski, M.; Voll, K.D.; Stede, M. Lexicon-Based Methods for Sentiment Analysis. Comput. Linguist. 2011, 37, 267–307. [Google Scholar] [CrossRef]
- Medhat, W.; Hassan, A.H.; Korashy, H. Sentiment analysis algorithms and applications: A survey. Ain Shams Eng. J. 2014, 5, 1093–1113. Available online: https://api.semanticscholar.org/CorpusID:16768404 (accessed on 24 January 2025). [CrossRef]
- Pang, B.; Lee, L.; Vaithyanathan, S. Thumbs up? Sentiment Classification Using Machine Learning Techniques. arXiv 2002, arXiv:cs.CL/0205070. [Google Scholar]
- Millennianita, F.; Athiyah, U.; Muhammad, A.W. Comparison of Naïve Bayes Classifier and Support Vector Machine Methods for Sentiment Classification of Responses to Bullying Cases on Twitter. J. Mechatronics Artif. Intell. 2024, 1, 11–26. [Google Scholar] [CrossRef]
- Kim, Y. Convolutional Neural Networks for Sentence Classification. In Proceedings of the Conference on Empirical Methods in Natural Language Processing, Doha, Qatar, 25–29 October 2014. [Google Scholar]
- Aydin, C.R.; Güngör, T. Combination of Recursive and Recurrent Neural Networks for Aspect-Based Sentiment Analysis Using Inter-Aspect Relations. IEEE Access 2020, 8, 77820–77832. [Google Scholar] [CrossRef]
- Devlin, J.; Chang, M.; Lee, K.; Toutanova, K. BERT: Pre-Training of Deep Bidirectional Transformers for Language Understanding; North American Chapter of the Association for Computational Linguistics: Minneapolis, MN, USA, 2019. [Google Scholar]
- Liu, Y.; Ott, M.; Goyal, N.; Du, J.; Joshi, M.; Chen, D.; Levy, O.; Lewis, M.; Zettlemoyer, L.; Stoyanov, V. RoBERTa: A Robustly Optimized BERT Pretraining Approach. arXiv 2019, arXiv:abs/1907.11692. [Google Scholar]
- Bollen, J.; Mao, H.; Zeng, X.-J. Twitter Mood Predicts the Stock Market. arXiv 2010. Available online: https://api.semanticscholar.org/CorpusID:14727513 (accessed on 24 January 2025).
- Jayalakshmi, V.; Lakshmi, M. Twitter Sentiment Analysis Tweets Using Hugging Face Harnessing NLP for Social Media Insights. In Advancements in Smart Computing and Information Security; Rajagopal, S., Popat, K., Meva, D., Bajeja, S., Eds.; Springer Nature Switzerland: Cham, Switzerland, 2024; pp. 378–389. [Google Scholar]
- Srivastava, M.; Khatri, S.K.; Sinha, S.; Ahluwalia, A.; Johri, P. Understanding Relation between Public Sentiments and Government Policy Reforms. In Proceedings of the 2018 International Conference on Recent Innovations in Telecommunications and Internet of Things (ICRITO), Amity University, Noida, India, 30–31 August 2018; pp. 213–218. [Google Scholar] [CrossRef]
- R Core Team. R: A Language and Environment for Statistical Computing; R Foundation for Statistical Computing: Vienna, Austria, 2021; Available online: https://www.R-project.org/ (accessed on 24 January 2025).
- Chang, W.; Cheng, J.; Allaire, J.J.; Sievert, C.; Schloerke, B.; Xie, Y.; Allen, J.; McPherson, J.; Dipert, A.; Borges, B.; et al. Shiny: Web Application Framework for R, R Package Version 1.7.1. 2021. Available online: https://CRAN.R-project.org/package=shiny (accessed on 24 January 2025).
- Belcastro, L.; Cantini, R.; Marozzo, F. Knowledge Discovery from Large Amounts of Social Media Data. Appl. Sci. 2022, 12, 1209. [Google Scholar] [CrossRef]
- Samuel, J.; Rahman, M.M.; Ali, G.G.M.N.; Samuel, Y.; Pelaez, A.; Chong, P.H.J.; Yakubov, M. Feeling Positive About Reopening? New Normal Scenarios From COVID-19 US Reopen Sentiment Analytics. IEEE Access 2020, 8, 142173–142190. [Google Scholar] [CrossRef] [PubMed]
- Xue, J.; Chen, J.; Chen, C.; Zheng, C.; Li, S.; Zhu, T. Public discourse and sentiment during the COVID-19 pandemic: Using Latent Dirichlet Allocation for topic modeling on Twitter. PLoS ONE 2020, 15, e0239441. [Google Scholar] [CrossRef] [PubMed]
- Kowsik, V.V.S.; Yashwanth, L.; Harish, S.; Kishore, A.; Renji, S.; Jose, A.C.; Dhanyamol, M.V. Sentiment analysis of twitter data to detect and predict political leniency using natural language processing. J. Intell. Inf. Syst. 2024, 62, 765–785. [Google Scholar] [CrossRef]
- Archive.org. Twitter Data Archive for October 2022. 2022. Available online: https://archive.org/details/twitterstream (accessed on 24 January 2025).
- json.org. JSON. 2001. Available online: https://www.json.org/json-en.html (accessed on 24 January 2025).
- Wikipedia Contributors. Comma-Separated Values. 2022. Available online: https://en.wikipedia.org/wiki/Comma-separated_values (accessed on 24 January 2025).
- Wickham, H.; François, R.; Henry, L.; Müller, K. Dplyr: A Grammar of Data Manipulation, R package Version 1.0.7. 2021. Available online: https://CRAN.R-project.org/package=dplyr (accessed on 24 January 2025).
- Wickham, H. Stringr: Simple, Consistent Wrappers for Common String Operations, R Package Version 1.4.0. 2021. Available online: https://CRAN.R-project.org/package=stringr (accessed on 24 January 2025).
- Sarica, S.; Luo, J. Stopwords in technical language processing. PLoS ONE 2021, 16, e0254937. [Google Scholar] [CrossRef] [PubMed]
- Feinerer, I. Introduction to the tm Package Text Mining in R. 2024. Available online: https://cran.r-project.org/web/packages/tm/tm.pdf (accessed on 24 January 2025).
- NRC Word-Emotion Association Lexicon. Available online: https://saifmohammad.com/WebPages/NRC-Emotion-Lexicon.htm (accessed on 24 January 2025).
- Zhang, L.; Liu, B. Sentiment Analysis and Opinion Mining. Synth. Lect. Hum. Lang. Technol. 2012. Available online: https://api.semanticscholar.org/CorpusID:38022159 (accessed on 24 January 2025).
- Silge, J.; Robinson, D. Tidytext: Text Mining and Analysis Using Tidy Data Principles in R. J. Open Source Softw. 2016, 1, 37. Available online: https://api.semanticscholar.org/CorpusID:53223972 (accessed on 24 January 2025). [CrossRef]
- Feinerer, I.; Hornik, K.; Meyer, D. Text Mining Infrastructure in R. J. Stat. Softw. 2008, 25, 1–54. Available online: https://api.semanticscholar.org/CorpusID:51738608 (accessed on 24 January 2025). [CrossRef]
- Wickham, H.; François, R. A Grammar of Data Manipulation. 2015. Available online: https://api.semanticscholar.org/CorpusID:62077685 (accessed on 24 January 2025).
- Spiceworks. (n.d.). What Is Parallel Processing? Spiceworks. Available online: https://www.spiceworks.com/tech/iot/articles/what-is-parallel-processing (accessed on 10 March 2025).
- Crown Records Management. 22 October 2024. Data Indexing Strategies for Faster & Efficient Retrieval. Crown Records Management. Available online: https://www.crownrms.com/insights/data-indexing-strategies/ (accessed on 24 January 2025).
- Wikipedia Contributors. Cache Replacement Policies. Available online: https://en.wikipedia.org/wiki/Cache_replacement_policies (accessed on 13 September 2024).
- New York Times. Elon Musk Completes Twitter Deal. 27 October 2022. Available online: https://www.nytimes.com/2022/10/27/technology/elon-musk-twitter-deal-complete.html (accessed on 22 November 2024).


| Keyword | Example Tweet | Time Period | Background |
|---|---|---|---|
| Election | “Excited to vote in the midterms! Let’s make our voices heard. # Midterms2022” | 14 Oct–31 Oct | Midterm elections in the U.S. were a major topic, with discussions around voter turnout, candidates, and policies. |
| Elon Musk | “Elon Musk’s takeover of Twitter is going to change everything. #TwitterTakeover” | 4 Oct–10 Oct | Elon Musk’s acquisition of Twitter sparked widespread debate about free speech, platform moderation, and corporate influence. |
| Inflation | “Gas prices are killing me. When will inflation end? #Economy” | 13 Oct–30 Oct | Rising inflation and economic uncertainty were key concerns for the public during this period. |
| COVID-19 | “Another wave of COVID? I thought this was over. #PublicHealth” | 20 Oct–31Oct | Despite the pandemic’s decline, concerns about new variants and public health measures persisted. |
| Climate | “Another hurricane? Climate change is real. #ClimateAction” | 6 Oct–29 Oct | Extreme weather events and climate change policies were widely discussed. |
| Immigration | “The border crisis needs a solution now. #ImmigrationReform” | 15 Oct–19 Oct | Immigration policies and border security were hot topics during the study period. |
| Search Terms | From Date | To Date |
|---|---|---|
| voting, elect | 2 | 6 |
| voting, elon | 2 | 6 |
| education, university | 11 | 14 |
| president | 4 | 7 |
| elon, musk | 1 | 5 |
| boat, sea, fly | 24 | 25 |
| plane, air | 27 | 31 |
| war, india | 8 | 12 |
| football, soccer | 14 | 18 |
| president, plane, elon | 2 | 6 |
| car, boat, sea | 20 | 26 |
| election, vote | 5 | 10 |
| university, happy | 4 | 11 |
| sea, football | 25 | 29 |
| voting, election, soccer | 1 | 9 |
Disclaimer/Publisher’s Note: The statements, opinions and data contained in all publications are solely those of the individual author(s) and contributor(s) and not of MDPI and/or the editor(s). MDPI and/or the editor(s) disclaim responsibility for any injury to people or property resulting from any ideas, methods, instructions or products referred to in the content. |
© 2025 by the authors. Licensee MDPI, Basel, Switzerland. This article is an open access article distributed under the terms and conditions of the Creative Commons Attribution (CC BY) license (https://creativecommons.org/licenses/by/4.0/).
Share and Cite
Mohammed, A.M.K.; Ali, G.G.M.N.; Khairunnesa, S.S. GSAF: An ML-Based Sentiment Analytics Framework for Understanding Contemporary Public Sentiment and Trends on Key Societal Issues. Information 2025, 16, 271. https://doi.org/10.3390/info16040271
Mohammed AMK, Ali GGMN, Khairunnesa SS. GSAF: An ML-Based Sentiment Analytics Framework for Understanding Contemporary Public Sentiment and Trends on Key Societal Issues. Information. 2025; 16(4):271. https://doi.org/10.3390/info16040271
Chicago/Turabian StyleMohammed, Abdul Moid Khan, G. G. Md. Nawaz Ali, and Samantha S. Khairunnesa. 2025. "GSAF: An ML-Based Sentiment Analytics Framework for Understanding Contemporary Public Sentiment and Trends on Key Societal Issues" Information 16, no. 4: 271. https://doi.org/10.3390/info16040271
APA StyleMohammed, A. M. K., Ali, G. G. M. N., & Khairunnesa, S. S. (2025). GSAF: An ML-Based Sentiment Analytics Framework for Understanding Contemporary Public Sentiment and Trends on Key Societal Issues. Information, 16(4), 271. https://doi.org/10.3390/info16040271