Article

Study on Radiation Protection Educational Tool Using Real-Time Scattering Radiation Distribution Calculation Method with Ray Tracing Technology

by
Toshioh Fujibuchi
Division of Medical Quantum Science, Department of Health Sciences, Faculty of Medical Sciences, Kyushu University, Fukuoka 812-8582, Japan
Information 2025, 16(4), 266; https://doi.org/10.3390/info16040266
Submission received: 14 January 2025 / Revised: 10 March 2025 / Accepted: 11 March 2025 / Published: 26 March 2025
(This article belongs to the Special Issue Medical Data Visualization)

Abstract

:
In this study, we developed an application for radiation protection that calculates in real time the distribution of scattered radiation during fluoroscopy using ray tracing technology, assuming that most of the scattered radiation in the room originates from the patient and that the scattered radiation originating from the patient travels linearly. The directional vectors and energy information for the scattered radiation spreading from the patient’s body surface to the outside of the body were obtained via simulation in a virtual X-ray fluoroscopy room. Based on this information, the scattered dose distribution in the X-ray room was calculated. The ratio of the scattered doses calculated by the method to those obtained from the Monte Carlo simulation was mostly within the range of 0.7 to 1.8 times, except for behind the X-ray machine. The scattered radiation distribution changed smoothly as the radiation protective plates were moved. When using protection plates with a high degree of freedom in their placement, it is not practical to measure the scattered radiation distribution each time. This application cannot be used for dose estimation for medical staff in clinical settings because it does not take into account the scattered radiation of non-patients and its dose calculation accuracy is low. However, the simple confirmation of the scattered radiation distribution and changes in staff dose led to an intuitive understanding of the appropriate placement of the protection plates.

1. Introduction

Fluoroscopically guided intervention (FGI) is a technique for catheter placement and treatment under fluoroscopic guidance that has become an indispensable part of current medical care. FGI has the advantage of being less invasive because it does not require opening the patient’s chest and abdomen.
FGI is performed using over-couch, under-couch, or C-arm-type X-ray fluoroscopy equipment. X-rays are emitted from the X-ray tube, narrowed by a collimator to the required irradiation range, and then irradiated onto the patient. There is an image detector behind the patient, which outputs the X-rays that have passed through the patient as a fluoroscopy image. When obtaining a fluoroscopy image, some of the X-rays pass through the patient; however, some collide with the patient and spread throughout the room as scattered radiation. When performing FGI, medical staff such as doctors and nurses who perform the procedure must do so close to the patient. The use of X-ray fluoroscopy increases the occupational exposure of these staff, so appropriate measures to reduce exposure are necessary [1,2,3,4,5]. In particular, in endoscopic retrograde cholangiopancreatography, the high exposure of the physician’s eye lens is a problem. This is because, especially with over-couch X-ray equipment, backscattering from the patient can reach the eyes of the physician. Although the physician’s body can be well protected from radiation by wearing radiation protection clothing, it is difficult to provide sufficient shielding for the eyes by using radiation protection goggles, as the lead equivalent is generally low and the lens of the eye is exposed through the gap between the eye and the face. In FGI, the amount of scattered radiation is about five times less when performed under the couch. Therefore, under-couch FGI is recommended. However, in Japan, ERCP is often performed with over-the-couch X-ray equipment because of the ease of handling the procedure.
The three principles of external radiation protection are distance, time, and shielding. Regarding distance, the physician must be close to the patient, who is the main source of radiation scattering, when performing the procedure. Therefore, radiation protection by shielding is effective. There are two types of shielding: wearable and external. Wearable shielding can directly protect nearby organs, but those with a high lead equivalent that provide high protection put a lot of strain on the body on which they are worn. On the other hand, an external shielding device can be hung from the ceiling or moved on casters. In this case, those with a high lead equivalent can be used, but they must not get in the way of the procedure. Also, sufficient protection cannot be obtained unless they are placed in an appropriate position. Therefore, it is desirable to use a combination of both external and wearable shielding depending on the situation.
Radiation shielding of the torso is provided by protective clothing. Radiation protection glasses are used to protect the lens of the eye [6,7]. When these wearable radiation shielding devices are inadequate, external radiation protective plates are effective. Radiation protective plates can be placed freely, but the high degree of freedom makes it difficult to intuitively understand the appropriate placement method and its effectiveness [8,9].
Radiation particle transport calculations using the Monte Carlo method make it possible to verify radiation shielding effects with high accuracy. Furthermore, by reproducing X-ray equipment and patients in a virtual space, it is also possible to simulate the spatially scattered radiation distribution during X-ray irradiation. The scattered radiation distribution calculated by Monte Carlo simulation can be visually verified using 3D visualization software ParaView version 5.11.0 [10,11,12]. Monte Carlo simulation can accurately simulate the scattered dose distribution; however, it has the problem that the calculations take a long time. To obtain results within a certain statistical error in a short time, a PC with a very large number of cores or parallel calculations using multiple PCs connected over a network are required [13,14,15]. In recent years, ray tracing has been used to accurately reproduce the behavior and scattering of light in three-dimensional computer graphics games, movies, and other visual representations to create a sense of reality [16]. We wondered if the ray tracing technique could be used for a simple and fast simulation of the scattered ray distribution in an X-ray examination room, in which the patient, who is the main source of scattered radiation, is regarded as a light source, and scattered radiation is regarded as light.
Therefore, the objective of this study is to develop an application that uses ray tracing technology to calculate the radiation dose according to the position of the medical staff when irradiating the patient with X-rays. Although this application is qualitative, I suggest its potential as an educational tool for recognizing the spread of scattered radiation and understanding how to use radiation protective plates. In educational settings, when irradiating the patient with X-rays in a virtual X-ray room, the scattered radiation distribution in the room and changes in occupational exposure are displayed in real time according to the positions of medical staff and protection panels. Although this application is qualitative, I suggest its potential as an educational tool for recognizing the spread of scattered radiation and understanding how to use radiation protective plates.

2. Materials and Methods

2.1. Reproduction of the X-Ray Examination Room and Calculation of Scattered Radiation Distribution Information

The behavior of scattered radiation was simulated using the MC simulation code Particle and Heavy Ion Transport code system (PHITS) version 3.33 (Japan Atomic Energy Agency, Ibaraki, Japan) [17]. Photons were transported using the EGS5 (Electron-Gamma Shower version 5) code system in the PHITS setting [18]. The irradiation conditions were a tube voltage of 87 kV with 2.5 mm Al filtration, a focus-to-image detector distance of 120 cm, and an irradiation field. Various pieces of X-ray equipment, including an X-ray tube, an X-ray source, and a couch (height 80 cm from floor, length 235 cm, width 85 cm), were prepared in an X-ray room filled with air of density 0.001293 g cm−3, with a composition of nitrogen (80%) and oxygen (20%). The ambient dose equivalent of scattered radiation around the phantom was compared by survey meter measurements and simulations when an actual water phantom (30 cm × 30 cm × 15 cm) was irradiated with X-rays. The survey meter used was a RaySafe X2 survey sensor (RaySafe, Gothenburg, Sweden). This survey meter was calibrated by the manufacturer within one year. Furthermore, irradiation was repeated three times at the same position, and the average value was used to ensure accuracy within 10%. As a result, it was confirmed that the difference between the measured and simulated values in this room was within ± 10%.
After confirming the accuracy of the simulation, an ICRP 110 male voxel phantom was used as the patient model [19]. The phantom was positioned supine and irradiated in the upper abdomen. The three-axis coordinates and three-axis directional vectors and energy information of the scattering radiation of photons emitted from the phantom into the room’s air were stored in 16,000 and comma-separated variable (CSV) format. The number 16,000 was determined by taking into consideration the time required for calculation, memory consumption, and calculation accuracy.

2.2. Building a Real-Time Calculation Model Using Ray Tracing Technology

Unity version 2020.3.30f1 (Unity Technologies, San Francisco, CA, USA) was used for the development of the application using Ray tracing technology. For efficient parallel computation, a program using Unity DOTS (Data-Oriented Technology Stack) (Unity Technologies, San Francisco, CA, USA) was included. The system development environment is presented in Table 1.
In a previous study, we evaluated the scattered radiation from the X-ray tube and a pelvis phantom simulating a patient. As a result, 80% of the scattered radiation reaching a position 120 cm from the floor and 100 cm from the center of the phantom was from the phantom [20]. In this application, the assumption was made that most of the scattered radiation in the room originated from the patient. In the virtual X-ray room, evaluation points were set at 50 cm intervals, as shown in Figure 1, based on the CSV file of the coordinates, directional vectors, and energy information for the scattered radiation source that spreads from the surface of the patient’s body to the outside during fluoroscopy while the patient is lying on their back. The scattered radiation distribution in the X-ray examination room was calculated from the number of photons passing through these points. In Unity, scattered radiation is considered to be visible light, and light with directionality in the vector direction is emitted from the coordinates of the source. The intensity of the radiation dose is based on the inner product of the position of the evaluation point and the vector information multiplied by the energy of the X-ray.
The coordinates of the virtual X-ray examination room were defined as follows: +X-axis: patient head direction; −X-axis: patient foot direction; +Y-axis: ceiling direction; −Y-axis: floor direction; +Z-axis: patient right direction; and −Z-axis: patient left direction. The height of the patient couch was set as the origin (0, 0, 0) at the center of the X-ray irradiation field.
The dose at each evaluation point is calculated based on the dose received from the source as viewed from the point of view of the evaluation point and the object that passes through. When the application is started, it searches for scattered radiation that has a large impact at each evaluation point and stores it in its memory. It displays a two-dimensional radiation dose distribution based on the impact of scattered radiation at each evaluation point. The scattered radiation dose distribution is the peripheral dose equivalent per 1 mGy of patient incident dose, and the overall scattered radiation dose distribution value can be changed by inputting the expected input surface dose into the application. Three medical staff members and a radiation protection board were placed in a virtual X-ray room. The radiation protective plate was based on a 0.8 mm lead-containing acrylic radiation protective plate (ML-II, Kuraray trading, Osaka, Japan), measuring 370 mm in height, 570 mm in width, and 20 mm in thickness. The 3D models of the medical staff, including multiple dose evaluation points, were placed in the X-ray room, and they could be moved around the room by mouse operation. By placing evaluation points at the binocular, thyroid, chest center, abdomen center, waist center, right fingertip, and left fingertip positions of the medical staff model, each evaluation point at these locations could be calculated.
When there is an object such as a radiation protection board or a medical staff member between the scattered radiation generated from the patient’s body surface and the evaluation point, the number of dose photons after the object is subtracted based on the attenuation coefficient of the object to change the radiation dose distribution. The radiation dose distribution can be displayed in a cross-section specified in the patient’s left and right directions, the patient’s head-to-foot direction, and the floor-to-ceiling direction.
The radiation dose distribution is a relatively regular distribution of radiation dose and is expressed as the peripheral dose equivalent per 1 mGy of the patient irradiation reference point. By inputting the radiation dose-to-ambient dose equivalent conversion coefficient, it can be converted to the ambient dose equivalent distribution for any patient irradiation reference point dose. It is assumed that no absorption or secondary scattering of scattered radiation occurs due to the air or objects in the room.

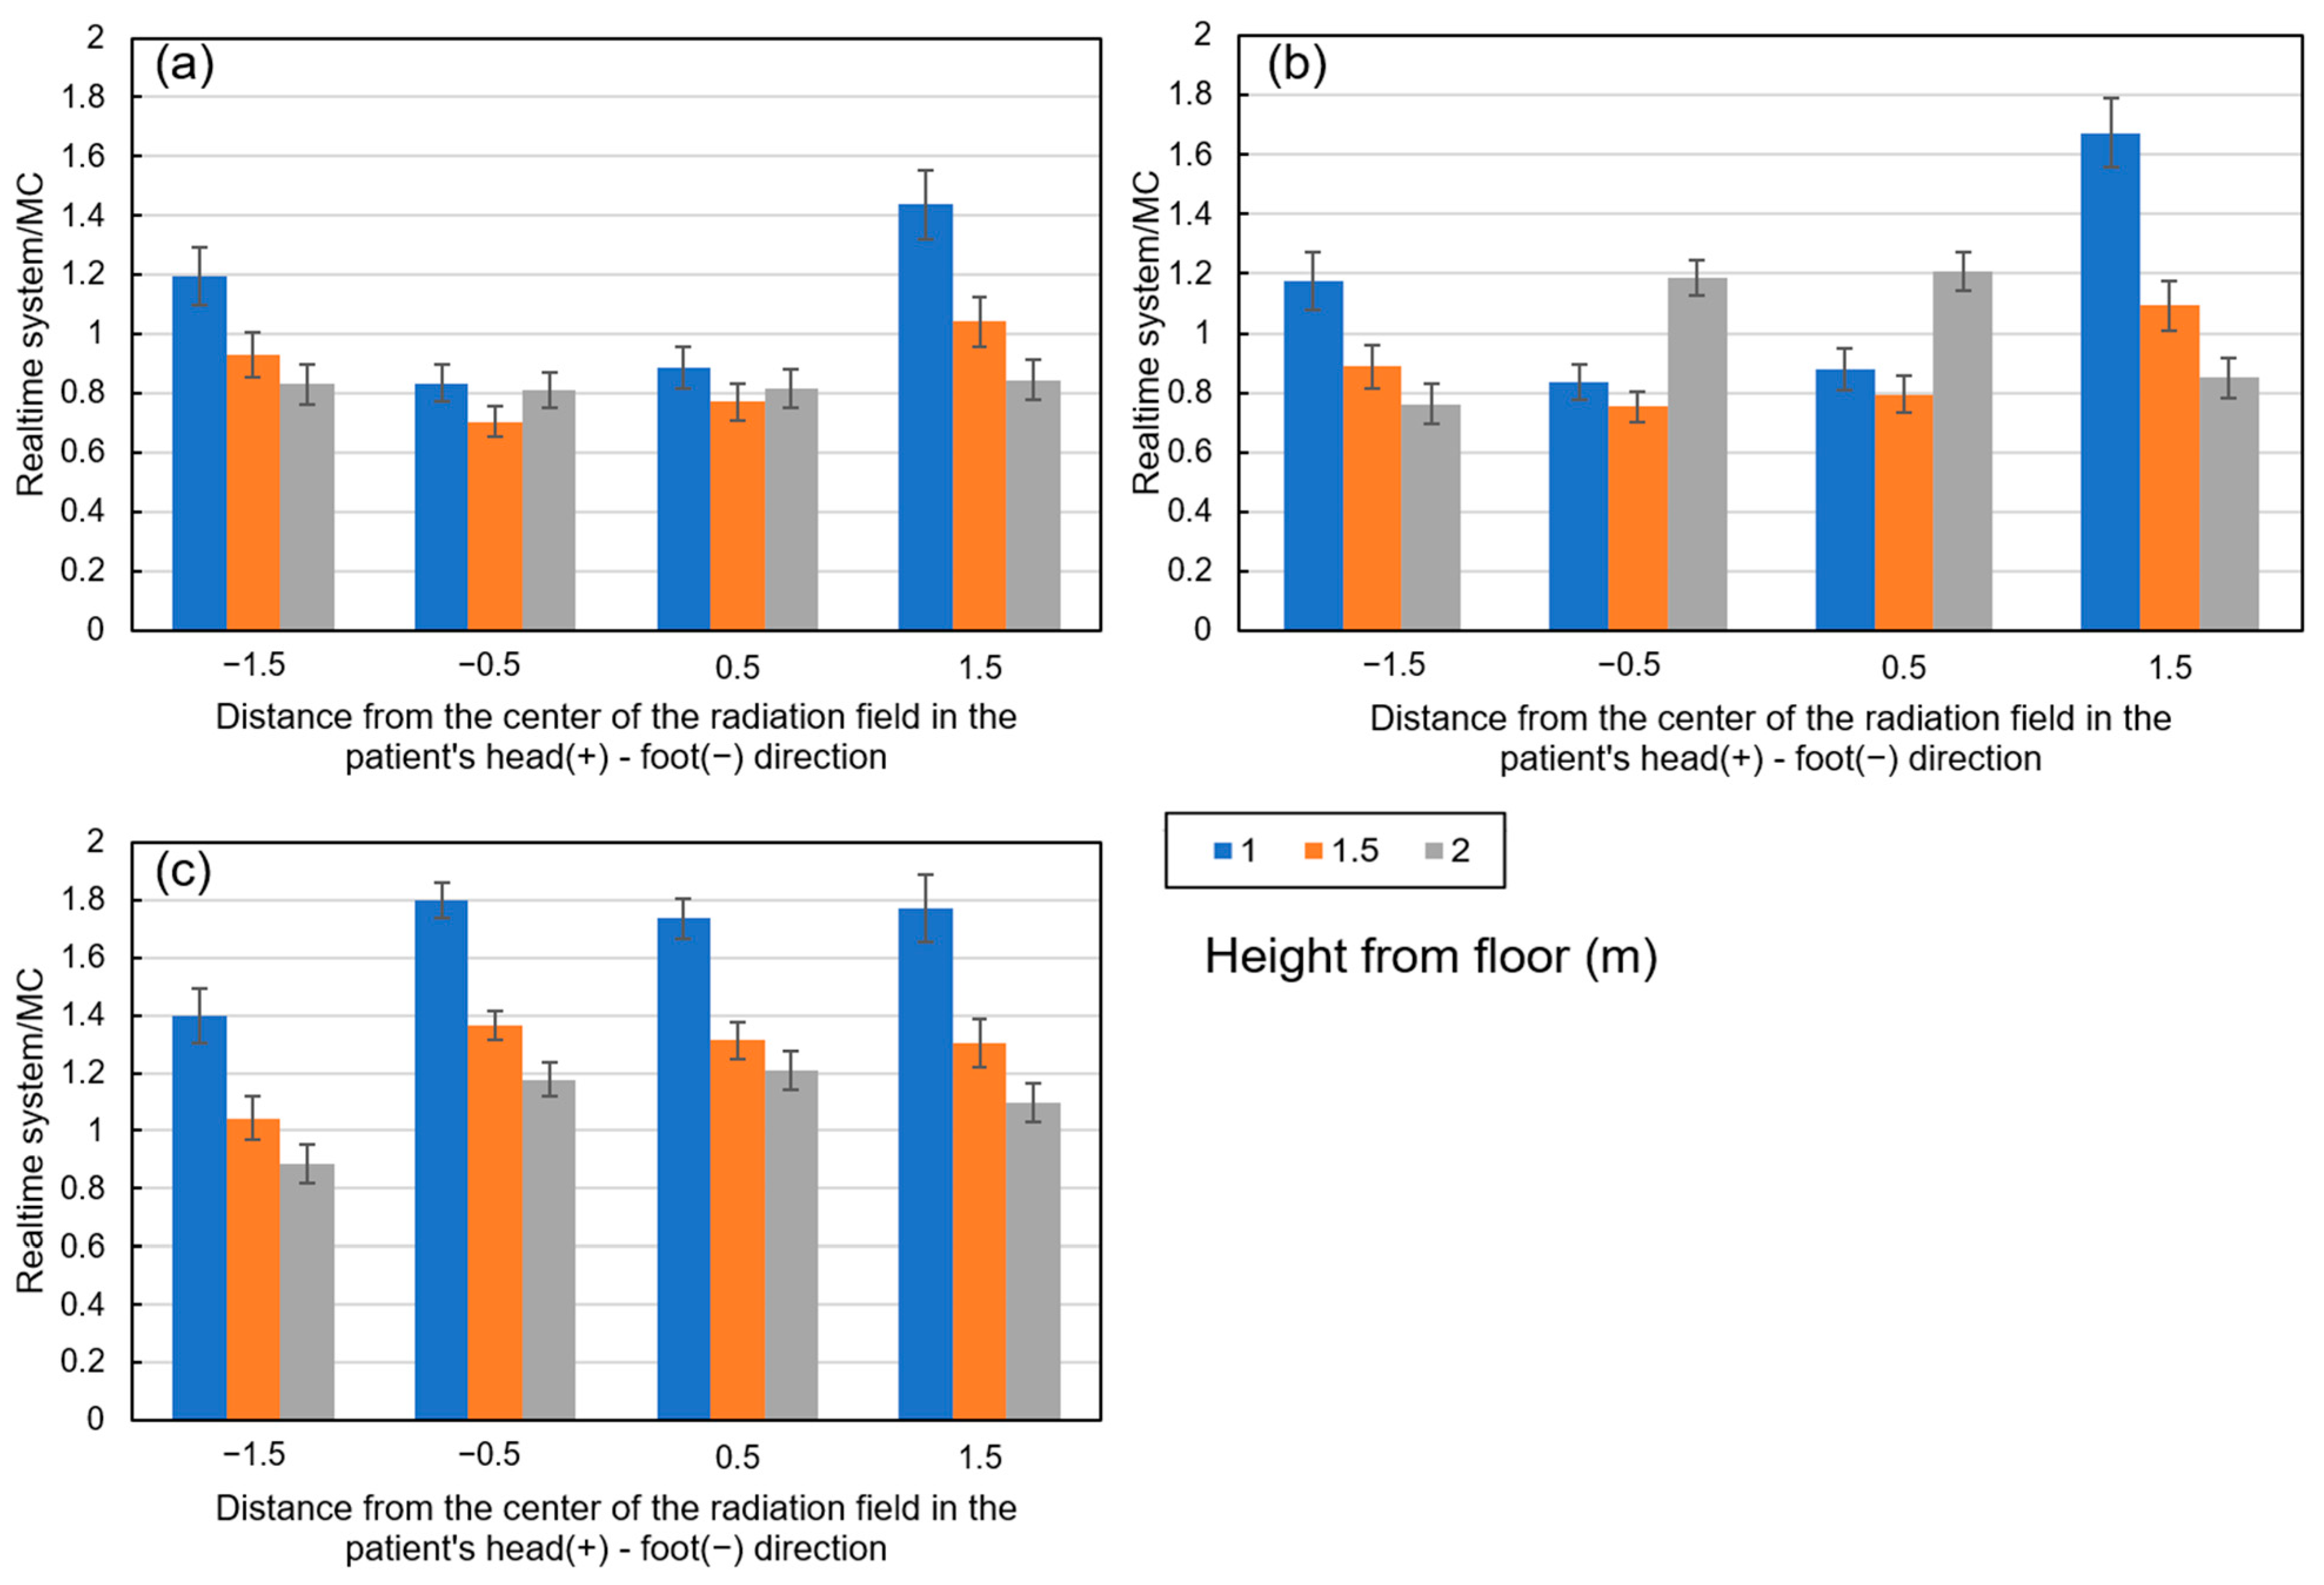
2.3. Comparison of Ray Tracing and Monte Carlo Calculations

To verify the accuracy of the simulation, a comparison was made between the Monte Carlo simulation and this simulation for a total of 36 points at heights of 1, 1.5, and 2 m (y = −0.2, 0.3, and 0.8) from the floor, with the x-axis at −1.5, −0.5, 0.5, and 1.5 m and the z-axis at −0.5, 0.5, and 1.5 m on the left side of the patient, where a medical professional was positioned for the procedure during radiography. The simulations were compared with the present simulation.

3. Results

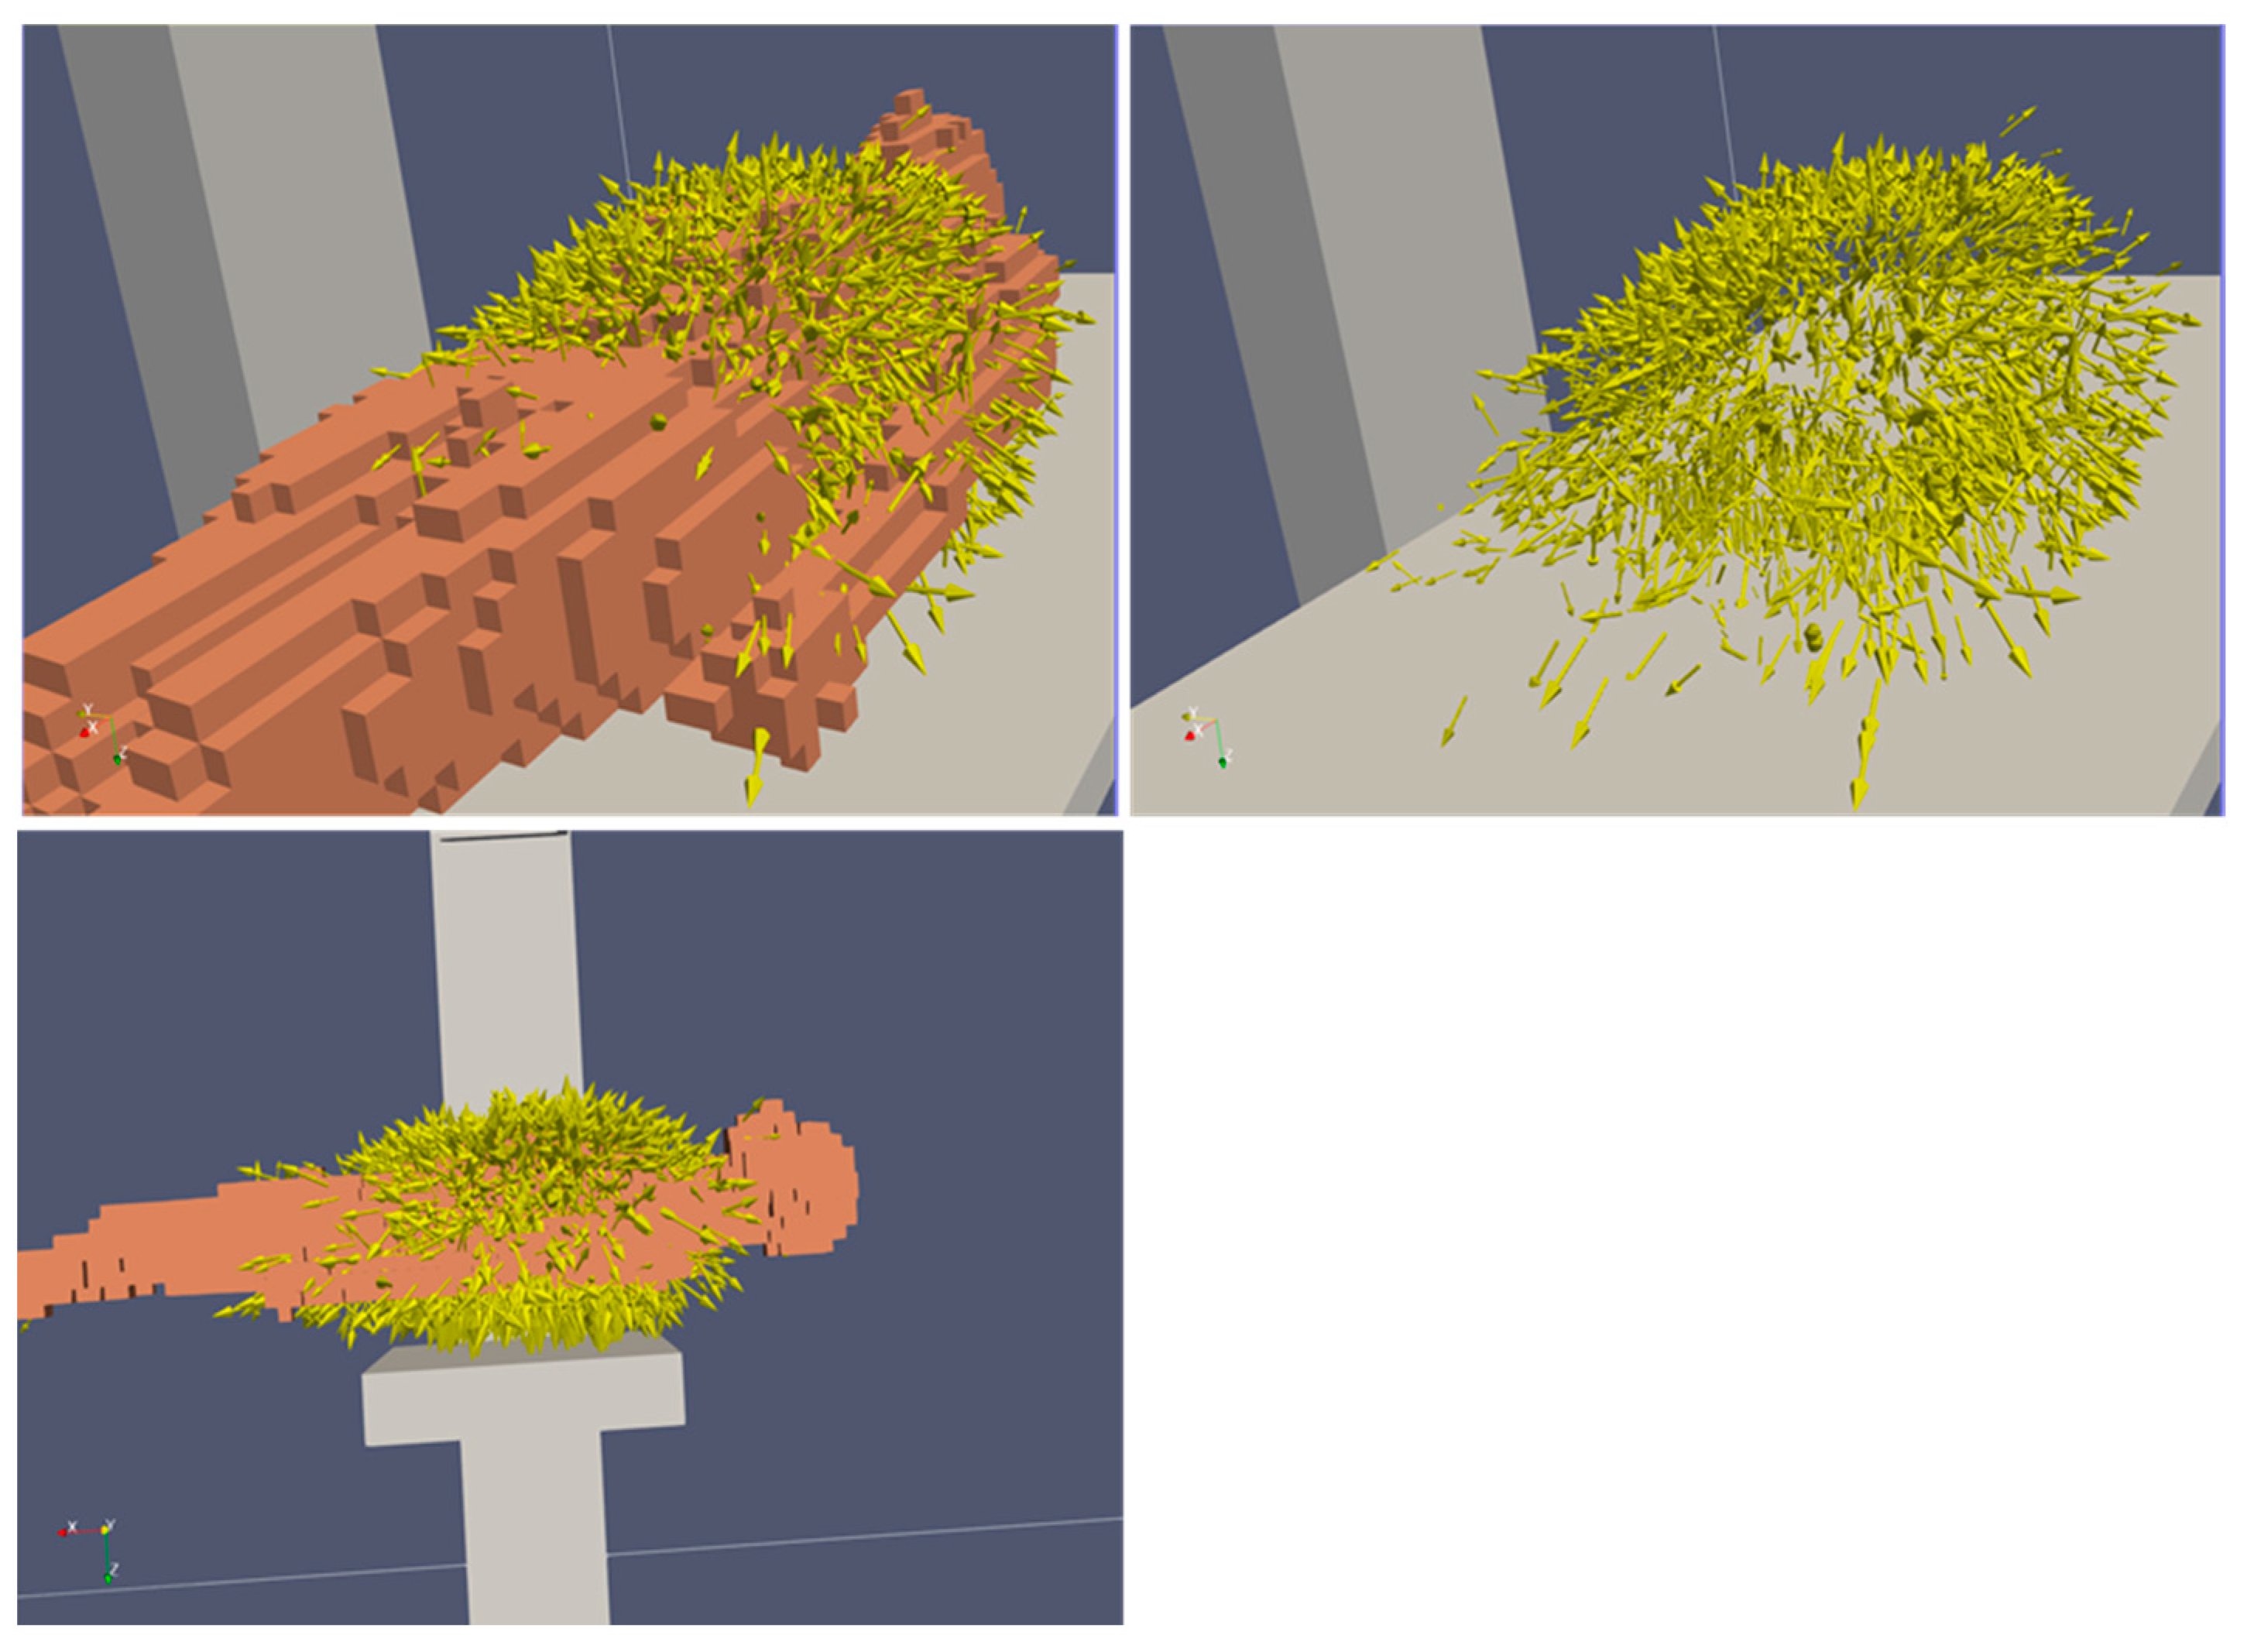
3.1. Scattered Ray Direction Vectors from the Patient

The scattered ray direction vector information from the patient acquired by the Monte Carlo simulation is shown in Figure 2. The number of scattered radiation source information (three-axis coordinate, vector, and energy) used was 16,000. These indicate the position and direction of the scattered radiation source from the patient. The scattered radiation from the patient was distributed in all directions around the incident body surface. In particular, there was a large amount of backscattered radiation in the direction of the X-ray tube where the X-rays entered.

3.2. Simulation Results Using This System

The ratio of radiation doses between the ray tracing calculation and the Monte Carlo calculation is shown in Figure 3. The number of histories in the Monte Carlo calculation was set to 2.5 × 10⁷. The statistical error of the Monte Carlo calculation is less than 10%. The ratio ranged between 0.8 and 1.8 for the evaluation points at a height of 1 m (blue) from the floor, except for behind the X-ray system. For heights of 1.5 m (orange) and 2 m (gray), this ranged from 0.7 to 1.4 times higher. When the ratio is close to 1, that is, when the results between the methods match, it indicates good results. A 1 m height gave relatively high results for the ray tracing calculations. The agreement between the Monte Carlo calculations and the survey meter measurements at these points was between 0.9 and 1.1. 1 m above the floor, which corresponds to the pelvic region (gonads) of medical staff, 1.5 m to the chest or neck, and 2 m to the head of a tall person. The X-ray inspection room on which the data were based had a wall at Z = −1.2 m, and the amount of scattered radiation behind this wall could not be measured, so it was not evaluated.
Figure 4 shows the distribution of scattered radiation in the same cross-section by Monte Carlo simulation and ray tracing calculations. The unit of dose in the figure is μSv/mGy, which means the personal dose equivalent (μSv) at each part of the staff per 1 mGy of patient entrance surface dose. This unit is used in all the following graphs. The image shows a sagittal cross-section of the patient, on the left side of the patient where the physician is closest to the patient, near the edge of the bed (x = 0.3). In ray tracing, the relative values become lower compared to the Monte Carlo simulation as the position increases from the floor to the ceiling. This is consistent with Figure 3.
Figure 5 shows the appearance of the application. The application is calibrated with four screens. The left screen shows the virtual X-ray room, which can be viewed from any direction by mouse operation. The medical staff move by means of a slider at the bottom. At the top of the screen, the dose at each evaluation point can be displayed. For the color map of the scattered radiation dose distribution, lower and upper limits can be entered numerically. In addition, the color changes can be switched between linear and log scales. The entire room can be zoomed in and out and translated by mouse operation. In Figure 4, a hot zone was seen on the “head side” of the phantom, and a cold zone was seen on the foot side. This is because the irradiation field was near the patient’s chest, and scattered radiation was less attenuated in the patient’s head, and in the lateral direction, it was attenuated by the pelvis and lower body.
The right side of the screen shows the cross-sections of the scattered radiation in the direction of the patient’s head and feet, in the direction of the ceiling floor, and in the direction of the patient’s right and left. The slider on the right side can be used to slide the position of the cross-section. Only one cross-section is shown at a time.
Figure 6 shows the simulation results of the scattered radiation distribution when the position of the medical staff is changed. It can be seen that the scattered radiation decreases behind the medical staff. The scattered radiation vectors are concentrically spread out from the patient, and the decreased portion of the scattered radiation extends obliquely upward behind the medical staff. It can also be confirmed that the amount of scattered radiation behind the X-ray device is also decreasing due to shielding by the device. The change in the distribution of the scattered radiation due to the movement of the medical staff was made within 1 s. In this calculation, the medical staff phantom did not include radiation protection clothing.
Figure 7 shows the difference in the distribution of scattered radiation depending on the position of the 0.8 mm lead-containing acrylic radiation protective plate. The radiation shields are positioned 150 cm from the floor in the upper left, 80 cm in the upper right, and 100 cm in the lower right. In the lower half of the figure, the protective plate is placed perpendicular to the floor on the left side and tilted at a 30-degree angle on the right side. The position of the shields shows that the range of the decrease in the scattered radiation dose differs depending on the position of the shields.
Figure 8 shows the radiation distribution in the sagittal section of the patient. It can be seen that the scattered radiation decreases as the distance from the patient increases.

4. Discussion

The main point of this study is to simulate in real time the distribution of scattered radiation during X-ray fluoroscopy by using ray tracing technology. It is difficult to provide training on the proper use of radiation shielding devices because of the high degree of freedom in their placement. A slight difference in the position of the radiation protective plate can change the scattered radiation distribution [12]. The application developed in this study is a simple calculator, but it is an innovative and novel system that can intuitively display a scattered radiation distribution and dose changes due to the movement of medical staff and objects in the room.
In this system, the scattered radiation distribution changed smoothly as the medical staff moved. It is not practical to measure and calculate via the Monte Carlo method the scattered radiation distribution each time when using medical staff with a high degree of freedom in their positioning [12]. This system makes it possible to check in real time changes in the relative distribution of scattered radiation due to the movement of radiation protection plates, etc., and by inputting the patient’s radiation dose, it is also possible to easily obtain the radiation dose for medical staff and changes in exposure depending on their standing position. In angiography, radiation shields are often suspended from the ceiling, allowing for a high degree of freedom in their placement. Since radiation is invisible, it is difficult for medical staff to recognize the spread of scattered radiation. Although the calculation accuracy of this system is not high, it is useful for radiation protection education because it helps medical staff to confirm safe positions that do not interfere with medical treatment and to intuitively understand the appropriate placement of radiation protective plates [10,11]. However, in angiography, X-rays are irradiated from under the couch, and the C-arm can move freely. To calculate the distribution of scattered radiation, it is necessary to obtain multiple scattered radiation source data according to the X-ray incidence direction of the device in advance and import the data each time. The app can display the doses of multiple medical staff, so if the medical team is often in a standard position, it can suggest where to place the shields so that staff can move around without constantly moving the shields.
Hizukuri et al. have proposed a system that uses pre-calculated vector volume data in an X-ray room to estimate changes in the scattered radiation distribution caused by the movement of radiation protection panels in the room in 13 s more accurately than our system [14]. However, as an application, it has issues such as not being able to evaluate the dose administered to medical staff and the fact that the calculation time required for the pre-calculation of the Monte Carlo calculation to obtain information about the scattered radiation source is longer than that of our system.
This system also has the function of estimating the dose for multiple parts of the body, such as the eyes and hands, depending on the position of the medical staff, as well as the change in the scattered radiation distribution due to shielding. Medical staff are exposed to uneven radiation during radiation work. This system makes it possible to consider appropriate protection measures for areas with high exposure.
On the other hand, there are multiple limitations in the accuracy of the dose calculation of this system. The calculation does not take into account the secondary scattering of scattered radiation when it hits an object. In reality, additional scattered radiation is generated by impacting an object. The source of the scattered radiation is based on the patient’s information only. Also, a uniform value is used for the attenuation coefficient. In reality, different objects have different attenuation coefficients, which must be taken into account for accurate calculations. In practice, scattered radiation is also generated from X-ray tubes, the patient couch, etc. [12]. Therefore, it is necessary to obtain information on scattered radiation sources from all structures and incorporate them into the system to be more accurate.
The reason for considering the patient as the scattered radiation source in this study is that in the phantom experiment, the contribution from the patient phantom was 80% of the scattered radiation component at the operator’s position, so the patient was considered as the scattered radiation source [20]. In reality, scattered radiation is also generated from other components. As a further improvement, it is thought that the problem can be solved by obtaining information on the X-ray tube, patient couch, image detector, etc., as a scattered radiation source in addition to the patient.
This calculation does not take into account scattering by objects and thus is likely underestimating the dose due to the missing secondary scattered component, which is a major limitation of the research. The key to this calculation is the incorporation of a method to quickly calculate how light spreads from the source of scattered rays. Because the amount of calculation is large, a GPU is suitable for high-speed calculations.
This is a preliminary study on the real-time simulation of a scattered radiation distribution by ray tracing, and we aim to solve the above problems and to apply the system to various irradiation conditions and other X-ray systems in the future by adding corrections based on scientific evidence.

5. Conclusions

In this study, an application that calculates and displays the distribution of scattered radiation in an X-ray examination room in real time using ray tracing technology in educational settings was created. It is suggested that this system will be an effective educational tool for medical staff to understand the optimal position of medical staff and the appropriate use of radiation protective plates with an awareness of radiation exposure reduction during medical examinations.
On the other hand, this application only considers the absorption of scattered radiation and does not handle secondary scattering. The scattered radiation distribution is also heavily influenced by secondary scattering, and this method does not provide sufficient calculation accuracy. In the future, we aim to improve the accuracy of the simulation and support many irradiation conditions and modalities.

Funding

This research was funded by JSPS KAKENHI, Grant Numbers JP23K24960 and JP21K07703. This study was supported in part by an Industrial Disease Clinical Research Grant (220201-01) from Japan.

Institutional Review Board Statement

Not applicable.

Informed Consent Statement

Not applicable.

Data Availability Statement

The datasets presented in this article are not readily available because the data are part of an ongoing study. Requests to access the datasets should be directed to the corresponding author.

Conflicts of Interest

The author declares no conflicts of interest.

References

  1. Kim, K.P.; Miller, D.L. Minimising radiation exposure to physicians performing fluoroscopically guided cardiac catheterisation procedures: A review. Radiat. Prot. Dosim. 2009, 133, 227–233. [Google Scholar] [CrossRef] [PubMed]
  2. Quinn, C.M.; Cosette, M.S.; Michael, P.A.; Thomas, B.K.; Isabel, G.N. Radiation Protection for the Fluoroscopy Operator and Staff. Am. J. Roentgenol. 2016, 207, 745–754. [Google Scholar] [CrossRef]
  3. International Commission on Radiological Protection (ICRP). Avoidance of Radiation Injuries from Medical Interventional Procedures; ICRP Publication 85; Pergamon: Oxford, UK, 2000; Volume 30. [Google Scholar]
  4. Dauer, L.T.; Thornton, R.H.; Solomon, S.B.; St Germain, J. Unprotected operator eye lens doses in oncologic interventional radiology are clinically significant: Estimation from patient kerma-area-product data. J. Vasc. Interv. Radiol. 2010, 21, 1859–1861. [Google Scholar] [CrossRef] [PubMed]
  5. Vano, E.; Gonzalez, L.; Fernandez, J.M.; Haskal, Z.J. Eye lens exposure to radiation in interventional suites: Caution is warranted. Radiology 2008, 248, 945–953. [Google Scholar] [CrossRef] [PubMed]
  6. Mao, L.; Liu, T.; Caracappa, P.F.; Lin, H.; Gao, Y.; Dauer, L.T.; Xu, X.G. Influences of operator head posture and protective eyewear on eye lens doses in interventional radiology: A Monte Carlo Study. Med. Phys. 2019, 46, 2744–2751. [Google Scholar] [CrossRef] [PubMed]
  7. Schueler, B.A.; Fetterly, K.A. Eye protection in interventional procedures. Br. J. Radiol. 2021, 94, 20210436. [Google Scholar] [CrossRef] [PubMed]
  8. Akahane, M.; Yoshioka, N.; Kiryu, S. Radiation Protection of the Eye Lens in Fluoroscopy-guided Interventional Procedures. Interv. Radiol. 2022, 7, 44–48. [Google Scholar] [CrossRef] [PubMed]
  9. Galster, M.; Guhl, C.; Uder, M.; Adamus, R. Exposition der Augenlinse des Untersuchers und Effizienz der Strahlenschutzmittel bei fluoroskopischen Interventionen. RoFo 2013, 185, 474–481. [Google Scholar] [CrossRef] [PubMed]
  10. Jonathan, T.; Stephen, R.; Daniel, R.B. A prototype software system for intra-procedural staff dose monitoring and virtual reality training for fluoroscopically guided interventional procedures. J. Digit. Imaging 2023, 36, 1091–1109. [Google Scholar] [CrossRef]
  11. Troville, J.; Rudin, S.; Bednarek, D.R. Estimating Compton scatter distributions with a regressional neural network for use in a real-time staff dose management system for fluoroscopic procedures. In Proceedings of the SPIE International Society for Optical Engineering, Online, 27 June–1 July 2021; Volume 11595. [Google Scholar] [CrossRef]
  12. Fujibuchi, T.; Nakashima, M.; Arakawa, H.; Miyazaki, H.; Anam, C. Evaluation of radiation protection effectivity in a cardiac angiography room using visualized scattered radiation distribution. J. Radiol. Prot. 2024, 44, 031510. [Google Scholar] [CrossRef] [PubMed]
  13. Abdelrahman, M.; Lombardo, P.; Camp, A.; Duch, M.A.; Phillips, C.; Seret, A.; Vanhavere, F. A parametric study of occupational radiation dose in interventional radiology by Monte-Carlo simulations. Phys. Med. 2020, 78, 58–70. [Google Scholar] [CrossRef] [PubMed]
  14. Hizukuri, K.; Fujibuchi, T.; Han, D.; Arakawa, H.; Furuta, T. Directional vector-based quick evaluation method for protective plate effects in X-ray fluoroscopy (DQPEX). Radiol. Phys. Technol. 2024, 18, 196–208. [Google Scholar] [CrossRef] [PubMed]
  15. Bontempi, M.; Andreani, L.; Rossi, P.L.; Visani, A. Monte Carlo simulator of realistic x-ray beam for diagnostic applications. Med. Phys. 2010, 37, 4201–4209. [Google Scholar] [CrossRef] [PubMed]
  16. Alnewaini, Z.; Langer, E.; Schaber, P.; David, M.; Kretz, D.; Steil, V.; Hesser, J. Real-time, ray casting-based scatter dose estimation for c-arm x-ray system. J. Appl. Clin. Med. Phys. 2017, 18, 144–1153. [Google Scholar] [CrossRef] [PubMed]
  17. Sato, T.; Iwamoto, Y.; Hashimoto, S.; Ogawa, T.; Furuta, T.; Abe, S.I.; Kai, T.; Matsuya, Y.; Matsuda, N.; Hirata, Y.; et al. Recent improvements of the Particle and Heavy Ion Transport code System—PHITS version 3.33. J. Nucl. Sci. Technol. 2024, 61, 127–135. [Google Scholar] [CrossRef]
  18. Hirayama, H.; Namito, Y.; Bielajew, A.F.; Wilderman, S.J.; Nelson, W.R. The EGS5 code system SLAC-R-730 and KEK Report 2005–8. Stanford (California) and Tsukuba: SLAC and KEK; 2005. Available online: https://rcwww.kek.jp/research/egs/egs5_manual/slac730-150228.pdf (accessed on 10 March 2025).
  19. ICRP. Adult Reference Computational Phantoms. ICRP Publication 110. Ann. ICRP 2009, 39, 1–164. [Google Scholar] [CrossRef]
  20. Sakai, M.; Fujibuchi, T.; Lee, H.; Han, D. Imaging of scattered radiation sources in X-ray radiography using a semiconductor radiation visualization camera. Radiol. Phys. Technol. 2024, 18, 308–315. [Google Scholar] [CrossRef] [PubMed]
Figure 1. Scattered dose evaluation points in the virtual X-ray examination room.
Information 16 00266 g001
Figure 2. Visualization of directional vector information of scattered radiation.
Information 16 00266 g002
Figure 3. Ratio of the ray tracing calculation to the Monte Carlo calculation. The horizontal axis shows the x- and z-axis coordinates: (a) 0.5 m on the right side of the patient (X-ray unit support side), (b) 0.5 m on the left side of the patient, and (c) 1.5 m on the left side of the patient. The vertical axis is the ratio of the ray tracing-calculated dose to the Monte Carlo-calculated dose. The legend shows the height from the floor in meters.
Information 16 00266 g003
Figure 4. Distribution of scattered radiation in the same cross-section by Monte Carlo simulation and ray tracing calculation. (Left): Monte Carlo simulation; (Right): ray tracing calculation. Sagittal cross-section of the patient at x = 0.3. The unit is μSv/mGy, which means the personal dose equivalent (μSv) at each part of the staff per 1 mGy of patient entrance surface dose.
Information 16 00266 g004
Figure 5. Ray tracing application for displaying scattered radiation distribution. Operator 1 is the physician shown in the foreground. Operator 1 is located on the left side of the patient near the patient’s chest, operator 2 is located on the left side of the patient near the patient’s thigh, and operator 3 is located on the right side of the patient near the patient’s head.
Information 16 00266 g005
Figure 6. Scattered radiation distribution calculated by the system in a patient cross-section. (Left) the medical staff member is positioned 57 cm to the left of the patient center; (Right) the medical staff member is positioned 103 cm to the right of the patient center. The dose is reduced behind the medical staff.
Information 16 00266 g006
Figure 7. Scattered radiation distribution by the position and tilt of the radiation protective plate. The 3D scattered radiation calculation allows us to display any cross-section from any angle. The location of the radiation protective plate is indicated by the red arrow.
Information 16 00266 g007
Figure 8. Scattered radiation distribution calculated by the system in the sagittal section of the patient. The 3D scattered radiation calculation enables us to display any cross-section from any angle.
Information 16 00266 g008
Table 1. Development environment of the system.
SpecificationsModels
Operation systemWindows 10 64-bit Education
Central processing unit (CPU)Intel Core i9-9980
Memory32 GB
Graphical processing unit (GPU)GeForce RTX 2080 Ti
GPU m11 GB
SoftwareUnity 2020.3.30.f1
Unity DOTS
Disclaimer/Publisher’s Note: The statements, opinions and data contained in all publications are solely those of the individual author(s) and contributor(s) and not of MDPI and/or the editor(s). MDPI and/or the editor(s) disclaim responsibility for any injury to people or property resulting from any ideas, methods, instructions or products referred to in the content.

