Abstract
Innovation is recognized as a key source of competitive advantage for organizations and a driver of societal well-being. Therefore, managing and quantifying innovation is necessary to fully leverage its potential. Although many innovation measurement tools exist, contextual differences limit their applicability, highlighting the need for tools tailored to regional and national specificities. This study aimed to develop a measurement tool for the Ecuadorian context, utilizing the Capacities, Results, and Impacts (CRI) model questionnaire for data collection and Item Response Theory (IRT) as a processing method. The CRI model offers a comprehensive framework for assessing innovation potential, enabling a dynamic understanding of this potential while highlighting nuances specific to regional contexts, particularly in Ecuador. Complementing this, IRT—a statistical framework for measuring latent traits—offers several advantages over classical methodologies, such as Classical Test Theory (CTT) and simple aggregate scoring methods. Unlike classical approaches, which often lack precision at extreme ability levels and are heavily sample-dependent, IRT provides item-level analysis, ensures parameter invariance across samples, and maintains accuracy across a wide range of latent trait levels. Together, these methodologies ensure a highly reliable and context-specific innovation measurement tool. Six IRT models were fitted using data from a national multisector sample of 321 organizations, providing a multidimensional measurement scale specialized in measuring innovation potential in Ecuador. These scales were later applied in a case study on the Information and Communication Technology (ICT) sector in Quito, Ecuador. The findings showed that ICT organizations had higher innovation potential than other industries in Ecuador but faced weaknesses in areas like access to funding. Based on these results, targeted strategies were proposed to address these weaknesses and foster innovation within the ICT sector. This research contributes to the field of managing innovation in Ecuador and the broader Latin American region by developing a context-specific and adaptable tool to benchmark innovation, guide organizational strategies, and shape public policy. While the ICT sector was identified as a key driver for addressing Ecuador’s innovation challenges, this research provides valuable contributions toward tackling these challenges and fostering innovation in the country.
1. Introduction
Innovation serves as a cornerstone of business strategy, enabling organizations to thrive in competitive markets by fostering differentiation, creating value, and ensuring long-term sustainability.
Business strategy focuses on setting goals, charting actionable plans, and allocating resources to achieve objectives while adapting to technological advancements, economic changes, and competitive pressures [1]. Integrating innovation into these strategies allows organizations to meet customer needs, improve efficiency, and build resilience, ultimately creating competitive advantages. These advantages extend beyond immediate gains to include long-term capabilities, such as employee expertise, robust infrastructure, and strong brand equity [2]. In today’s globalized and technology-driven markets, where competitors can rapidly replicate or surpass innovations, continuous innovation is vital for sustaining this edge [3]. Explicit management structures dedicated to fostering innovation are essential for aligning organizational capabilities with dynamic market demands, ensuring long-term growth and leadership.
Beyond organizational success, innovation serves as a critical driver of economic growth and societal well-being [4,5,6]. It enhances living standards through advancements in healthcare, transportation, and education, while addressing global challenges like climate change, resource scarcity, and public health crises through sustainable practices and green technologies [7]. By aligning economic growth with social and ecological objectives, innovation contributes to achieving the Sustainable Development Goals. Empirical evidence shows that countries with higher innovation rates experience greater economic performance, as technological advancements drive productivity and competitiveness [8]. Governments play a key role in fostering innovation by designing policies that strengthen National Innovation Systems, encouraging private enterprises to build competitive advantage through innovative solutions rather than relying on low wages or subsidies that may hinder development [9]. Moreover, sustainable innovation, such as environmental technologies, not only addresses social and ecological objectives but can also enhance competitiveness by improving efficiency and reducing costs throughout product life cycles [7]. Thus, innovation is a cornerstone for nations to achieve balanced economic, social, and environmental progress.
Ecuador faces considerable challenges in fostering innovation across sectors, as evidenced by its declining rank on the Global Innovation Index, dropping from 98th in 2022 to 105th in 2024 [10,11,12]. While innovation spans various sectors, the industrial sector plays a pivotal role in shaping a country’s overall innovation performance. In Ecuador, limited industrial innovation significantly hinders broader innovation efforts. This is driven by several key factors, including inadequate investment in research and development (R&D), low foreign investment inflows, weak innovation linkages reflected in minimal collaboration between public research institutions and industry, and limited participation in joint ventures or strategic alliances. These deficiencies contribute to an overreliance on commodities and low-value manufacturing, which restrict the growth of knowledge-intensive and creative industries. Collectively, these challenges highlight Ecuador’s struggle to transition toward an innovation-driven economy [12].
The challenges faced by Ecuadorian organizations in fostering innovation highlight the urgent need for targeted strategies to drive economic growth and enhance competitiveness. Within this context, the ICT industry stands out as a sector with significant potential to address these gaps. As highlighted in the Global Innovation Index report, Ecuador demonstrates an openness to integrating high-tech solutions, as reflected in its ranking for high-tech imports [12]. Globally, the ICT industry is recognized as a cornerstone of modern development, driving transformative advancements through technologies such as artificial intelligence, cloud computing, big data analytics, and the Internet of Things. These innovations are reshaping social, economic, and political landscapes, fueling digital transformation across sectors ranging from medicine to robotics [13,14,15].
ICT’s unique attributes, including rapid product cycles, global market access, and cost-efficient digital product development, have positioned it as one of the most competitive and influential industries [16,17]. In Ecuador, particularly in Quito, the ICT industry represents a promising opportunity for innovation and economic growth. With over 2000 companies generating annual sales of $2.2 billion and providing nearly 23,000 jobs, the sector accounts for more than half of the national ICT market share [18]. Although its contribution to the national Gross Domestic Product (GDP) is relatively modest at 2%, the ICT industry holds strategic potential to transition Ecuador toward an innovation-driven economy. This research focuses on the ICT sector as a case study, analyzing specific strategies to unlock its innovation potential, given its pivotal role in global development and its untapped capacity to drive sustainable growth and competitiveness in Ecuador.
Addressing innovation challenges within organizations requires explicit management of innovation, with the measurement of innovation serving as a critical component. Effective measurement enables the identification of key gaps, the setting of strategic objectives, and the allocation of resources to foster competitiveness and national development. However, many existing innovation assessment methodologies, designed primarily for advanced economies, fail to capture the unique socioeconomic conditions of developing countries like Ecuador [19,20]. To address these issues, measurement criteria must be systematized, and standardized procedures established to enable international comparisons while accounting for regional and national specificities, such as market structures, organizational size, and cultural factors [4]. For example, differences between manufacturing and service-based organizations must be considered to ensure that measurement tools accurately reflect the realities of target organizations. By incorporating additional indicators that capture local nuances, these tools can more effectively evaluate the impact of innovation on national development and advance progress tailored to Ecuador’s unique context.
The development of measurement tools has traditionally relied on Classical Test Theory (CTT), valued for its simplicity and minimal technical requirements [21]. CTT operates on a linear scoring model, where the observed score is considered a sum of the true construct value and measurement error, assuming the mean of these errors is zero. Consequently, the average item score is treated as a representation of the true construct value [22]. Despite these advantages, CTT has critical limitations that undermine its broader applicability. One key weakness lies in its dependency on sample characteristics during the item discrimination process. For instance, in samples with high ability levels, selected items tend to exhibit higher difficulty (higher p-values), leading to what is termed the “group heterogeneity effect on correlation coefficients”. This issue restricts the utility of CTT-based tools to populations closely resembling the validation sample, limiting their generalizability. Additionally, CTT assumes uniform precision across all levels of the latent trait, making tests optimal for individuals with moderate trait levels but less accurate for those with extreme (low or high) levels. These inconsistencies in precision, coupled with challenges in measuring diverse populations effectively, highlight significant shortcomings in CTT-based scales [22].
This study seeks to address two key challenges in assessing innovation potential within Ecuadorian technology companies. First, it introduces the use of the CRI model questionnaire as a measurement tool specifically contextualized to the region, ensuring that the unique organizational and environmental factors of the local context are accurately represented. Second, it adopts Item Response Theory (IRT) as the analytical framework, which provides a more precise and adaptive alternative to CTT. Unlike CTT, IRT resolves critical limitations such as the dependency on sample-specific characteristics and the assumption of uniform measurement precision across all levels of the latent trait. By employing IRT, this study enhances the reliability and applicability of innovation measurement tools, fostering a deeper understanding of innovation potential. This integrated approach not only addresses the methodological gaps but also contributes to Ecuador’s broader developmental goals by enabling the design of innovation-driven policies. Furthermore, it equips organizations with actionable insights to align their strategies with innovation objectives, thereby strengthening their competitiveness and fostering sustainable industrial growth.
The paper is structured as follows: Section 1 presents the theoretical framework, discussing the strategic importance of innovation, its measurement, and the features of IRT. Section 2 outlines the methodology used to construct the proposed assessment tool, detailing the application of IRT to derive multidimensional indices of innovation potential. Section 3 presents the results of applying this tool to ICT companies in Quito and offers recommendations for the sector. Finally, Section 4 concludes with key findings, implications for innovation management, and suggestions for future research.
Literature Review
The literature on innovation measurement is extensive, with significant contributions focusing on tools and frameworks tailored for developed economies. However, there is a notable gap in methodologies designed for developing countries, where contextual factors such as resource constraints and socio-economic challenges significantly impact innovation outcomes. Additionally, the use of IRT in this context remains largely unexplored.
Edison et al. (2013) [23] conducted a comprehensive review of innovation measurement methodologies across seven major academic databases (Inspec, Compendex, Scopus, IEEEXplore, ACM Digital Library, ScienceDirect, and Business Source Premiere), analyzing 13,401 articles published between 1949 and 2010. Their study identified 232 unique metrics, with the majority (88%) focused on organizational-level innovation, while fewer metrics addressed regional or national contexts (11%), and even fewer targeted the industry level (1%). These findings emphasize the dominant focus on organizational innovation in existing methodologies, revealing significant gaps in metrics designed for broader systemic or sectoral evaluations—gaps that are crucial to address for aligning innovation strategies with national and industrial objectives.
Most of the tools created are designed for developed OECD countries, with only a limited number tailored to the needs of developing nations [19]. One of the most well-known tools globally is the Global Innovation Index, developed and maintained by Cornell University, INSEAD, and the World Intellectual Property Organization since 2007. Its most recent report, published in 2024, provides detailed parameters from 80 indicators regarding innovation drivers and outcomes for 131 countries (covering 93.5% of the global population) from several perspectives, such as political environment, infrastructure, education, and business development [24,25]. The objective of this index is to present a set of indicators that reflect national strengths and weaknesses, helping policymakers better understand innovation and develop policies to foster it.
Another well-known tool is the OECD’s STI Scoreboard, which provides data on 1000 indicators related to science, technology, and innovation for around 60 countries across various regions. This tool does not provide a general index but presents individual information on each indicator within six main areas: research and development, science, business innovation, intellectual property, economy, and labor force [4,26].
The European Innovation Scoreboard (EIS) is an analytical tool developed by the European Commission to provide a comparative assessment of the research and innovation performance of EU Member States and selected non-EU countries. It examines a wide array of indicators grouped into categories like framework conditions (e.g., human resources, innovation-friendly environment), investments (e.g., finance, support, and firm investments), and innovation activities (e.g., linkages, firm activities, and intellectual assets). The primary aim of the EIS is to help policymakers understand the strengths and weaknesses in their national innovation systems and craft targeted policies to enhance innovation performance [27].
The Bloomberg Innovation Index evaluates countries’ innovation capacities through a composite score derived from various metrics such as R&D intensity, manufacturing capability, productivity, patent activity, and the concentration of high-tech public companies. This index emphasizes economic and business aspects of innovation, focusing on how innovation translates into tangible outcomes like productivity and technological advancements [28].
The Oslo Manual provides guidelines for research and experimentation on innovation measurement, primarily for the private sector but also including information for all sectors of society: private, public, nonprofit, and households. The Oslo Manual analyzes various elements of innovation, such as innovation activities (research, intangible acquisition, marketing, engineering, design, training), innovation capabilities (organization size, assets, time in market, human resources, intellectual property), external factors (market collaboration, intermediaries, regulations, government programs, public infrastructure, macroeconomic environment), innovation objectives, and outcomes [4]. The manual aims to promote standardization and facilitate international comparability. First published in 1992, four editions have been released to date, the most recent in 2018.
In Latin America and the Caribbean, the Bogotá Manual [29] is a regional attempt to systematize innovation measurement, aimed at capturing the specific characteristics of these regions that are not covered by the Oslo Manual. It analyzes the elements that should be included in Latin American innovation indices, such as technological capabilities, information sources for innovation, funding, government policies, social processes, quality management, and environmental management, integrating them into a unified set of indicators.
In Ecuador, the National Innovation Activities Survey was an attempt to develop a local innovation measurement methodology and tool under international parameters, based on the need to understand the state of innovation in the country, identify its strengths and weaknesses, and develop action plans and strategies for knowledge-based development leading to social, economic, and environmental growth. Its methodology follows guidelines from OECD-developed manuals, including the Oslo and Frascati Manuals [30,31]. This survey uses a set of indicators to evaluate organizations in areas such as innovation expenditure levels, use of support programs, human resource qualifications, funding, export intensity, information sources, and intellectual property. Similar local initiatives have been developed in Colombia, Argentina, Brazil, and other Latin American countries by government entities [30]. While this government initiative provides a macro view of Ecuador’s national innovation system, it does not effectively capture the innovation context of Ecuadorian organizations [20].
In the Ecuadorian context, other recent initiatives for innovation quantification have also emerged from non-governmental entities. One such initiative is the Innómetro, developed by the Alliance for Entrepreneurship and Innovation (AEI), a network of public, private, and academic actors, which aims to diagnose the level of innovation within organizations, identify strengths and opportunities, and create a roadmap for achieving objectives [32]. Another initiative is Deloitte’s surveys of business leaders to understand the culture of innovation in Ecuadorian organizations, using indicators such as innovation budgets, reasons for innovation, priorities, customer influence, organizational growth, and idea-generation processes [33]. Both initiatives rely on methodologies that are not publicly available and are exclusive to the entities developing the tools. Another study, conducted by Robalino-López et al. (2017) [34], builds on the guidelines of the Oslo Manual, the Bogotá Manual, and the analytical framework of Camio et al. (2015) [35], this academic initiative aims to provide Ecuadorian organizations with an innovation assessment model, known as CRI, which aligns with standardized international methodologies while accounting for the socio-economic structures of the local context. The CRI model questionnaire is employed in this research as a data collection method.
IRT has been continuously developed and refined since the 1930s, but its practical application had to wait until recent computational advances due to its high processing demands [21,36]. Despite these advances, the literature on the application of IRT in organizational studies remains limited, with most work concentrating on psychometrics, such as aptitude and personality assessments. Approaches of IRT applied in organizational and innovation contexts include measuring open innovation in Italian organizations [37], constructing the Berkeley Innovation Index for measuring individual innovation capabilities [38], assessing innovation capabilities of students [39], and measuring individual employee creativity, workplace atmosphere, and workplace innovative activity [40].
2. Methodology
This Section outlines the sequence of steps taken to achieve the research objective. First, data were gathered through the administration of the CRI model questionnaire to a national multisectoral sample. The collected data were then used to calibrate IRT models, representing the innovation behavior of organizations at the national level and resulting in a multidimensional measurement scale for innovation potential. Finally, this multidimensional scale was applied in a case study that analyzed a group of organizations from the information and communication technology sector in Quito, Ecuador.
2.1. Data Collection from a National Multisector Sample
This study required data from organizations across Ecuador to calibrate the innovation potential measurement scale. These data were collected using a questionnaire from the CRI Model, an assessment model specifically designed to measure the innovation potential of organizations within the Ecuadorian context [20,34,41]. To understand the innovation process, the model approaches it from the perspective of certain organizational characteristics that enable the achievement of specific outcomes. In the model proposed by these authors, innovation potential is viewed not as a static organizational characteristic but as a dynamic process encompassing three constructs: innovation capabilities, innovation outcomes, and the impacts arising from the innovation process, as described by Morales and Robalino-López (2019) [20].
The measurement model conceptualizes innovation through a three-level abstraction scheme. The zeroth level of the model is the main construct, termed “Innovation Potential”. This main construct is represented by three secondary constructs: Innovation Capabilities, Innovation Outcomes, and Innovation Impacts (CRI). At the first level, the secondary construct, Capabilities, consists of four factors: sources of information, sources of funding, innovation activities, and innovation objectives. In contrast, the secondary constructs Outcomes and Impacts are not subdivided into factors, implying that they each consist of a single factor. The second level comprises observed variables for each first-level factor, represented by the questionnaire items, as illustrated in Figure 1. The questionnaire is shown in Appendix A.
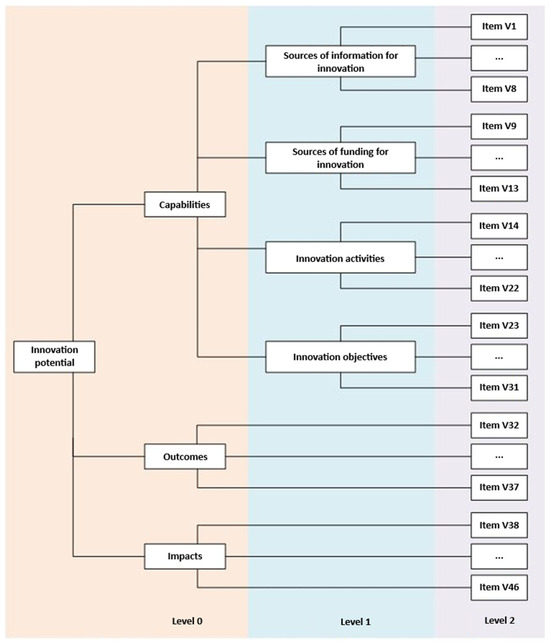
Figure 1.
Configuration of the CRI model. Adapted from “Propuesta metodológica para la medición del potencial de innovación en las organizaciones ecuatorianas” by Morales and Robalino-López, 2019 [20].
The CRI questionnaire was applied to organizations from various industries in Ecuador. A total of 325 organizations participated in the study. After excluding 4 responses due to evident irregularities, 321 valid questionnaire answers were selected and utilized for the calibration of the IRT models. To minimize potential selection bias due to social desirability, the non-commercial and strictly academic nature of the questionnaire was emphasized. Participants were informed about the benefits of quantifying their organization’s innovation potential. To ensure data quality, clear instructions and concise explanations of each CRI construct and factor were provided. This additional information helped respondents understand the purpose and context of the questionnaire, fostering accurate and reliable responses.
Figure 2 visually represents the percentage distribution of different sectors within the national multisectoral sample. The chart highlights the diverse economic landscape of Ecuador, where ‘Others’ represent a conglomerate of smaller sectors, accounting for 37.9%. Significant contributions come from ‘Technical and Scientific Services’ (18.8%), as well as sectors like ‘Manufacturing’ (10.8%) and ‘Information and Communication’ (9.8%). This distribution underscores the prominence of certain sectors while emphasizing the heterogeneity of the dataset.
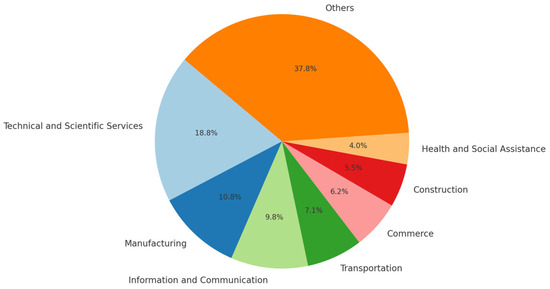
Figure 2.
Distribution of National Multisectoral organizations by Sector.
Figure 3 illustrates the regional distribution of organizations participating in the study across Ecuador’s provinces, highlighting the concentration of activity in specific areas. The province of Pichincha accounts for the largest share at 36%, followed by Guayas with 24.6%. Together, these two provinces, which are home to Ecuador’s largest cities, Quito and Guayaquil, encompass a significant portion of the population and economic activity. “Others”, representing a mix of smaller provinces, contributes 23.7%, while provinces like Azuay (4.3%), Manabí (4.0%), Loja (3.7%), and Tungurahua (3.7%) make up smaller but still notable shares.
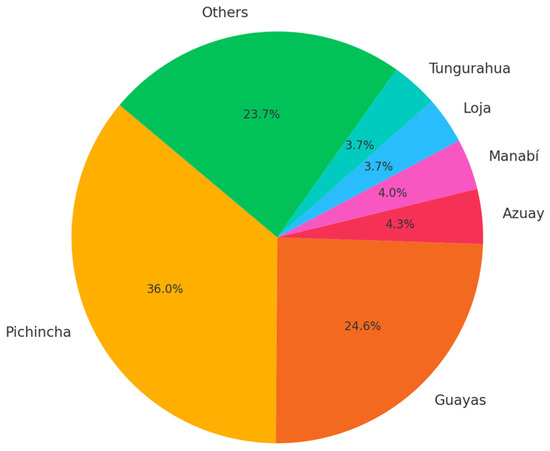
Figure 3.
Distribution of National Multisectoral organizations by Province.
2.2. IRT Model Calibration
To provide a more comprehensive description of innovation potential, a single index quantifying an organization is insufficient. Instead, a multidimensional set of indicators is required to more broadly assess organizational performance [20]. Consequently, multiple IRT models were utilized to ensure a multidimensional measurement of innovation potential, with each dimension represented by an individual IRT model. To measure innovation potential using the CRI model, one IRT model is necessary for each CRI model factor: sources of information, sources of funding, innovation activities, innovation objectives, innovation outcomes, and innovation impacts, resulting in a total of six models. The choice of the IRT model was guided by the test’s characteristics. The test features ordinal responses captured using a polarized 4-point Likert scale (ranging from 0 to 3), which measures the level of the latent trait represented by each test item. It also has a multidimensional structure, as the CRI model comprises three constructs—Capabilities, Outcomes, and Impacts—that collectively represent Innovation Potential. Furthermore, the Capabilities construct is subdivided into four factors: sources of information, sources of funding, innovation activities, and innovation objectives. Given these characteristics, the Graded Response Model (GRM) was chosen as the unidimensional IRT model for the secondary constructs Innovation Outcomes and Innovation Impacts, as well as for the four factors within the Innovation Capabilities dimension: sources of information, sources of funding, innovation activities, and innovation objectives [36].
GRM is capable of handling items with more than two response categories or options, known as polytomous items. In addition to the item difficulty parameter, the GRM incorporates an additional parameter: the item slope. The GRM uses a cumulative response approach to model the probability of responding to category k or higher [36]. The mathematical function governing this model is presented in Equation (1).
where is the cumulative response probability for responding in category k for item i, is the response of person j in category k or higher for item i, is the latent trait of person j, is the threshold parameter for category k or higher of item i, is the slope or discrimination parameter of item i, and is the category.
Derived from the data gathered through the questionnaire administered to a national multisectoral sample of 321 organizations. Six IRT models were obtained, each representing one of the innovation potential factors: sources of information, sources of funding, innovation activities, innovation objectives, innovation outcomes, and innovation impacts. These models provide a representation of the innovation behavior of the Ecuadorian organization sample.
In the context of Item Response Theory (IRT), the Test Information Function (TIF) provides a viable alternative to the concept of reliability, which is central to Classical Test Theory. The TIF is defined as a measure of the precision of a test at different levels of the latent trait (). It aggregates the information provided by individual items, offering a detailed and dynamic perspective on measurement precision. Unlike the single, static reliability coefficient of Classical Test Theory, such as Cronbach’s alpha, information functions in IRT are independent of any specific group of examinees. Instead, they provide dynamic measurement precision values across all levels of the latent trait (). Equation (2) expresses the definition of TIF [42].
where reflects how likely a respondent at is to succeed on the item, is the first derivative of and is the complement probability .
Standard errors are a measure of uncertainty in estimating an individual’s latent trait , and is related to Information Function according to Equation (3). Higher TIF values indicate greater precision and correspond to lower standard errors at specific levels of the latent trait [20].
Higher values indicate greater measurement precision, as they correspond to lower ), reflecting reduced uncertainty in estimating the latent trait. Thresholds for were interpreted based on established guidelines: a value of ≥ 10 represents high precision, 4 ≤ < 10 represents moderate precision, and < 4 indicates low precision. Similarly, values below 0.3 are considered indicative of highly precise measurements, whereas > 0.5 reflects reduced precision [21].
The Test Information Function (TIF) and its corresponding Standard Error values were calculated across different levels of the latent trait for each construct and are summarized in Table 1.

Table 1.
Test Information Function values for each CRI construct.
Validity refers to the degree to which a test or questionnaire measures the theoretical construct it is intended to measure. In Item Response Theory (IRT), validation involves ensuring that the mathematical model and its Item Characteristic Curves (ICCs) adequately fit the response data collected for each item. This ensures that the model appropriately represents the relationship between the latent trait and the probability of correctly answering an item [22], thereby supporting the correct interpretation of latent trait scores.
The method used to evaluate model fit depends on the characteristics of the data and the model being assessed. The M2 Limited Information Test was selected for cases where the data were well behaved, and bivariate marginal tables provided sufficient information to evaluate fit. Conversely, the C2 Limited Information Test was used in cases where higher-order dependencies were necessary, such as when data sparsity or extreme response patterns were present. The C2 test provides a more nuanced assessment of fit, making it particularly suitable for scenarios involving greater data or model complexity [36,43,44].
To process IRT models, the use of a computer is always necessary, as these calculations are too complex and impractical to perform manually. For processing the IRT models, the statistical software R (version 3.5.3) and the Multidimensional Item Response Theory (MIRT) library (version 1.28) were used.
Table 2 presents the results of the goodness-of-fit tests for the IRT models applied to each factor of the CRI model.

Table 2.
Goodness-of-fit test results for the IRT models.
Since a distinct IRT model was obtained for each of the six factors of the CRI model, the scales derived from these models are also distinct and independent of one another.
Once all test items are confirmed to fit the model appropriately, the scale is considered calibrated and ready to be applied to other subjects using the established parameters to calculate their latent trait levels [45]. This set of six models now forms the CRI-IRT multidimensional scale, suitable for measuring the innovation potential of any Ecuadorian organization. The results from this scale provide a benchmark, allowing organizations to compare their performance against the multisectoral sample. Figure 4 illustrates the range of each scale.
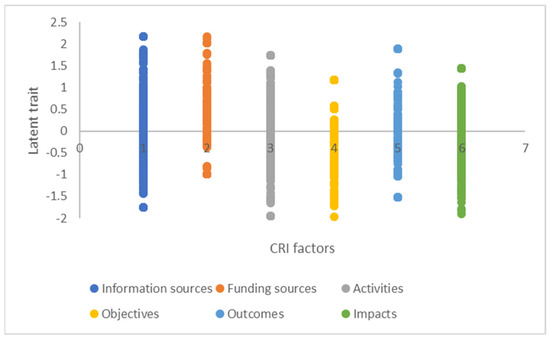
Figure 4.
Latent trait distribution for the six factors of the CRI model among the 321 organizations in the national multisectoral sample.
2.3. Data Collection from an ICT Organization Sample
The CRI-IRT multidimensional scale was applied to a specific use case: organizations in the information and communication technology (ICT) industry in Quito, Ecuador, to measure their innovation potential within the context of Ecuadorian organizations.
The ICT sector under study was defined using Ecuador’s standardized economic activities classification, known as the “Clasificación Internacional Industrial Uniforme” (CIIU) 4.0. This classification system categorizes and standardizes the country’s economic data to ensure both national and international comparability. Within this framework, the ICT sector falls under Section ‘J’ or ‘Information and Communication’. Specifically, the categories analyzed include J61 (‘Telecommunications’), J62 (‘Computer programming, consultancy, and related activities’), and J63 (‘Information service activities’) [46].
Data collection using the CRI questionnaire for ICT organizations in Quito was conducted between November 2021 and June 2022. The questionnaire with a time duration of around 10 to 15 min was administered to one individual per organization. Respondents were selected based on their managerial roles at mid- and senior levels, including positions such as technology manager, operations manager, commercial manager, and general manager.
The questionnaire was distributed to representatives of each accessible institution with the logistical support of the Cámara de Innovación y Tecnología Ecuatoriana. Distribution was carried out through broadcast communications on social networks and direct mailing. To minimize response bias related to social desirability, the non-commercial and strictly academic nature of the research was emphasized. An informed consent form, including a confidentiality and privacy clause, was provided. Furthermore, all communications clearly identified the institution conducting the research. To ensure the quality of responses, the questionnaire included clear instructions and summarized information about each item and the constructs of the CRI model.
Data were collected from 37 companies in Quito. After excluding 4 responses due to evident loopholes, 33 valid questionnaires were included in the analysis. A non-probabilistic convenience sampling method, combined with a snowball technique, was employed due to practical constraints such as participant accessibility and the exploratory nature of the study, which aimed to test a new methodology. Although this sample size is not statistically representative of the population—Quito records a total of 2080 companies in the J61, J62, and J63 segments [18]—and may present homogeneity bias, particularly the underrepresentation of subgroups compared to the population of interest, it was selected as a pilot case study to evaluate the feasibility and applicability of the CRI-IRT methodology. This approach also aimed to formulate a hypothesis about the behavior of ICT organizations, providing a preliminary understanding of specific phenomenon trends. This assessment provides useful insights even when applied to a single organization, as it generates scores that help determine innovation potential and offer a benchmark against national multisectoral behavior [47].
Future large-scale studies could adopt representative sampling methods to generalize findings and explore broader implications.
2.4. Estimation of Individual Latent Traits for ICT Organizations in Quito
To estimate the latent trait, the MIRT library uses the Expected A Posteriori (EAP) estimator, which is based on Bayesian principles. EAP combines prior information and observed data to compute the expected value of the latent trait θ (the individual’s ability or trait level) from its posterior distribution. The continuous latent trait distribution is approximated using discrete quadrature points and corresponding weights , as shown in Equation (4) [36].
where is the estimated latent trait or ability score for an individual, are the associated weights of the quadrature points, and is the likelihood of observing the response pattern at each quadrature point.
Table 3 presents an example of the latent trait estimations obtained for an ICT organization in Quito.

Table 3.
Example of the latent trait estimations obtained for an ICT organization in Quito.
The multidimensional scale provides detailed insights into organizations’ innovation potential, enabling targeted assessments and benchmarking within the ICT sector.
2.5. Normalization of Latent Trait Values for ICT Organizations
By default, the MIRT library produces latent trait scales derived from the logistic function, with a mean of 0 and an approximate useful range between −6 and +6. However, these scales remain impractical for interpretation and application. Therefore, it is advisable to transform the scales into a more convenient range, such as a scale with a mean of 50 and a range of 100. This can be achieved through a linear transformation.
The transformation involves shifting the curve to the right so that the minimum possible value becomes 0, followed by rescaling the curve to normalize its values to a range of 0 to 100. This transformation is performed by applying Equation (5) to the latent trait value provided by the “mirt” library.
where is the latent trait value from the MIRT library, is the maximum value of the scale from the MIRT library, is the minimum value of the scale from the MIRT library, and is the transformed and rescaled latent trait value.
Figure 5 illustrates the relationship described by this transformation.
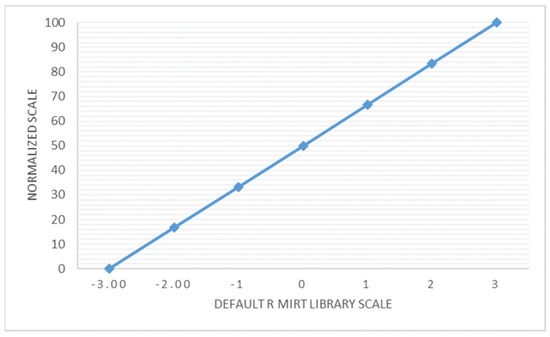
Figure 5.
Example of Normalizing Latent Trait Values.
3. Results
This Section presents the results of applying the CRI-IRT model to measure innovation potential in Ecuadorian ICT companies, with a specific focus on deriving actionable insights and validating the tool’s adaptability to regional contexts.
3.1. Results from Applying the CRI Questionnaire to ICT Organizations
A total of 33 organizations participated in this study, all based in the Pichincha province of Ecuador. The majority (63.6%) identified their primary activities as belonging to the Technical and Scientific Services sector. Other sectors represented included Information Technology Services, Telecommunications, Consulting and Business Services, and Other Sectors. Although some organizations self-identified as belonging to sectors outside of ICT, their services generally involve developing or providing digital technology to support these sectors. Figure 6 illustrates the distribution of organizations within the ICT sector in Ecuador.
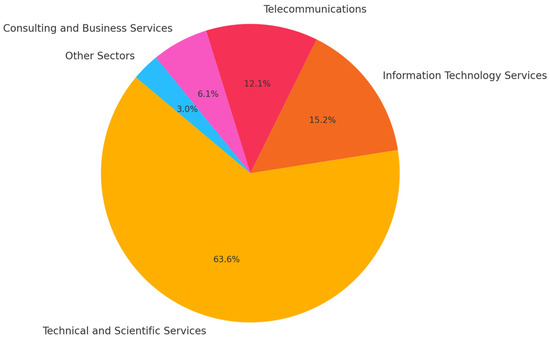
Figure 6.
Distribution of ICT organizations by Sector.
In terms of organizational size, 42.4% of respondents indicated having fewer than 10 employees, followed by organizations with 10–49 employees and 50–99 employees. This indicates a predominance of small- and medium-sized enterprises (SMEs) within the sample, as shown in Figure 7.
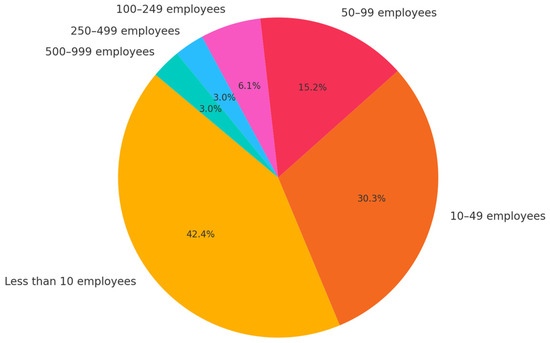
Figure 7.
Distribution of ICT Organizations by Number of Employees.
As shown in Figure 8, 63.6% of respondents hold high-level decision-making roles, such as Directors or Managers. The remaining respondents include individuals in senior executive and mid-level positions, providing a comprehensive perspective on organizational practices.
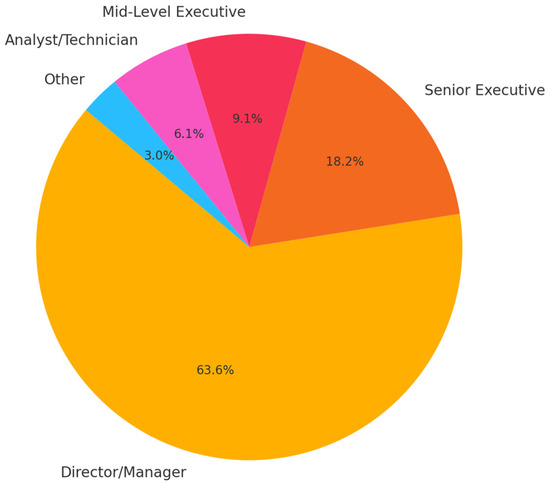
Figure 8.
Distribution of ICT Organization Respondents by Job Position.
The descriptive statistics for the item-level Likert scale responses are presented in Table 4. The analysis includes the frequency of responses for each category (Strongly Disagree, Disagree, Agree, Strongly Agree) along with the mean and standard deviation for each item. The mean provides a central measure of the respondents’ agreement or disagreement, while the standard deviation indicates the variability in responses. The range and distribution of mean values provide insights into the diversity of respondent perceptions and help identify specific items that represent the weaknesses or strengths.

Table 4.
Descriptive summary of ICT sector organizations’ responses to the CRI questionnaire at item level.
Table 5 summarizes the descriptive statistics for the constructs derived from the Likert scale responses. Each construct aggregates the responses of multiple related items, providing a higher-level overview of the participants’ perceptions. Constructs with higher mean scores, such as “Results” (3.52), indicate stronger agreement among respondents regarding the impact as a consequence of innovation. Conversely, constructs with lower mean scores, such as “Funding Sources” (2.39), reflect a more neutral or less favorable perception, highlighting potential areas of concern or lower engagement.

Table 5.
Descriptive summary of ICT sector organizations’ responses to the CRI questionnaire at the construct level.
3.2. Latent Trait of ICT Organizations
Latent trait values for each organization were obtained by processing the questionnaire responses using the CRI-IRT multidimensional scale. These values represent the level of the latent trait in the context of Ecuadorian organizations.
Results are summarized in Table 6. The procedure for calculating these innovation potential indicators is detailed in Section 2.4.

Table 6.
Latent Trait Values for ICT Organizations in Quito.
Since a distinct IRT mathematical model was obtained for each of the six factors in the CRI model, the scales derived from these models were also distinct and independent of one another. Figure 9 illustrates the range of each scale.
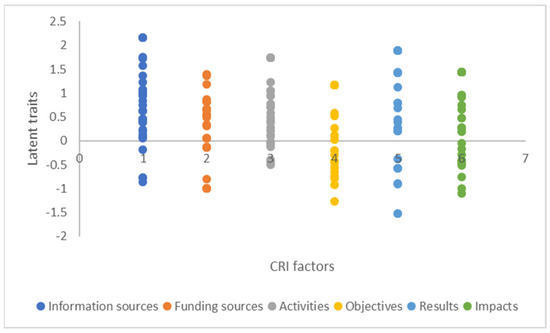
Figure 9.
Latent traits for the six factors of the CRI model for ICT organizations in Quito.
Figure 10 illustrates the distribution of latent trait values for six CRI factors across a multisectoral sample and the ICT sector. Each dot represents an individual organization’s score for the respective factor, measured using the CRI-IRT model. This figure highlights the relative strengths and weaknesses of the ICT sector compared to the broader multisectoral sample, emphasizing the sector’s potential as a leader in innovation while also pinpointing areas requiring targeted interventions, such as funding.
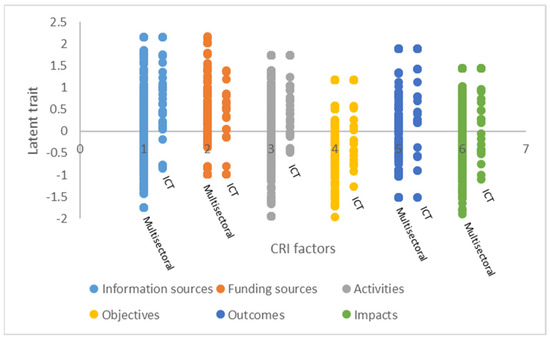
Figure 10.
Comparison of Latent Traits Across CRI Factors for Multisectoral and ICT Samples.
3.3. Normalized Values for Innovation Potential Indicators
Using the procedure described in Section 2.5 to transform the innovation potential indicators into a more practical scale (0 to 100), the normalized values of the indicators were determined for each ICT organization in Quito. The results are presented in Table 7.

Table 7.
Normalized Innovation Potential Indicators for ICT Sector Organizations in Quito.
Overall, the ICT sector in Quito exhibits high values for most innovation potential indicators, except for the Sources of Funding factor, where values trend toward medium levels. It is important to note that these indicators are directly related to the national multisectoral sample used to calibrate the models. Therefore, a tendency toward high values does not necessarily imply that ICT organizations possess excellent or adequate innovation potential; rather, it suggests that the ICT sector performs better in comparison to other industries in Ecuador.
3.3.1. Information Sources
Figure 11 reveals a skewed distribution, with the majority of ICT organizations in Quito displaying high latent trait values. The histogram demonstrates a pronounced concentration of organizations toward the upper end of the scale, indicating that most firms effectively leverage diverse information channels to fuel their innovation efforts. This performance suggests that many organizations in the sector have established strong networks for acquiring and utilizing external and internal knowledge.
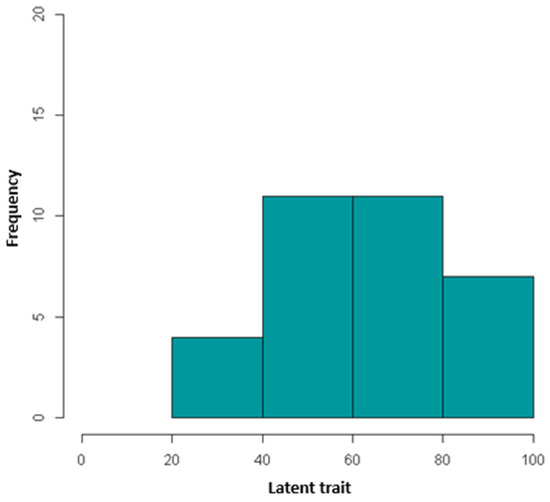
Figure 11.
Histogram of latent trait estimation for the Sources of Information factor.
However, the histogram also indicates the presence of a small number of organizations with lower latent trait scores, forming a leftward tail in the distribution. This suggests variability in the sector, with some entities potentially facing challenges in accessing or integrating information sources.
These findings underscore the need for targeted interventions to support underperforming organizations, such as capacity-building programs, improved access to information technologies, and the establishment of industry-wide knowledge-sharing platforms. By addressing these disparities, the ICT sector in Quito can further enhance its overall innovation potential and drive more inclusive growth.
3.3.2. Funding Sources
The results of the CRI-IRT model for the Funding Sources factor reveal a relatively balanced distribution with a slight skew toward lower latent trait values, as shown in Figure 12. This distribution highlights a central tendency in the sector, with most ICT organizations in Quito displaying moderate access to funding resources. However, the histogram indicates that a notable portion of organizations experience limited access to financial resources, as reflected by the leftward skew and clustering of lower scores.
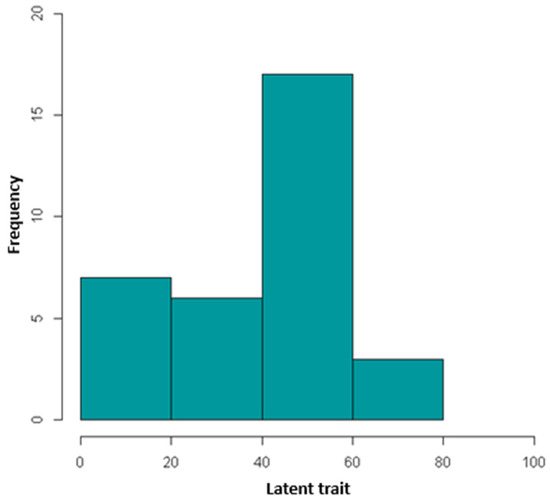
Figure 12.
Histogram of latent trait estimation for the Sources of Funding factor.
The central clustering of scores indicates that the funding situation for most firms is stable but not optimal. To address this, policies and initiatives focused on improving access to venture capital, enhancing public funding programs, and fostering partnerships with private investors are essential. Strengthening financial literacy and providing advisory services for funding applications could also support firms in navigating existing financial opportunities.
This finding suggests that while some firms in the ICT sector can secure funding to support their innovation activities, others face significant barriers. These barriers may include limited access to external capital, insufficient government support, or a lack of robust financial mechanisms tailored to the needs of innovative firms. Additionally, smaller firms and startups are likely more vulnerable to funding constraints, impacting their ability to invest in research and development, adopt new technologies, or scale their operations.
By alleviating funding disparities, the ICT sector in Quito can unlock greater innovation potential, ensuring that more organizations have the resources needed to pursue ambitious technological advancements and contribute to Ecuador’s broader economic development.
3.3.3. Activities for Innovation
The results of the CRI-IRT model for the Activities for Innovation factor exhibit a strong tendency toward high latent trait values, as illustrated in Figure 13. The histogram demonstrates a significant clustering of organizations at the upper end of the scale, indicating that many ICT organizations in Quito are actively engaging in innovation-related activities. These activities likely include research and development initiatives, product and process innovations, and collaboration with industry partners and academic institutions.
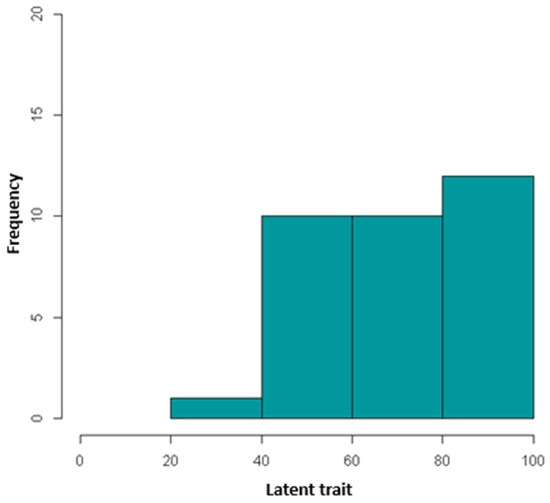
Figure 13.
Histogram of latent trait estimation for the Innovation Activities factor.
This positive trend highlights the sector’s proactive approach to fostering innovation, suggesting that most organizations have established processes and dedicated resources to support innovative endeavors. The prevalence of high scores also reflects the sector’s alignment with global technological trends, such as the adoption of artificial intelligence, big data, and cloud computing, which require ongoing innovation to remain competitive.
While the overall distribution is skewed toward higher values, the presence of a small number of organizations with lower scores indicates variability in the level of engagement in innovation activities. These outliers may represent firms facing internal or external constraints, such as resource limitations, a lack of skilled personnel, or insufficient organizational focus on innovation.
To build on this strength and address the disparities, strategies such as knowledge-sharing networks, government incentives for R&D, and industry-wide collaboration initiatives can be employed. These efforts can help underperforming organizations overcome barriers and enable the entire sector to achieve even greater levels of innovation activity. By maintaining and enhancing this strong emphasis on innovation activities, the ICT sector in Quito can solidify its role as a leader in technological advancement and contribute significantly to Ecuador’s innovation-driven economic growth.
3.3.4. Innovation Objectives
The results of the CRI-IRT model for the Innovation Objectives factor demonstrate a pronounced tendency toward high latent trait values, as depicted in Figure 14. The histogram reveals a clustering of scores near the upper end of the scale, indicating that most ICT organizations in Quito exhibit well-defined and ambitious innovation objectives. This trend underscores the sector’s commitment to strategic planning and goal-setting as critical drivers of innovation. These high scores suggest that organizations are actively prioritizing objectives such as enhancing product offerings, improving operational efficiencies, and increasing market competitiveness. The alignment of these goals with global technological trends further reflects the sector’s forward-thinking approach and its ability to adapt to the rapidly evolving digital landscape.
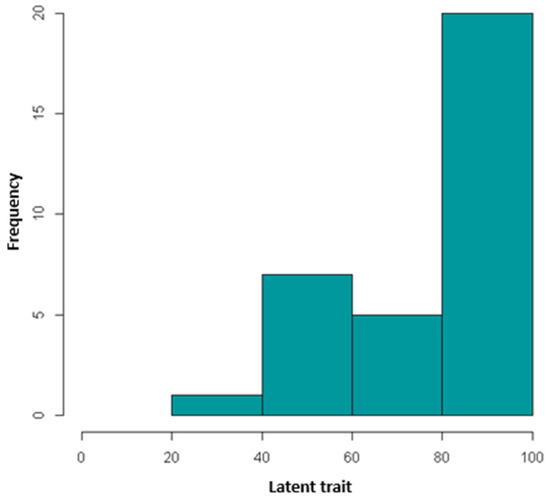
Figure 14.
Histogram of latent trait estimation for the Innovation Objectives factor.
However, the histogram also shows a slight central skew, indicating that some organizations have only moderately developed innovation objectives. This variability may stem from differences in organizational size, resource availability, or strategic focus, with smaller firms or those with limited innovation capacity potentially facing challenges in articulating clear and actionable objectives.
To address these disparities, sector-wide initiatives could focus on providing support for strategic innovation planning, such as workshops, mentorship programs, and access to innovation frameworks. Encouraging collaboration between firms and external stakeholders, including academia and government agencies, can also help organizations refine their innovation goals and align them with broader industry and national priorities.
By fostering a uniformly high level of innovation objectives, the ICT sector in Quito can enhance its overall strategic coherence, enabling more effective innovation efforts and contributing to sustained technological leadership and economic growth.
3.3.5. Innovation Results
As shown in Figure 15, the distribution of latent traits for Innovation Results exhibits a distinct pattern, with a concentration of organizations achieving high scores (80–100), while the middle and lower ranges are less populated. This suggests that a significant proportion of ICT organizations in Quito are achieving substantial outcomes from their innovation efforts, translating inputs into tangible results such as new products, improved processes, or market impact.
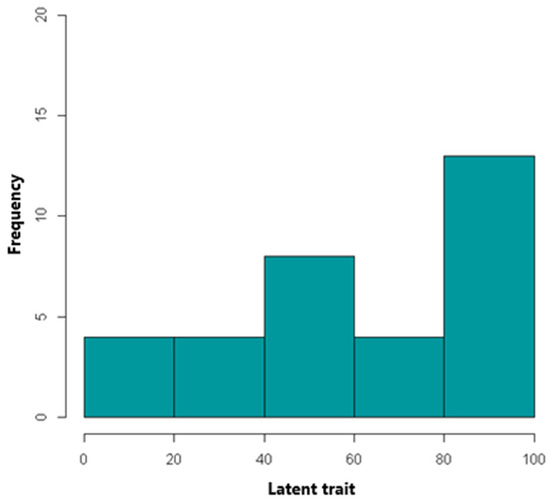
Figure 15.
Histogram of latent trait estimation for the Innovation Results factor.
However, the presence of organizations in the lower ranges (0–40) highlights disparities within the sector. These organizations may struggle with translating innovation potential into measurable outcomes due to limitations such as inadequate funding, misaligned objectives, or lack of access to skilled resources.
This distribution underscores the need for tailored interventions to support underperforming organizations. Potential strategies include capacity-building programs, facilitating access to markets, and fostering stronger connections with research institutions to boost innovation efficiency. By addressing these challenges, the sector can elevate its overall performance, ensuring more consistent innovation results across all organizations.
3.3.6. Innovation Impacts
As shown in Figure 16, the distribution of latent traits for Innovation Impacts reveals a strong skew towards higher values (80–100), with a significant proportion of ICT organizations in Quito demonstrating notable impacts from their innovation activities. This trend suggests that many firms are successfully leveraging their innovation capabilities to generate meaningful outcomes, such as increased market presence, enhanced productivity, and broader contributions to the local economy.
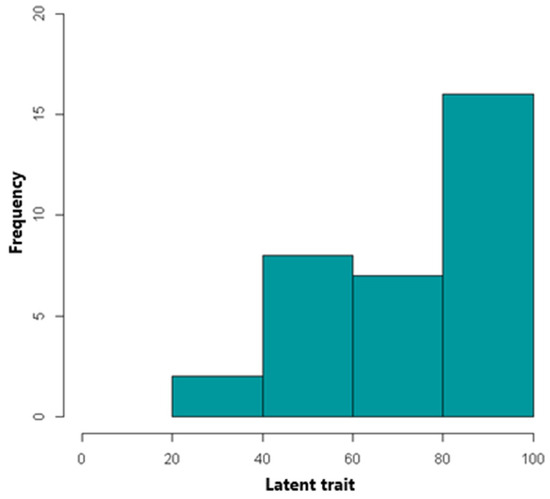
Figure 16.
Histogram of latent trait estimation for the Innovation Outcomes factor.
The presence of moderate scores (40–80) indicates that some organizations are achieving measurable impacts but may face constraints in fully realizing their innovation potential. These constraints could include limited scalability of innovation results, challenges in market adoption, or insufficient alignment between innovation efforts and organizational goals. This small cluster of low scores (0–40) highlights the need for targeted support for organizations struggling to achieve impactful innovation outcomes. Addressing these gaps may involve initiatives such as mentorship programs, improved access to innovation ecosystems, and collaborative efforts with stakeholders to amplify the effects of innovation activities.
Overall, the ICT sector in Quito demonstrates a positive trajectory in Innovation Impacts, with the majority of organizations showing strong performance. Further efforts to support underperforming firms can enhance the sector’s collective contribution to economic growth and technological advancement in Ecuador.
4. Discussion
4.1. Contribution of the CRI-IRT Model to Innovation Measurement
The CRI-IRT model makes a contribution to the innovation literature by providing a robust, context-specific framework for measuring organizational innovation potential while addressing the limitations of traditional tools such as Classical Test Theory (CTT). By utilizing Item Response Theory (IRT), the model enables precise, multidimensional assessments across key factors, including information sources, funding, innovation activities, objectives, outcomes, and impacts, ensuring both measurement reliability and adaptability. Unlike global innovation scales, which often lose precision when assessing subjects with lower latent traits—such as organizations in developing countries with limited industrialization and innovation culture—the CRI-IRT model overcomes this limitation through IRT calibration. This approach tailors items to the specific characteristics of subjects across the full spectrum of latent traits, allowing the model to perform consistently across specific contexts.
Global innovation tools often fail to capture the nuances of specific regions, sectors, and individual organizations. Their aggregated focus overlooks local characteristics, leading to generalized outcomes that are less actionable for targeted strategies. In contrast, the CRI-IRT model offers detailed insights at multiple levels. At the organizational level, it measures innovation potential, enabling tailored recommendations, while sectoral analysis highlights specific strengths and weaknesses, allowing industries to align innovation efforts with their unique challenges. The model’s regional focus adapts to socio-economic and cultural contexts, providing a localized understanding of innovation dynamics and actionable data to guide strategic decision-making. By bridging gaps left by traditional tools, the CRI-IRT model identifies disparities at the organizational and sectoral levels, enabling targeted interventions. This approach empowers stakeholders—policymakers, industry leaders, and researchers—with precise and actionable insights to foster inclusive and effective innovation ecosystems.
4.2. Innovation Landscape of the ICT Sector
The analysis of the ICT sector in Quito highlights its considerable innovation potential compared to other industries in Ecuador, particularly emphasizing strengths in innovation activities, objectives, and impacts. These findings align with global literature underscoring the ICT sector’s pivotal role in driving technological advancements and economic growth [48,49,50]. ICT enterprises, in particular, stand out for their ability to rapidly introduce new products and services, leveraging their inherent adaptability and expertise in the early adoption of emerging technological trends, such as artificial intelligence, big data, and the Internet of Things. Furthermore, the global ICT sector’s capacity to capitalize on technological trends and adapt them to local contexts is highlighted by the Global Innovation Index report [12], which positions Ecuador favorably in terms of high-tech imports. Additionally, ICT organizations of Quito have the ability to achieve significant impacts—ranging from increased digital inclusivity to fostering knowledge-based economies—which underscores the sector’s strategic importance. This alignment with broader trends, coupled with evidence of strong local performance, highlights the ICT sector’s pivotal role in Ecuador’s innovation landscape and its potential to drive broader industrial transformation.
Despite the ICT sector’s strong innovation potential, limited funding hampers its growth. This issue reflects a common trend in developing economies, where there is often a reliance on self-funding and limited access to external capital [51,52]. Studies indicate that this financial gap arises from underdeveloped financial markets and a lack of effective mechanisms to connect innovative firms with private or institutional investors [53,54]. Financial constraints have been shown to significantly impact firms’ ability to innovate, particularly in emerging markets where access to traditional financing sources, such as institutional lending and venture capital, is often limited. In regions like Latin America, firms often rely on personal savings or informal lending, which limits the scope and scale of innovation projects. Furthermore, public funding mechanisms, while beneficial, may fail to address structural financial barriers, leading to an over-reliance on short-term solutions without fostering long-term financial stability [55,56].
4.3. Research Limitations and Recommendations for Future Studies
A potential limitation of the CRI-IRT model lies in measurement bias, as the reliance on self-reported data through the CRI questionnaire may result in responses reflecting the desired state of the organization rather than its actual state. This subjective element could lead to overestimations or misrepresentations of innovation potential. To mitigate this, future research should incorporate additional data sources that are not influenced by human perception, such as economic, financial, or operational metrics, to provide a more objective foundation for evaluation. Furthermore, the model’s context-specific application to Ecuador raises questions about its generalizability, suggesting the need for recalibration when applied to other regions or industries.
The present research employed a cross-sectional study design, providing a static snapshot of the current state of innovation. Future studies could apply the CRI-IRT models developed in this research to conduct longitudinal analyses of innovation. Such analyses would provide deeper insights into how these elements interact, allowing for a more comprehensive understanding of causal relationships and feedback loops. For instance, researchers could examine whether improvements in specific capabilities, such as access to funding or R&D capacity, lead to measurable changes in results and impacts over time. Similarly, such studies could explore how external factors, such as shifts in policy or market dynamics, influence the trajectory of innovation development.
A comparative study across diverse geographic and industrial settings could yield valuable insights into the state of Ecuador’s industry innovation by contextualizing its performance against global benchmarks and identifying unique opportunities and challenges. By examining industries in regions with similar economic conditions or innovation ecosystems, such a study could reveal patterns in how geographic and socio-economic factors influence innovation activities. For example, comparisons with countries that have successfully transitioned to knowledge-based economies might illuminate strategies for addressing structural issues such as funding gaps, infrastructure deficiencies, and skill mismatches that currently hinder Ecuador’s innovation potential. Similarly, studying industrial sectors with varying levels of technological advancement within Ecuador and abroad can help pinpoint strengths and weaknesses in specific industries, offering a clearer picture of where resources should be allocated. For instance, industries that lag in innovation might benefit from lessons learned in countries with similar starting points but more advanced innovation capabilities. Conversely, sectors in Ecuador that excel in specific areas, such as ICT, can serve as models for replication in other industries or regions.
5. Conclusions
This research provides a comprehensive evaluation of the innovation landscape in Ecuador, with a particular emphasis on the ICT sector. The findings highlight the ICT sector’s leadership in innovation, particularly in activities, objectives, and impacts. However, a critical challenge identified is the limited access to external funding, which continues to hinder the full exploitation of innovation potential, a common issue in developing economies. The results shed light on structural factors influencing Ecuador’s innovation ecosystem.
Based on the findings of this study, ICT organizations in Quito, Ecuador, should prioritize diversifying their funding sources to overcome the significant financial barriers to innovation. Establishing stronger partnerships with public and private sector stakeholders, including international development agencies and venture capital investors, could provide much-needed external capital. Additionally, organizations should focus on enhancing their internal innovation capabilities by investing in staff training, adopting advanced technologies, and fostering a culture of continuous improvement. Collaborating with academic institutions and research centers could also facilitate access to cutting-edge research and innovation ecosystems. Furthermore, ICT organizations should leverage their strengths in the early adoption of emerging technologies to create competitive advantages in regional and global markets. By adopting a strategic and collaborative approach, these organizations can not only enhance their innovation potential but also contribute significantly to Ecuador’s broader economic development.
To strengthen the innovation ecosystem in Quito’s ICT sector, policymakers should implement targeted strategies that address the systemic challenges highlighted in this research. Establishing dedicated innovation funds or providing tax incentives for R&D activities can alleviate financial constraints faced by ICT organizations. Additionally, policies should focus on fostering public–private partnerships to attract foreign investment and encourage collaboration between industry and academia. Policymakers could also introduce capacity-building programs to enhance the technical and managerial skills of the workforce, ensuring alignment with global technological advancements. Moreover, creating regulatory frameworks that support technology adoption, data privacy, and intellectual property protection would foster a conducive environment for innovation. Finally, aligning national and local policies with international standards and frameworks can help integrate Ecuador’s ICT sector into global innovation networks, enabling it to scale and improve its position in global rankings. This alignment not only facilitates international collaboration and funding opportunities but also enhances competitiveness by adopting best practices and benchmarks from leading innovation ecosystems worldwide. By doing so, Ecuador can position itself as a proactive player in the global digital economy, attracting greater investment and fostering sustainable growth.
Author Contributions
Conceptualization, A.R.-L. and V.M.; Data curation, C.A. (Christian Anasi) and C.A. (Carlos Almeida); Formal analysis, C.A. (Christian Anasi); Investigation, C.A. (Christian Anasi), A.R.-L., and V.M.; Methodology, Christian Anasi, A.R.-L., V.M., and C.A. (Carlos Almeida); Resources, C.A. (Christian Anasi) and A.R.-L.; Software, C.A. (Christian Anasi); Supervision, A.R.-L.; Validation, C.A. (Carlos Almeida); Writing—original draft, C.A. (Christian Anasi); Writing—review & editing, A.R.-L. All authors have read and agreed to the published version of the manuscript.
Funding
This research received no external funding.
Institutional Review Board Statement
Not applicable.
Informed Consent Statement
Informed consent was obtained from all participants involved in the study. They were fully informed of the research’s non-commercial academic purpose and assured that all collected organizational data would be kept confidential and anonymized.
Data Availability Statement
Data for fitting IRT models are available at https://osf.io/r6ekm/?view_only=d2f40c1e18fc4056916b97740876ba69 (accessed on 12 December 2024).
Acknowledgments
The authors extend their gratitude to Escuela Politécnica Nacional for the institutional support of this work and the participating organizations from the ICT industry in Quito for their cooperation in this study. The data collection process was facilitated through the mediation and logistical support of CITEC—Cámara de Innovación y Tecnología Ecuatoriana, whose invaluable assistance was instrumental in reaching key stakeholders and ensuring the successful execution of this research.
Conflicts of Interest
The authors declare no conflicts of interest.
Appendix A

Table A1.
Original CRI Model questionnaire for Measuring Innovation Potential.
Table A1.
Original CRI Model questionnaire for Measuring Innovation Potential.
| Las principales fuentes de información para los procesos de innovación en su organización son: | Fuentes de información | |
| V1 | Departamento o unidad interna de I+D o de Diseño | |
| V2 | Departamento o unidad de Ventas y Mercadeo | |
| V3 | Directivos de la Organización | |
| V4 | Casa Matriz (del país de origen) | |
| V5 | Clientes | |
| V6 | Competidores | |
| V7 | Departamentos de Producción, Logística, Distribución o Similares | |
| V8 | Entidades externas (Consultores, Universidades u otros Proveedores de Conocimiento) | |
| Las principales fuentes de financiamiento para los procesos de innovación en su organización son: | Fuentes de financiamiento | |
| V9 | Recursos propios | |
| V10 | Recursos de la Casa Matriz (del país de origen) | |
| V11 | Banca Comercial | |
| V12 | Grupo Empresarial al que pertenece la organización | |
| V13 | Recursos gubernamentales o mixtos | |
| Para promover la innovación en la organización se han realizado las siguientes actividades: | Actividades de innovación | |
| V14 | Actividades de I+D con su respectiva asignación de recursos (personal, equipos, insumos) | |
| V15 | Inversión en licencias o acuerdos de propiedad intelectual (patentes, marcas, etcétera) | |
| V16 | Actividades de diseño u otras actividades creativas | |
| V17 | Implementación de programas de modernización y gestión de procesos de producción | |
| V18 | Implementación de programas de capacitación orientados a la innovación y mejoramiento de procesos productivos | |
| V19 | Diseño del portafolio de negocio y/o de procesos | |
| V20 | Implementación de nuevas formas de distribución y mercadeo | |
| V21 | Comercialización de productos innovados | |
| V22 | Implementaciones orientadas a la transformación digital y el teletrabajo | |
| Se han propuesto como objetivos de innovación en su organización: | Objetivos de innovación | |
| V23 | Ampliar el mercado actual | |
| V24 | Reducir costos laborales unitarios, de consumo de materiales y/o de consumo de energía | |
| V25 | Mejorar las condiciones de trabajo | |
| V26 | Flexibilizar la producción y/o desarrollar soluciones para clientes específicos | |
| V27 | Reducir los tiempos muertos | |
| V28 | Aprovechar los conocimientos científico-tecnológicos nuevos | |
| V29 | Aprovechar los nuevos materiales o insumos existentes | |
| V30 | Aprovechar la capacidad organizacional de producción | |
| V31 | Mejorar la transformación digital de la organización | |
| Como resultado de la innovación, su organización: | Resultados | |
| V32 | Ha introducido al mercado productos nuevos o significativamente mejorados | |
| V33 | Ha introducido al mercado procesos nuevos o significativamente mejorados | |
| V34 | Ha introducido métodos organizacionales nuevos o significativamente mejorados | |
| V35 | Ha introducido métodos organizacionales de toma de decisiones nuevos o significativamente mejorados | |
| V36 | Ha introducido métodos/modelos/prácticas comerciales nuevos o significativamente mejorados | |
| V37 | Ha introducido métodos de distribución o colocación de productos en el mercado nuevos o significativamente mejorados | |
| En la organización se han obtenido los siguientes impactos por la introducción de productos, procesos, métodos/modelos comerciales u otros resultados de la innovación en la organización: | Impactos | |
| V38 | Impacto positivo en rentabilidad | |
| V39 | Impacto positivo en la utilidad bruta, utilidad operacional y/o utilidad antes de impuestos | |
| V40 | Impacto positivo en la competitividad | |
| V41 | Impacto positivo en la productividad | |
| V42 | Impacto positivo en las relaciones laborales | |
| V43 | Se han incrementado las ventas | |
| V44 | Se han reducido los costos de producción | |
| V45 | Se ha reducido el impacto ambiental negativo | |
| V46 | Se ha mejorado la salud, calidad de vida y bienestar en el entorno de la organización | |
The original Spanish version of the questionnaire, designed for Ecuadorian ICT organizations, was included in this document to ensure alignment with the target population in future works and to preserve contextual relevance.
References
- Agazu, B.G.; Kero, C.A. Innovation strategy and firm competitiveness: A systematic literature review. J. Innov. Entrep. 2024, 13, 24. [Google Scholar] [CrossRef]
- Garel, A.; Petit-Romec, A. Engaging Employees for the Long Run: Long-Term Investors and Employee-Related CSR. J. Bus. Ethics 2020, 174, 35–63. [Google Scholar] [CrossRef]
- Lee, E.L.S.; Lee, W.O. Enabling Continuous Innovation and Knowledge Creation in Organizations: Optimizing Informal Learning and Tacit Knowledge. In Third International Handbook of Lifelong Learning; Springer: Cham, Switzerland, 2023; pp. 927–946. [Google Scholar] [CrossRef]
- OECD; Eurostat. Oslo Manual 2018: Guidelines for Collecting, Reporting and Using Data on Innovation, 4th ed.; OECD Publishing: Paris, France, 2018. [Google Scholar]
- Rasheed, M.; Jianhua, L. Unleashing the power of innovation promoters for sustainable economic growth: A global perspective. Environ. Sci. Pollut. Res. 2023, 30, 100979–100993. [Google Scholar] [CrossRef] [PubMed]
- Ullah, H.; Diao, X.; Abbas, H. Innovation as a mechanism for sustainable economic growth: Exploring the role of policy stability and institutional quality in case of China. Environ. Dev. Sustain. 2024, 1–33. [Google Scholar] [CrossRef]
- Tu, Y.; Wu, W. How does green innovation improve enterprises’ competitive advantage? The role of organizational learning. Sustain. Prod. Consum. 2021, 26, 504–516. [Google Scholar] [CrossRef]
- Crespi, G.; Arias-Ortiz, E.; Tacsir, E.; Vargas, F.; Zuñiga, P. Innovation for economic performance: The case of Latin American firms. Eurasian Bus. Rev. 2014, 4, 31–50. [Google Scholar] [CrossRef]
- Whetsell, T.A.; Siciliano, M.D.; Witkowski, K.G.K.; Leiblein, M.J. Government as Network Catalyst: Accelerating Self-Organization in a Strategic Industry. J. Public Adm. Res. Theory 2020, 30, 448–464. [Google Scholar] [CrossRef]
- World Intellectual Property Organization. Global Innovation Index 2022. 2022. Available online: https://www.wipo.int/global_innovation_index/en/2022 (accessed on 31 May 2022).
- World Intellectual Property Organization. Global Innovation Index 2023. 2023. Available online: https://www.wipo.int/global_innovation_index/en/2023 (accessed on 31 May 2022).
- World Intellectual Property Organization. Global Innovation Index 2024. 2024. Available online: https://www.wipo.int/web-publications/global-innovation-index-2024/en/ (accessed on 31 May 2022).
- Păvăloaia, V.D.; Necula, S.C. Artificial Intelligence as a Disruptive Technology—A Systematic Literature Review. Electronics 2023, 12, 1102. [Google Scholar] [CrossRef]
- Ali, S.A.; Elsaid, S.A.; Ateya, A.A.; ElAffendi, M.; El-Latif, A.A.A. Enabling Technologies for Next-Generation Smart Cities: A Comprehensive Review and Research Directions. Future Internet 2023, 15, 398. [Google Scholar] [CrossRef]
- Saeed, S.; Gull, H.; Aldossary, M.M.; Altamimi, A.F.; Alshahrani, M.S.; Saqib, M.; Iqbal, S.Z.; Almuhaideb, A.M. Digital Transformation in Energy Sector: Cybersecurity Challenges and Implications. Information 2024, 15, 764. [Google Scholar] [CrossRef]
- Ismail, S.; Malone, M.S.; Van Geest, Y.; Diamandis, P.H. Exponential Organizations: Why New Organizations Are Ten Times Better, Faster, and Cheaper than Yours (and What to Do About It); Diversion Books: New York, NY, USA, 2014. [Google Scholar]
- Bacca-Acosta, J.; Gómez-Caicedo, M.I.; Gaitán-Angulo, M.; Robayo-Acuña, P.; Ariza-Salazar, J.; Mercado Suárez, Á.L.; Alarcón Villamil, N.O. The impact of digital technologies on business competitiveness: A comparison between Latin America and Europe. Compet. Rev. 2023, 33, 22–46. [Google Scholar] [CrossRef]
- INEC Visualizador de Estadísticas Empresariales. 2020. Available online: https://public.tableau.com/app/profile/instituto.nacional.de.estad.stica.y.censos.inec./viz/VisualizadordeEstadsticasEmpresariales2020/Dportada (accessed on 31 May 2022).
- Cirera, X.; Muzi, S. Measuring innovation using firm-level surveys: Evidence from developing countries. Res. Policy 2020, 49, 103912. [Google Scholar] [CrossRef]
- Morales, V.; Robalino-López, A.; Almeida, C. Propuesta metodológica para la medición del potencial de innovación. Debates Sobre Innovación 2019, 3, 1–14. [Google Scholar] [CrossRef]
- Baker, F.B.; Kim, S.-H. The Basics of Item Response Theory Using R; Springer: New York, NY, USA, 2017. [Google Scholar]
- Attorresi, H.F.; Lozzia, G.S.; Abal, F.J.P.; Galibert, M.S.; Aguerri, M.E. Teoría de Respuesta al Ítem: Conceptos básicos y aplicaciones para la medición de constructos psicológicos. Rev. Argent. Clínica Psicológica 2009, 18, 179–188. [Google Scholar]
- Edison, H.; Bin Ali, N.; Torkar, R. Towards innovation measurement in the software industry. J. Syst. Softw. 2013, 86, 1390–1407. [Google Scholar] [CrossRef]
- Cornell University; INSEAD; WIPO. About the Global Innovation Index. 2021. Available online: https://www.wipo.int/gii-ranking/en/about (accessed on 26 July 2021).
- World Intellectual Property Organization. Global Innovation Index (GII). 2021. Available online: https://www.wipo.int/global_innovation_index/en/ (accessed on 26 July 2021).
- OECD; OECD Science. Technology and Innovation Scoreboard. 2021. Available online: https://www.oecd.org/sti/scoreboard.htm (accessed on 27 July 2021).
- European Commission. European Innovation Scoreboard. Available online: https://research-and-innovation.ec.europa.eu/statistics/performance-indicators/european-innovation-scoreboard_en?prefLang=es (accessed on 11 December 2024).
- Bloomberg. The Bloomberg Innovation Index. 2022. Available online: https://www.bloomberg.com/graphics/2015-innovative-countries/ (accessed on 31 May 2022).
- RICYT; OEA; CYTED; COLCIENCIA; OCYT. Normalización de Indicadores de Innovación Tecnológica en América Latina y el Caribe. Manual de Bogotá. 2001. Available online: https://repositorio.minciencias.gov.co/server/api/core/bitstreams/89450dad-b978-4cdd-8775-0121c1e5930f/content (accessed on 27 July 2021).
- INEC; SENESCYT. Encuesta Nacional de Actividades de Innovación (AI): 2012–2014. Metodología. 2016. Available online: https://www.ecuadorencifras.gob.ec/documentos/web-inec/Estadisticas_Economicas/Ciencia_Tecnologia-ACTI/2012-2014/Innovacion/MetodologIa%20INN%202015.pdf (accessed on 31 May 2022).
- SENESCYT. Metodología de la Encuesta Nacional de Actividades de Innovación (AI): 2009–2011. 2013, pp. 2009–2011. Available online: https://anda.inec.gob.ec/anda/index.php/catalog/662/download/11723 (accessed on 31 May 2022).
- AEI. Informe de actividades. Enero 2019a julio 2020. 2020. Available online: https://www.andeanecuador.com.ec/dc/es/pages/risk/articles/innovacion-.html (accessed on 26 July 2021).
- Ecuador, D. Innovación en Ecuador. 2017. Available online: https://anuariocdh.uchile.cl/index.php/ADH/article/view/11534 (accessed on 31 May 2022).
- Robalino-López, A.; Ramos, V.; Unda, X.L.; Franco, A. University’S Contribution To Industries in the Creation of a Tool To Diagnose Innovation Management Processes. In Proceedings of the 11th International Technology, Education and Development Conference, Valencia, Spain, 6–8 March 2017; pp. 2351–2360. [Google Scholar] [CrossRef]
- Camio, M.; Romero, M.; Álvarez, M. Índice de nivel de innovación y sus componentes: Estudio en empresas argentinas de software. Rev. Adm. FACES J. 2015. Available online: https://www.researchgate.net/publication/369030043_INDICE_DE_NIVEL_DE_INNOVACION_Y_SUS_COMPONENTES_ESTUDIO_EN_EMPRESAS_ARGENTINAS_DE_SOFTWARE (accessed on 31 May 2022).
- Paek, I.; Cole, K. Using R for Item Response; Routledge: London, UK, 2020. [Google Scholar]
- Marullo, C.; Martelli, I.; Di Minin, A. The many shades of “openness”: An application of item response theory to open innovation research. R&D Manag. 2020, 51, 127–146. [Google Scholar] [CrossRef]
- Ojala, A.F.; Larsson, J.E. Construction of the Berkeley Innovation Index: A Higher-Order Item Response Theory Model Approach; Lund University & University of California: Berkeley, CA, USA, 2016. [Google Scholar]
- Selznick, B.S.; Mayhew, M.J. Measuring Undergraduates’ Innovation Capacities. Res. High. Educ. 2018, 59, 744–764. [Google Scholar] [CrossRef]
- Wongtada, N.; Rice, G. Multidimensional latent traits of perceived organizational innovation: Differences between Thai and Egyptian employees. Asia Pac. J. Manag. 2008, 25, 537–562. [Google Scholar] [CrossRef]
- Paulina, V.; Arévalo, M.; Andrés, J.; López, R.; Almeida Rodríguez, C.A. Medición del potencial de innovación en las organizaciones: Propuesta metodológica para el contexto ecuatoriano. Rev. Gestão Secr. 2023, 14, 6149–6168. [Google Scholar] [CrossRef]
- Magis, D. A Note on the Item Information Function of the Four-Parameter Logistic Model. Appl. Psychol. Meas. 2013, 37, 304–315. [Google Scholar] [CrossRef]
- Maydeu-Olivares, A.; Joe, H. Limited information goodness-of-fit testing in multidimensional contingency tables. Psychometrika 2006, 71, 713–732. [Google Scholar] [CrossRef]
- Monroe, S.; Cai, L. Evaluating Structural Equation Models for Categorical Outcomes: A New Test Statistic and a Practical Challenge of Interpretation. Multivariate Behav. Res. 2015, 50, 569–583. [Google Scholar] [CrossRef] [PubMed]
- Lalor, J.P.; Wu, H.; Yu, H. Building an evaluation scale using Item Response Theory. In Proceedings of the 2016 Conference on Empirical Methods in Natural Language Processing, Austin, TX, USA, 1–5 November 2016; pp. 648–657. [Google Scholar] [CrossRef]
- INEC. Clasificación Nacional de Actividades Económicas (CIIU Rev. 4.0). Unidad de Análisis de Síntesis. 2012. Available online: https://aplicaciones2.ecuadorencifras.gob.ec/SIN/metodologias/CIIU%204.0.pdf (accessed on 31 May 2022).
- López, A.R.; Morales, V.; Unda, X.; Aniscenco, Z. Procesos de desarrollo e innovación: Aplicación de una metodológica para medir el nivel de innovación en el contexto organizacional ecuatoriano/Development and innovation processes: Application of a methodology to measure the level of innovation in the Ecuadorian organizational context. Braz. J. Dev. 2019, 5, 4550–4567. [Google Scholar]
- Cardoso, L.B.; Couto, P.; Correia, P.; Lopes, P.C.; Fernandes, J.C.H.; Fernandes, G.V.O.; Veiga, N.J. Impact of Digital Innovations on Health Literacy Applied to Patients with Special Needs: A Systematic Review. Information 2024, 15, 663. [Google Scholar] [CrossRef]
- Mushi, G.E.; Mwakifwamba, A.A.; Burgi, P.-Y.; Di Marzo Serugendo, G. A Farmers’ Digital Information System (FDIS) for Sustainable Agriculture Among Smallholder Farmers in Tanzania. Information 2024, 15, 816. [Google Scholar] [CrossRef]
- Ilieva, G.; Yankova, T.; Klisarova-Belcheva, S. Effects of Generative AI in Tourism Industry. Information 2024, 15, 671. [Google Scholar] [CrossRef]
- Behera, B.; Haldar, A.; Sethi, N. Investigating the direct and indirect effects of Information and Communication Technology on economic growth in the emerging economies: Role of financial development, foreign direct investment, innovation, and institutional quality. Inf. Technol. Dev. 2024, 30, 33–56. [Google Scholar] [CrossRef]
- Das, A.; Chowdhury, M.; Seaborn, S. ICT Diffusion, Financial Development and Economic Growth: New Evidence from Low and Lower Middle-Income Countries. J. Knowl. Econ. 2018, 9, 928–947. [Google Scholar] [CrossRef]
- Gürünlü, M. Gelişmekte Olan Piyasalarda İnovasyon ve Girişimciliğin Finansmanı Sorunu ve Alternatif Çözüm Önerileri—The Financing Problem of Innovation and Entrepreneurship in Emerging Markets and Alternative Solutions. J. Bus. Res.-Turk 2018, 10, 286–303. [Google Scholar] [CrossRef]
- Singh, A. Financial Constraints and Funding Solutions for Small Startups in Emerging Markets. Int. J. Soc. Sci. Econ. Res. 2024, 9, 3813–3839. [Google Scholar] [CrossRef]
- United Nations Environment Programme. New Financial Mechanisms for Clean Energy Investments in Latin America. 2023. Available online: https://wedocs.unep.org/xmlui/handle/20.500.11822/42471 (accessed on 2 January 2025).
- OECD. Latin American Economic Outlook 2023; OECD Publishing: Paris, France, 2023. [Google Scholar] [CrossRef]
Disclaimer/Publisher’s Note: The statements, opinions and data contained in all publications are solely those of the individual author(s) and contributor(s) and not of MDPI and/or the editor(s). MDPI and/or the editor(s) disclaim responsibility for any injury to people or property resulting from any ideas, methods, instructions or products referred to in the content. |
© 2025 by the authors. Licensee MDPI, Basel, Switzerland. This article is an open access article distributed under the terms and conditions of the Creative Commons Attribution (CC BY) license (https://creativecommons.org/licenses/by/4.0/).