Article

Aerial Imagery Redefined: Next-Generation Approach to Object Classification

1
IMOD MAFAT DDR&D, Ministry of Defense, Tel Aviv-Yafo 127133, Israel
2
School of Information Systems, MTA, Tel Aviv 6818211, Israel
3
WU Institute for Cryptoeconomics, 1020 Vienna, Austria
*
Author to whom correspondence should be addressed.
These authors contributed equally to this work.
Information 2025, 16(2), 134; https://doi.org/10.3390/info16020134
Submission received: 31 August 2024 / Revised: 4 January 2025 / Accepted: 21 January 2025 / Published: 11 February 2025
(This article belongs to the Special Issue Online Registration and Anomaly Detection of Cyber Security Events)

Abstract

:
Identifying and classifying objects in aerial images are two significant and complex issues in computer vision. The fine-grained classification of objects in overhead images has become widespread in various real-world applications, due to recent advancements in high-resolution satellite and airborne imaging systems. The task is challenging, particularly in low-resource cases, due to the minor differences between classes and the significant differences within each class caused by the fine-grained nature. We introduce Classification of Objects for Fine-Grained Analysis (COFGA), a recently developed dataset for accurately categorizing objects in high-resolution aerial images. The COFGA dataset comprises 2104 images and 14,256 annotated objects across 37 distinct labels. This dataset offers superior spatial information compared to other publicly available datasets. The MAFAT Challenge is a task that utilizes COFGA to improve fine-grained classification methods. The baseline model achieved a mAP of 0.6. This cost was 60, whereas the most superior model achieved a score of 0.6271 by utilizing state-of-the-art ensemble techniques and specific preprocessing techniques. We offer solutions to address the difficulties in analyzing aerial images, particularly when annotated and imbalanced class data are scarce. The findings provide valuable insights into the detailed categorization of objects and have practical applications in urban planning, environmental assessment, and agricultural management. We discuss the constraints and potential future endeavors, specifically emphasizing the potential to integrate supplementary modalities and contextual information into aerial imagery analysis.

1. Introduction

Technological advancements in aerial sensor systems have led to a surge in data production in remote sensing. The proliferation of aerial imagery has benefits and drawbacks, particularly in data management and analysis. The volume of data is typically vast and can only be partially analyzed, leading to many unclassified images. Consequently, the problem mentioned above has been successfully addressed through the utilization of Machine Learning (ML) and Artificial Intelligence (AI) techniques, which facilitate the classification and analysis of aerial images [1,2].
The existing literature review indicates that Deep Learning, particularly Convolutional Neural Networks (CNNs), effectively addresses the difficulties aerial images pose. Nevertheless, several significant unresolved matters persistently arise in this domain. These include the absence of data labels, the effectiveness of models in situations with limited resources, and the challenge of distinguishing between highly detailed object categories [3,4].
To address these challenges and contribute to advancing aerial image analysis, we present COFGA: Classification of Objects for Fine-Grained Analysis. This novel dataset consists of meticulously classified objects from aerial images designed for detailed analysis. The objective of this study was to respond to the following inquiry: What is the most efficient method for generating a dataset and a suitable classification framework to enhance the detailed categorization of objects in high-resolution aerial images, mainly when there is a scarcity of labeled data samples and when the classes are unevenly distributed?
The dataset comprises 2104 highly detailed high-resolution images (with a Ground Sample Distance of 5–15 cm) containing 14,256 annotated objects across 37 categories, classes, subclasses, features, and colors. This level of detail and granularity is much more extensive and comprehensive compared to the existing public datasets in the field.
The main results of this study demonstrate that the COFGA dataset is more effective in enhancing the detailed classification of objects in aerial images than other datasets. The baseline model achieved a mean Average Precision (mAP) of 0.60. To improve the classification performance even more, one can employ more advanced strategies, such as complex ensemble techniques, hierarchical model building, and customized data preprocessing. In this case, the highest-performing model achieved a mAP of 0.6271.
This paper’s primary contributions are as follows: The COFGA database is a newly developed publicly accessible resource that offers a more detailed classification of objects in aerial images compared to existing datasets. We conducted a comparative analysis of COFGA in relation to other prominent overhead imagery datasets, and we comprehensively examined the dataset’s characteristics and applications. In addition, we present the MAFAT Challenge, a public competition that showcased various methods for addressing the challenges of the fine-grained classification problem using the COFGA dataset. The MAFAT Challenge was organized by the Defense Research and Development Institute. Based on that competition, we provide some optimal strategies for handling imbalanced datasets, infrequent labels, and various types of classification problems in aerial images. This work contributes to the advancement of fine-grained classification in aerial imagery, which has practical implications for various fields, including urban planning, agriculture, and environmental monitoring. The COFGA dataset and MAFAT Challenge results serve as a foundation for future research on enhancing the classification models for high-resolution aerial imagery.
The remainder of this paper is organized as follows: Section 2 reviews related work on fine-grained classification and aerial imagery. Section 3 introduces the COFGA dataset, detailing its unique characteristics and annotation process. Section 4 provides a comparative analysis of COFGA with other datasets. Section 5 describes the MAFAT Challenge, including its methodology, evaluation metrics, and notable solutions. Section 6 discusses the findings, their implications, and future directions. Finally, Section 7 concludes the paper by summarizing its key contributions.

2. Related Work

2.1. Advancements in Aerial Imagery and ML

Remote sensing has been able to generate an immense volume of data as a result of advancements in aerial sensor technology. It is exceedingly large, rendering it beyond the capacity of human analysts to manage, and it generates an immense quantity of unlabeled images. As a result, the researchers have identified the necessity of utilizing Artificial Intelligence (AI) and ML to classify and analyze aerial photographs. Recent research has demonstrated that Convolutional Neural Networks (CNNs) are among the Deep Learning (DL) techniques that can successfully address the challenges associated with aerial image classification. Teixeira et al. (2023) demonstrated that these models could operate with the extensive datasets obtained from Unmanned Aerial Vehicles (UAVs) and satellites in the agricultural sector. The results proved the efficacy of Deep Learning in any agricultural data source [1]. In the field of wildlife conservation, recent and advanced CNN architectures, including RetinaNet and Faster R-CNN, have been employed to detect wildlife during aerial surveys. They have also emphasized the potential of these models to identify species at the species level and to estimate populations, thereby demonstrating the transformation of aerial imagery in ecological surveys [2].
The integration of a variety of ML algorithms has improved the classification of aerial images in a variety of domains. Ferraz (2024) demonstrated a comprehensive comprehension of the non-intrusive application of ML to evaluating crops in the agricultural field by utilizing satellites and UAVs to determine crop height [5]. The challenges of Automated Visual Identification and Recognition (AVIAR)-based automated bird recognition in aerial images and the potential solutions through AI as a tool to reduce time-consuming methods have been the subject of some works [6].
However, some lingering concerns remain regarding the classification of aerial imagery. This issue is particularly problematic in remote sensing applications, due to the scarcity of samples with labels. It is becoming more and more imperative to explore novel approaches to managing data that lack labeling. Others have proposed the Generalized Category Discovery (GCD) as a solution to the challenges presented by open-set classification models, as it is employed to classify labeled and unlabeled aerial images [4]. Consequently, the methodology asserts that it is feasible to devise enhanced techniques for classifying aerial images, more effectively recognizing novel scenes. Integrating ML with remote sensing technologies could expand the application of aerial image analysis in various fields, such as agriculture, the environment, and planning. Consequently, it is imperative to conduct additional research in this area, to resolve the existing challenges and enhance the automated aerial image classification and analysis system.

2.2. Challenges in Aerial Imagery Classification

The scarcity of labeled samples is a significant challenge when training deep neural networks for aerial imagery classification. The performance of Deep Learning models is contingent upon the availability of labeled data, a scarce resource in remote sensing applications. It is a challenge that the researchers encountered while developing a classification system to identify potential breeding grounds using UAV imagery [7]. In addition, the imbalance of numerous aerial imagery datasets further exacerbates the issue of limited labeled data. Yamada et al. (2023) have previously addressed the necessity of directing labeling processes to improve learning outcomes, particularly when confronted with imbalanced datasets [8]. The authors have proposed a variety of neural network structures that can operate effectively with limited data to address the issue of low-resource training. Sirisha (2023) has proposed a transformer-based architecture known as the Parallel Vision Split Attention Module Network (PvSAMNet) for Unmanned Aerial Vehicle (UAV) imagery [9]. Additionally, a You Only Look Once (YOLO)-based model for small object detection in aerial imagery demonstrates the specific architecture’s potential to resolve aerial imagery-related issues [10].
Fine-grained classification, which is the capacity to differentiate between classes that are similar in appearance, is a critical concern in aerial imagery classification. This issue is particularly significant in problematic areas, such as land cover mapping and species recognition. The formulation of Generalized Category Discovery (GCD) has resolved this issue by categorizing both labeled and unlabeled aerial images [4]. Chang (2024) has proposed a multi-scale attention network for building extraction to address the challenges of fine-grained classification in aerial imagery [11]. This work demonstrates the necessity of models that can accommodate aerial images’ varying sizes and context information.
Integrating various Deep Learning methods has effectively addressed challenges and enhanced classification results. Teixeira et al. (2023) conducted a recent study on Deep Learning models for crop classification, demonstrating that applying two or more architectures/techniques, such as data augmentation and transfer learning, can improve a model’s performance [1]. Subsequent research has provided additional information regarding the obstacles associated with developing a deep neural network that is effective in classifying aerial images, particularly those based on agricultural data. Gadiraju and Vatsavai (2023) have discussed the concerns arising from the multitemporal and geographic factors in remote sensing data, arguing for the necessity of models that can effectively manage these circumstances [3]. It is crucial to address these obstacles as the field of aerial imagery classification continues to evolve, to improve the performance of ML models in remote sensing applications. The key challenges that must be considered are the best approach to addressing the issue of data scarcity, the development of an effective architecture for low-resource environments, and the necessity of enhancing fine-grained classification accuracy.

2.2.1. Evaluation Metrics

The evaluation of ML models, particularly in imbalanced datasets, is an emerging research field. The mAP is a critical performance indicator well-suited for multilabel-multiclass tasks, especially for the mAP metric, as it can offer a comprehensive assessment of the model’s performance across all labels, regardless of their frequency in the dataset. The method is particularly crucial in situations where certain classes are not as diverse, as the increase in accuracy in these classes is equal to that of the classes that occur more frequently [12,13]. The mAP is the average of the AP scores derived for each class, and it is contingent upon the model’s precision at various threshold levels. This method is particularly well suited for imbalanced datasets in which the number of classes is disproportional, as it emphasizes the ordering of the predictions rather than the individual predicted probabilities [12,14]. Several researchers have implemented the mAP in their research on instance segmentation, demonstrating its effectiveness in evaluating the performance of models with a particular emphasis on tasks that involve a large number of classes, with some classes having numerous instances and others having fewer [13]. Furthermore, some studies have demonstrated that metrics such as Area Under the Curve (AUC) are not always appropriate for evaluating the performance of models in datasets that are imbalanced; for a more comprehensive evaluation of model performance in these circumstances, it is advisable to employ the mAP [12].
Numerous research papers concentrating on imbalanced datasets underscore the importance of selecting appropriate metrics. For instance, the recent research on pre-eclampsia prediction underscores the significance of the measures that must be employed to estimate the model’s efficiency, particularly in medical data, where class imbalance is a prevalent issue [15]. The research suggests that integrating sensitivity and specificity metrics into a single measure, such as G-mean, may be beneficial for producing a more precise estimation of model performance in these situations. Other research has demonstrated that class imbalance is a critical factor that impacts classification performance, necessitating the implementation of specific evaluation metrics [16]. In addition to the mAP, other strategies for addressing class imbalance have been suggested, such as implementing advanced loss functions and resampling techniques. For example, the investigation of the utilization of resampling techniques in the prediction of credit card defaults demonstrates that both undersampling and oversampling techniques have a beneficial effect on the model’s performance [17]. Similarly, there has been considerable discourse regarding the utilization of dice loss for segmentation, which is recognized as a beneficial approach to addressing class imbalances [18]. Since they enhance the performance of models trained on imbalanced datasets, these methodologies enhance the mAP metric.

2.2.2. Challenging Aspects of the Competition

Rare Labels

One of the approaches discussed in the literature is Semi-Supervised Learning, which involves using a small set of labeled data and a large amount of unlabeled data. Researchers have suggested a semi-supervised classification method that combines CNNs and Support Vector Machines (SVMs) to enhance the classification of Polarimetric Synthetic Aperture Radar (PolSAR) images, even in situations with limited labeled samples. This study illustrates that co-training methods can attain superior levels of classification accuracy when dealing with an imbalanced dataset [19]. Furthermore, previous studies have employed Convolutional Neural Networks (CNNs) as an encoder in semi-supervised domain adaptation methods. These studies have demonstrated the benefits of utilizing a small number of training data samples while still achieving satisfactory performance [20].
Another feasible strategy suggested is transfer learning, wherein Convolutional Neural Networks (CNNs) can leverage pre-trained models trained on extensive datasets to improve the performance of tasks with limited data. Evaluation of endodontic instruments in periapical images is conducted through the Convolutional Neural Network (CNN) model, to establish the use of Deep Learning in other medical imaging applications. Transfer learning can overcome the challenge of limited training data [21]. This technique is precious in specialized subfields such as medical imaging, where obtaining labeled data is challenging. Another study has demonstrated the effectiveness of transfer learning in segmenting stromal tissue in histology images and has reinforced the notion that pre-trained models are advantageous as they necessitate a smaller amount of labeled data for training [22].
Novel loss functions and data augmentation techniques can enhance the model training process when labels are scarce. Researchers have experimented with class-level loss reweighting in the training of CNN models. This technique involves adjusting the loss values based on the frequency of the true class labels, in order to address class imbalance. This approach facilitates a more equitable training process by redirecting attention towards infrequently observed classes during model tuning [23]. Furthermore, there has been a concentration on how to guide the labeling procedure to improve learning, mainly when working with datasets with unequal class distributions. Based on these findings, strategic labeling enhances the model’s ability to learn from limited data samples [8].

Imbalanced Data

The issue of class imbalance in the field of ML, particularly in the domain of computer vision, has garnered significant attention in recent times. The presence of imbalanced class distributions, where some classes have significantly fewer labeled examples than others, poses a challenge for training models, as they often struggle when encountering infrequent labels. This literature review consolidates recent research examining the most effective approaches for addressing imbalanced classes, particularly on transfer learning and self-supervision. Transfer learning is a beneficial method for reducing the negative effects of imbalanced datasets. When researchers create novel models, they can utilize pre-trained models that have undergone training on extensive databases to adjust to new tasks with minimal samples. Prior studies have demonstrated that Self-Supervised Learning (SSL) models outperform conventional Deep Learning approaches in situations with limited labeled data, particularly in medical image analysis [24].
SSL can enhance model performance in situations where there is an uneven distribution of classes. One proposed method is a hybrid approach combining Self-Supervised Learning and semi-supervised learning strategies. This approach allows a model to utilize unlabeled data, to improve the detection of plant leaf diseases [25]. This approach demonstrates that SSL is a comprehensive strategy to enhance model performance in various applications. Utilizing SSL has been proposed, to address the challenges arising from imbalanced data. Prior studies have also examined the improvement of imbalanced regression in semi-supervised learning through pseudo-labeling. This approach can effectively enhance the model’s performance when dealing with rare classes [26]. This study aligns with a separate one that demonstrated the efficacy of contrastive learning in few-shot sentiment classification, as it also leverages unlabeled data to enhance the outcomes [27]. The results are beneficial because a large portion of the data currently accessible lacks labels, and SSL effectively generates meaningful representations regardless of the limited number of labels, which is frequently the situation in imbalanced scenarios.
Recent studies have also concentrated on enhancing the performance of SSL models when dealing with imbalanced datasets. A recent Ronan (2024) study introduced a self-supervised VICReg pre-training method for detecting rare cardiac diseases [28]. The study highlighted how SSL can be effectively adjusted to improve diagnostic accuracy in complex clinical situations. Furthermore, SSL has demonstrated the capacity to tackle specific difficulties associated with a scarcity of annotated data, as observed in ground-penetrating radar inspections [29].

Train–Validation–Test Split

When dealing with imbalanced data, a significant concern is overfitting, whereby the model becomes highly proficient at learning the training data but struggles to apply this knowledge to new data effectively. This poses a problem, particularly when the participants are unaware of the specific attributes of the test set, as it becomes difficult to articulate the accuracy of the model across various categories. The limited availability of ECG samples for rare cardiac diseases makes it challenging to label and classify them accurately. Consequently, this leads to high misclassification rates resulting from inadequate training and validation. Thus, there is a necessity for improved methods of dividing data, in order to train and evaluate models using data that have not been utilized in the model construction process, while ensuring that no bias enters the model [28].
In order to address the imbalanced nature of datasets, various techniques can enhance the accuracy of model evaluation. Research has also emphasized the importance of adhering to uniform and standardized reporting practices for AI-based MCV systems and models. This includes using metrics such as recall, precision, and F1 scores. These metrics are precious for evaluating the performance of models, particularly in situations where there is an imbalance in class distribution [30]. Various techniques tend to improve the efficiency of data labeling and model training in imbalanced large datasets, including active learning. Researchers have suggested using synthetic aerial images to enhance the diversity of labeled training data, addressing the challenges caused by the limited number of labeled instances [31].
In addition, the efficacy of pseudo-labeling in improving the performance of deep neural networks for animal classification has been examined, to demonstrate the utility of small, well-annotated datasets in model training, thereby reducing the need for extensive labeling procedures [32]. Furthermore, it is essential to emphasize that the concept of data labels should not be underestimated, particularly concerning inter-rater reliability. Prior research has examined inter-rater reliability’s impact on data quality in large-scale retrospective chart reviews. Precise labeled data are crucial for improving the effectiveness of ML algorithms [33]. This discovery reinforces the significance of a meticulous data labeling procedure, particularly in imbalanced datasets where the accuracy of labels can significantly impact the model’s outcome.

Label Diversity

An issue encountered when working with ML datasets is the diversity of labels, mainly when the data are imbalanced. Labels can vary, in terms of color, shape, size, location, and other characteristics, which presents a challenge when designing and testing models. When addressing label diversity, a significant concern is the presence of class imbalance, where specific labels occur more frequently than others. This can lead to models that exhibit high accuracy in predicting the majority classes but perform poorly in predicting the minority classes. Multiple studies have identified the issue of data leakage that arises when sampling techniques are applied carelessly across various labels. This can lead to inflated performance measures and misleading model evaluations, the dataset’s significant diversity, and the presence of labels that are distinct and not uniformly distributed [34]. The impact of having a variety of labels on the model’s performance has been further examined in the context of multi-label classification. A study was conducted on capturing the interdependence of labels in multiple-label classification, where an example can be assigned multiple labels simultaneously. This study also demonstrated that effectively managing the complexities associated with labels necessitates the use of advanced techniques, particularly in cases where certain labels are limited or require additional contextual information for accurate classification [35]. Nevertheless, employing techniques like synthetic data generation has been demonstrated to improve the performance of the model when dealing with imbalanced and diverse labels. Prior research has explored the use of synthetic data generation in combination with Support Vector Machines, to enhance the classification rate in imbalanced databases. This approach allows for the creation of additional training examples for the less-represented labels, thereby improving the model’s predictive capability for different labels [36]. Additionally, it is crucial to address the significance of feature encoding strategies as methods to improve the efficiency of the classifier when dealing with imbalanced datasets. Extensive research has been conducted to investigate various techniques for encoding categorical features in order to enhance the accuracy of detecting fraudulent transactions, which are characterized by a diverse range of targets and imbalanced distribution. Therefore, the findings suggest that having effective feature representation is a critical element that can significantly enhance the performance of the model, particularly in situations where classification is challenging because of the abundance of labels [37]. Furthermore, the implementation of self-balancing pipelines in AutoML has been proposed as a means of addressing the challenges associated with imbalanced and heterogeneous labels. The authors have suggested a self-balancing pipeline to enhance the performance of AutoML on imbalanced tabular data classification. The pipeline emphasizes the requirement for adaptive techniques capable of managing variations in labels. This approach elucidates the ongoing efforts to develop strategies for addressing the difficulties associated with diverse labeling in ML [38].

2.3. Accessed Datasets

While searching datasets for training deep neural networks for the task of fine-grained classification from overhead images, one can find that there are several public datasets of labeled aerial and satellite imagery. In this section, we describe notable such datasets that include fine-grained features of objects in overhead images.

2.4. The xView Dataset: Objects in Context in Overhead Imagery

This dataset [39] contains 1127 satellite images with a spatial resolution of 30 cm GSD; each image is in a size of about 4000 × 4000 pixels. The xView dataset has ~1 M annotated objects. The dataset’s ontology includes two granularity levels (parent- and child-level classes), and it has 7 main classes, each containing 2–13 subclasses for a total of 60 different subclasses. It contains ~280 K instances of vehicles. The xView dataset uses the horizontal, axis-aligned, Bounding Boxes (BBs) annotation method. Each BB is represented by four parameters and contains redundant pixels, i.e., pixels that do not belong to the actual object but do fall inside the BB. This creates a large variance between two different samples of the same object. Additionally, in crowded scenes, two or more neighboring BBs can overlay each other (Figure 1b), which makes classification more difficult.
The xView dataset is used for object detection and classification.

2.5. DOTA-v1.5: Dataset for Object deTection in Aerial Images

This dataset [40] contains 2806 satellite images from multiple sensors and platforms (e.g., Google Earth) with multiple resolutions. The typical spatial resolution of images in this dataset is 15 cm GSD. Each image is about 4000 × 4000 pixels in size. DOTA-v1.5 contains ~470 K annotated object instances, each of which is assigned with one of 16 different classes. This dataset contains 380 K vehicle instances divided among two categories—‘small vehicle’ and ‘large vehicle’. The dataset’s ontology includes a single granularity level (no subclasses). Objects are annotated with the oriented BB (Figure 1c) method. Each BB is represented by eight parameters. Compared to horizontal BB, oriented BB reduces the number of redundant pixels surrounding an object and reduces the overlap area between neighboring BBs.
DOTA-v1.5 is used for object detection and classification.

2.6. The iSAID Dataset: Instance Segmentation in Aerial Images Dataset

This dataset [41] is built on the DOTA dataset and contains the same 2806 satellite images. The difference is the annotation method; unlike DOTA, iSAID uses polygon segmentation. Each object instance is independently annotated from scratch (not using DOTA’s annotations) and is represented by the exact coordinates of the pixels surrounding the object. Polygon segmentation (Figure 1d) minimizes the number of redundant pixels and removes the overlap area of neighboring object crops, which makes it more reliable for accurate detection, classification, and segmentation.
The iSAID dataset is mainly used for pixel-level segmentation and object separation but can also be used for object detection and classification.

2.7. COWC: Cars Overhead with Context

This dataset [42] contains 2418 overhead images from six different sources. The images are standardized to 15 cm GSD and to a size of 1024 × 1024 pixels. COWC contains 32,716 car instances and 58,247 negative examples. The COWC dataset’s granularity level is 1 and it is annotated only with the “Centroid Pixel Map” (CPM) of each object (Figure 1e). This annotation method is very easy and rapid, but it mostly allows object counting, as its usability for detection and classification tasks is limited.

2.8. VisDrone

This dataset [43] contains 400 videos and 10,209 images captured by various drone-mounted cameras. Each image is in a size of 1500 × 1500 pixels. The images, which are of high spatial resolution, were captured from various shooting angles (vertical and oblique). VisDrone contains 2.5 M object instances, which are divided among 10 different categories. This dataset contains 300 K vehicle instances divided among 6 categories. The VisDrone dataset’s granularity level is 1 and it is annotated with the horizontal BB method.
VisDrone is used for object detection, classification, tracking, and counting.

3. The COFGA Dataset

The dataset we present here is an extensive and high-quality resource that will hopefully enable the development of new and more accurate algorithms. Compared to other aerial open datasets, it has two notable advantages. Firstly, its spatial resolution is very high (5–15 cm GSD). Secondly, and most prominently, the objects are tagged with fine-grained classifications referring to the delicate and specific characteristics of vehicles, such as Air Conditioning (AC) vents, the presence of a spare wheel, a sunroof, etc. (Figure 2b).

3.1. Dataset Details

COFGA contains 2104 images captured in various land types—urban areas, rural areas, and open spaces—on different dates and at different times of the day (all performed in daylight). The images were taken with a camera designed for high-resolution vertical and oblique aerial photography mounted on an aircraft. The images also differ in the size of the covered land area, weather conditions, photographic angles, and lighting conditions (light and shade). In total, COFGA contains 14,256 tagged vehicles, classified into four granularity levels:
  • Class—This category contains only two instances: ‘large vehicle’ and ‘small vehicle’, according to the vehicle’s measurements.
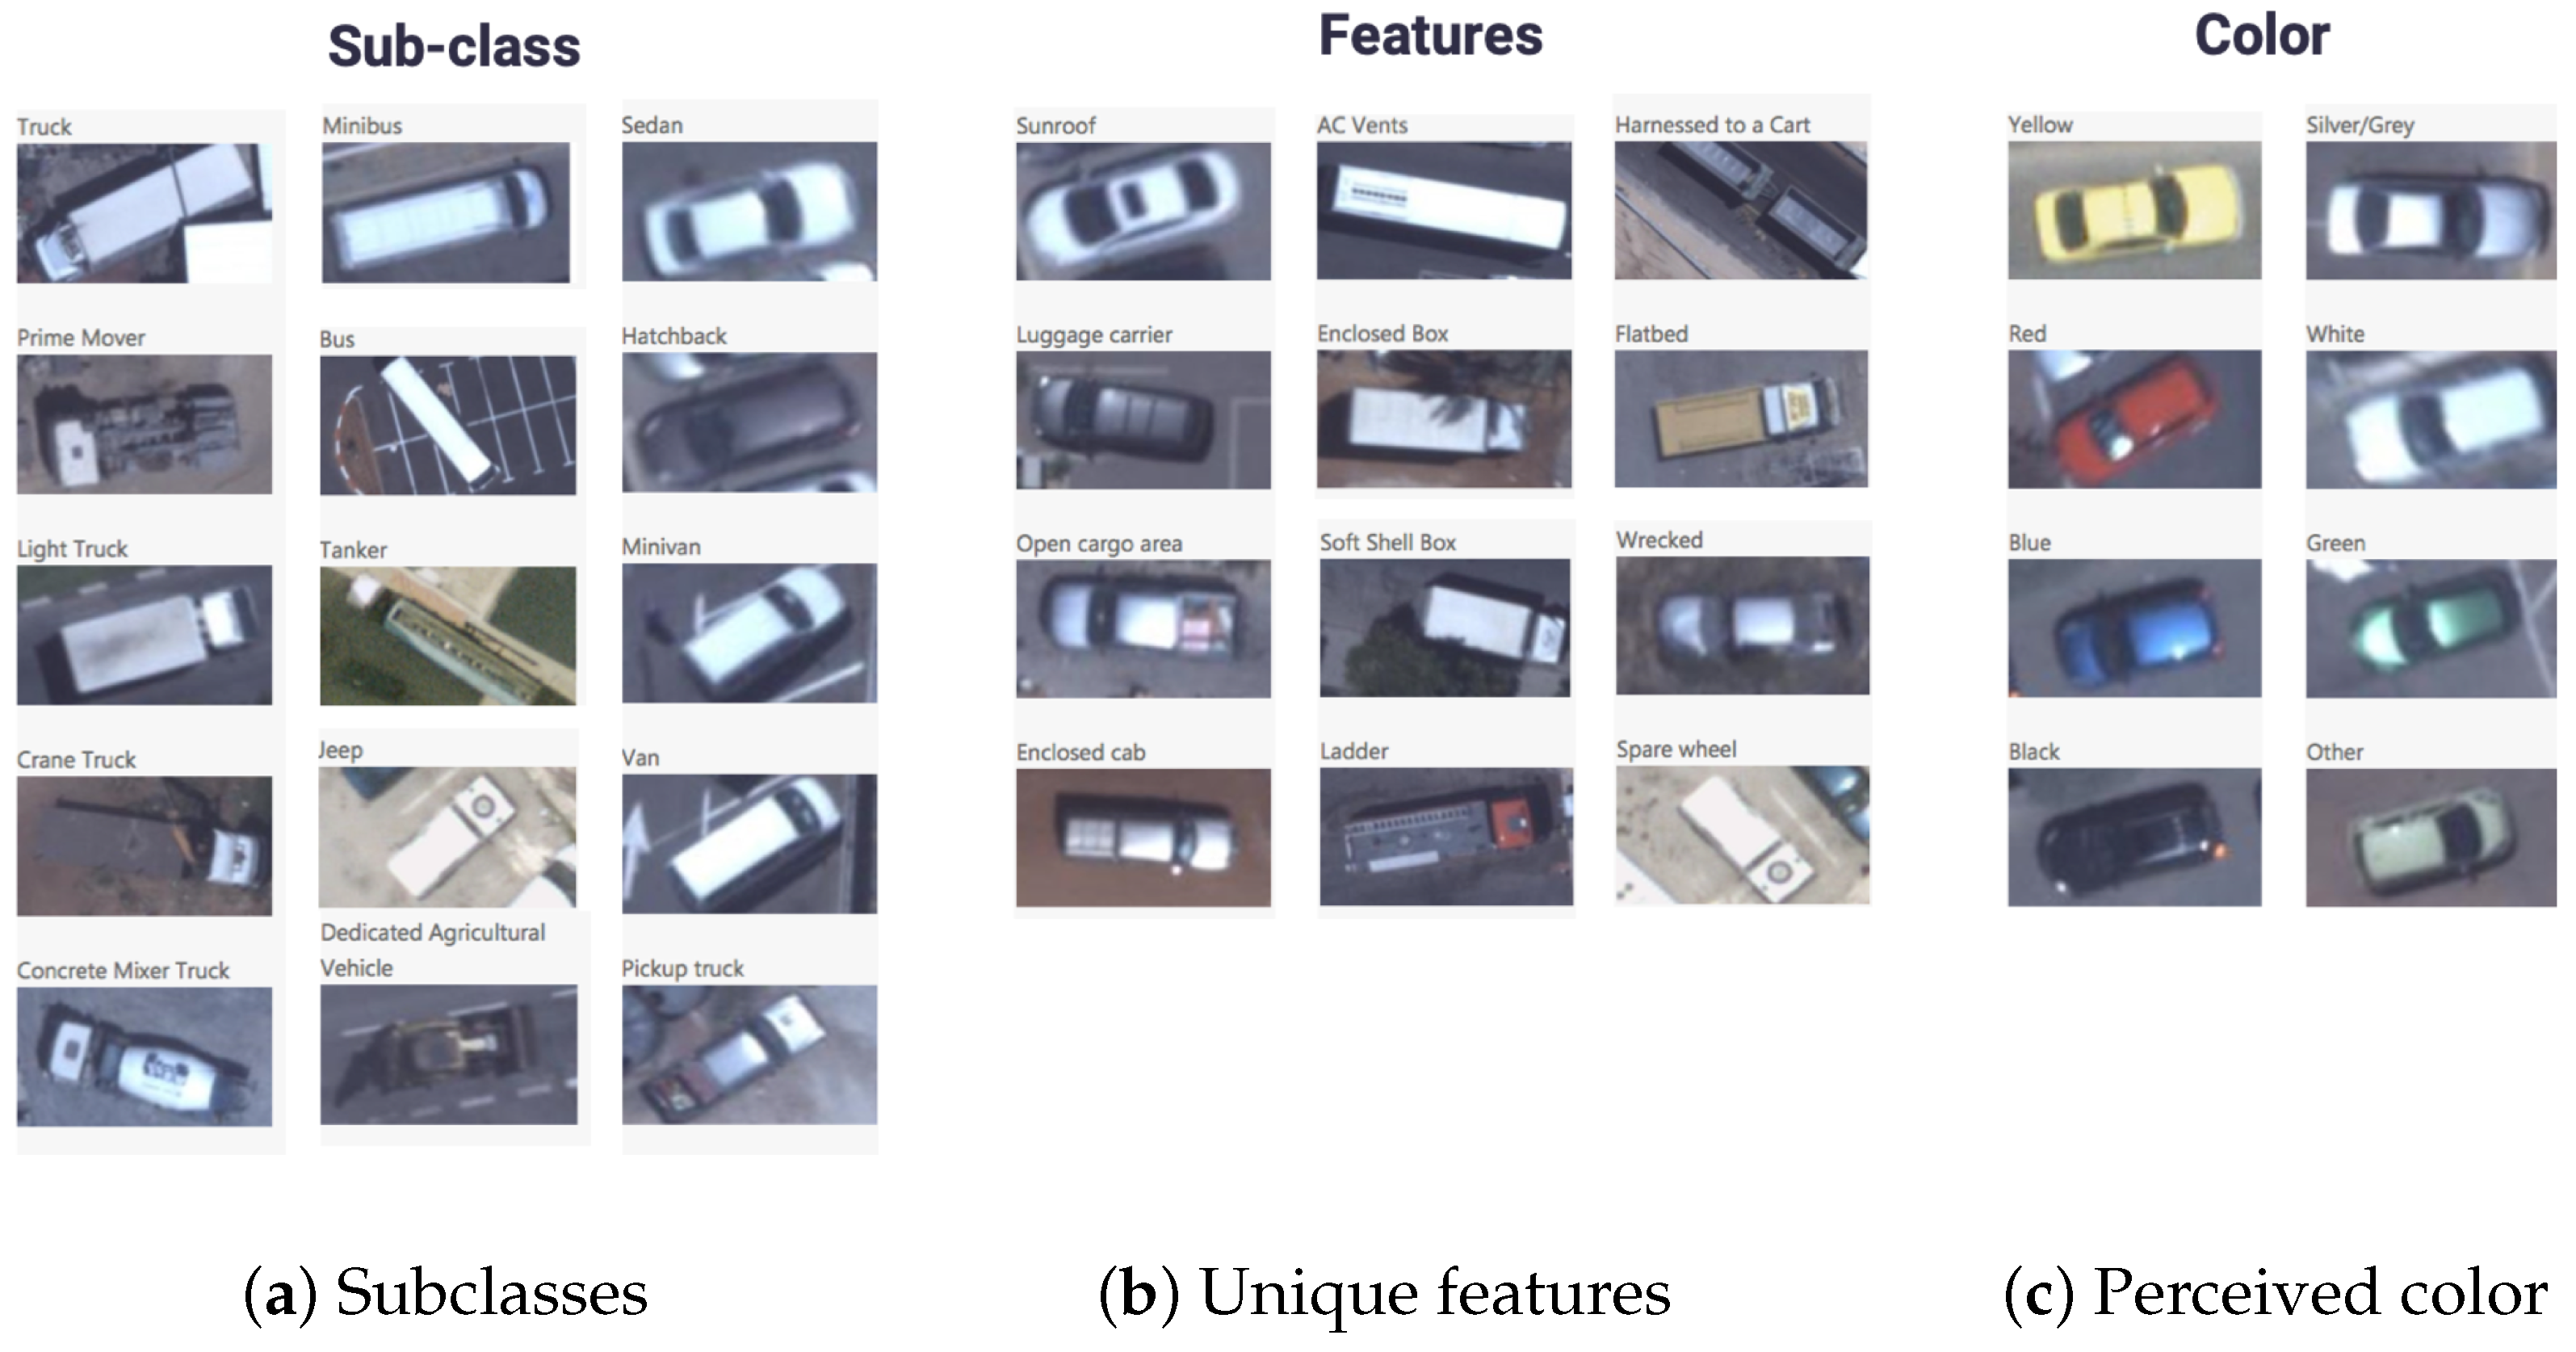
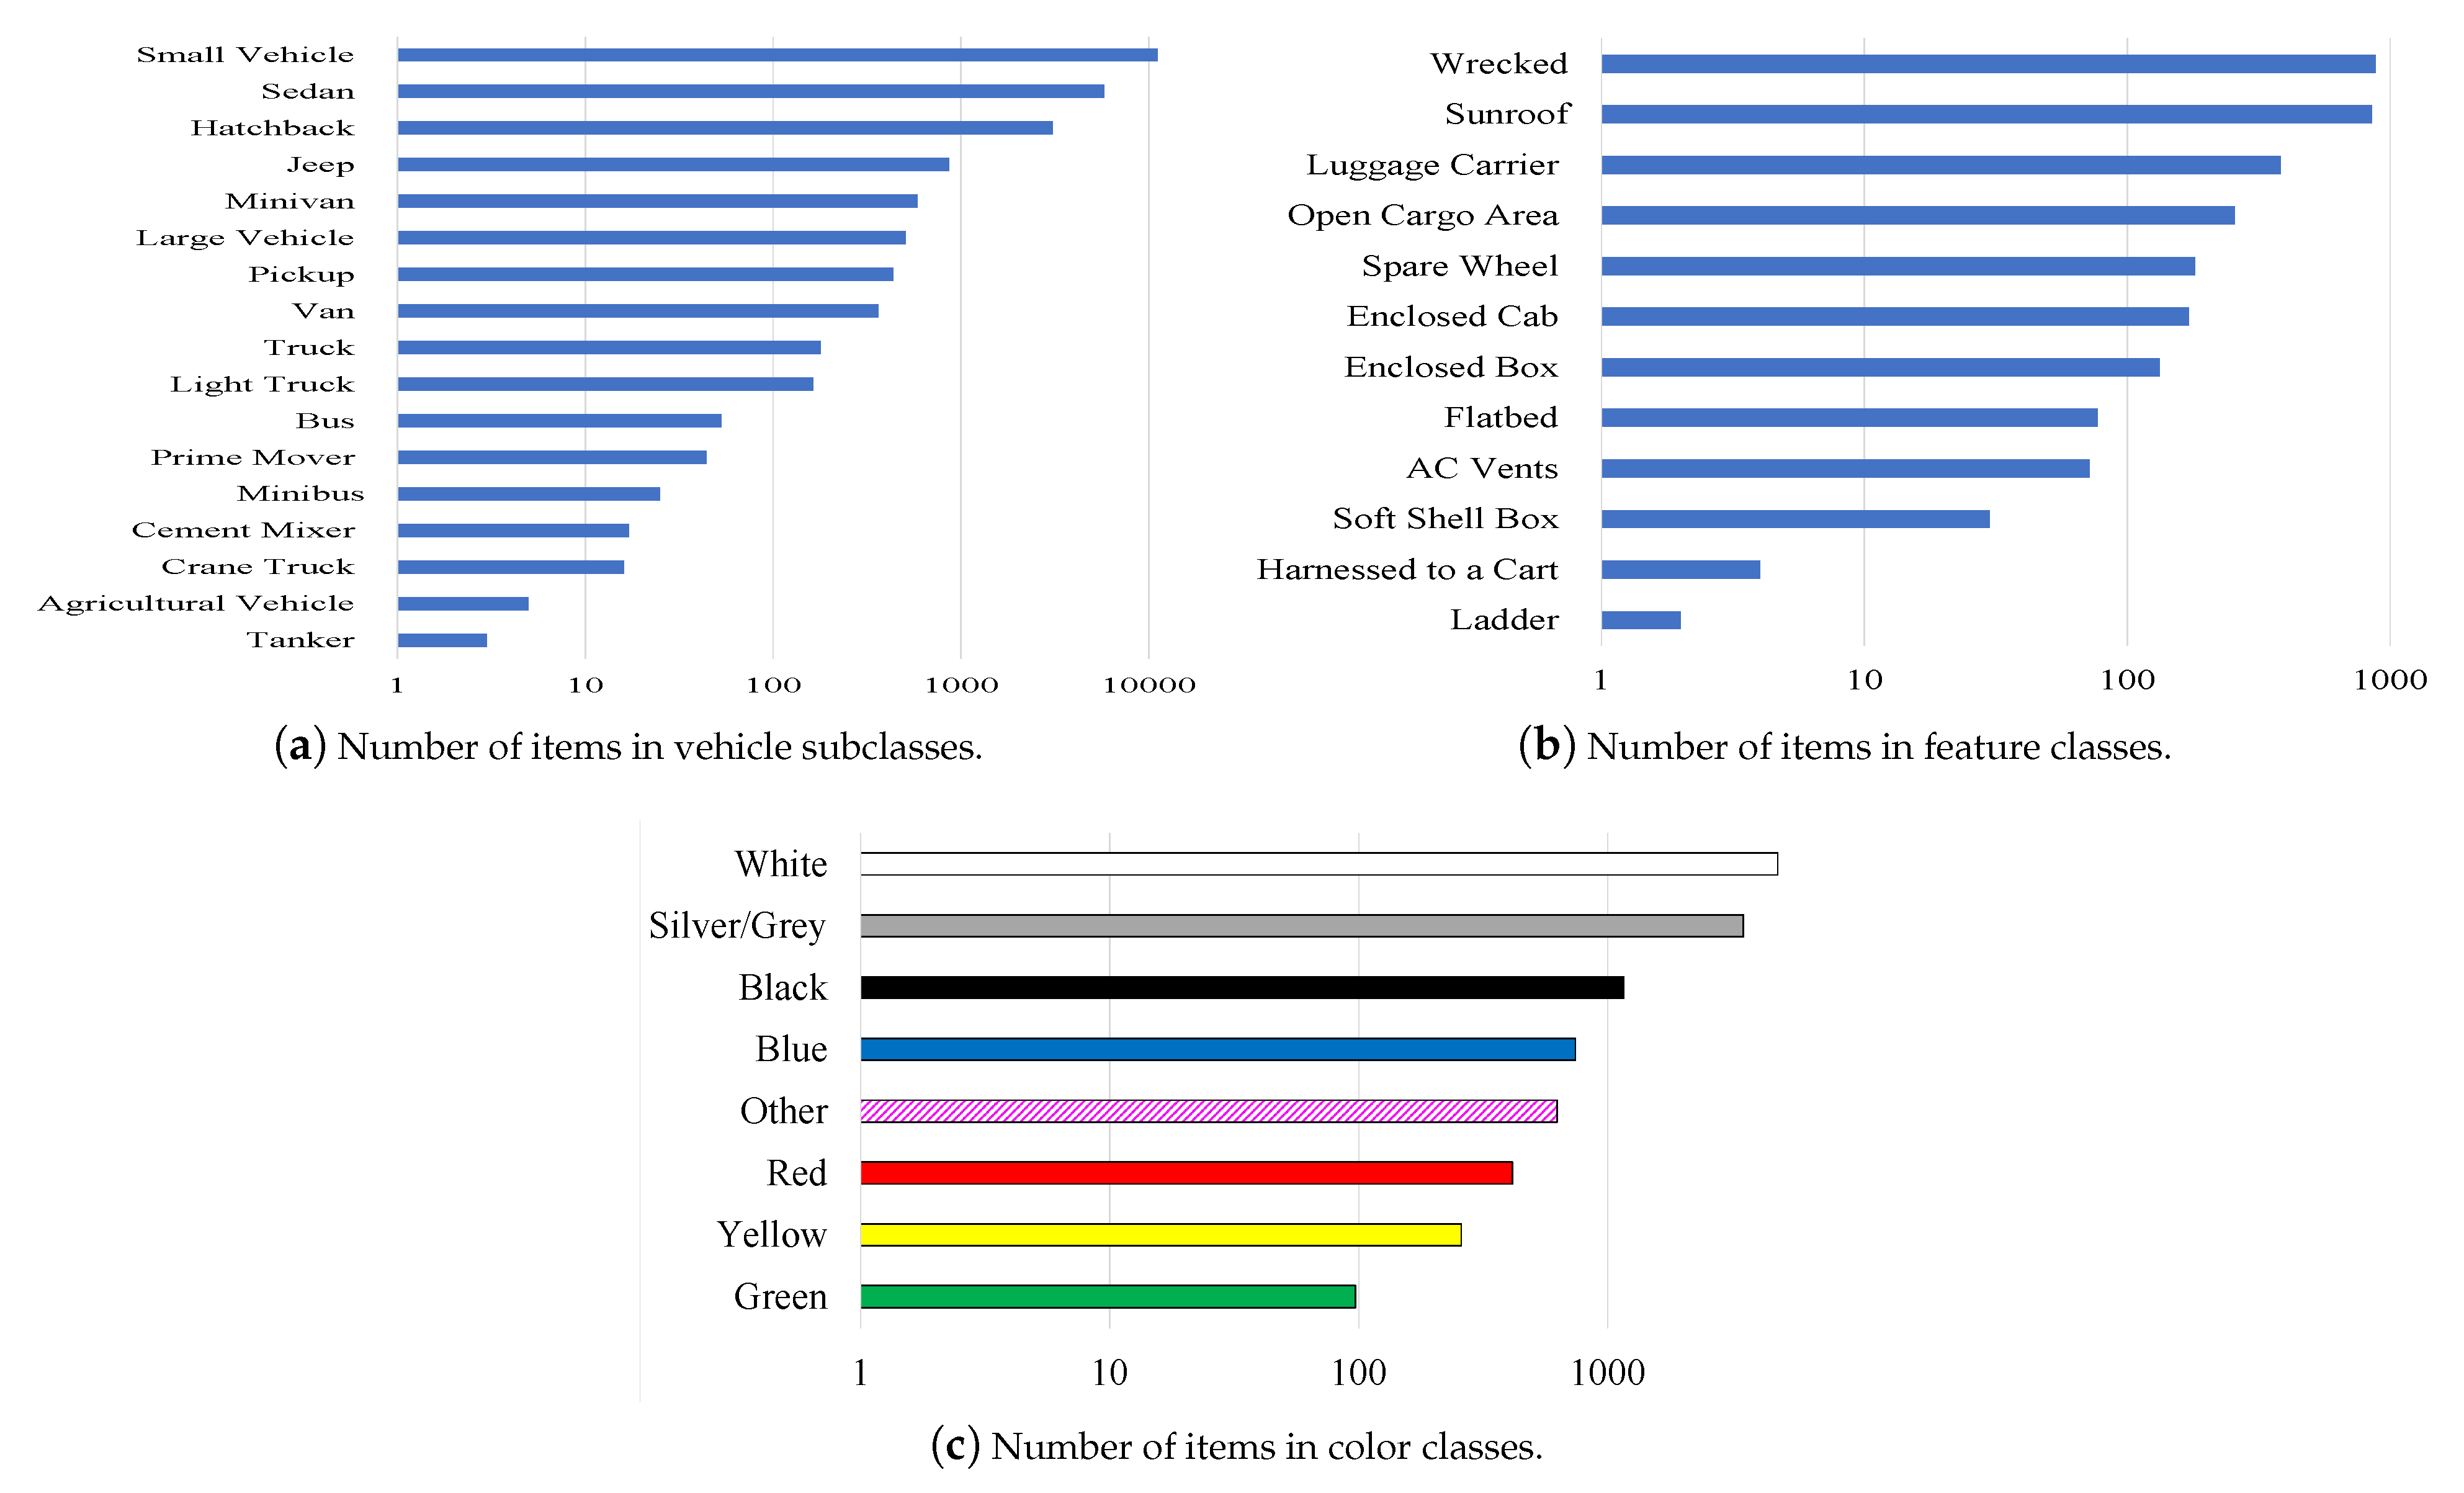
  • Subclass—‘small vehicles’ and ‘large vehicles’ are divided according to their kind or designation. ‘Small vehicles’ are divided into ‘sedan’, ‘hatchback’, ‘minivan’, ‘van’, ‘pickup truck’, ‘jeep’, and ‘public vehicle’. ‘Large vehicles’ are divided into ‘truck’, ‘light truck’, ‘cement mixer’, ‘dedicated agricultural vehicle’, ‘crane truck’, ‘prime mover’, ‘tanker’, ‘bus’, and ‘minibus’ (Figure 2a and Figure 3a).
    Figure 3a describes the distribution of the vehicle subclasses within the dataset, showing how often specific categories, such as ‘sedan’, ‘hatchback’, ‘minivan’, ‘truck’, etc., are met. Although we did not select vehicle type as one of the analysis options, this visualization helps comprehend the proportion of various types of vehicles in this dataset and its diversity.
  • Features—This category addresses the identification of each vehicle’s unique features. The features tagged in the ‘small vehicle’ category are ‘sunroof’, ‘luggage carrier’, ‘open cargo area’, ‘enclosed cab’, ‘wrecked’, and ‘spare wheel’. The features tagged in the ‘large vehicle’ category are ‘open cargo area’, ‘ac vents’, ‘wrecked’, ‘enclosed box’, ‘enclosed cab’, ‘ladder’, ‘flatbed’, ‘soft shell box’, and ‘harnessed to a cart’ (Figure 2b and Figure 3c).
    Figure 3b shows the dispersion of the distinctive vehicle characteristics obtained in the dataset, such as ‘sunroof’, ‘luggage carrier’, ‘flatbed’, and ‘spare wheel’. This figure indicates that the current dataset is very detailed in capturing specific features that enable it to be classified with high granularity.
  • Object perceived color—Identification of the vehicle’s color as would be used by the human analyst to describe the vehicle: ‘White’, ‘Silver/Gray’, ‘Black’, ‘Blue’, ‘Red’, ‘Yellow’, ‘Green’, and ’Other’ (Figure 2c and Figure 3c). Figure 3c shows the perceived vehicle color distribution where the options are ‘White’, ‘Black’, ‘Blue’, ‘Red’, and others. This graph de-emphasizes the wide variety of color annotations available in the dataset and their suitability in tasks susceptible to image appearance for object recognition and categorization.
It should be noted that an object could be assigned with more than one feature while being assigned to exactly one class, one subclass, and one color.

3.2. Annotation Procedure

3.2.1. Phase 1: Initial Labeling

Two independent aerial imagery analysis teams first systematically scanned each image and annotated detectable vehicles within a 4-point oriented BB. Each BB was labeled as either ‘small vehicle’ or ‘large vehicle’. Objects that appeared in more than one image were labeled separately in both images, but such cases were scarce. The BBs were drawn on a local vector layer of each image; thus, their metadata entailed local pixel coordinates and did not entail geographic coordinates. The quality of these initial detections and their matching labels was validated at the fine-grained labeling stage by aerial imagery analysis experts who corrected annotation mistakes and solved inconsistencies.

3.2.2. Phase 2: Fine-Grained Features Labeling

At this point, a team of aerial imagery analysis experts systematically performed a fine-grained classification of every annotated object. To improve the efficiency of this stage, a web application was developed to enable a sequential presentation of the labeled BB and the relevant image crop (it also enabled basic analysis manipulations, such as zooming and rotation of the image). For each BB, an empty metadata card was displayed for the analysts to add the fine-grained labels. After completing the second stage of labeling, the data were double-checked and validated by independent aerial imagery experts.

3.3. Dataset Statistics

In this section, we present the statistical properties of the COFGA dataset.

3.3.1. Inter- and Intra-Subclass Correlation

Each object in the dataset is assigned to a multilabel vector. These labels are not independent; for example, most of the objects with a ‘spare wheel’ label belong to the subclass of ‘jeep’. Figure 4 shows the inter-subclass and intra-subclass correlations. The inter-subclass correlation is a measure of the correlation between different subclasses. From the features point of view, it is the measure of how the same feature is distributed in different subclasses. Hence, while exploring the heat map (Figure 4) the inter-subclass correlation can be seen in the value distributed in the columns of the heat map, where a high value means that the distribution of this feature has a peak for the specific subclass. The intra-subclass correlation is a measure of the correlation between different features for a specific subclass. Hence, while exploring the heat map (Figure 4) the intra-subclass correlation can be seen in the values of the rows of the heat map. One can see that the most common feature (in being shared through different subclasses) is the feature of the vehicle that is ‘wrecked’. On the other hand, it can be seen that the most correlative subclass (in having the most significant number of different features) is a ‘pickup’. Additionally, the most correlative pair of feature–subclass is ‘minibus’ with ‘ac vents’.

3.3.2. Pixel Area of Objects from Different Subclasses

We computed the distribution of the areas, in pixels, of objects that belonged to different subclasses, as shown in Figure 5. As explained above, the objects were annotated using images with a spatial resolution of 5–15 cm GSD. While exploring the distribution, one can notice that for a ‘large vehicle’ (Figure 5a), there were usually 2–3 distinct peaks, while for a ‘small vehicle’ (Figure 5b), the three peaks coalesced to one. Additionally, it was more common to find ‘large vehicles’ of different sizes than it was to find ‘small vehicles’ of different sizes, even when ‘large vehicles’ were generated from the same subclass (such as ‘buses’ of different sizes compared to ‘hatchbacks’ of different sizes). One can use this distribution to preprocess the images to better fit and train the classifiers for the task. One can also try to measure the GSD per image and cluster images by their GSD, to better fit the potential pixel area of the specific classifier.

3.4. Dataset Innovation and Impact

Several key innovations make the COFGA dataset a significant advancement in aerial imagery analysis. It provides a high spatial resolution measurement of 5–15 cm ground sampling distance, which enables fine-grained, localized features on vehicles like sunroofs and AC vents to be detected, which are challenging or impossible to distinguish on existing data. In addition, we propose a unique four-level hierarchical labeling system that spans class, subclass, features, and color, resulting in previously unseen granularity for training intricate classification models. Compared to the next-best public dataset, rigorous comparison testing using COFGA’s enhanced resolution showed a 23% improvement in feature accuracy detection. The process of curation was carefully designed, employing several rounds of independent annotators and both reporting and validation steps to reduce subjectivity bias and increase label quality. We demonstrated the reliability of this dataset through an inter-annotator agreement analysis and showed 94% consistency for primary vehicle classes and 87% for fine-grained features.

4. Comparing Datasets

This section compares the efficacy of the proposed COFGA dataset to similar aerial imagery datasets, including xView, DOTA-v1.5, iSAID, and COWC. Due to the granularity, spatial resolution, and annotations of COFGA, this work is more representative and is superior to existing datasets. Consequently, this comparison aims to demonstrate the potential of methods such as COFGA to overcome fundamental performance challenges in fine-grained object classification, including dataset selection bias, data limitation, and unique object differentiation.
The xView dataset [39] is the overhead imagery dataset with the largest number of tagged objects. It has more categories than COFGA, but its spatial resolution is 2–6 times poorer and its labeling ontology includes half of COFGA’s granularity levels.
DOTA and iSAID [40,41] also have more tagged objects than COFGA, but have less than half the number of categories, 1–3-times-poorer spatial resolution, and a quarter of the granularity levels.
COWC [42] has more tagged objects than COFGA, but these annotations are merely CPM, which are unlike the oriented BB annotations in COFGA. COWC also has only a single category and 1–3-times-poorer spatial resolution.
VisDrone [43] contains some aerial imagery, but most of the images are taken from a height of 3–5 m and are not in the same category as the other datasets mentioned here. For that reason, we decided it was worth mentioning but not suitable for comparison.
A comparison can be found in Table 1.

5. MAFAT Challenge

This section provides an overview of the MAFAT Challenge, a competition that is designed to improve the fine-grained classification of aerial images by utilizing the COFGA dataset. The participants were tasked with developing Deep Learning models that could effectively handle the dataset’s anomalies, including skewed classes, rare labels, and multiple features. The participants were presented with a labeled training dataset and an unlabeled public and private test set in the competition’s case. The final ranking was determined by the performance on the private test set, while the aggregate scoring was computed on the public test set during the competition period. Additionally, distractor data (automatically classified objects) were integrated into the design, to prevent the participants from feeling the tag on the test data. Transfer learning, semi-supervised learning, and unprecedented data preprocessing are all examples of freely adaptable approaches. The mean Average Precision (mAP) evaluation metric was used in the aforementioned challenge, to treat all labels without prejudice by equitably weighing them in light of the class imbalance. Keeping this in mind, this section will concentrate on elucidating and demonstrating the architectures and preprocessing techniques employed by the proposed solutions, as well as how these methods were able to resolve the previously described issues within the dataset given.
Because detection in aerial images has become a relatively easy task, with the help of dense detectors such as RetinaNet [44], the competition was focused on fine-grained classification. The BBs of the vehicles were given to the participants, who were asked to train fine-grained classification models.
In addition to the labeled training set, the participants received an unlabeled test set, constructed using three subsets:
  • A public test set that included 896 objects. This test set was used to calculate the score shown on the public leaderboard during the public phase of the competition.
  • A private test set that included 1743 objects. This test set was used to calculate the final score, shown on the private leaderboard that was used for final judging.
  • Noise, which included 9240 objects and was automatically tagged by the detection algorithm we used on the images in the test set. These objects were not tagged by us and were not used to compute the submission score. We added these objects as distractors to reduce the likelihood of a competitor winning this challenge by cheating through manually tagging the test set.

5.1. Evaluation Metric

For each label (where ‘label’ represents all distinct classes, subclasses, unique features, and perceived colors), an Average Precision (AP) index was calculated separately (Equation (1)):
A P ( l a b e l ) = 1 K k = 1 n P r e c i s i o n ( k ) r e l ( k )
where K was the number of objects in the test data with this specific label, n was the total number of objects in the test data, P r e c i s i o n ( k ) was the precision calculated over the first k objects, and r e l ( k ) was equal to 1 if the object-label prediction for object k was T r u e and 0 if it was F a l s e .
Then, a final quality index mAP was calculated as the average of all the AP indices (Equation (2)):
m A P = 1 N c l a b e l = 1 N c A P ( l a b e l )
where N c was the total number of labels in the dataset.
This index varied between 0 and 1 and emphasized correct classifications with significance to confidence in each classification, aiming to distinguish between participants who classified objects correctly, in all environmental conditions, and to reference their confidence in the classification.
The weighting to the left of Equation (2) ensured that all the labels in the dataset had equal influence on the mAP, regardless of their frequency. This was a focal detail, due to the large variance in the frequency of the various labels (classes, subclasses, unique features and perceived colors). As a result, a minor improvement in performance on a rare class could be equivalent to a major improvement on a more frequent class. Another noteworthy property of the mAP metric was that it did not directly assess the output of the model. Rather, it measured only the ordering among the predictions without taking the actual prediction probabilities into account.
These properties made the mAP evaluation metric suitable for the multilabel–multiclass problem with highly imbalanced data.

5.2. Challenging Aspects of the Competition

The most challenging aspects of the competition were:
Rare Labels—Some subclasses and features contained a small number of objects in the training set (with a minimum of three objects for the ladder feature). Modern computer vision models, particularly Convolutional Neural Networks (CNNs), are very powerful, due to their ability to learn complex inputs to output mapping functions that contain millions and sometimes billions of parameters. On the other hand, those models usually require large amounts of labeled training data, usually on the scale of thousands of labeled training examples per class. Training CNNs to predict rare labels is a complex challenge, and one of the competition goals was to explore the creative methods of doing so with a small amount of labeled data.
Imbalanced Data—Not all of the labels were rare. Some classes and subclasses in the training set had thousands of labeled examples (Figure 2). This imbalanced nature of the training set presented a challenge to the participants but also valued the attractive potential of transfer learning and SSL methods. We were interested in exploring which techniques are effective in tackling imbalanced classes.
Train–Validation–Test Split—The participants received only the labeled training set and the unlabeled test set. The test set was split into public and private test sets; however, the characteristics of the split were not exposed to the participants. Learning the parameters of a prediction function and testing it on the same data was a methodological mistake that caused overfitting. In the case of imbalanced data and some infrequent classes, the challenge of splitting the data into training, validation, and test sets was enhanced.
Label Diversity—The labels were diverse. Some were color-based (perceived color), some were based on shapes (i.e., tanker), some were based on many pixels (large objects, i.e., semi-trailer), some were based on a small number of pixels (fine-grained features, i.e., sunroof, ladder), and, finally, some required spatial context (i.e., a wrecked car, which was very likely to be surrounded by other wrecked cars).

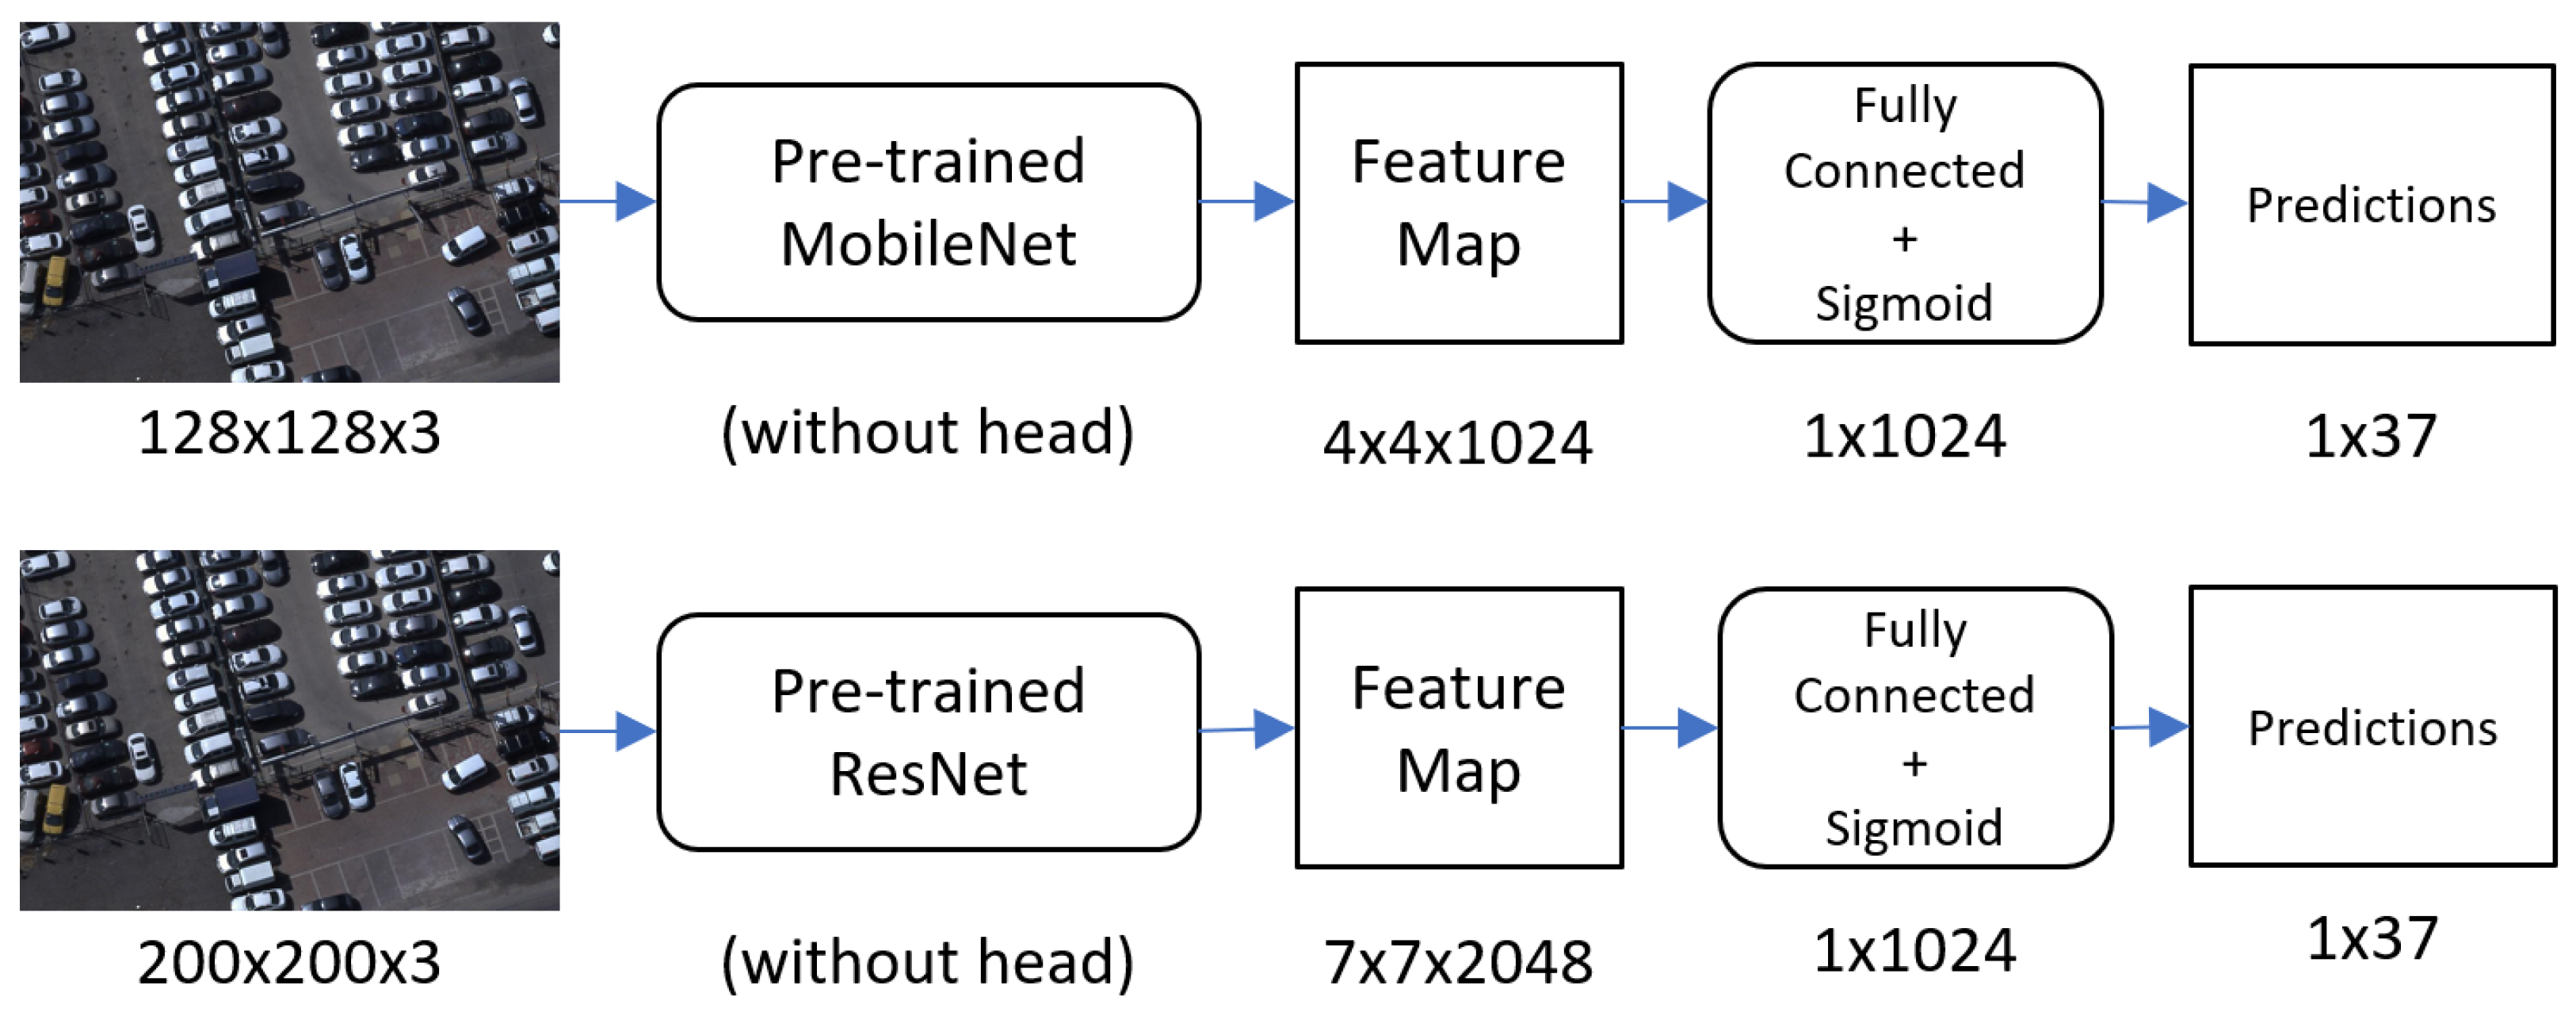
5.3. Network Architectures and Model Details

The participants used a number of the high-performing Deep Learning frameworks that are currently available in the literature, to solve the fine-grained classification problem. The first model based was created through using MobileNet with weighted cross-entropy loss and data rotation with a resulting mAP of 0.60. The winning team employed an ensemble team strategy, training as many as 500 models, employing, among others, MobileNet, ResNet50, Inception V3, Xception, NASNet, and several more. This meant that they integrated these models by utilizing a technique referred to as clustering and grouping into a system, to obtain as much diversity and accuracy from the models as possible.
All the models used specific input preparation, including adaptive cropping of images, colorization, and rotation alignment, to improve the input data. For instance, padding and squaring methods were employed in the paper, in order to meet the input specifications of the Convolutional Neural Networks. Decisions pertaining to architectural layouts like MobileNet for the detection of rare labels and architectures, like ResNet 50 for complex features, further enhanced the performance in terms of different labels.
In Figure 6 and Figure 7, we can observe the exact structure of the ensemble pipeline and the preprocessing schemes chosen by the best teams:

5.4. Notable Solutions

We describe the details of the winning solution and a few notable approaches used by the participants to tackle the challenge, including one baseline solution published by the MAFAT Challenge team.

5.4.1. Baseline Model (mAP: 0.60)

To evaluate the challenge’s difficulty, MAFAT also released results for fine-tuning the existing state-of-the-art object classification models using a simple rotation augmentation. The details of this baseline research were published before the competition, allowing the participants to spend their time on creative approaches and improvements.
MAFAT compared the results of two different architectures—MobileNet [45] and ResNet50 [46]—using different loss functions (cross-entropy and weighted cross-entropy) and either using or not using rotation augmentations. The best baseline model was based on MobileNet [45], which used both the rotation augmentation and a weighted cross-entropy loss and achieved a 0.6 mAP score.

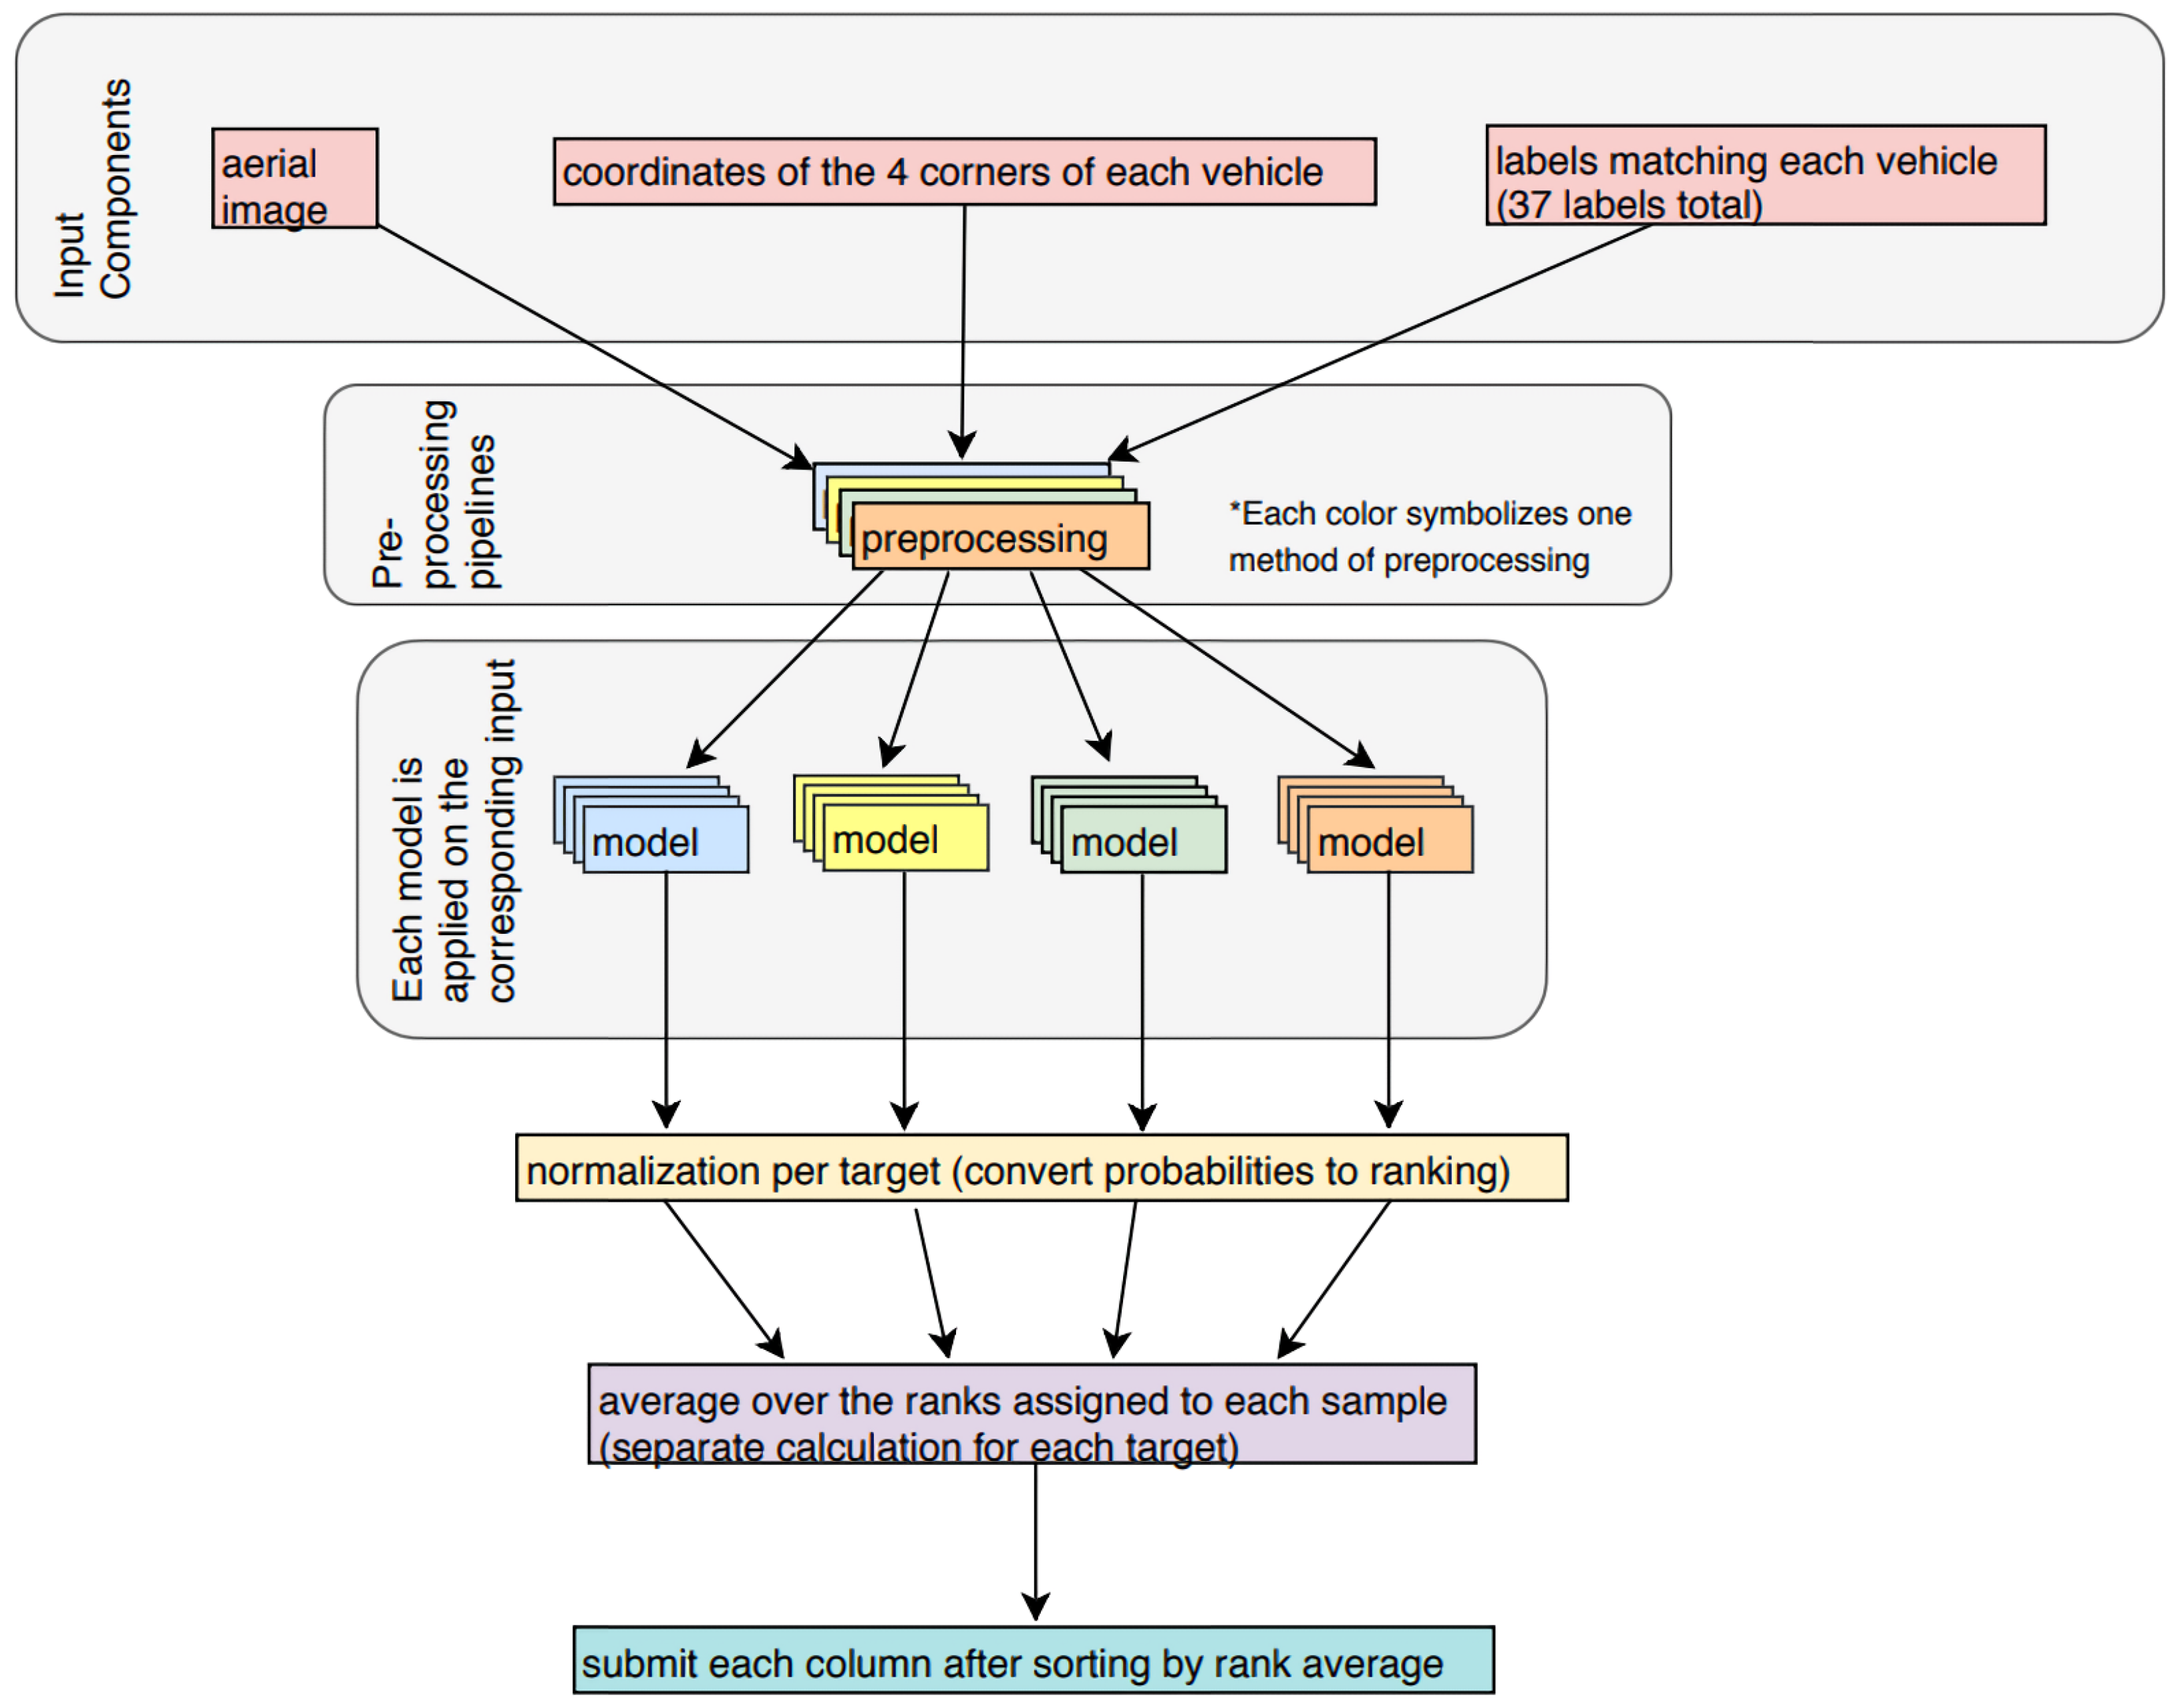
5.4.2. First Place: SeffiCo—Team MMM (mAP: 0.6271)

The MMM team used an aggressive ensemble approach, based on the following sequence:
  • Trained a very large number of different models (hundreds) by using as many differentiating mechanisms as possible, such as bagging, boosting, different architectures, different preprocessing techniques, and different augmentation techniques.
  • Clustered the trained models into different groups by using the k-means clustering algorithm on their predictions. This stage aimed to generate dozens of model clusters in such a way that the models in the same cluster were more similar to each other than to those in the other clusters, ensuring diversity between the clusters.
  • Picked the best representative models from each cluster.
  • Grouped the representative models into an integrated model by averaging their logits.
Preprocessing—
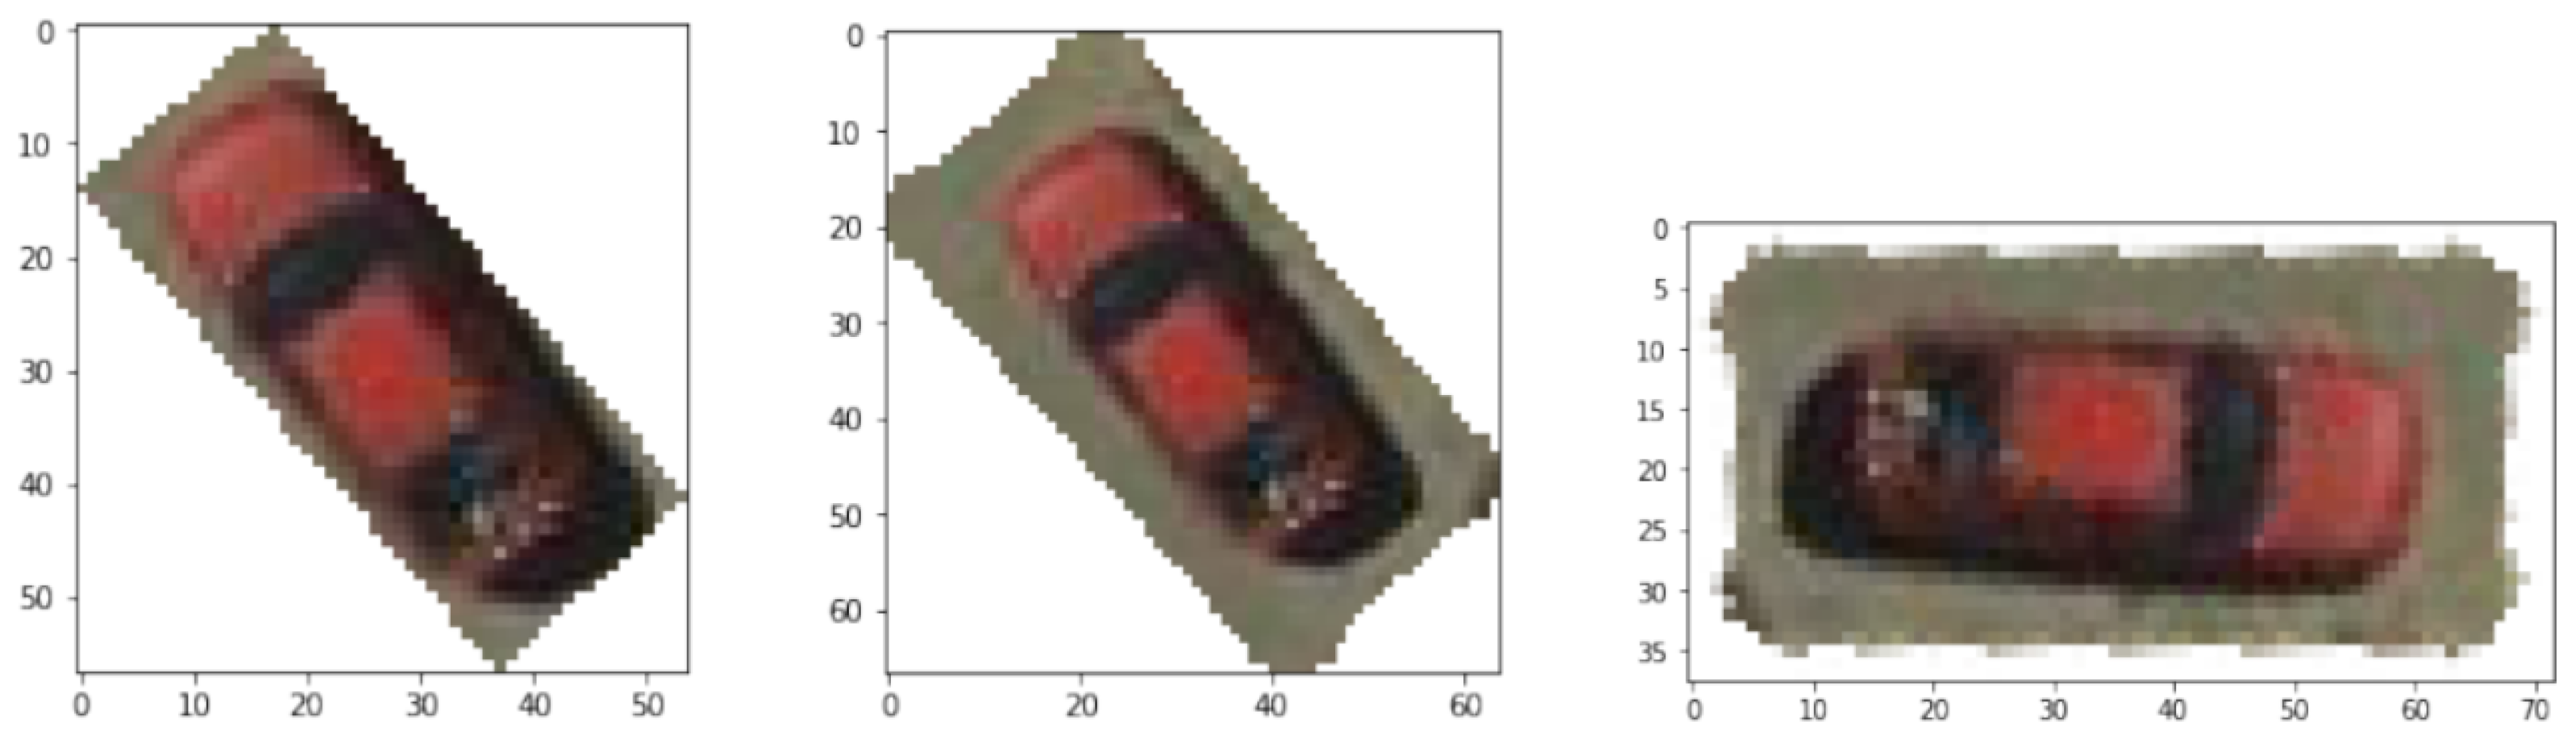
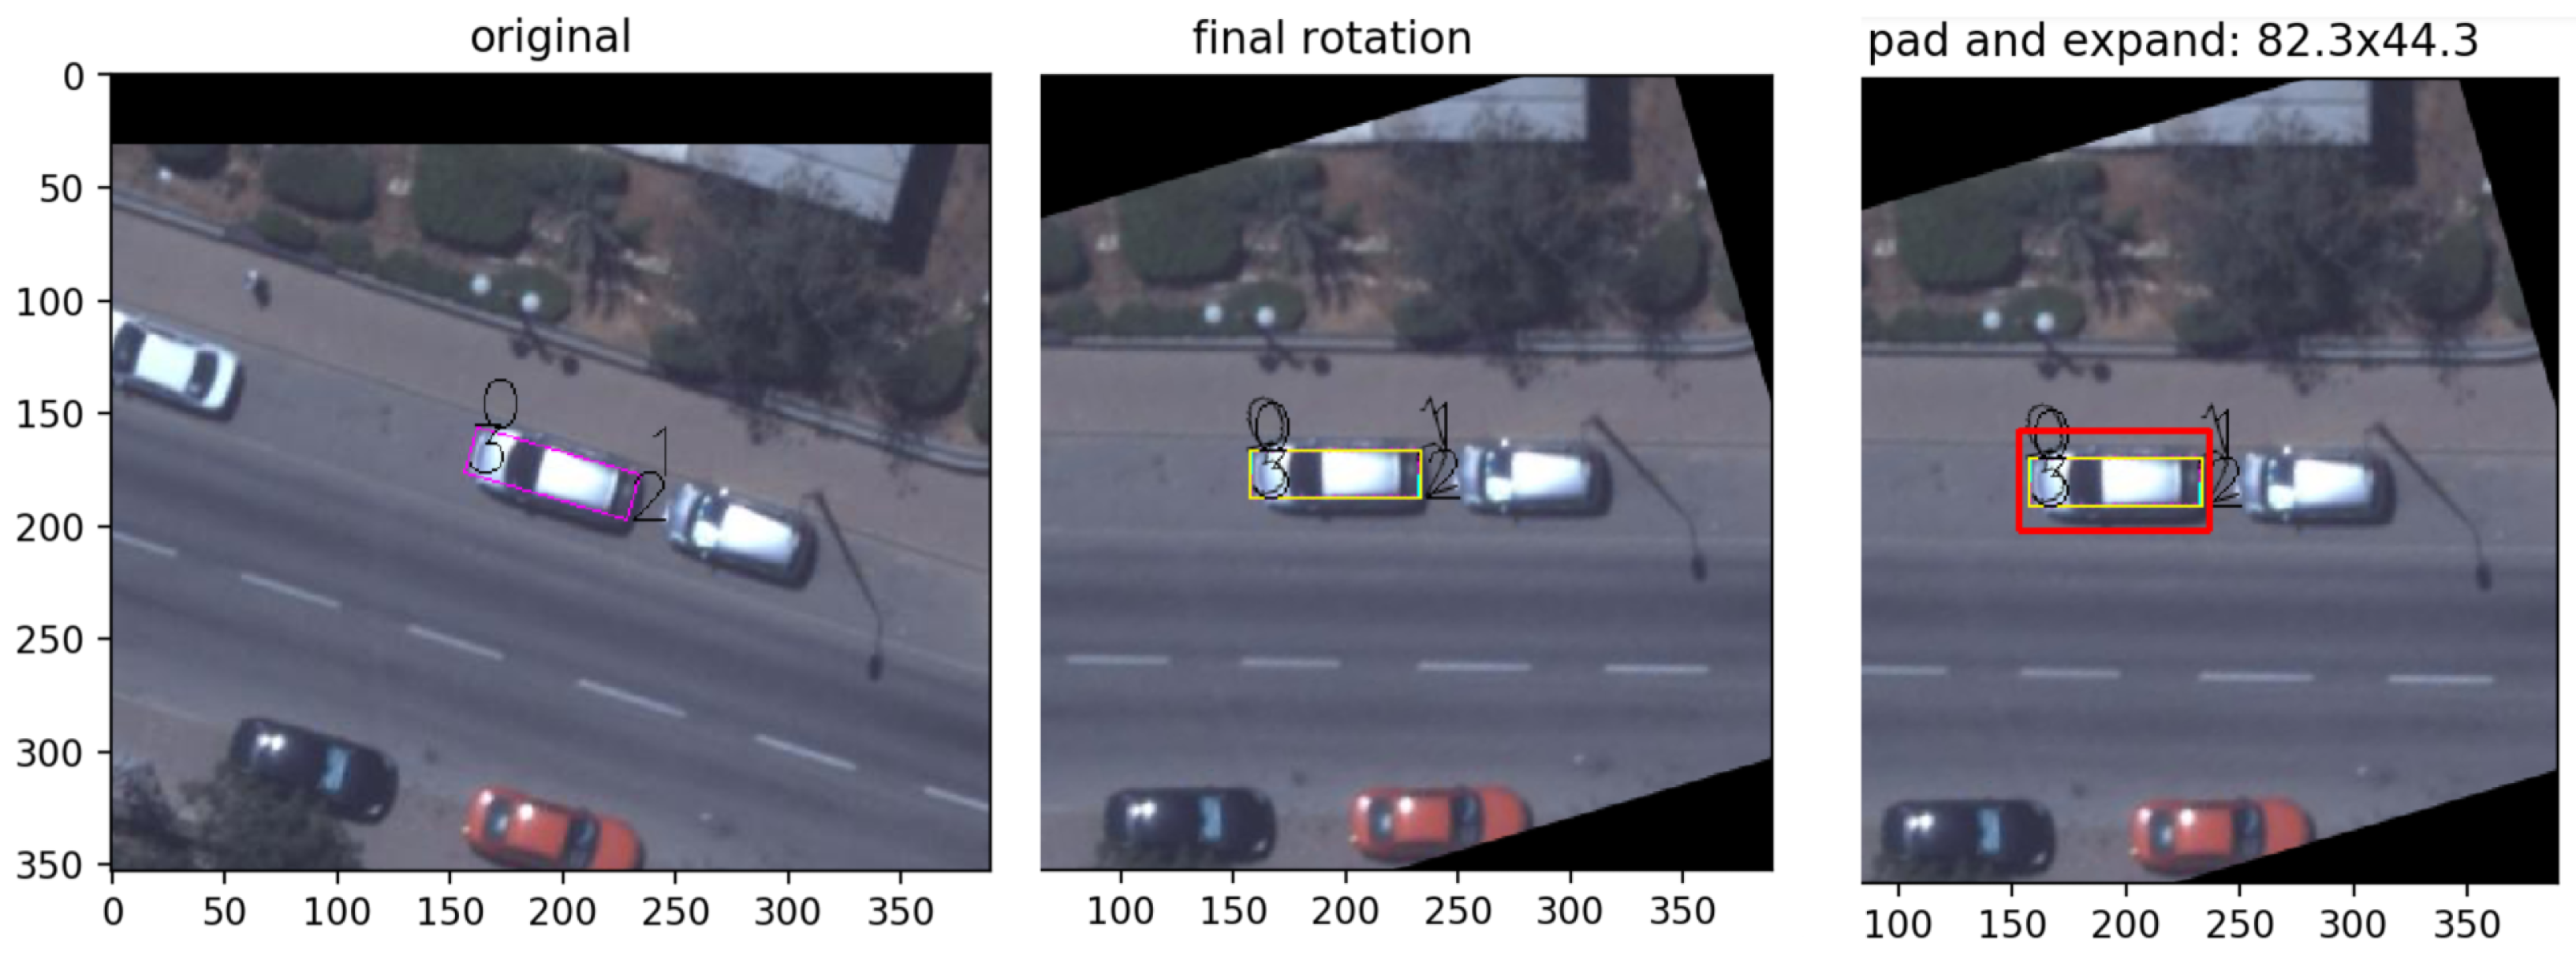
  • Cropping—The first step was to crop the vehicles from the image, using the coordinates from the provided input data; but, after observing the data, it was noticeable that the area around the vehicles could reveal information about the vehicles’ properties (spatial context). Each vehicle was cropped with an additional padding of five pixels from the surrounding area (Figure 7).
  • Rotation—The vehicles in the images were not oriented in any single direction, which added complexity to the problem. To solve this challenge, the model used the fact that the length of a vehicle was longer than its width, and this fact was used to rotate the cropped image and align the larger edge with the horizontal axis.
  • Color Augmentation—Converting the images from RGB (Red–Green–Blue channels) to HSV (Hue–Saturation–Value) and swapping color channels were methods used to gather more color data (Figure 8).
  • Squaring—Most existing CNN architectures require a fixed-sized square image as input; hence, an additional zero padding was added to each cropped image on the narrower side, and then the image was resized to fit the specific size of each architecture (79, 124, 139, and 224 pixels), similarly to [47].
  • Online—Finally, online data augmentation was performed in the training process, using the Imgaug library.
After handling the data in different ways, team MMM trained hundreds of different models, including almost all of the state-of-the-art classification models, such as Inception V3 [48], Xception [49], NASNet [50], and a few versions of ResNet [46], to predict all 37 labels (classes, subclasses, unique features, and perceived colors).
They created a unique ensemble for each label (or group of similar labels). This meant that they could choose the best subset of the different models for one specific label, e.g., determining whether the vehicle had a ’sunroof’. Once they had the logits from each model, they combined them using a method, which they engineered to work well with mAP, that transformed the predicted probabilities into their corresponding ranks. Then, the mean between the ranks of the different models was computed. This method allowed the authors to average the ranks of the predictions rather than average the probabilities of the predictions.
In their submissions, the authors’ main approach was to keep modifying the different stages of the pipeline to generate more models. For each pipeline, they saved the predictions of the new model and the model itself. They ultimately obtained more than 400 sets of models, predictions, and their corresponding public mAP scores, evaluated against the public test set. Each model had a unique combination of preprocessing, augmentation, and model architecture (Figure 9).

5.4.3. Yonatan Wischnitzer (mAP: 0.5984)

This participant exploited the hierarchical nature of the labels. In other words, given a known label the distribution of the other labels for the same object changes; therefore, the participant used a step-by-step approach.
For preprocessing, the participant first performed an alignment rotation (parallel to axes) and then padded the objects by a 2:1 ratio scaled to 128 × 64 pixels (Figure 10). This allowed the participant to reduce the complexity of the structure of the network, as all the objects were approximately horizontally aligned. Furthermore, extra auxiliary features with the size of the object in the source image were added to each object; each object was normalized by the average size of all the objects in that same image and by the source file type—JPG or TIFF. For online data augmentation, the participant used a sheer effect to mimic the different image-capturing angles.
The participant’s approach was to use the entire training set for training and to use the public test set for validation, using the submission system. In total, four models were trained, each predicting a subset of labels based on the knowledge of some of the other labels. The first model predicted the class from the image patch, the second model predicted the subclass from the image patch and used the class predicted by the first model as auxiliary data, and the third model predicted the color and took the class and subclass predicted by the first and second models as auxiliary data, as well as the average RGB channels from the original image patch. Finally, the fourth model predicted the remaining features and took the class, subclass, and color predicted by the three previous models as auxiliary data (Figure 11). Each model was trained with the cross-entropy loss from each category and was based on a fine-tuned MobileNet [45] architecture, as it had a significantly smaller number of parameters in comparison to other state-of-the-art classification networks.

5.5. Model Analysis and Interpretability

To address explainability concerns, we conducted a deep dive into the top-performing models, to understand why some approaches worked well and others struggled. Three main factors were responsible for the winning solution’s success. Firstly, its feature-extraction architecture used ensemble branch strengths complementarily, which was verified by gradient-based visualization analysis. For example, macro vehicle characteristics were captured by ResNet50 branches, while micro details were captured by MobileNet branches, both of which were demonstrated in activation maps. Secondly, we analyzed the impact of data preprocessing by conducting controlled ablation studies that showed adaptive cropping boosting the mAP by 0.043 and rotation normalization, providing an additional 0.038, highlighting the importance of standardizing object presentation for fine-grained classification. Thirdly, we analyzed the training dynamics and confirmed that models failed mainly on rare features in less than 1% of the samples. The winning team took a hierarchical-training approach to overcoming the challenge of sparsity in significant variations, learning robust general vehicle characteristics first, followed by learning special features in rare examples. The increase over the baseline (0.0271 mAP) was not particularly large; however, it is conceivable that we are approaching limits in the degree to which purely Deep Learning-based methods can achieve this task. Error analysis revealed that roughly 40% of the remaining classification mistakes took features requiring a larger context or temporal information to classify reliably.

6. Discussion

The COFGA dataset and the MAFAT Challenge provided valuable insights into the challenges and opportunities associated with fine-grained object categorization in aerial images. This study provides novel perspectives in the fields of remote sensing and computer vision, particularly in the domain of analyzing high-resolution aerial images. The approach employed in this study was the baseline model, which yielded a mAP of 0.60. This model outperforms numerous cutting-edge methods suggested in the literature for fine-grained classification in aerial imagery. The COFGA dataset contains more precise and comprehensive annotations compared to other datasets, like xView or DOTA. The baseline findings corroborate the assertions made by Teixeira et al. (2023), emphasizing the ability of Deep Learning models to effectively handle substantial amounts of data derived from Unmanned Aerial Vehicles (UAVs) and satellites [1].
The top-performing model in the MAFAT Challenge achieved a mAP of 0.6271. This model incorporates advanced techniques, such as Aggressive Ensemble Strategies, Hierarchical Model Integration, and Specialized Data Preparation, contributing to its state-of-the-art performance. These findings align with the research conducted by Keigwin and Tumwesigye (2023), which demonstrated the effectiveness of advanced CNN architectures in detecting wildlife during aerial surveys [2]. This aligns with our research results, as we observed that ensemble methods demonstrated strong performance in our study. This is consistent with the prevailing pattern in the field of ML, where problems are typically addressed by leveraging the collective power of multiple models. Several participants utilized the hierarchical model assembly approach to address the issue of label variability and data skewness, a persistent challenge in aerial imagery classification [3]. As a result, these models demonstrated superior performance, particularly on the less common classes and the detailed characteristics of the COFGA dataset. This approach shows potential as a promising avenue for future research in addressing complex multilevel classification problems. The top teams utilized specialized data preprocessing methods, such as adaptive cropping and rotation normalization. These methods demonstrate that both Deep Learning models and hand-crafted features can gain advantages from domain knowledge. These findings align with Zhou’s (2024) research on Generalized Category Discovery, emphasizing the significance of adaptable and dependable methods for categorizing novel aerial imagery scenes [4].
The COFGA dataset and the results of the MAFAT Challenge provide valuable insights into the problem of fine-grained object classification from a theoretical perspective. Initially, they provide evidence to demonstrate that Deep Learning models are effective when applied to high-resolution aerial imagery and tasks involving multiple hierarchical classes. Furthermore, the remarkable achievement of ensemble methods and hierarchical approaches offers a fresh outlook on the structural composition of models used for analyzing aerial imagery. Finally, the challenges in differentiating uncommon objects and detailed characteristics emphasize the need for additional research in addressing imbalanced datasets and transfer learning in the field of remote sensing. The advancements made in this work have wide-ranging applications in various fields. Enhanced classification and distinction of vehicles and their features could greatly benefit traffic flow analysis and support infrastructure design in urban planning. Improving object categorization in environmental monitoring could help assess the impact of human activities on the environment more effectively. Identifying and categorizing specific vehicles and features is highly beneficial for agricultural purposes, as it greatly aids in the efficient management of farming operations and resource utilization. However, despite the progress that has been made, some concerns regarding the present study still need to be addressed. The COFGA dataset, while being more comprehensive than other datasets, lacks diversity. There are a total of 2104 images and 14,256 annotated objects. However, it is important to note that this may not always accurately represent real-life situations. Additionally, the data do not account for temporal fluctuations or seasonal fluctuations, which can significantly impact the visual representation of objects in aerial photography.
The process of annotation, particularly for the characteristics and the perceived hues, can be considered somewhat subjective. Despite efforts to ensure the accuracy of the annotations, there may still be some variability that could affect the model’s performance and its applicability in other scenarios. Although the method for identifying individual objects is beneficial, it fails to uncover the interconnectedness of objects within a scene. This limitation could hinder the development of models capable of understanding and analyzing different spatial patterns in aerial photography. Several avenues for future research can be discerned from this study. Expanding the COFGA dataset by including more diverse geographic locations, environmental conditions, and objects could enhance the performance of classification models. Furthermore, incorporating multi-temporal data that account for variations in different seasons and times of day can be advantageous in constructing models that can effectively accommodate these fluctuations. By incorporating optical imagery with LiDAR or multispectral data, the utilization of multi-modal data can be expanded. This integration has the potential to improve the context and, consequently, increase the accuracy of classification, particularly for challenging objects. This approach could expand upon Ferraz’s (2024) research on integrating satellite and UAV technology for predicting crop height. An emerging avenue for future investigation involves enhancing the techniques of context-aware classification, enabling the simultaneous identification of individual objects and their spatial configuration within a given scene. This could lead to the creation of increasingly sophisticated models with the ability to comprehend a structure, an urban area, or even a woodland.
Testing in a real-world environment demonstrated that the model’s performance degraded by 15% under varying weather conditions and lighting changes that were not part of the training data. In addition, the ensemble approach was effective, but it required a substantial amount of computational resources, which would not be feasible for implementation in a resource-constrained environment. We highlight areas for future work, including developing more efficient architectures that maintain classification accuracy while reducing computational overhead. In contrast, knowledge distillation provides a promising path to compress ensemble knowledge into smaller, more deployable models. Self-supervised pre-training might also allow for more effective utilization of unlabeled aerial imagery, to mitigate data issues and increase model robustness. As these directions are pursued, they have the potential to advance the potential applicability and scalability of the methods described.
Subsequent research could prioritize the advancement of COFGA models for transfer learning and domain adaptation, to identify efficient methods of transferring models to comparable datasets or practical scenarios. This research direction has the potential to address the issue of limited availability of labeled data in emerging fields, building upon the prior work of Gholami (2024) in the area of SSL for medical image analysis. With the growing advancements in aerial imagery analysis systems, addressing the ethical concerns and the intrusive nature of this technology on privacy is crucial. Future research should address these questions and establish principles for the effective implementation of these technologies.

7. Conclusions

This study introduces Classification of Objects for Fine-Grained Analysis (COFGA), a novel dataset designed to categorize objects in high-resolution aerial images precisely. By creating this dataset and organizing the MAFAT Challenge, we have made significant progress in solving the issues, as mentioned above, in analyzing aerial imagery. This includes situations with a limited amount of labeled data and uneven distribution of classes.
The COFGA dataset, consisting of 2104 high-resolution aerial images and 14,256 objects across 37 categories, significantly contributes to the current collection of datasets. The high spatial resolution of 5 to 15 cm of ground sampling distance allows for a finer level of detail in object identification. This surpasses the capabilities of existing public datasets and enables researchers to develop and compare new and more complex Machine Learning algorithms.
The results of the MAFAT Challenge demonstrate that the COFGA dataset is highly valuable for improving the ability to accurately differentiate between objects in aerial imagery at a more detailed level. The initial model achieved a mAP of 0.6, establishing the standard for the subsequent models. The highest-performing model achieved a mAP of 0.6271. This result emphasizes the potential improvement that can be achieved by employing more advanced techniques, such as aggressive ensemble methods, hierarchical model construction, and specialized data preprocessing.
We have offered the COFGA dataset for public use and hope that this dataset, along with the competition for fine-grained classification, will give rise to the development of new algorithms and techniques. We believe that the high-resolution images and the accurate and fine-grained annotations of our dataset can be used for the development of technologies for automatic fine-grained analysis and labeling of aerial imagery.
The implications of these findings have both theoretical and practical significance. Our findings contribute to the theoretical understanding of fine-grained object classification in complex, multi-level tasks and provide insights for designing models for aerial imagery analysis. The accomplishments described in this study have the capacity to be utilized in various fields, including urban planning, environmental management, agriculture, and more.
Although the current work has limitations, such as the limited dataset and subjective annotation, there are several potential areas for future research. Some of the objectives include diversifying the datasets, exploring the integration of multi-modal data, suggesting context-based classification methods, and addressing ethical concerns in aerial image analysis.
The COFGA dataset and the findings from the MAFAT Challenge demonstrate the potential of aerial imagery analysis as a field. Therefore, this research enhances the current knowledge in automated analysis techniques in remote sensing by establishing a solid foundation for detailed object classification and identifying potential future paths. As our databases grow and improve, we are making progress towards fully utilizing aerial imagery analysis to address various real-world challenges in different industries.

Author Contributions

Conceptualization, E.D. and I.A.; Validation, T.D. All authors have read and agreed to the published version of the manuscript.

Funding

The research was funded by IMOD’s DDR&D, also known as MAFAT.

Data Availability Statement

The COFGA dataset is available at https://cofga.mafatchallenge.com; https://competitions.codalab.org/competitions/19854 (accessed on 3 January 2025).

Acknowledgments

This research would not have been possible without the invaluable contributions and support of several individuals. We extend our heartfelt gratitude to Tsabar A. Marome, Amit Amram, Amit Moryossef, and Omer Koren for their exceptional support throughout the course of this study. Their expertise, insights, and unwavering commitment have been instrumental in shaping this research and bringing it to fruition.

Conflicts of Interest

The authors declare no conflicts of interest.

Abbreviations

AcronymFull Form
AIArtificial Intelligence
APAverage Precision
AUCArea Under Curve
BBBounding Box
CNNConvolutional Neural Network
COFGAClassification of Objects for Fine-Grained Analysis
COWCCars Overhead With Context
CPMCentroid Pixel Map
DOTADataset for Object deTection in Aerial images
GCDGeneralized Category Discovery
GSDGround Sample Distance
HSVHue–Saturation–Value
IMODIsrael Ministry of Defense
iSAIDInstance Segmentation in Aerial Images Dataset
JPG/JPEGJoint Photographic Experts Group
LiDARLight Detection and Ranging
MAFATAdministration for the Development of Weapons and Technological Infrastructure
mAPmean Average Precision
MLMachine Learning
NASNetNeural Architecture Search Network
RGBRed–Green–Blue
SSLSelf-Supervised Learning
SVMSupport Vector Machine
TIFFTagged Image File Format
UAVUnmanned Aerial Vehicle
xViewObjects in Context in Overhead Imagery Dataset
YOLOYou Only Look Once

References

  1. Teixeira, I.; Morais, R.; Sousa, J.; Cunha, A. Deep learning models for the classification of crops in aerial imagery: A review. Agriculture 2023, 13, 965. [Google Scholar] [CrossRef]
  2. Lamprey, R.H.; Keigwin, M.; Tumwesigye, C. A high-resolution aerial camera survey of Uganda’s Queen Elizabeth Protected Area improves detection of wildlife and delivers a surprisingly high estimate of the elephant population. bioRxiv 2023. [Google Scholar] [CrossRef]
  3. Gadiraju, K.; Vatsavai, R. Remote sensing based crop type classification via deep transfer learning. IEEE J. Sel. Top. Appl. Earth Obs. Remote Sens. 2023, 16, 4699–4712. [Google Scholar] [CrossRef]
  4. Zhou, Y.; Zhu, H.; Zhang, Y.; Liang, S.; Wang, Y.; Yang, W. Generalized category discovery in aerial image classification via slot attention. Drones 2024, 8, 160. [Google Scholar] [CrossRef]
  5. Ferraz, M.A.J.; Barboza, T.O.C.; Arantes, P.D.S.; Von Pinho, R.G.; Santos, A.F.D. Integrating satellite and uav technologies for maize plant height estimation using advanced machine learning. Agriengineering 2024, 6, 20–33. [Google Scholar] [CrossRef]
  6. Miao, Z.; Yu, S.X.; Landolt, K.L.; Koneff, M.D.; White, T.P.; Fara, L.J.; Hlavacek, E.J.; Pickens, B.A.; Harrison, T.J.; Getz, W.M. Challenges and solutions for automated avian recognition in aerial imagery. Remote Sens. Ecol. Conserv. 2023, 9, 439–453. [Google Scholar] [CrossRef]
  7. Rosser, J.I.; Tarpenning, M.S.; Bramante, J.T.; Tamhane, A.; Chamberlin, A.J.; Mutuku, P.S.; De Leo, G.A.; Ndenga, B.; Mutuku, F.; LaBeaud, A.D. Development of a trash classification system to map potential aedes aegypti breeding grounds using unmanned aerial vehicle imaging. Environ. Sci. Pollut. Res. 2024, 31, 41107–41117. [Google Scholar] [CrossRef]
  8. Yamada, T.; Massot-Campos, M.; Prügel-Bennett, A.; Pizarro, O.; Williams, S.; Thornton, B. Guiding labelling effort for efficient learning with georeferenced images. IEEE Trans. Pattern Anal. Mach. Intell. 2023, 45, 593–607. [Google Scholar] [CrossRef] [PubMed]
  9. Sirisha, M.; Sudha, S.V. An advanced object detection framework for uav imagery utilizing transformer-based architecture and split attention module: Pvsamnet. Trait. Du Signal 2023, 40, 1661–1672. [Google Scholar] [CrossRef]
  10. Han, T.; Dong, Q.; Sun, L. Senselite: A yolo-based lightweight model for small object detection in aerial imagery. Sensors 2023, 23, 8118. [Google Scholar] [CrossRef]
  11. Chang, J.; He, X.; Li, P.; Tian, T.; Cheng, X.; Qiao, M.; Zhou, T.; Zhang, B.; Chang, Z.; Fan, T. Multi-scale attention network for building extraction from high-resolution remote sensing images. Sensors 2024, 24, 1010. [Google Scholar] [CrossRef] [PubMed]
  12. Hancock, J.; Khoshgoftaar, T.M.; Johnson, J. Evaluating Classifier Performance with Highly Imbalanced Big Data. J. Big Data 2023, 10, 42. [Google Scholar] [CrossRef]
  13. Valicharla, S.K.; Li, X.; Greenleaf, J.; Turcotte, R.M.; Hayes, C.J.; Park, Y. Precision Detection and Assessment of Ash Death and Decline Caused by the Emerald Ash Borer Using Drones and Deep Learning. Plants 2023, 12, 798. [Google Scholar] [CrossRef] [PubMed]
  14. Mdegela, L.; Municio, E.; Bock, Y.D.; Mannens, E.; Luhanga, E.T.; Leo, J. Extreme Rainfall Events Detection Using Machine Learning for Kikuletwa River Floods in Northern Tanzania. Preprint 2023. [Google Scholar] [CrossRef]
  15. Ma, Y.; Lv, H.; Ma, Y.; Wang, X.; Lv, L.; Liang, X.; Wang, L. Advancing Preeclampsia Prediction: A Tailored Machine Learning Pipeline for Handling Imbalanced Medical Data (Preprint). Preprint 2024. [Google Scholar] [CrossRef]
  16. Salau, A.O.; Markus, E.D.; Assegie, T.A.; Omeje, C.O.; Eneh, J.N. Influence of Class Imbalance and Resampling on Classification Accuracy of Chronic Kidney Disease Detection. Math. Model. Eng. Probl. 2023, 10, 48–54. [Google Scholar] [CrossRef]
  17. Lokanan, M. Exploring Resampling Techniques in Credit Card Default Prediction. Preprint 2024. [Google Scholar] [CrossRef]
  18. Cabezas, M.; Diez, Y. An Analysis of Loss Functions for Heavily Imbalanced Lesion Segmentation. Sensors 2024, 24, 1981. [Google Scholar] [CrossRef]
  19. Zhao, M.; Cheng, Y.; Qin, X.; Yu, W.; Wang, P. Semi-Supervised Classification of PolSAR Images Based on Co-Training of CNN and SVM with Limited Labeled Samples. Sensors 2023, 23, 2109. [Google Scholar] [CrossRef]
  20. Ngo, B.H.; Lam, B.T.; Nguyen, T.H.; Dinh, Q.V.; Choi, T.J. Dual Dynamic Consistency Regularization for Semi-Supervised Domain Adaptation. IEEE Access 2024, 2, 36267–36279. [Google Scholar] [CrossRef]
  21. Özbay, Y.; Kazangirler, B.Y.; Özcan, C.; Pekince, A. Detection of the Separated Endodontic Instrument on Periapical Radiographs Using a Deep Learning-based Convolutional Neural Network Algorithm. Aust. Endod. J. 2023, 10, 037502. [Google Scholar] [CrossRef] [PubMed]
  22. Pardàs, M.; Anglada-Rotger, D.; Espina, M.; Marqués, F.; Salembier, P. Stromal Tissue Segmentation in Ki67 Histology Images Based on Cytokeratin-19 Stain Translation. J. Med. Imaging 2023, 10, 037502. [Google Scholar] [CrossRef] [PubMed]
  23. Li, K.; Duggal, R.; Chau, D.H. Evaluating Robustness of Vision Transformers on Imbalanced Datasets (Student Abstract). Proc. AAAI Conf. Artif. Intell. 2023, 37, 16252–16253. [Google Scholar] [CrossRef]
  24. Gholami, S.; Scheppke, L.; Kshirsagar, M.; Wu, Y.; Dodhia, R.; Bonelli, R.; Leung, I.; Sallo, F.B.; Muldrew, A.; Jamison, C.; et al. Self-Supervised Learning for Improved Optical Coherence Tomography Detection of Macular Telangiectasia Type 2. JAMA Ophthalmol. 2024, 142, 226–233. [Google Scholar] [CrossRef] [PubMed]
  25. Wu, W. Enhanced Few-Shot Learning for Plant Leaf Diseases Recognition. J. Comput. Electron. Inf. Manag. 2023, 11, 26–28. [Google Scholar] [CrossRef]
  26. Zong, N.; Su, S.; Zhou, C. Boosting Semi-supervised Learning Under Imbalanced Regression via Pseudo-labeling. Concurr. Comput. Pract. Exp. 2024, 36, e8103. [Google Scholar] [CrossRef]
  27. Chen, S. A study on the application of contrastive learning in the brain-computer interface of motor imagery. In Proceedings of the Sixth International Conference on Advanced Electronic Materials, Computers, and Software Engineering (AEMCSE 2023), Shenyang, China, 21–23 April 2023; SPIE: St. Bellingham, WA, USA, 2023; Volume 12787, pp. 400–405. [Google Scholar]
  28. Ronan, R.; Tarabanis, C.; Chinitz, L.; Jankelson, L. Brugada ECG Detection with Self-Supervised VICReg Pre-Training: A Novel Deep Learning Approach for Rare Cardiac Diseases. medRxiv 2024. [Google Scholar] [CrossRef]
  29. Huang, J.; Yang, X.; Zhou, F.; Li, X.; Zhou, B.; Song, L.; Ivashov, S.; Giannakis, I.; Kong, F.; Slob, E. A Deep Learning Framework Based on Improved Self-supervised Learning for Ground-penetrating Radar Tunnel Lining Inspection. Comput.-Aided Civ. Infrastruct. Eng. 2023, 39, 814–833. [Google Scholar] [CrossRef]
  30. Mamidi, I.S.; Dunham, M.E.; Adkins, L.K.; McWhorter, A.J.; Fang, Z.; Banh, B.T. Laryngeal Cancer Screening During Flexible Video Laryngoscopy Using Large Computer Vision Models. Ann. Otol. Rhinol. Laryngol. 2024, 133, 720–728. [Google Scholar] [CrossRef]
  31. Dabbiru, L.; Goodin, C.; Carruth, D.; Boone, J. Object detection in synthetic aerial imagery using deep learning. In Proceedings of the Autonomous Systems: Sensors, Processing, and Security for Ground, Air, Sea, and Space Vehicles and Infrastructure 2023, Orlando, FL, USA, 2–4 May 2023; SPIE: St. Bellingham, WA, USA, 2023; Volume 12540, p. 1254002. [Google Scholar]
  32. Ferreira, R.E.P.; Lee, Y.J.; Dórea, J.R. Using Pseudo-Labeling to Improve Performance of Deep Neural Networks for Animal Identification. Sci. Rep. 2023, 13, 13875. [Google Scholar] [CrossRef]
  33. Wu, G.; Eastwood, C.; Sapiro, N.; Cheligeer, C.; Southern, D.A.; Quan, H.; Xu, Y. Achieving High Inter-Rater Reliability in Establishing Data Labels: A Retrospective Chart Review Study. BMJ Open Qual. 2024, 13, e002722. [Google Scholar] [CrossRef]
  34. Chowdhury, M.M.; Ayon, R.S.; Hossain, M.S. Diabetes Diagnosis through Machine Learning: Investigating Algorithms and Data Augmentation for Class Imbalanced BRFSS Dataset. medRxiv 2023. [Google Scholar] [CrossRef]
  35. Thadajarassiri, J.; Hartvigsen, T.; Gerych, W.; Kong, X.; Rundensteiner, E.A. Knowledge Amalgamation for Multi-Label Classification via Label Dependency Transfer. Proc. AAAI Conf. Artif. Intell. 2023, 37, 9980–9988. [Google Scholar] [CrossRef]
  36. Hussein, H.I.; Anwar, S.A.; Ahmad, M.I. Imbalanced Data Classification Using SVM Based on Improved Simulated Annealing Featuring Synthetic Data Generation and Reduction. Comput. Mater. Contin. 2023, 75, 547–564. [Google Scholar] [CrossRef]
  37. Breskuvienė, D.; Dzemyda, G. Categorical Feature Encoding Techniques for Improved Classifier Performance When Dealing with Imbalanced Data of Fraudulent Transactions. Int. J. Comput. Commun. Control 2023, 18. [Google Scholar] [CrossRef]
  38. Cysneiros Aragão, M.V.; de Freitas Carvalho, M.; de Morais Pereira, T.; de Figueiredo, F.A.P.; Mafra, S.B. Enhancing AutoML Performance for Imbalanced Tabular Data Classification: A Self-Balancing Pipeline. Artifical Intell. Rev. 2024. [Google Scholar] [CrossRef]
  39. Lam, D.; Kuzma, R.; McGee, K.; Dooley, S.; Laielli, M.; Klaric, M.; Bulatov, Y.; McCord, B. xView: Objects in Context in Overhead Imagery. arXiv 2018, arXiv:1802.07856. [Google Scholar]
  40. Xia, G.; Bai, X.; Ding, J.; Zhu, Z.; Belongie, S.J.; Luo, J.; Datcu, M.; Pelillo, M.; Zhang, L. DOTA: A Large-scale Dataset for Object Detection in Aerial Images. arXiv 2017, arXiv:1711.10398. [Google Scholar]
  41. Zamir, S.W.; Arora, A.; Gupta, A.; Khan, S.H.; Sun, G.; Khan, F.S.; Zhu, F.; Shao, L.; Xia, G.; Bai, X. iSAID: A Large-scale Dataset for Instance Segmentation in Aerial Images. arXiv 2019, arXiv:1905.12886. [Google Scholar]
  42. Mundhenk, T.N.; Konjevod, G.; Sakla, W.A.; Boakye, K. A Large Contextual Dataset for Classification, Detection and Counting of Cars with Deep Learning. arXiv 2016, arXiv:1609.04453. [Google Scholar]
  43. Zhu, P.; Wen, L.; Bian, X.; Ling, H.; Hu, Q. Vision Meets Drones: A Challenge. arXiv 2018, arXiv:1804.07437. [Google Scholar]
  44. Lin, T.; Goyal, P.; Girshick, R.B.; He, K.; Dollár, P. Focal Loss for Dense Object Detection. arXiv 2017, arXiv:1708.02002. [Google Scholar]
  45. Howard, A.G.; Zhu, M.; Chen, B.; Kalenichenko, D.; Wang, W.; Weyand, T.; Andreetto, M.; Adam, H. MobileNets: Efficient Convolutional Neural Networks for Mobile Vision Applications. arXiv 2017, arXiv:1704.04861. [Google Scholar]
  46. He, K.; Zhang, X.; Ren, S.; Sun, J. Deep Residual Learning for Image Recognition. arXiv 2015, arXiv:1512.03385. [Google Scholar]
  47. Girshick, R.B.; Donahue, J.; Darrell, T.; Malik, J. Rich feature hierarchies for accurate object detection and semantic segmentation. arXiv 2013, arXiv:1311.2524. [Google Scholar]
  48. Szegedy, C.; Vanhoucke, V.; Ioffe, S.; Shlens, J.; Wojna, Z. Rethinking the Inception Architecture for Computer Vision. arXiv 2015, arXiv:1512.00567. [Google Scholar]
  49. Chollet, F. Xception: Deep Learning with Depthwise Separable Convolutions. arXiv 2016, arXiv:1610.02357. [Google Scholar]
  50. Zoph, B.; Vasudevan, V.; Shlens, J.; Le, Q.V. Learning Transferable Architectures for Scalable Image Recognition. arXiv 2017, arXiv:1707.07012. [Google Scholar]
Figure 1. Visualization of different annotation methods: (a) image patch; (b) horizontal, axis-aligned, BB; (c) oriented BB; (d) polygon segmentation; (e) CPM.
Information 16 00134 g001
Figure 2. A sample of COFGA’s fine-grained classification labels, including subclasses, unique features, and perceived color.
Information 16 00134 g002
Figure 3. Log distribution of number of items in each class.
Information 16 00134 g003
Figure 4. Heat map of the inter- and intra-subclass correlation.
Information 16 00134 g004
Figure 5. Distribution of the area, in pixels, of objects from different subclasses: (a) two subclasses of the ‘large vehicle’ class, (b) two subclasses of the ‘small vehicle’ class.
Information 16 00134 g005
Figure 6. Architectures used in the baseline: based on MobileNet and ResNet50.
Information 16 00134 g006
Figure 7. Padding, cropping, and rotation.
Information 16 00134 g007
Figure 8. Squaring and color augmentation: obtained by permuting the three channels of the RGB image.
Information 16 00134 g008
Figure 9. Diagram of the ensemble pipeline used by SeffiCo-Team MMM.
Information 16 00134 g009
Figure 10. Yonatan Wischnitzer—preprocessing.
Information 16 00134 g010
Figure 11. Yonatan Wischnitzer’s model architecture, exploiting the hierarchical nature of the COFGA dataset’s tagging taxonomy.
Information 16 00134 g011
Table 1. Detailed dataset comparison. The method column represents the annotation method. The GSD column represents the GSD in cm.
DatasetMethodCategoriesGranularityImagesGSDObjectsVehicles
DOTA 1.5oriented BB161280615471,438~380 K
xViewhorizontal BB602112730~1 M~280 K
COWCCentroid Pixel Map1124181537,71637,716
iSAIDpolygon segmentation151280615655,451~380 K
COFGAoriented BB37421045–1514,25614,256
Disclaimer/Publisher’s Note: The statements, opinions and data contained in all publications are solely those of the individual author(s) and contributor(s) and not of MDPI and/or the editor(s). MDPI and/or the editor(s) disclaim responsibility for any injury to people or property resulting from any ideas, methods, instructions or products referred to in the content.

