Article

Non-Line-of-Sight Identification Method for Ultra-Wide Band Based on Dual-Branch Feature Fusion Transformer

by
Guangyong Xi
,
Shuaiyang Hu
,
Jing Wang
and
Dongyao Zou
*
College of Computer Science and Technology, Zhengzhou University of Light Industry, Zhengzhou 450001, China
*
Author to whom correspondence should be addressed.
Information 2025, 16(12), 1033; https://doi.org/10.3390/info16121033
Submission received: 20 October 2025 / Revised: 20 November 2025 / Accepted: 21 November 2025 / Published: 27 November 2025

Abstract

In Ultra-Wide Band (UWB) positioning, wireless signals are subject to non-line-of-sight (NLOS) propagation due to obstruction by obstacles, which leads to ranging and positioning estimation errors. How to accurately and efficiently identify line-of-sight (LOS) and NLOS propagation paths is a key research task in UWB positioning systems. By effectively integrating the characteristics of global channel impulse response (CIR) sequence features and statistical time-domain features, a dual-branch feature fusion Transformer (DBFF-Transformer) is proposed for NLOS path identification. Firstly, the original CIR sequence data is processed using the Transformer to learn the global feature relationships within the data. Secondly, four key time-domain features are extracted from the CIR sequence: the first-path energy ratio, the root-mean-square time delay spread, the kurtosis and the phase difference. Finally, by integrating the sequence features and the time-domain features, the two features’ branches are fused through a fully connected network. The proposed method is evaluated in two typical indoor scenarios from the latest open-source datasets of the eWINE project. The ablation experiment proves that the fusion of the sequence features and time-domain features of the CIR sequence can effectively improve NLOS identification accuracy. The identification accuracy in the two experimental scenarios is 95.9% and 95.7%, with F1 scores of 97.2% and 97.1% and Recall of 97.4% and 96.4%, respectively. The comparative analysis of the DBFF-Transformer with the state-of-the-art baseline models demonstrates superior accuracy and robustness, which can provide a novel solution for NLOS identification in UWB indoor positioning.

Graphical Abstract

1. Introduction

In recent years, indoor location services based on wireless sensor networks are an important part of intelligent applications and have received increasing attention. Indoor positioning technology has been widely applied in warehousing, logistics, medical care and emergency rescue [1,2,3]. Currently, Bluetooth Low Energy (BLE), Wi-Fi, ZigBee, Radio Frequency Identification (RFID) and Ultra-Wide Band (UWB) are the most commonly used indoor wireless positioning technologies [4,5,6]. Due to the fast signal transmission speeds and extremely low positioning delays, UWB is suitable for complex scenarios that require rapid responses and real-time positioning [7,8,9]. In addition, UWB can meet the requirements of large-scale deployment and can track multiple devices simultaneously, which helps improve positioning accuracy. The positioning accuracy of UWB is usually within the range of 10 to 30 cm [10]. Furthermore, UWB is easy to integrate with existing Internet of Things systems [11], achieving higher interoperability. These advantages make the UWB system the most promising indoor wireless positioning solution [12]. However, UWB signals are susceptible to obstacles, resulting in the reflection, scattering and diffraction of the signals. Due to the complexity of indoor scenarios, especially in industrial, commercial and emergency rescue scenarios, there are numerous static and dynamic obstacles. The obstruction causes non-line-of-sight (NLOS) paths for UWB signal propagation, resulting in multipath effects, which deteriorate the accuracy of ranging and position estimation [13]. The NLOS propagation path causes errors in the kurtosis, phase and propagation time of UWB signals, which seriously affects the accuracy of UWB indoor positioning and the usability of the positioning method [14].
At present, NLOS path identification usually adopts methods based on traditional statistics and those based on machine learning. Machine learning and neural networks have achieved remarkable results in data processing and automatic learning in recent years. These methods have become the mainstream approaches for NLOS identification. For example, the FCN-Attention method uses attention mechanisms to identify NLOS paths by learning features from channel impulse response (CIR) data [15]. However, these approaches have a limitation in that they rely solely on raw CIR data while overlooking the importance of statistical features. This will cause the model to lack some specific time-domain information and be unable to effectively identification in complex NLOS scenarios. Therefore, a dual-branch feature fusion transformer non-line-of-sight identification method is proposed. By relying only on CIR sequence features, the time-domain feature network is fused. Leveraging the advantages of Transformer in processing sequence features and the physical interpretability of time-domain features, this multi-model feature fusion method is used to effectively identify NLOS.
By combining the strengths of Transformer and statistical features, a dual-branch feature fusion Transformer NLOS identification method is proposed to improve the accuracy and usability of NLOS identification. The main contributions are as follows:
  • A dual-branch feature fusion Transformer (DBFF-Transformer) NLOS identification method is proposed to overcome the limitations of existing approaches that rely solely on original CIR sequences. By making full use of Transformer to process the original CIR sequence, the global feature relationship in the data sequence is learned and the time-domain features extracted from the CIR are combined.
  • Based on the channel features of the CIR sequence, the sequence feature network and the time feature network were designed. In the sequence feature network, the multi-head attention mechanism of the Transformer effectively identifies key patterns within NLOS multipath effects. In the time feature network, four time-domain features—FPER, RDS, kurtosis and phase difference—are extracted, which effectively distinguish between LOS and NLOS. The fusion of these two types of modal feature data solves the problem of insufficient accuracy and robustness in NLOS identification.
  • Through a series of ablation studies and comparative experiments, the advantages of DBFF-Transformer over other models have been validated. DBFF-Transformer can effectively identify NLOS accurately in typical indoor scenarios, providing a new solution to solve the NLOS problem in UWB indoor positioning.

2. Related Work

Due to the presence of obstacles in the indoor environment, there are numerous NLOS paths in the propagation of UWB signals [16]. Generally, an NLOS path can be identified based on the signal propagation characteristics. The error caused by the NLOS path can be alleviated by using mathematical models or optimization algorithms [17,18,19]. NLOS path identification usually adopts methods based on traditional statistics and machine learning.

2.1. NLOS Identification Method Based on Statistics

NLOS identification can be achieved by exploiting the received signal and channel impulse response (CIR) statistics, where the NLOS path has different statistical features from the LOS path. Some studies have explored the use of specific signal features for NLOS identification [20,21,22]. However, relying on a single statistical feature may not provide correct NLOS identification. It is more advantageous to exploit multiple parameters jointly [23]. Therefore, based on a single feature, NLOS paths can be identified through multi-feature ensemble methods such as kurtosis, root-mean-square delay spread (RDS) and energy ratio in CIR sequences. Combining multiple features in one method can overcome the drawback of insufficient accuracy caused by the use of a single feature [24]. Traditional statistical methods demonstrate efficacy in identifying NLOS in uncomplicated environments [25]. However, in a complex environment with a large amount of reflection and scattering, multipath signals superimpose on each other, which will lead to complex changes in the statistical features of the signals. Moreover, when the indoor environment changes, it is difficult for an NLOS identification method based on a fixed statistical threshold to make corresponding changes in real time.

2.2. NLOS Identification Method Based on Machine Learning

NLOS identification methods based on machine learning commonly use Random Forest [26] and Support Vector Machines (SVMs) [27]. The identification accuracy is improved by learning and extracting effective features from CIR sequences through iterative optimization of the objective function [28]. However, these models rely on manual feature extraction and have limitations such as complex data preprocessing, sensitivity to noise and insufficient robustness in dynamic environments. Currently, researchers are focusing on NLOS identification methods based on neural networks, mainly including Convolutional Neural Networks (CNNs), Long Short-Term Memory (LSTM), Gate Recurrent Unit (GRU) and their combination architecture. CNN uses the original CIR to automatically extract features in the data to identify NLOS through the convolution operation of the convolutional network [29]. LSTM analyzes the time series information in the CIR sequence and automatically captures the dynamic differences in LOS and NLOS signals [30]. However, CNN and LSTM exhibit limitations in global feature extraction from CIR [31]. GRU can handle multi-dimensional input data simultaneously and integrate the correlations among multiple parameters through the hidden layer states [32]. However, GRU faces significant challenges related to gradient vanishing when analyzing long time series, which hampers its ability to efficiently identify NLOS. The commonly used neural network methods do not need to manually extract features, and the effect is improved compared with traditional machine learning. However, they still exhibit limitations in handling the global feature relationships of CIR. Although combining these several methods can improve the performance of identification, it also increases the complexity of the model structure.

2.3. Attention Mechanisms and Transformer

Attention mechanisms can dynamically allocate different weights to various parts of the input data to focus attention [33]. Introducing the channel attention mechanism into CNNs can enhance feature extraction capabilities, as it is able to dynamically adjust the weight of each channel so that the network focuses on the more important feature channels [34]. In NLOS path identification, combining attention mechanisms with CNNs and fully connected networks has been demonstrated to enhance identification accuracy [35].
Transformer is a deep learning architecture that is entirely based on the attention mechanism. Through the Transformer encoder and multi-head attention, it effectively captures the feature interaction of each subspace and can efficiently process data in parallel [36]. Based on the effective construction of global features, Transformer can accurately identify the LOS and NLOS propagation paths in UWB positioning [37]. However, current Transformer-based NLOS identification models focus solely on CIR sequence features, overlooking the positive impact of statistical features on NLOS identification. This results in the model lacking global time-domain information, leading to incomplete feature representations and reduced interpretability. Consequently, the development of a methodology that integrates Transformers with statistical features is imperative to further enhance the accuracy and usability of NLOS identification.
The remainder of the paper is organized as follows. The specific framework and substantive details of the proposed DBFF-Transformer are presented in Section 3. In Section 4, the specific experimental design is presented, and a series of ablation experiments and comparison experiments with other algorithms are conducted. The performance demonstrated by the experimental results is evaluated according to the evaluation metrics, and Section 5 discusses and summarizes the research conducted.

3. The DBFF-Transformer

CIR describes the temporal characteristics of the UWB channel in detail. The channel impulse response can be modeled as
h t = l = 1 L k = 1 K a k , l e j θ k , l δ t T l τ k , l
where L is the total number of received UWB signal clusters, K is the number of multipath components in each signal cluster, a k , l is the path gain of the multipath component, θ k , l is the phase component of the multipath components, T l is the arrival time and τ k , l is the time delay. According to the definition of channel impact response, the CIR can be regarded as time sequence data.
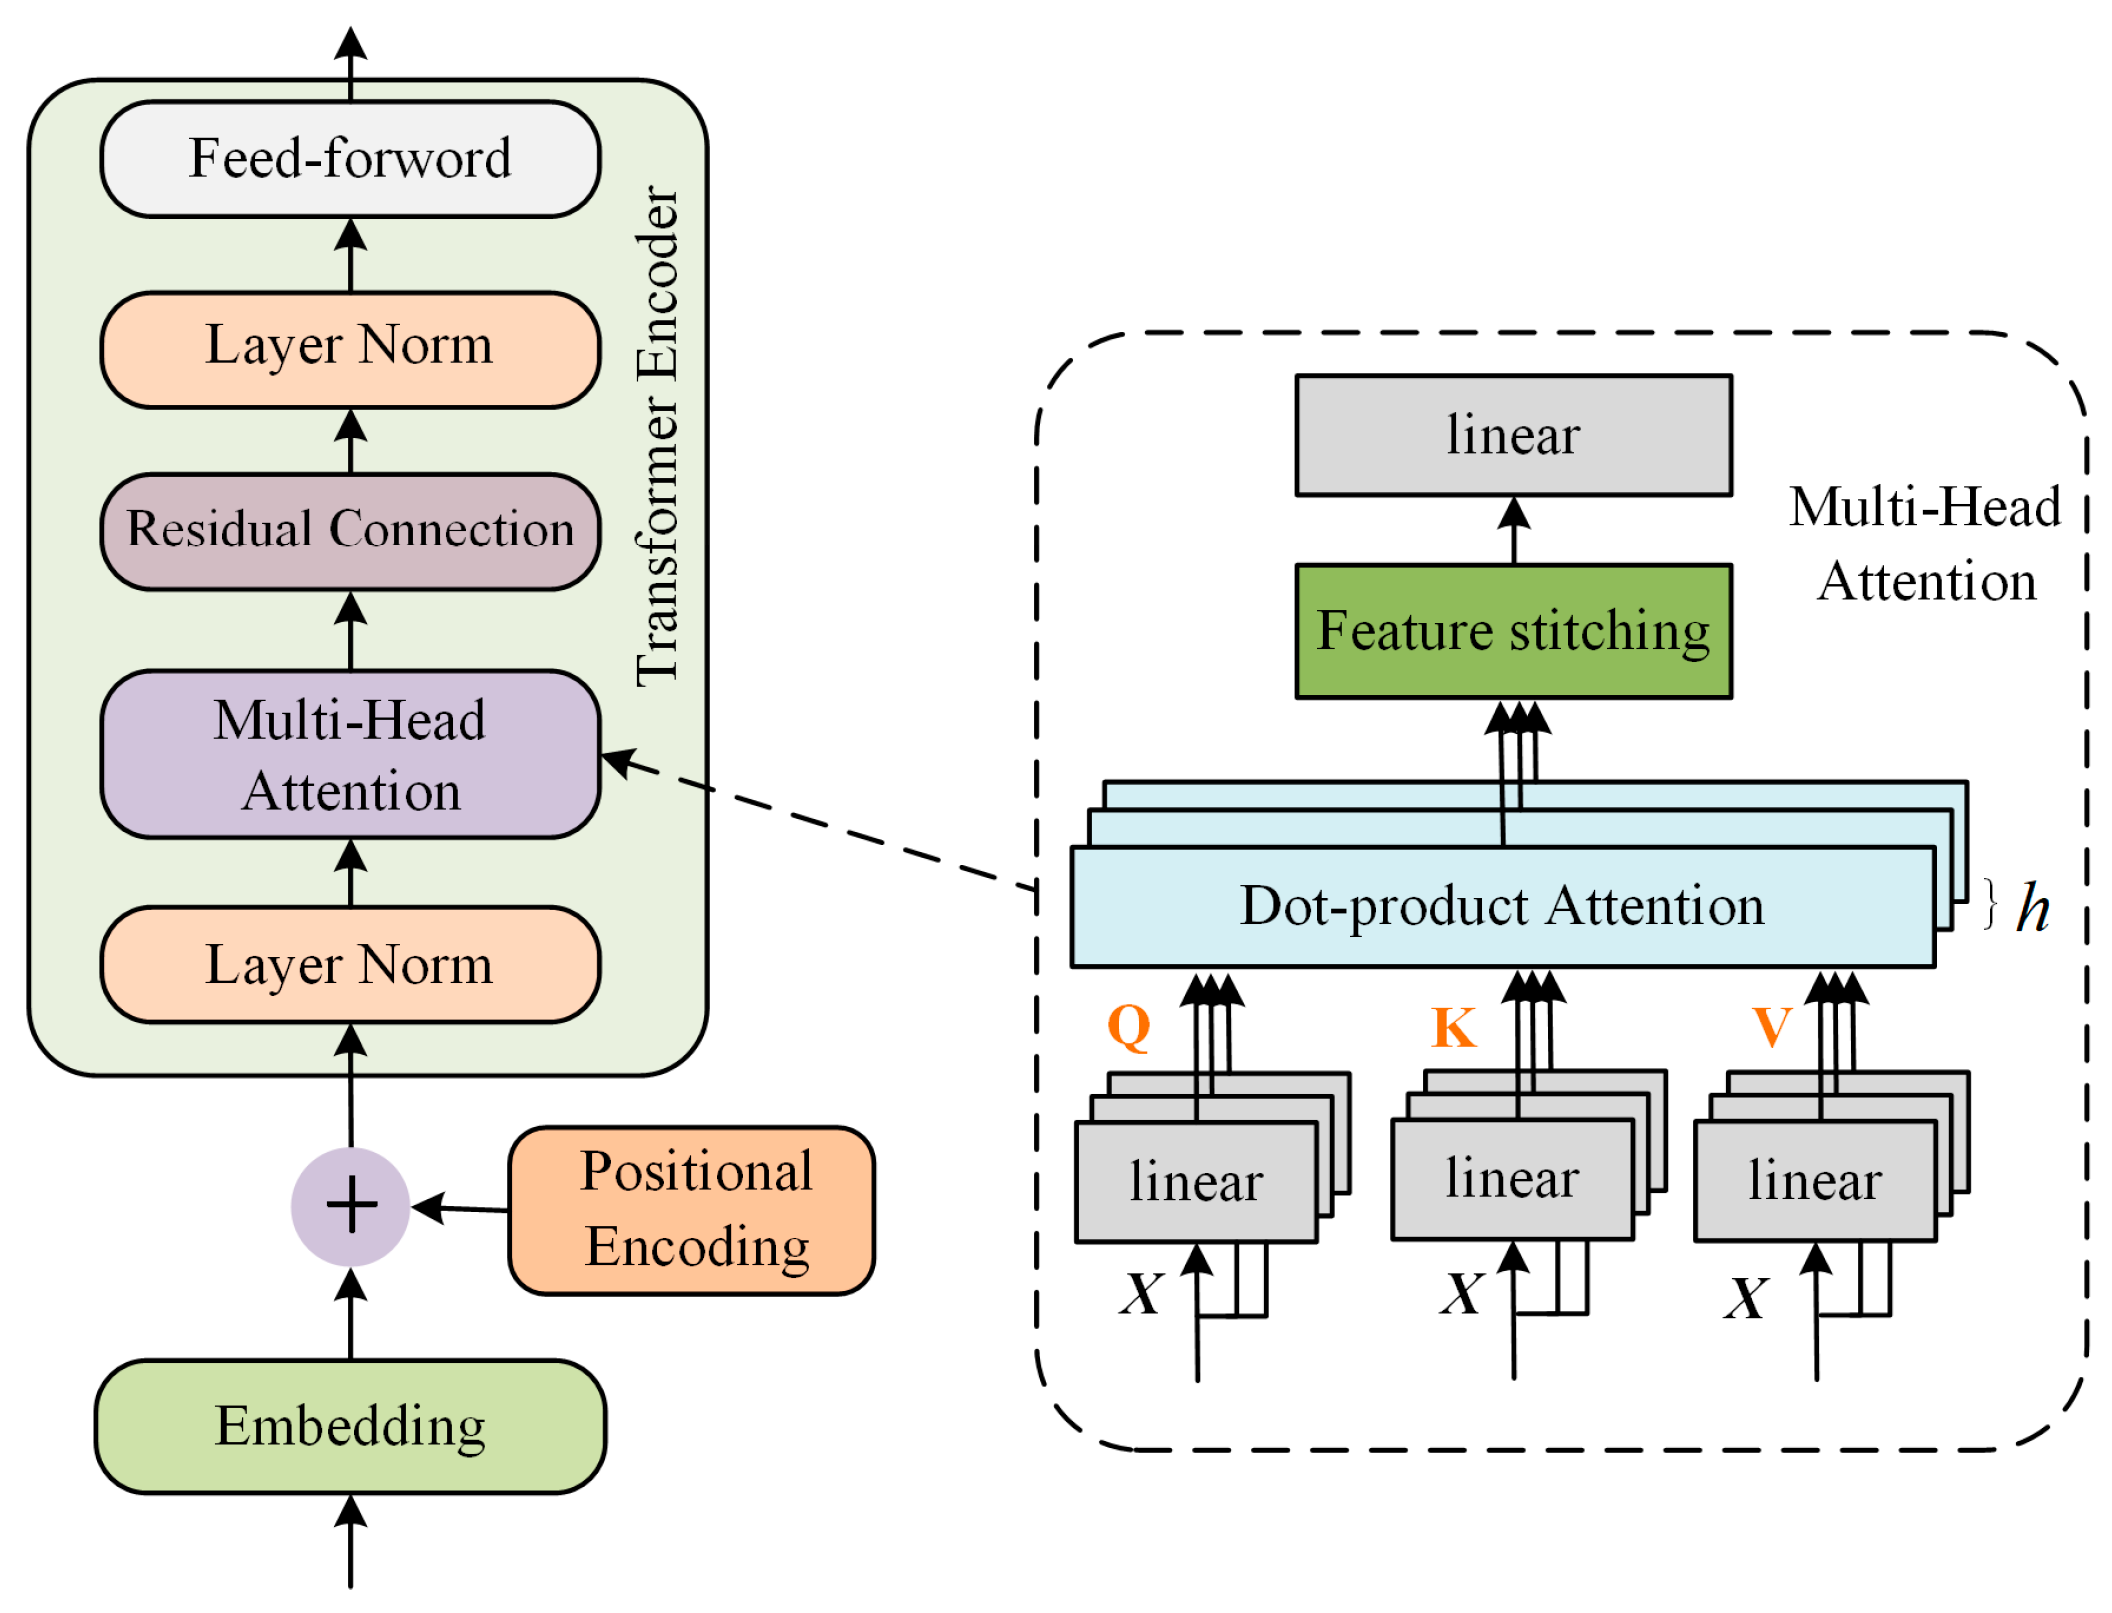
The proposed DBFF-Transformer introduces a dual-branch feature fusion framework. The overall structure of the DBFF-Transformer is shown in Figure 1. The sequence feature network branch uses the strengths of the Transformer in processing sequential data to extract features of the CIR sequence and learn global feature relationships. The structure of the Transformer primarily consists of embeddings, positional encoding and a Transformer encoder. The encoder employs a multi-head attention mechanism. The multi-head attention mechanism is used to identify key patterns within multipath effects.
Meanwhile, to address the limitation of existing Transformer-based methods relying solely on sequence features, the time-domain feature network branch has been introduced. In the time-domain feature network, four time-domain features were extracted from the CIR. Subsequently, these features were mapped onto a high-dimensional space via linear transformations through a fully connected network to enhance feature representation. The extracted time-domain features accurately describe the statistical characteristics of the CIR data. These features provide DBFF-Transformer with clear interpretability, complementing the sequence features learned by the Transformers.
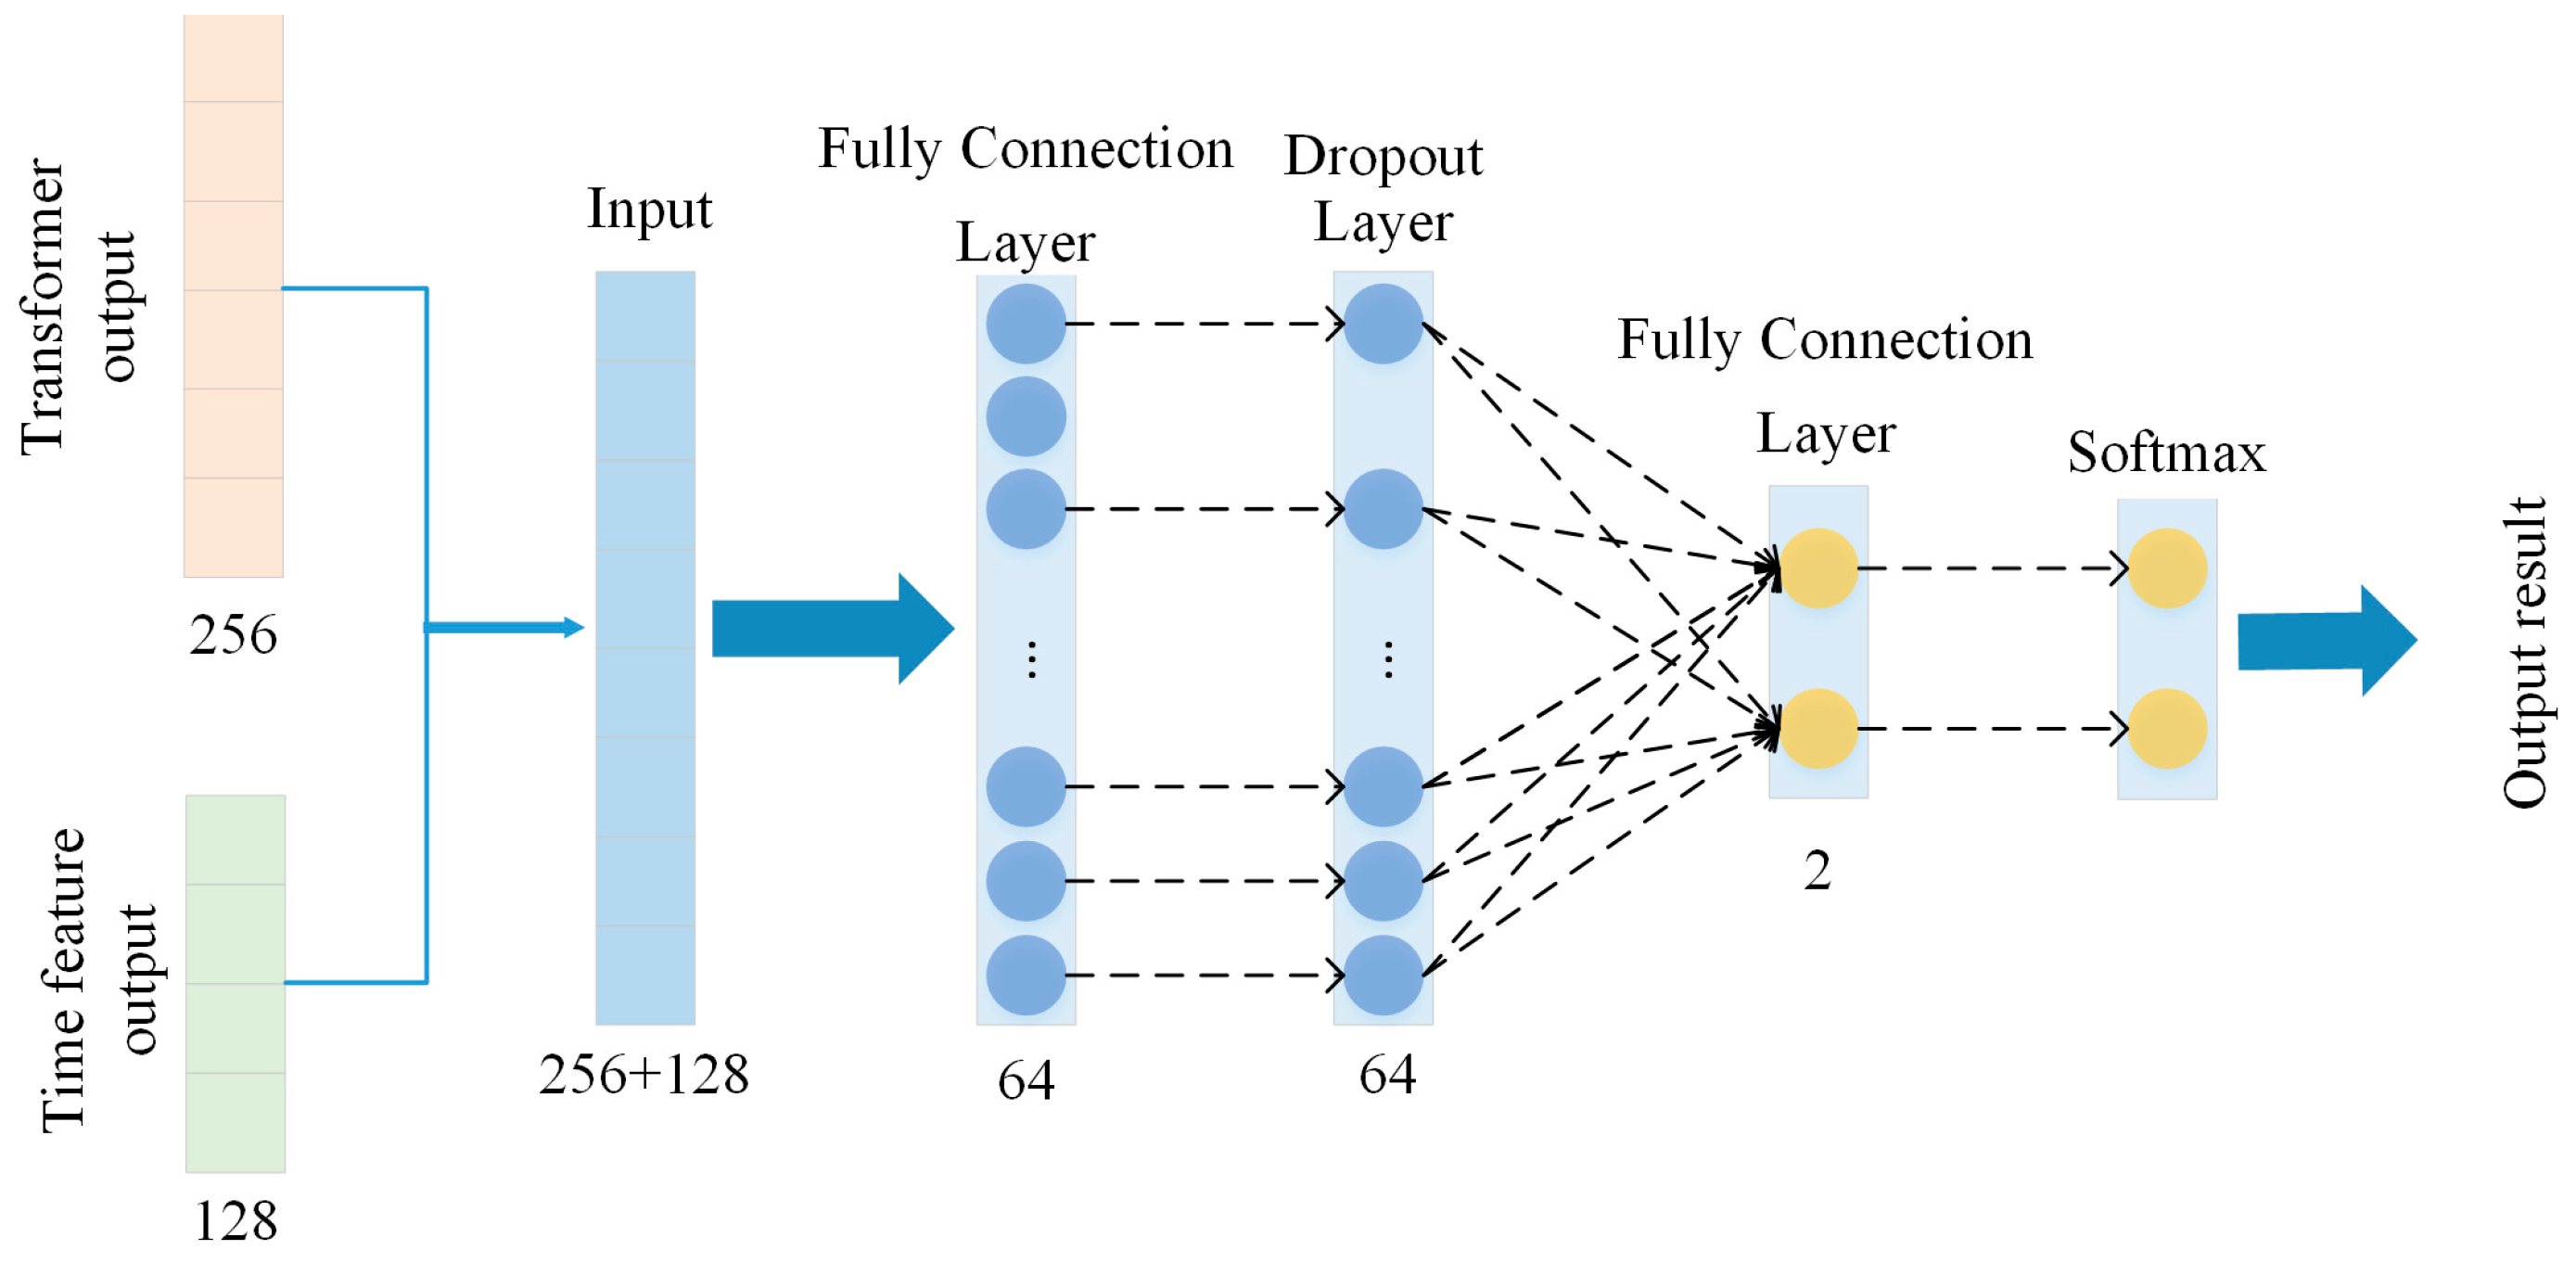
Finally, the processed CIR sequence features and time-domain features are entered into the feature fusion and classification network. In this network, these two features are integrated through dimensional concatenation and subsequently fed as input to a fully connected layer to achieve NLOS identification. The fusion of these two feature modalities combines the strengths of global CIR sequence features and statistical time-domain features. It can enhance the stability and robustness of the model, improving the accuracy of NLOS identification.
This section is divided into subheadings. It should provide a concise and precise description of the experimental results and their interpretation, as well as the experimental conclusions that can be drawn.

3.1. Sequence Feature Network

In the embedding layer of the Transformer architecture, the discrete CIR sequence is transformed into continuous vector representations suitable for model processing. Convert input data into the d m o d e l dimension vector through embedding, unify feature scales and improve feature representation. Notably, as the attention mechanism in Transformers is inherently position-agnostic and lacks the capacity to process sequence order, the model is enabled to better understand the features of the CIR sequences through the introduction of sine and cosine function position encoding:
P E p o s , 2 i = s i n p o s 100 0 2 i d m o d e l
P E p o s , 2 i + 1 = cos p o s 100 0 2 i d m o d e l
where p o s denotes the position in the sequence, P E is the position vector, d m o d e l denotes the dimension and i is the dimension index in the encoding vector. Position encoding means adding position information to each time point of the data sequence and retaining the position information of the time sequences to enhance the position awareness ability of the Transformer.
The multi-head attention mechanism and feed-forward network in the Transformer encoder are used to capture the feature relationships in the sequence data. The overall structure of the Transformer section is shown in Figure 2. Specifically, the attention mechanism can be seen as a mapping mechanism using a query and a set of key–value pairs to compute weights on the input data. The query, key and value are related to the input data or priori information, and the output is the weighted sum of the values, where the assigned weights are calculated using the query and the corresponding key. Multi-head attention splits the input vector into multiple independent subspaces, allowing the model to jointly attend to information from different representation subspaces at different positions. Assume the input data is X , and the vectors Q , K and V are calculated as
Q = f 1 X = W Q X + B 1 K = f 2 X = W K X + B 2 V = f 3 X = W V X + B 3
where X is the input data, Q is query, K is key, V is values and W Q , W K and W V represent learnable linear transformation matrices that project the input vector X into new vector spaces through linear computation. The three linear transformation matrices have the same structure and are independent of each other, with specific parameter values obtained during model training. B 1 , B 2 and B 3 are bias vectors that do not change the vector structure of Q , K and V , which can be obtained through model training. The attention output can be updated as follows:
A t t e n t i o n Q , K , V = softmax Q K T d k V
where d K is the dimension of X . Softmax is a normalization function that converts scores into a probability distribution while enabling the model to focus more on critical components. The final attention output is obtained by multiplying the attention score distribution with V . In the context of multi-head attention, the input vectors are divided into h attention heads. Each head independently computes the attention weights while processing the input sequences. Subsequently, the features learned by each attention head across different subspaces are concatenated along the dimension using the concat operation. Then, the output of multi-head attention is obtained through linear transformation by matrix W 0 . The total output of the multi-head attention is then calculated as follows:
M u l t i H e a d Q , K , V = C o n c a t h e a d 1 , , h e a d h W 0
where
h e a d i = A t t e n t i o n Q W i Q , K W i K , V W i V
where Attention is the output calculated by each multi-head attention. Subsequent to the polytope attention, the sublayers consist of a simple fully connected feed-forward neural network with residual connections between each sublayer. This is followed by Layer Normalization, and the output dimensions of all sublayers in the model are set to d m o d e l to facilitate residual connections. Finally, the processed feature data are input into the adaptive max-pooling layer, and the global features are extracted and outputted.
By leveraging the multi-head attention mechanism to establish global feature interdependencies and integrating positional encoding for temporal awareness, the model achieves global perception across all positions in the sequence. This synergistic design enables the precise identification of critical patterns embedded within multipath propagation effects.

3.2. Time-Domain Feature Network

The distinction between LOS and NLOS propagation paths can be achieved through discriminative parameters derived from CIR sequences, including the first-path energy ratio (FPER), root-mean-square delay spread (RDS), kurtosis and phase difference.
The FPER is the ratio between the energy of the first non-zero sample, i.e., the first path location, and the overall energy of the signal in the CIR sequence, reflecting the energy distribution features of the channel, which can be expressed as
F P E R = h k f p 2 k = 1 K h k 2
where k f p is the first-path index position of the CIR sequence, K is the number of multipath components in each signal cluster and h k is the amplitude of the data signal. In LOS propagation scenarios, the first arriving path typically contains a dominant proportion of the total signal energy, resulting in significantly higher FPER values. Conversely, NLOS conditions introduce multipath distortion through obstacle interactions, causing substantial energy dispersion across the secondary path, which leads to characteristically lower FPER values.
RDS is the weighted standard deviation of the delay of each path relative to the average delay in the CIR sequence. It is used to describe the dispersion degree of the channel delay due to the multipath effect and can reflect the delay dispersion caused by the multipath effect in the signal propagation process. The τ R D S is calculated as follows:
τ R D S = t τ M E D 2 h t 2 d t h t 2 d t
where τ M E D is Mean Excess Delay, and
τ MED = t h t 2 d t h t 2 d t
where h t is the channel impulse response. In the LOS propagation path, multipath components are relatively sparse, with a concentrated delay distribution. Conversely, NLOS paths exhibit more significant multipath delay spread due to signal obstruction by obstacles.
Kurtosis is a measure of the peakedness of a distribution. The index used to describe the pattern of data distribution in CIR, which measures the concentration degree of multipath distribution, is as follows:
k = 1 σ 4 T T h t μ h 4 d t
where
μ h = 1 T T h t d t
σ 4 = 1 T T h t μ h 2 d t
where σ 4 is the squared variance of the CIR magnitude and T is the length of the CIR sequence. In LOS, the energy of CIR signals is found to be highly concentrated along a single path, resulting in a high kurtosis value [20]. The signal in the NLOS path has a large number of multipath components, resulting in a relatively low kurtosis due to its large variance.
The standard deviation of the phase difference is a calculation of the standard deviation of the phase difference between neighboring sampling points, reflecting the severity of the phase change:
ω Δ ϕ = 1 T 1 t = 1 T 1 Δ ϕ t Δ ϕ ¯ 2
where ϕ t is the phase of the signal and Δ ϕ t is the phase difference between neighboring data points.
The visualizations of FPER, RDS, kurtosis and phase difference are shown in Figure 3. It can be seen from the figure that the four features selected by the time feature network have a clear difference in the LOS and NLOS paths.
To enhance the expressive capability of the features, after extracting four time-domain features, the time-domain features are processed through a fully connected network. This network maps the features onto a high-dimensional space while performing nonlinear transformations using the ReLU activation function, with Layer Normalization and Dropout layers incorporated to stabilize the training process and improve training effectiveness. Finally, the processed original CIR sequence and the time-domain features are spliced based on dimensionality for the fusion of the feature data.

3.3. Feature Fusion and Classification Network

The processed CIR sequence features and time-domain features are concatenated and fused along the feature dimension. The fused data is then fed into a fully connected layer for NLOS identification and classification. The sequence features and time-domain features are complementary to each other to avoid the limitation of using only a single feature. The fully connected fusion net incorporates Layer Normalization, a ReLU activation function, two fully connected linear transformation layers and Dropout to project the input data into their respective classes. The architecture of the fully connected layers is illustrated in Figure 4 and can be mathematically expressed as
l a b e l = s o f t m a x f 2 D r o p o u t f 1 x
where f 1 and f 2 denote linear transformation functions with learnable weights and Dropout is a regularization function to prevent overfitting by randomly discarding selected elements of the input data. Following the fully connected layers, the output is ultimately transformed into class probabilities through a softmax function to represent the confidence level of each sample belonging to the NLOS or LOS categories.
The global feature relationships in the CIR sequence are captured through a Transformer encoder employing a multi-head attention mechanism to dynamically focus on critical sequence points. Simultaneously, the expressive capability of the four time-domain features in the CIR sequence is enhanced using fully connected networks. The two types of feature data are fused through dimension concatenation to achieve the precise identification of NLOS. Fusing and complementing the global sequence features and the time-domain features can avoid the feature limitations caused by using a single feature and effectively improve the accuracy and robustness of NLOS identification and classification. Experimental evaluations in subsequent sections systematically validate the practical effectiveness of the proposed algorithm for NLOS identification.

4. Experiment and Analysis of Results

The effectiveness of the proposed DBFF-Transformer was validated through systematic experimental analysis encompassing identification accuracy and computational efficiency. First, the experimental design was outlined with hyperparameter settings and dataset configurations. Secondly, standard evaluation metrics were explicitly defined to quantify classification performance. Subsequently, ablation studies were conducted to validate the optimality of the structure by progressively analyzing key components. Finally, comprehensive comparative analysis with existing state-of-the-art models was performed to demonstrate the competitive advantages of the method in NLOS identification.

4.1. Experimental Design

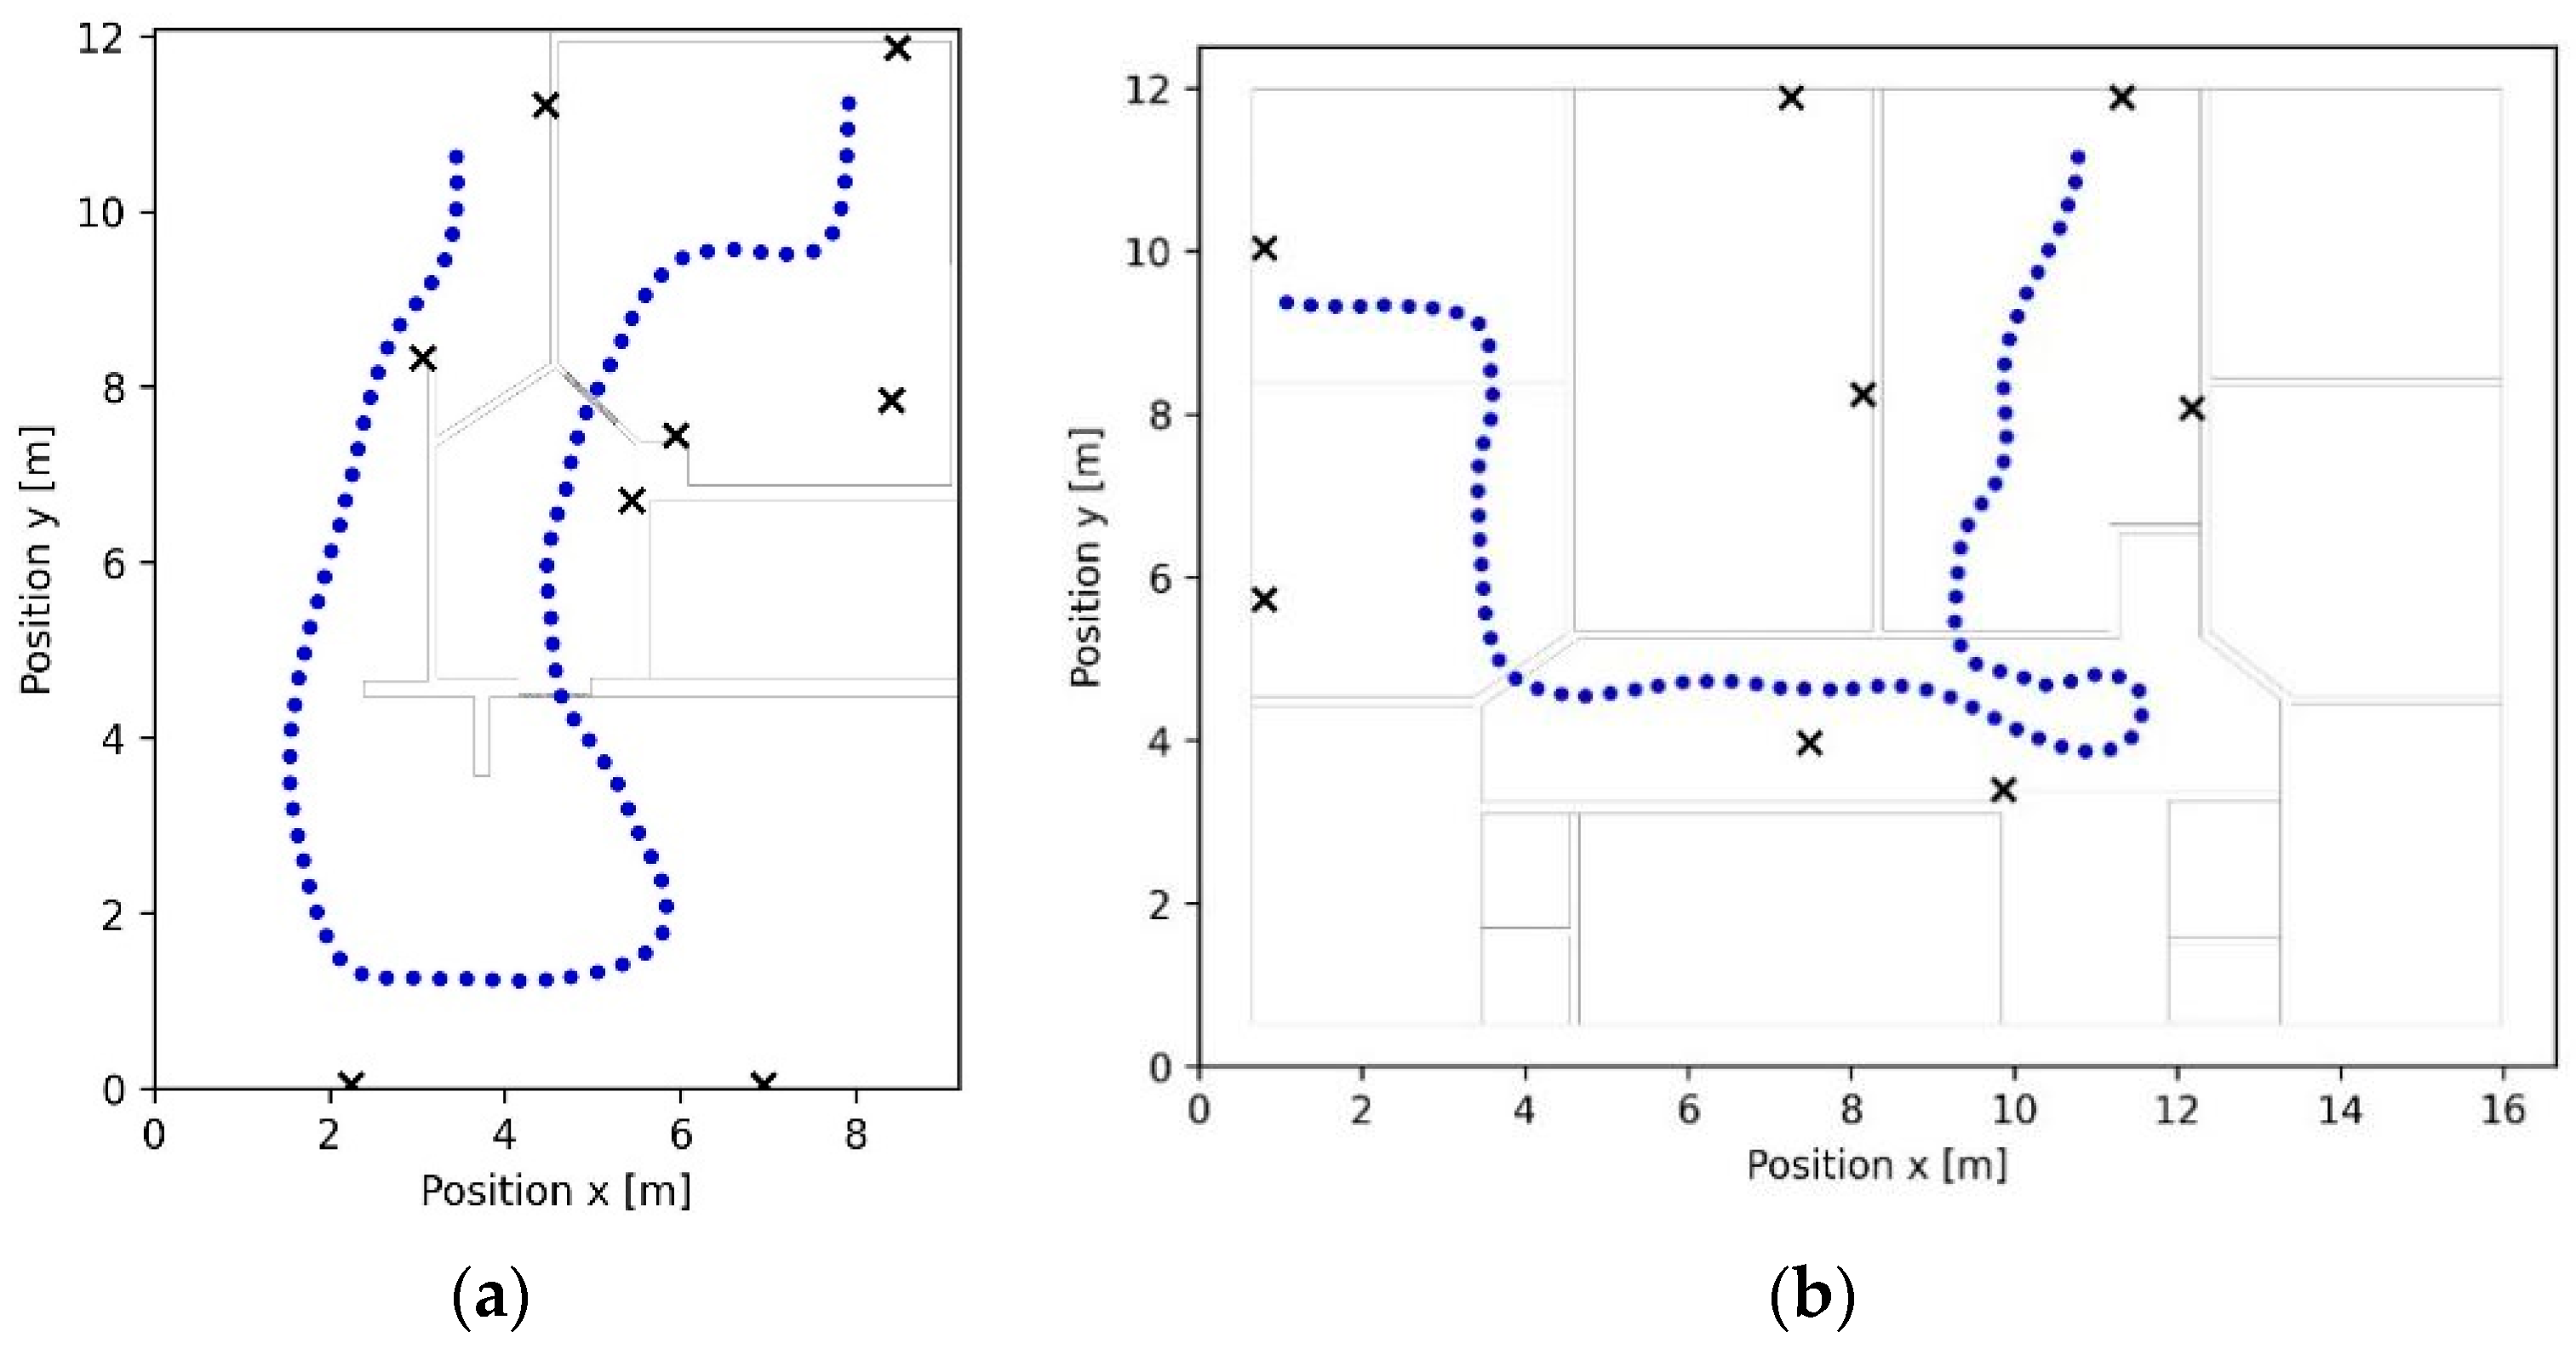
The experimental data utilizes the two latest open-source datasets from the eWINE [38] project. The data collection process for this project was conducted in two typical indoor real-world scenarios: an apartment and an office. Specific scenes are shown in Figure 5. These two data scenarios are hereafter referred to as Environment A and Environment B. The spatial dimensions of Environment A and Environment B are 9 × 12 m2 and 16 × 12 m2, respectively. The black markers in the figure indicate the positions of anchor nodes, while the blue markers represent the movement trajectories of target nodes. To avoid potential variations in sensitivity and accuracy errors across different data collection devices, the dataset from the eWINE project was used in subsequent experiments. The UWB CIR data was collected using the DW1000 module, including 8 fixed anchor nodes and 1 mobile target node. At each measurement location, 6 channels were used for measurement, and 31 measurements were made each time. The two scenarios collected 126,480 and 120,528 CIR data points, respectively. There are 33,108 LOS data points and 93,372 NLOS data points in Environment A. There are 29,946 LOS data points and 90,582 NLOS data points in Environment B. During the CIR dataset collection, the inherent presence of obstacles in the indoor environments led to a natural class imbalance, with NLOS samples significantly outnumbering LOS samples. In practical indoor positioning applications, the proportion of NLOS paths often exceeds that of LOS paths, and the sample ratio in the dataset falls within a reasonable range. This also indicates that the dataset aligns well with real-world application requirements. In response to this situation, the LOS and NLOS sample data in the dataset were stratified sampled and divided, with 70% of the data used as the training set and the validation set and the final test set each accounting for 15%.
In the experiment, the feed-forward network in the Transformer was set to 512 dimensions. In addition, a composite loss function combining weighted cross-entropy and Focal loss was utilized to mitigate sample imbalance during training. The weighted cross-entropy loss function is defined as
L W C E = i = 1 C w i y i log p i
where C is the number of categories, y i represents the true sample label, p i indicates the probability predicted by the model and w i is the class weight. To counteract the class imbalance where NLOS samples dominate, we set a higher weight for the minority LOS class with 2, and NLOS is 1. The Focal loss function is
L F o c a l = 1 p t γ log p t
where p t is the model’s predicted probability for the true category and γ is the focusing parameter, set to 2, which shifts the learning emphasis toward difficult, misclassified examples.
The learning rate is initialized at 1 × 10⁻³ with Cosine Annealing Schedule, the initial cycle length is 10 and the cycle doubling factor is 2, which periodic restarts were implemented to facilitate escape from local optima and the exploration of improved parameter spaces. This strategy ensures a smooth learning rate decay and prevents early convergence stagnation in later training stages, thereby accelerating model optimization. Detailed hyperparameter settings are shown in Table 1.
A dual regularization method is adopted to reduce overfitting during model training. Dropout layers with a rate of 0.1 are inserted after the feed-forward networks in the Transformer encoder and following all fully connected layers. These Dropout operations are synergistically combined with Layer Normalization, which performs instance-wise feature normalization to stabilize feature distributions throughout the training process. At the same time, using the AdamW optimizer, L2 regularization is added, and the coefficient of weight decay is set to 0.01. This integrated strategy effectively enhances generalization capability and drives the model toward optimal performance by balancing parametric regularization and architectural stability. All experiments were conducted on a computer equipped with an Intel Core i7-12700KF CPU and an NVIDIA GeForce RTX 4070 GPU. The model training utilized the PyTorch deep learning framework, version 1.11.0, CUDA version 11.3. The overall training epoch was 200, and the training time for each epoch was about 107 s. In the test, the average inference time per data point was about 0.9725 milliseconds.

4.2. Evaluation Indicators

NLOS identification is a binary classification problem, so there are four situations for the classification results. These situations are as follows:
  • The true LOS CIR sample data are classified as LOS data (TP);
  • The true LOS CIR sample data are classified as NLOS data (FN);
  • The true NLOS CIR sample data are classified as NLOS data (TN);
  • The true NLOS CIR sample data are classified as LOS data (FP).
In the experiment, the performance metrics of accuracy (ACC), Recall, F1 score and AUC-ROC, which are commonly used in classification tasks, were used to evaluate the performance of the proposed method. AUC-ROC is the area under the ROC curve, and the other indicators are denoted as follows:
A C C = T P + T N T P + F P + T N + F N
R e c a l l = T P T P + F N
F 1 S c o r e = 2 T P 2 T P + F P + F N

4.3. Ablation Experiment

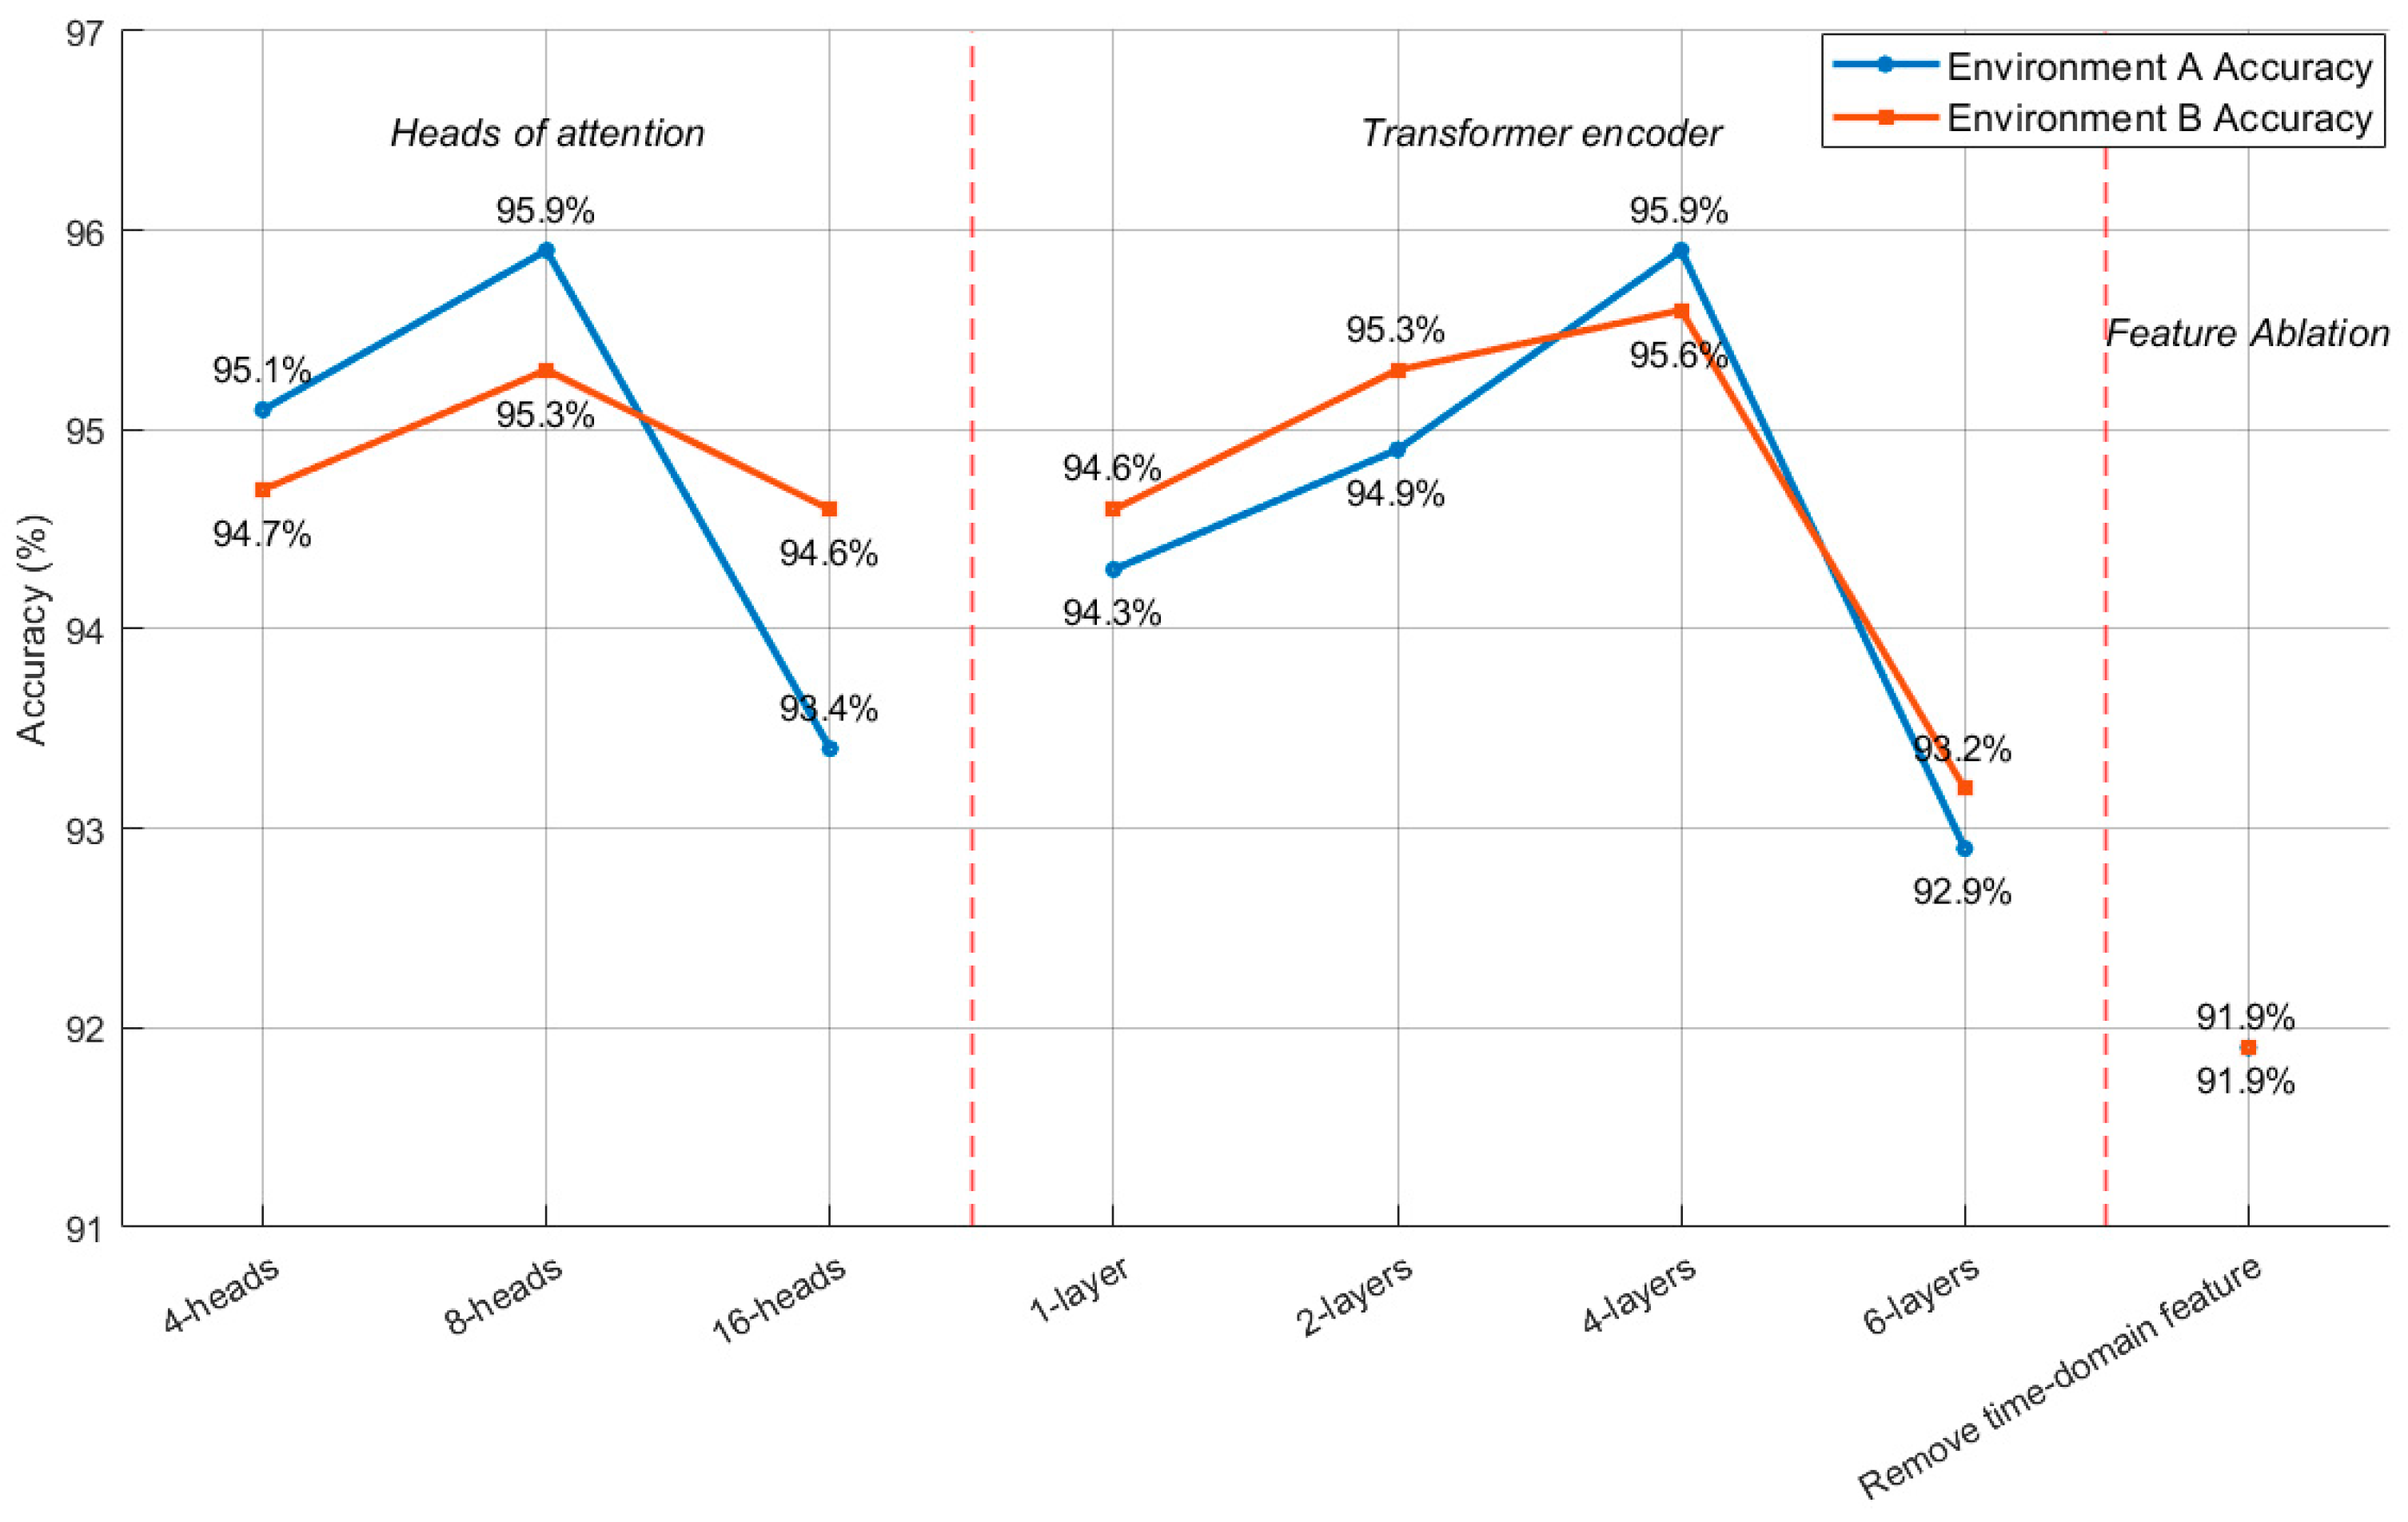
To validate the optimality of the DBFF-Transformer, ablation experiments were conducted in Environment A and Environment B. The experimental variables included the number of Transformer encoder layers, the count of multi-head attention heads and the time-domain feature processing modules. Comparative identification results across different structure configurations are detailed in Table 2. To determine the optimal configuration of the DBFF-Transformer, a systematic exploration was conducted on two structural hyperparameters: the number of multi-head attention heads and the number of Transformer encoder layers. The commonly used Transformer architecture is eight attention heads and six encoder layers, which can be changed to a more suitable structure for different tasks. To explore the optimal structure for NLOS identification, the number of attention heads was set to 4, 8 and 16, and the encoder layers were set to 1, 2, 4 and 6. To achieve the optimal performance of the DBFF-Transformer, the accuracy of the results is used as an indicator to measure the structural configuration. The structure with the highest accuracy is applied to the DBFF-Transformer. The experimental analysis initially focused on optimizing the number of attention heads. The results demonstrated that the 8-head configuration achieved superior performance in both environments. This shows that the 8-head attention balances feature diversity and information completeness, avoiding the underfitting that arises from an insufficient number of heads, as well as the feature fragmentation that results from an excessive number of heads. The results are shown in Figure 6.
Subsequent experiments systematically evaluated the impact of varying Transformer encoder layers on model efficacy, building upon this optimal head configuration. The experimental results reveal a progressive improvement in identification accuracy with increasing encoder depth, peaking at four layers. However, a performance degradation emerges when extending to six encoder layers. This is due to overfitting and high noise sensitivity at six encoder layers. Firstly, the essence of NLOS identification is a binary classification problem. Although the CIR sequence is relatively long, the difficulty of this task is not complicated. The information required for the identification of NLOS mainly focuses on limited propagation patterns such as the first arrival path and multipath interactions. The model that is too deep can cause an overfitting effect, where the model remembers specific features of the data and reduces its ability to generalize on unknown test samples. Secondly, deep-level models will amplify the potential noise in CIR data during the learning process. And it will increase the computational redundancy, which makes the noise sensitivity of the model greatly improved. In the end, the accuracy drops due to overfitting and noise sensitivity. Ultimately, the accuracy of DBFF-Transformer identification decreased due to overfitting and noise sensitivity. Consequently, the 8-head attention mechanism and 4-layer Transformer encoder configuration are selected as the optimal structure for the DBFF-Transformer.
In order to verify the effectiveness of the fusion of CIR sequence feature processing and time-domain feature processing, an additional set of experiments was conducted. In these experiments, the time-domain feature processing network is removed, leaving only the Transformer to process sequence features. The results show that the accuracy of the model after removing the time-domain features is significantly reduced, which proves that the fusion of the CIR sequence data with the time-domain feature data in the model can effectively improve NLOS identification accuracy.

4.4. Comparison Experiment

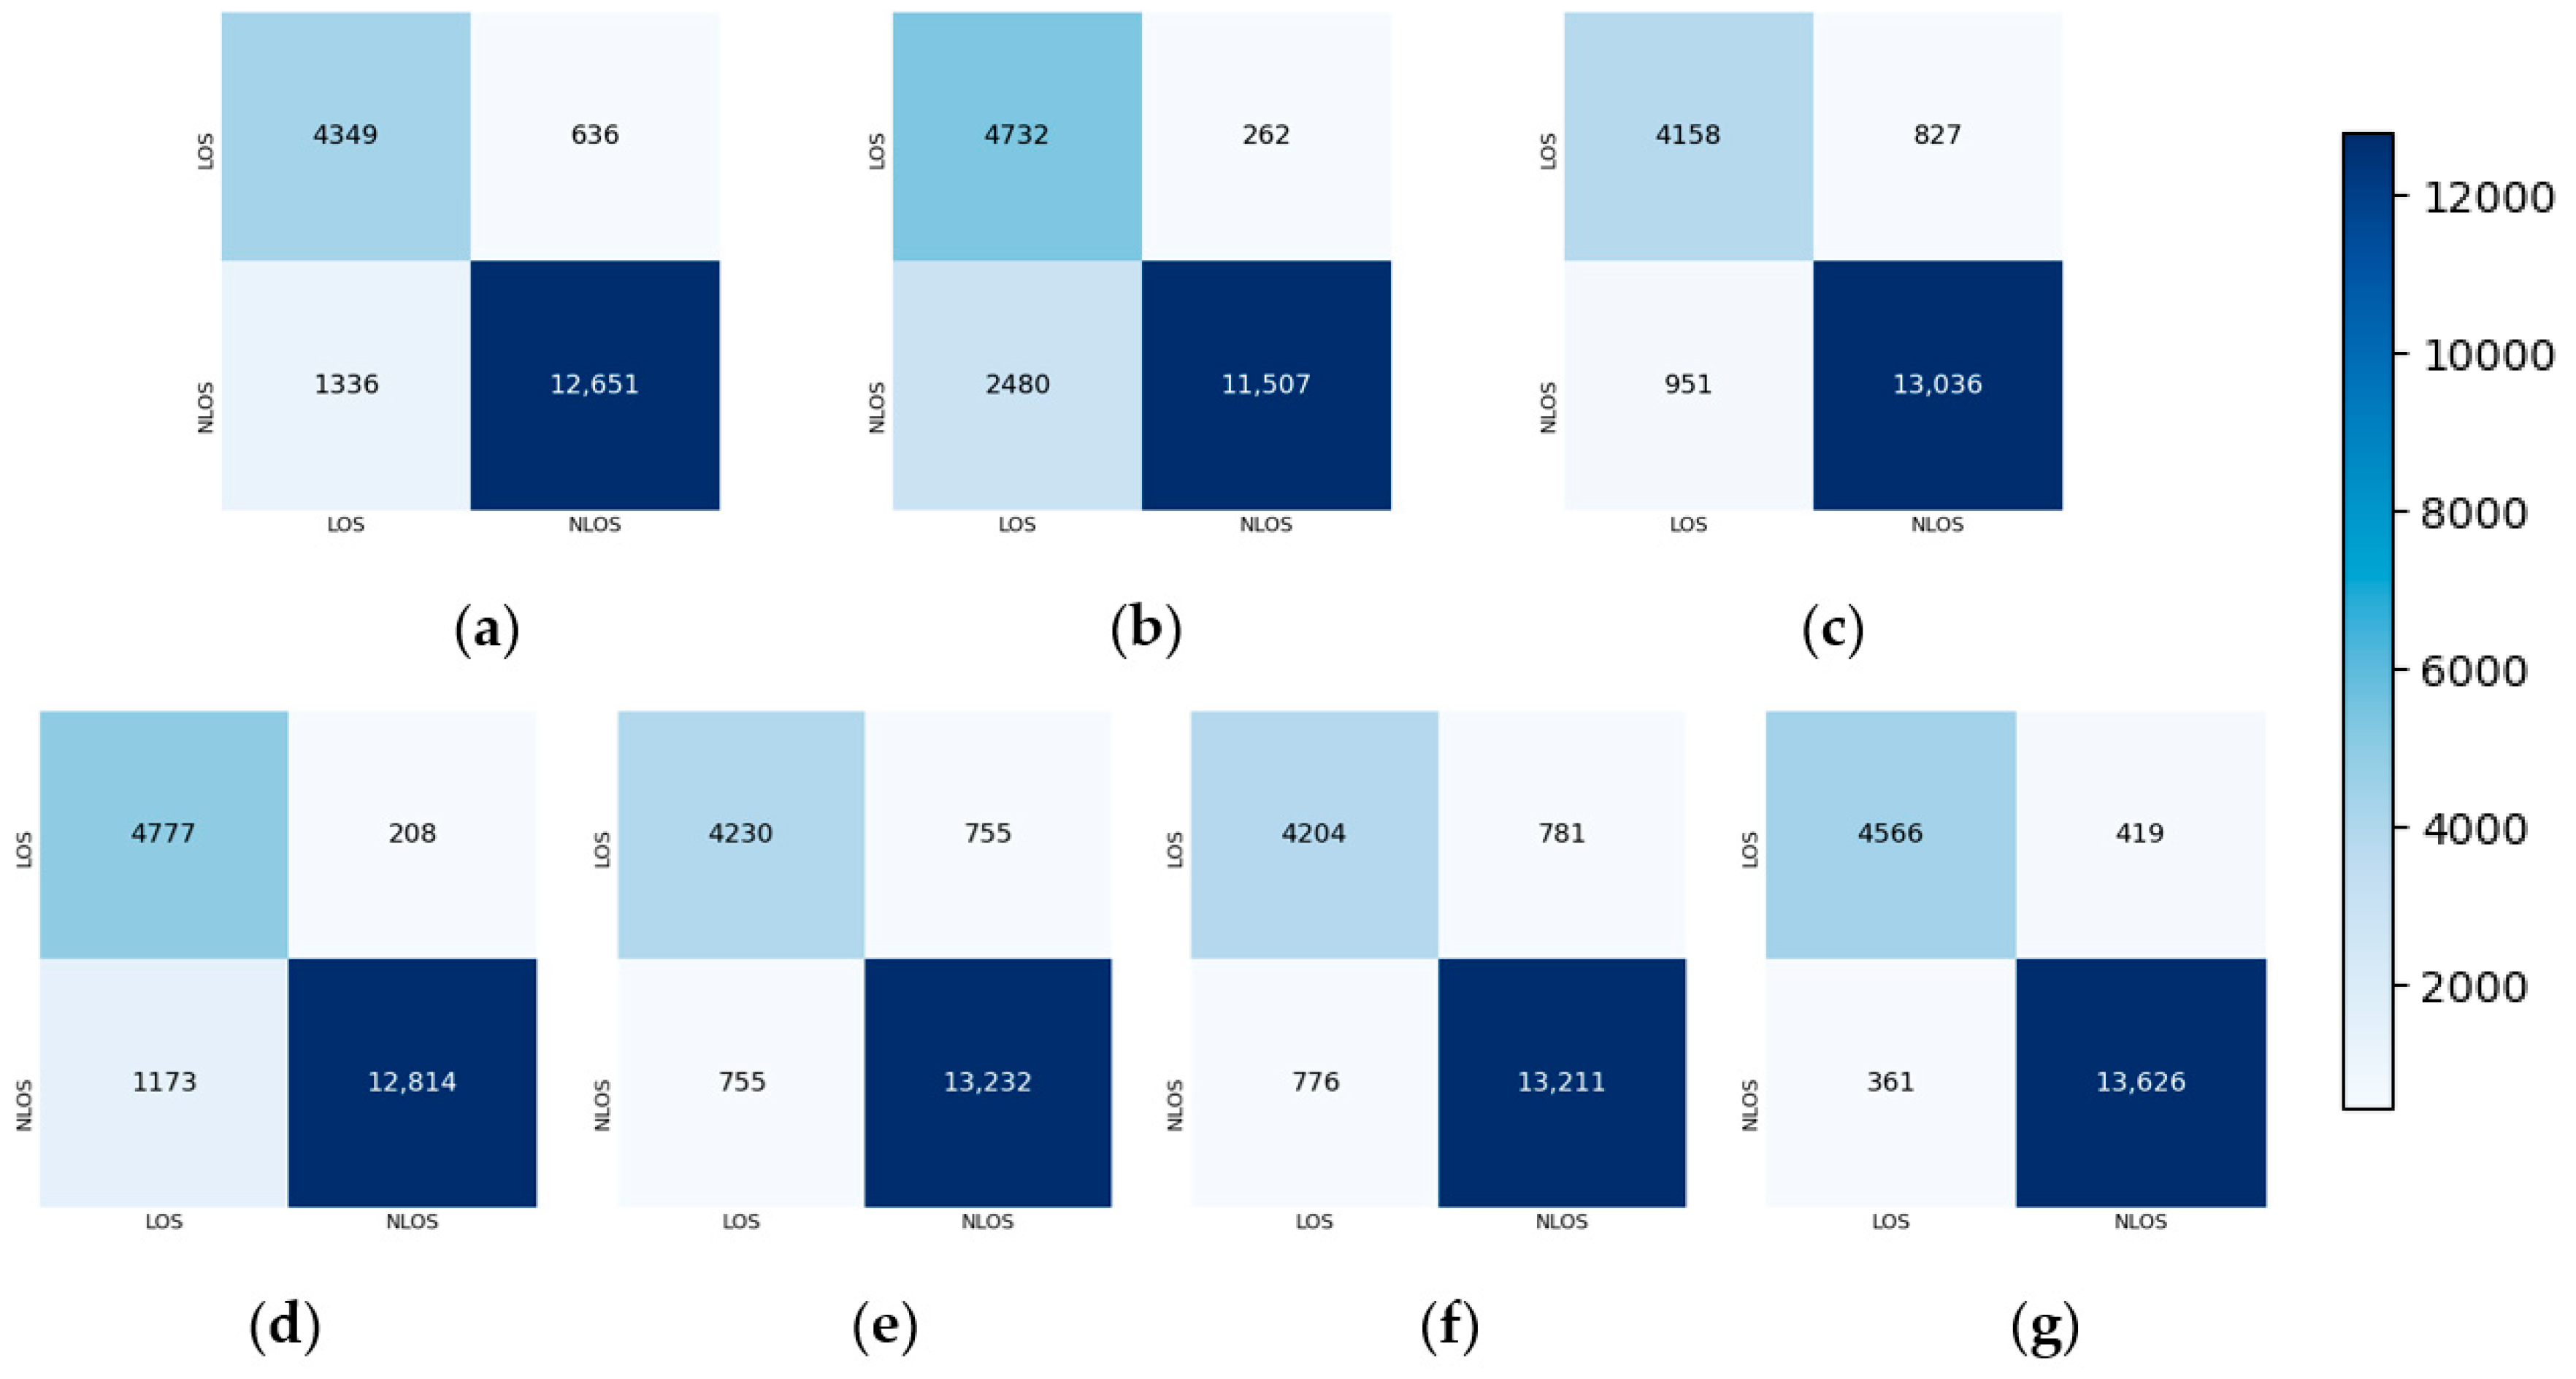
To compare the performance of the DBFF-Transformer, comparative experiments were conducted against five state-of-the-art models, including CNN [29], LSTM [39], CNN-LSTM [31], GRU [32], FCN-Attention [34] and BERT [40]. All models were trained on the same open-source dataset under identical hyperparameter configurations and evaluated separately for both Environment A and Environment B to ensure a fair performance comparison. This experimental design rigorously validates the architectural advantages of the DBFF-Transformer across diverse indoor propagation environments. The confusion matrix of the classification test results in Environment A is displayed in Figure 7.
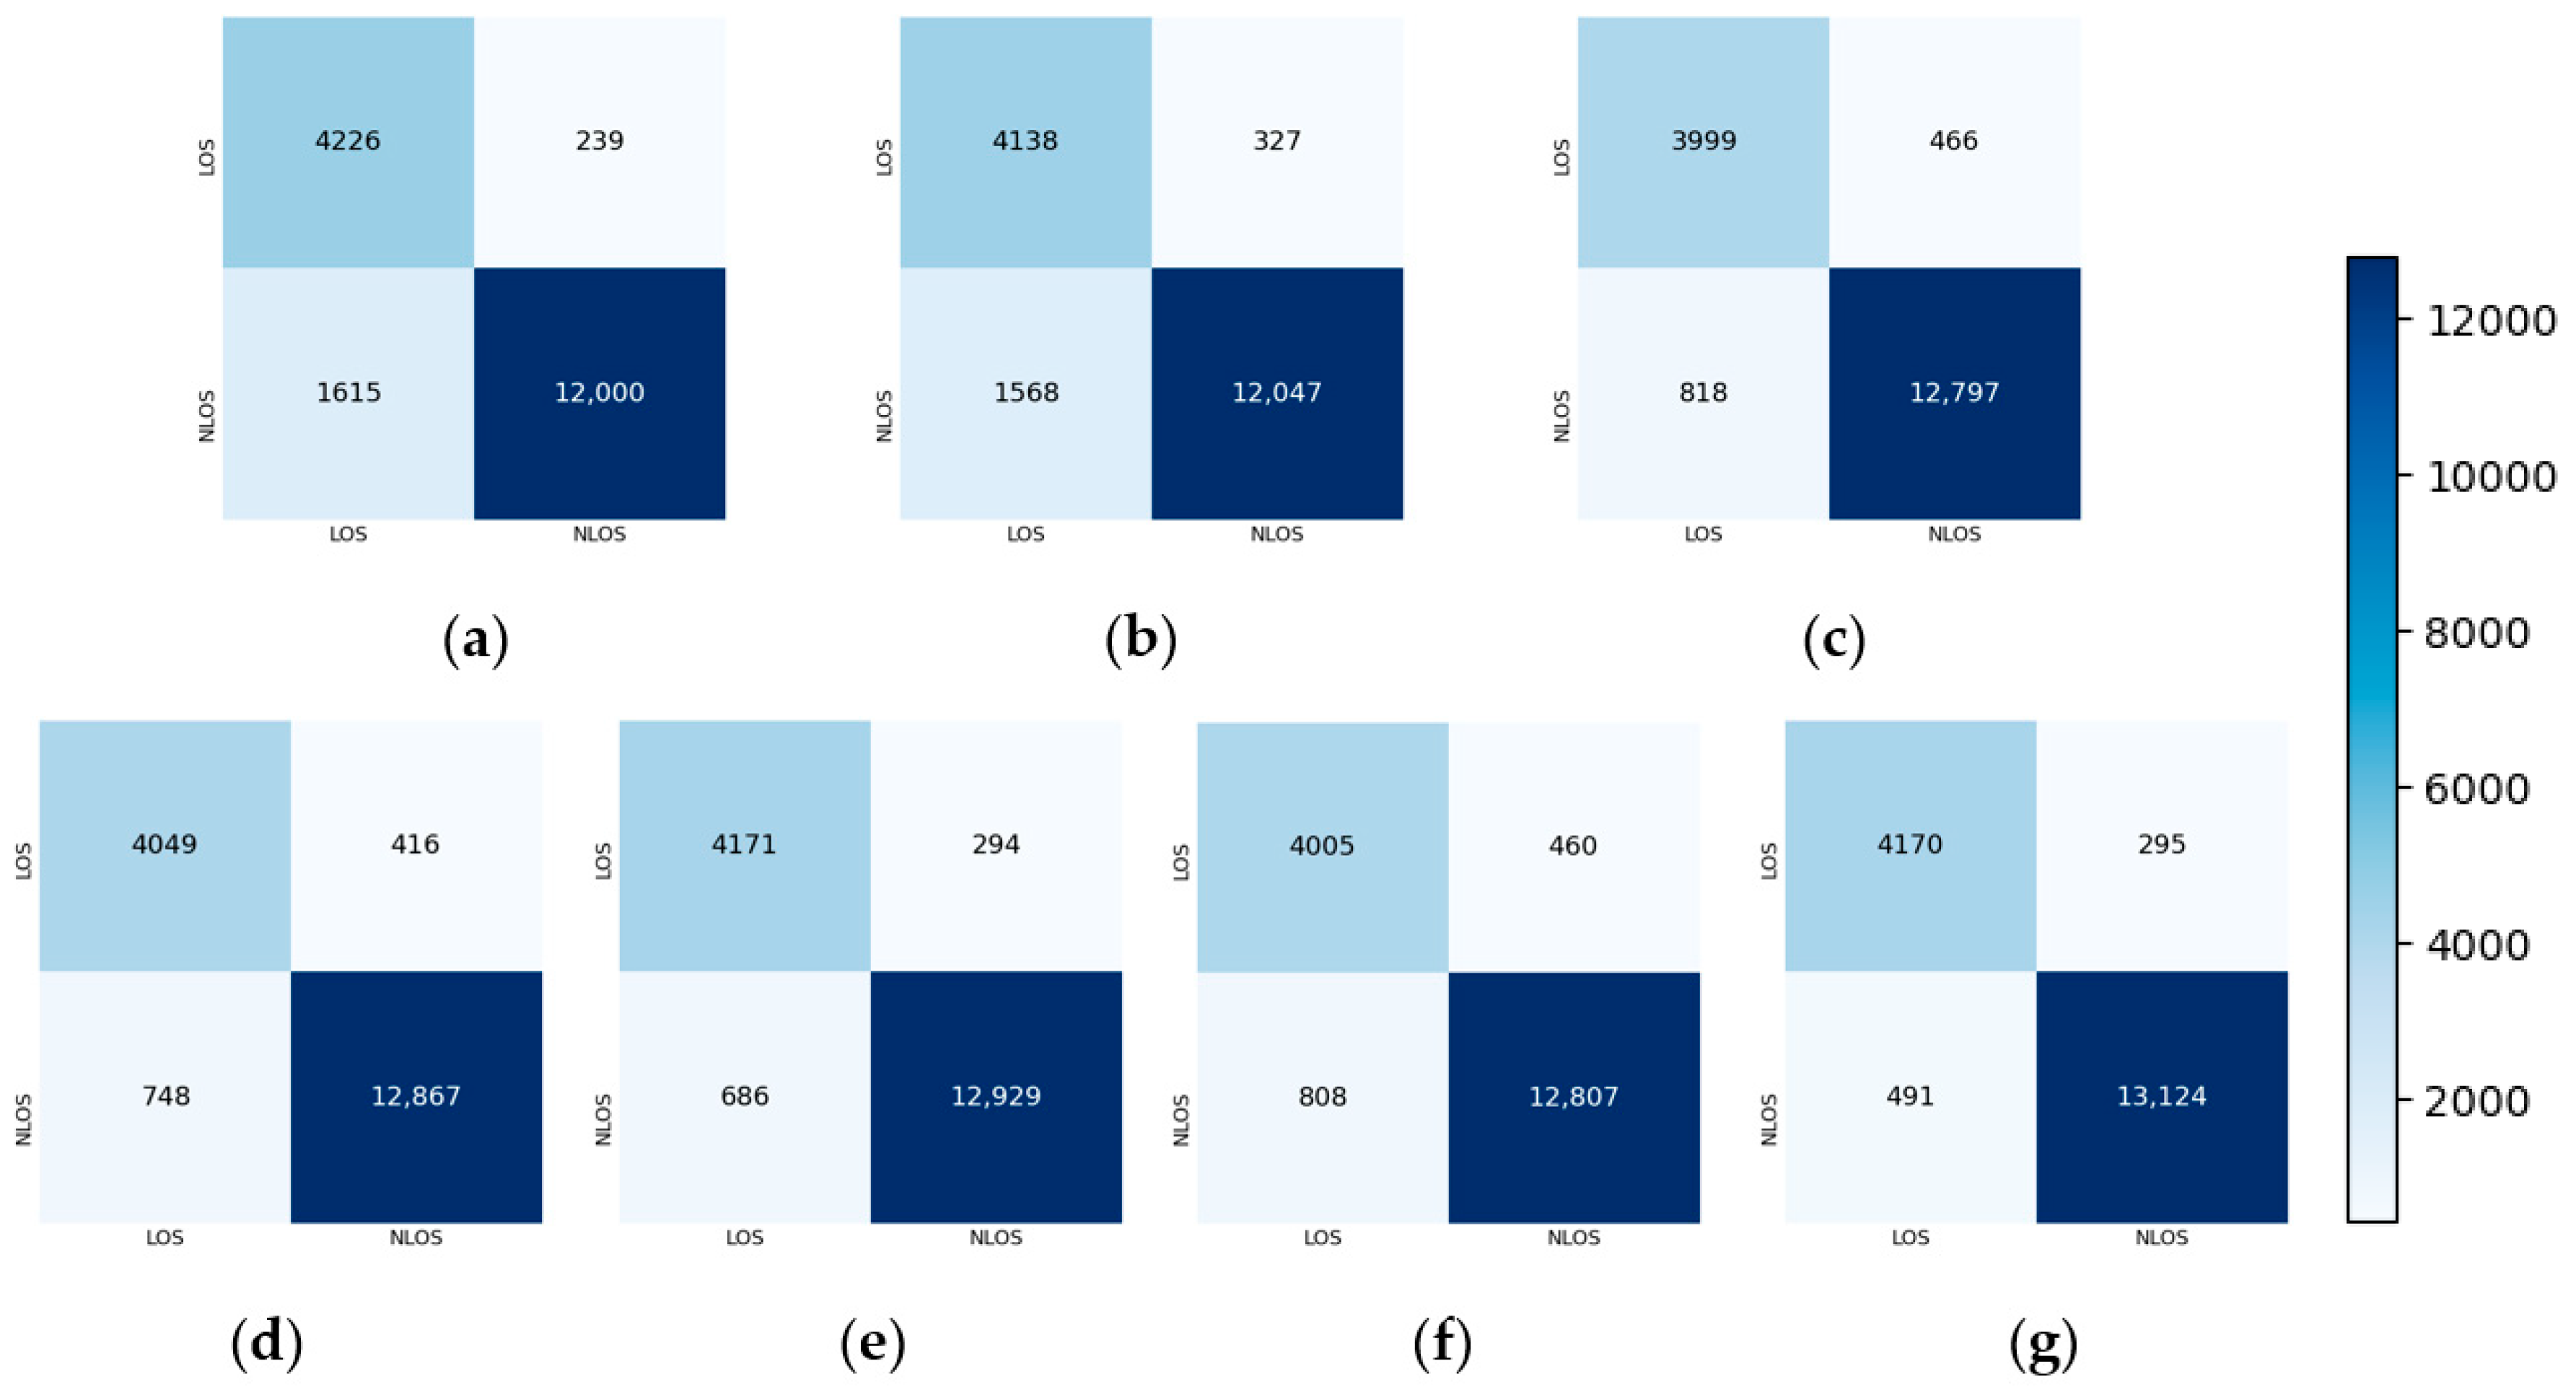
DBFF-Transformer achieved the successful identification of 4566 LOS samples and 13,626 NLOS samples within the test set comprising 4985 LOS and 13,987 NLOS samples. As summarized in Table 3, the evaluation metrics demonstrate superior performance—with a classification accuracy of 95.9%, F1 score of 97.2%, Recall of 97.4% and AUC value of 99.1%—validating the method’s robustness in complex indoor propagation environments. In addition, the average error is reported alongside each evaluation metric. A fixed random seed is used during the training process to ensure consistent model performance. As shown in the results presented in the table, the model’s errors consistently fall within the range of 0.05% to 0.30%, further demonstrating the stability and reliability of the model outputs. The classification results for Environment B are presented in Figure 8. Within the test set containing 4465 LOS samples and 13,615 NLOS samples, the proposed algorithm successfully identified 4170 LOS instances and 13,124 NLOS instances. As detailed in Table 4, the evaluation metrics achieve competitive performance: classification accuracy of 95.7%, F1 score of 97.1%, Recall of 96.4% and AUC of 99.0%. It can be seen from the results that the identification accuracy rates of CNN and LSTM are relatively average. State-of-the-art models such as BERT and FCN-Attention perform relatively well, achieving accuracies of 93% and 94.6%, respectively. However, DBFF-Transformer still has good advantages over these baseline models. The DBFF-Transformer has 1.722 million parameters. Among them, the parameters of the sequence feature network number about 1.601 million, the parameters of the time feature network number about 8300 and the parameters of the feature fusion and classification network number about 0.12 million. It can be seen from the experiment that although the time feature network has only a small number of parameters, it can significantly improve the accuracy of NLOS identification. In addition, although the DBFF-Transformer is relatively large compared to the other baseline models, it has an average inference time per sample of just 0.9725 milliseconds. At present, the position update frequency of most UWB positioning devices is between 10 Hz and 100 Hz, among which NLOS identification is only a part of the positioning task. The inference time of DBFF-Transformer is within an acceptable range and also demonstrates that this method exhibits relatively superior performance.
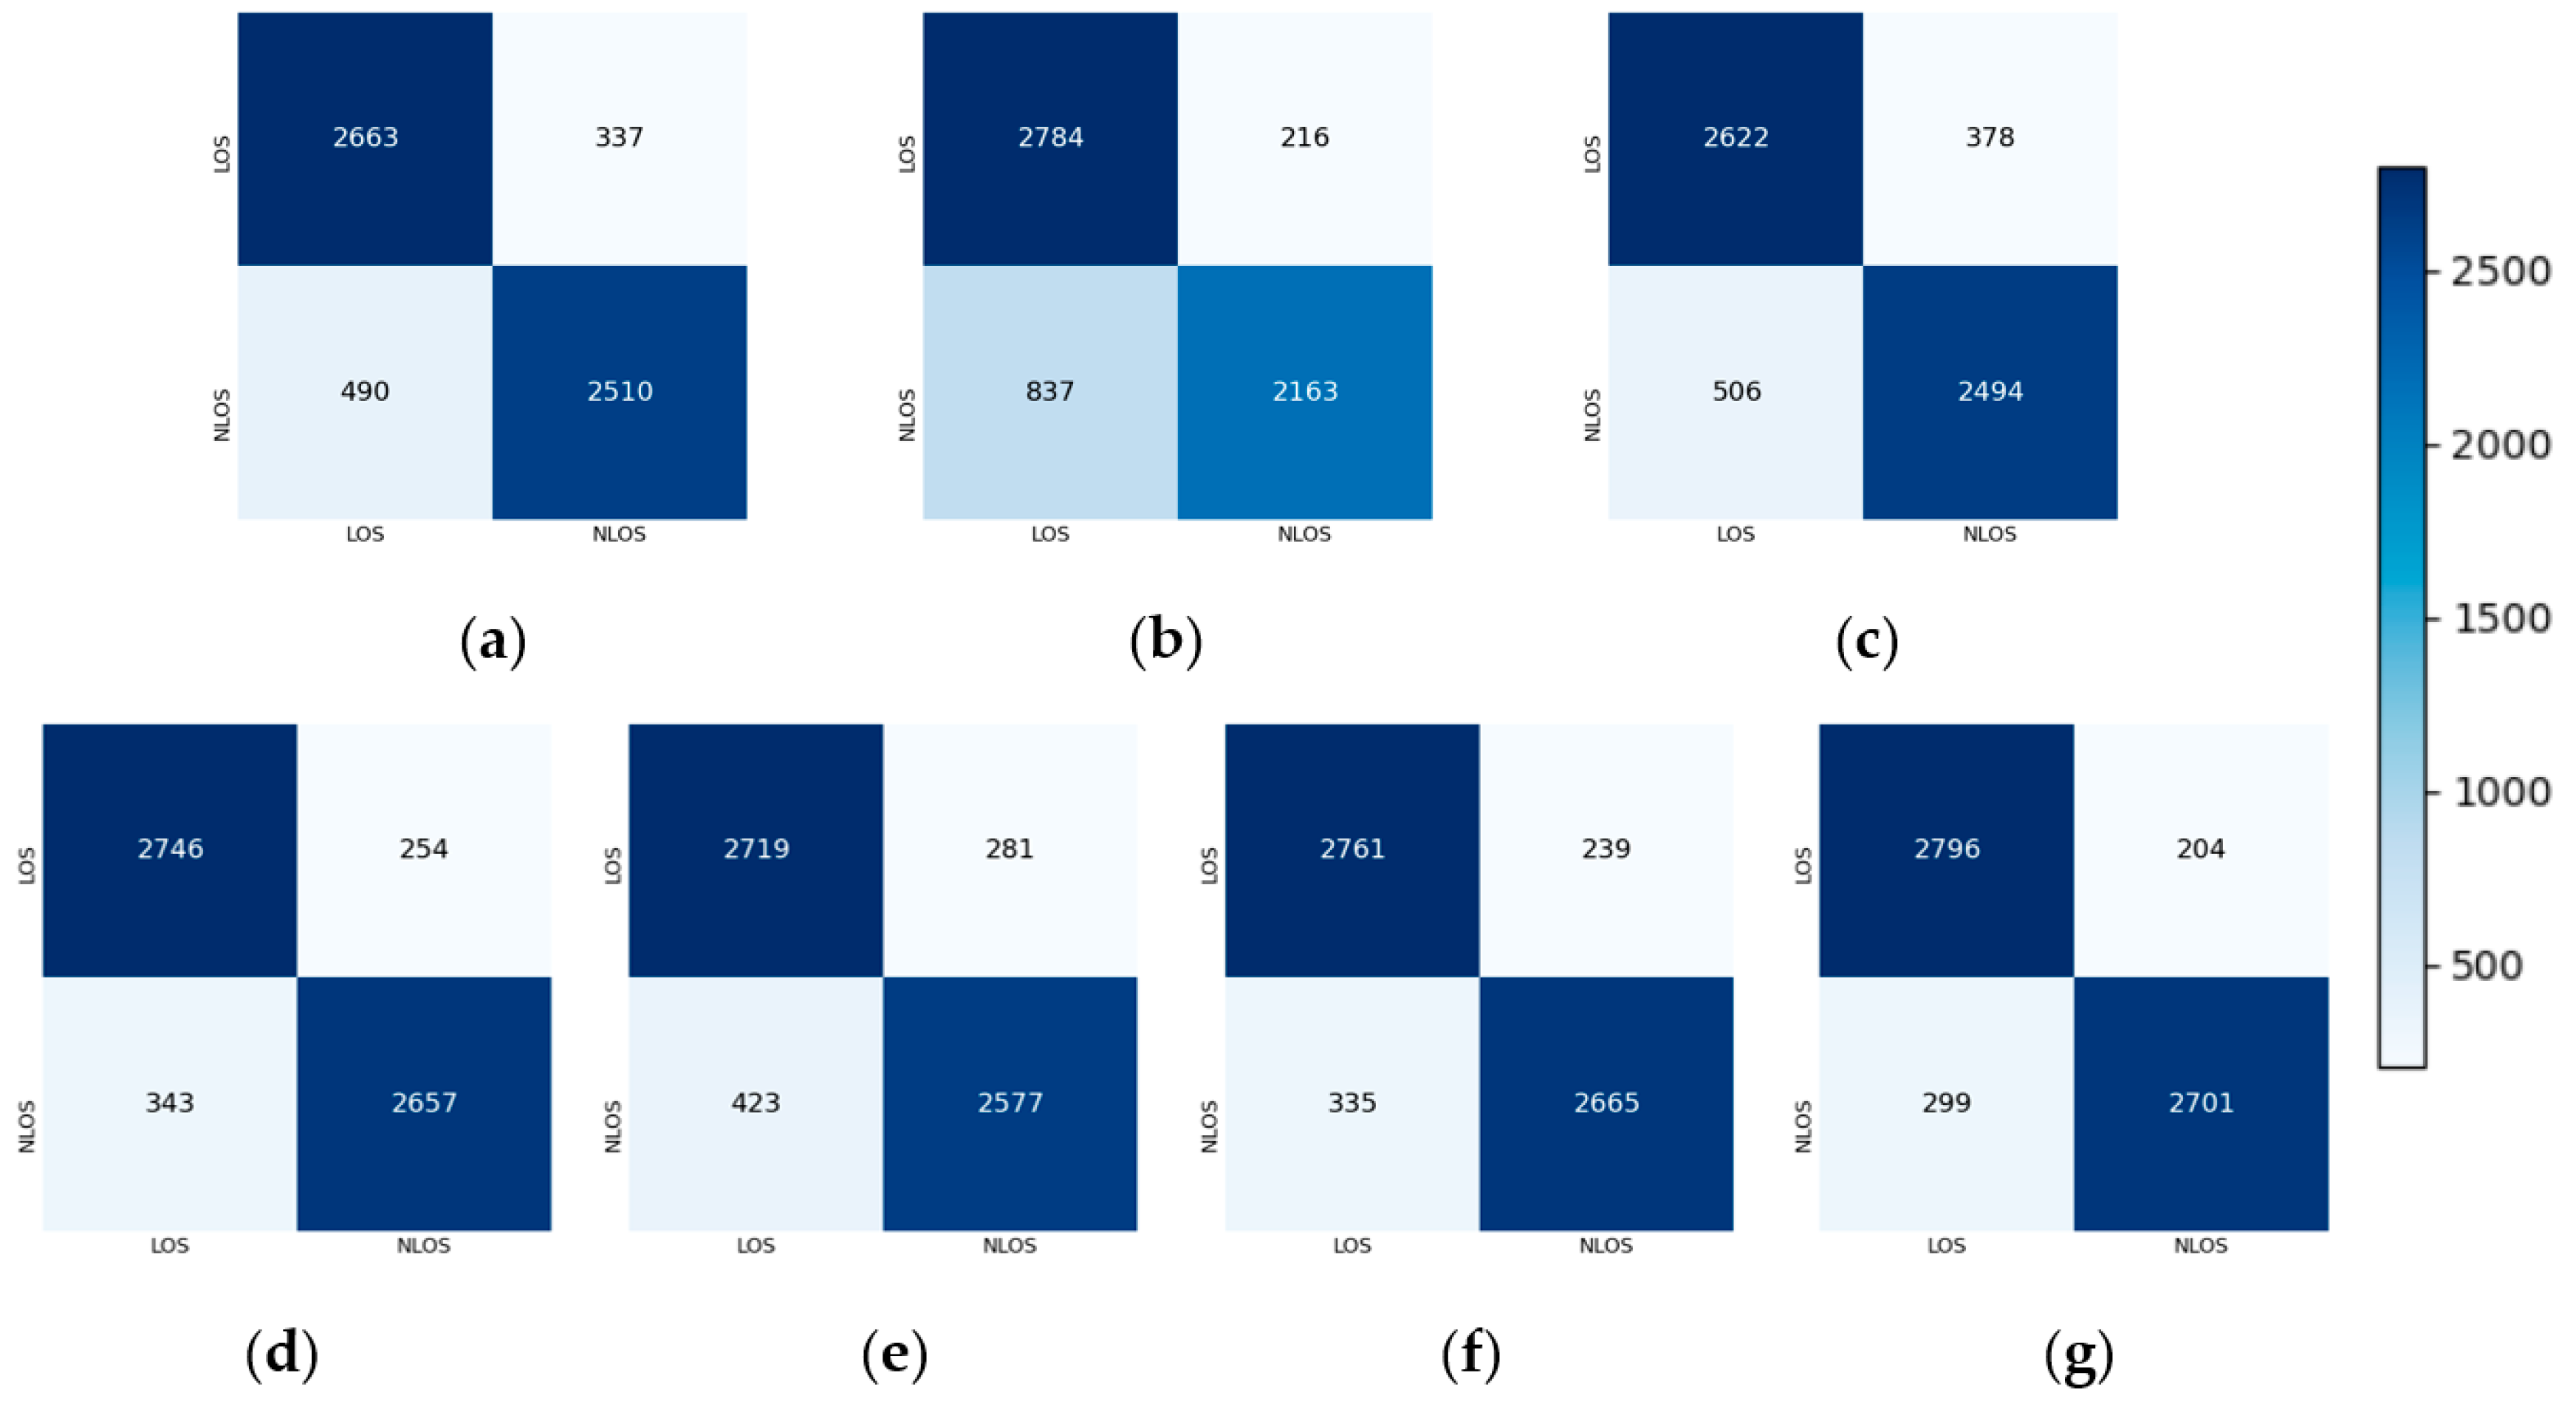
In order to test the generalization ability of DBFF-Transformer, it was verified in another data scenario [29]. There are 6000 CIR data points in this dataset, including 3000 for LOS and 3000 for NLOS. It is worth mentioning that this dataset supports a large number of studies on UWB NLOS identification. The results are shown in Figure 9. The evaluation metrics of the results are shown in Table 5. The dataset was collected in a workshop in an industrial scenario, which is a representative indoor environment. It can be seen from the results that in a completely unknown and complex environment, the performance of DBFF-Transformer and several other baseline models has declined. However, DBFF-Transformer still has advantages over the baseline models.
In Table 3, Table 4 and Table 5, the statistical significance of DBFF-Transformer is displayed more intuitively, and the T-test is added. The T-test is the test result of the baseline model and the proposed DBFF-Transformer for ACC. It can be seen from the T value of the results that the ACC of DBFF-Transformer has been significantly improved compared with the baseline model.
There are still some misclassifications in the identification of NLOS by DBFF-Transformer. For example, the identification of NLOS as LOS constitutes the primary portion of misclassification. This situation is mostly due to the fact that the path is only slightly affected by obstacles, and the multipath effect is not significant. The value of the confidence in the model output is out in the middle, making it easy to produce a wrong classification. Comparative analysis reveals that the baseline models exhibit a slightly degraded performance in Environment B compared to Environment A. This is attributed to environmental discrepancies in obstacle distributions and noise profiles between the two scenarios. The performance of the LSTM and CNN-LSTM models exhibited significant fluctuations. This stems from inherent limitations in these models when processing CIR data, limitations that are amplified in Environment A. Due to the obvious multipath effect and long-distance time correlation, LSTM has difficulty in capturing global patterns. Furthermore, although CNN-LSTM extracts local features through CNN convolutional kernels, it still struggles to obtain global context information from the CIR sequence. This observation highlights the baseline model’s susceptibility to environment noise variations, resulting in inconsistent ACC and F1 score performance across scenarios. It also indicates that these models are affected by environmental noise when facing different scenarios, which leads to fluctuations in classification accuracy. However, the DBFF-Transformer shows relatively stable performance and strong robustness when dealing with different scenarios, with no significant fluctuations in the test results. Moreover, from the perspective of evaluation indicators, the method performs excellently in terms of accuracy, F1 score, Recall and AUC-ROC.

5. Conclusions

The NLOS identification problem is a pivotal issue in improving the usability of UWB indoor positioning. To address the limitations of existing NLOS identification methods that rely solely on CIR sequence features or statistical features, a DBFF-Transformer method is proposed. It effectively identifies NLOS paths by combining the strengths of global CIR sequence features and time-domain features. Experimental results demonstrate that the proposed DBFF-Transformer can effectively identify NLOS paths. The accuracy reached 95.88% and 95.65% in two representative indoor environments. A series of experiments were conducted on different structural configurations in the ablation experiment. Ultimately, the optimal configuration for DBFF-Transformer was determined to be eight attention heads and four encoder layers. This configuration achieves an effective balance between model accuracy and complexity while ensuring that all global feature relationships in CIR data are fully learned. The experiment also demonstrated that the identification accuracy of NLOS significantly improves when incorporating the four time-domain features: FPER, RDS, kurtosis and phase difference. This result shows that time-domain features complement the sequence features extracted by the Transformer and proves the effectiveness of the dual-branch feature fusion in NLOS identification. In comparative experiments with the baseline model, DBFF-Transformer demonstrated superior performance across ACC, F1 score, Recall and AUC-ROC. Furthermore, consistent performance was demonstrated across both environments, proving its excellent robustness.
DBFF-Transformer can provide a new solution for the identification of NLOS paths in UWB indoor positioning. However, DBFF-Transformer requires further improvement in identification accuracy to reduce the impact of positioning errors. Additionally, due to the large number of parameters in DBFF-Transformer, this model can be deployed on devices with strong processing power, such as edge gateways. But when dealing with low-end embedded devices with limited processing capabilities, significant constraints may arise. Although DBFF-Transformer is able to meet the time requirements of general UWB positioning systems, it is obviously not suitable for scenarios that require ultra-high-speed responses, such as unmanned aerial systems. Due to the limitation of the conditions, the dataset of the experiment is a public dataset, which means the performance of DBFF-Transformer was not explored in a dynamic environment. Therefore, in future research, a more lightweight attention model should be explored so that it still has better performance in resource-constrained devices and dynamically changing complex environments.

Author Contributions

Conceptualization, G.X. and S.H.; methodology, S.H.; software, S.H.; validation, S.H., G.X. and D.Z.; formal analysis, S.H.; investigation, G.X. and S.H.; resources, G.X. and D.Z.; data curation, S.H. and J.W.; writing—original draft preparation, S.H.; writing—review and editing, G.X., S.H. and J.W.; visualization, S.H.; supervision, G.X. and D.Z.; project administration, G.X. All authors have read and agreed to the published version of the manuscript.

Funding

This research received no external funding.

Institutional Review Board Statement

Not applicable.

Informed Consent Statement

Not applicable.

Data Availability Statement

The original contributions presented in this study are included in the article. Further inquiries can be directed to the corresponding author.

Conflicts of Interest

The authors declare no conflicts of interest.

References

  1. Gao, F.; Ma, J. Indoor location technology with high accuracy using simple visual tags. Sensors 2023, 23, 1597. [Google Scholar] [CrossRef]
  2. Syazwani, N.C.J.; Wahab, N.; Sunar, N.; Ariffin, S.; Wong, K.; Aun, Y. Indoor positioning system: A review. Int. J. Adv. Comput. Sci. Appl. 2022, 13, 6. [Google Scholar] [CrossRef]
  3. Wei, Z.; Chen, J.; Tang, H.; Zhang, H. RSSI-based location fingerprint method for RFID indoor positioning: A review. Nondestruct. Test. Eval. 2024, 39, 3–31. [Google Scholar] [CrossRef]
  4. Ling, X.; Yun, X.; Funeng, W. Improved Pedestrian Location Method for the Indoor Environment Based on MIMU and sEMG Sensors. J. Sens. 2024, 2024, 2205513. [Google Scholar] [CrossRef]
  5. Fei, R.; Guo, Y.; Li, J.; Hu, B.; Yang, L. An improved BPNN method based on probability density for indoor location. IEICE Trans. Inf. Syst. 2023, 106, 773–785. [Google Scholar] [CrossRef]
  6. Kim, Y.; Kim, J.; You, C.; Park, H. Integrated indoor positioning methods to optimize computations and prediction accuracy enhancement. Comput. Intell. 2024, 40, e12620. [Google Scholar] [CrossRef]
  7. Jianhua, L.; Baoshan, Z.; Songnian, L.; Zlatanova, S.; Zhijie, Y.; Mingchen, B.; Bing, Y.; Danqi, W. MLA-MFL: A Smartphone Indoor Localization Method for Fusing Multi-source Sensors under Multiple Scene Conditions. IEEE Sens. J. 2024, 24, 26320–26333. [Google Scholar] [CrossRef]
  8. Tošić, A.; Hrovatin, N.; Vičič, J. A WSN framework for privacy aware indoor location. Appl. Sci. 2022, 12, 3204. [Google Scholar] [CrossRef]
  9. Yang, H.; Wang, Y.; Xu, S.; Bi, J.; Jia, H.; Seow, C. Ultra-wideband ranging error mitigation with novel channel impulse response feature parameters and two-step non-line-of-sight identification. Sensors 2024, 24, 1703. [Google Scholar] [CrossRef] [PubMed]
  10. Tu, C.; Zhang, J.; Quan, Z.; Ding, Y. UWB indoor localization method based on neural network multi-classification for NLOS distance correction. Sens. Actuators A Phys. 2024, 379, 115904. [Google Scholar] [CrossRef]
  11. Abraha, A.T.; Wang, B. A Survey on Scalable Wireless Indoor Localization: Techniques, Approaches and Directions. Wirel. Pers. Commun. 2024, 136, 1455–1496. [Google Scholar] [CrossRef]
  12. Shalihan, M.; Cao, Z.; Pongsirijinda, K.; Kiat Ng, B.K.; Lau, B.P.L.; Liu, R.; Yuen, C.; Tan, U.X. Localization through mitigating and compensating UWB NLOS ranging error with neural network. Digit. Signal Process. 2025, 166, 105397. [Google Scholar] [CrossRef]
  13. Barbieri, L.; Brambilla, M.; Trabattoni, A.; Mervic, S.; Nicoli, M. UWB localization in a smart factory: Augmentation methods and experimental assessment. IEEE Trans. Instrum. Meas. 2021, 70, 2508218. [Google Scholar] [CrossRef]
  14. Nkrow, R.E.; Silva, B.; Boshoff, D.; Hancke, G.; Gidlund, M.; Abu-Mahfouz, A. NLOS Identification and Mitigation for Time-based Indoor Localization Systems: Survey and Future Research Directions. ACM Comput. Surv. 2024, 56, 303. [Google Scholar] [CrossRef]
  15. Shui, W.; Xiong, M.; Mai, W.; Qin, S. A robust TDOA localization method for researching upper bound on NLOS ranging error. Signal Process. 2025, 235, 110040. [Google Scholar] [CrossRef]
  16. Fathalizadeh, A.; Moghtadaiee, V.; Alishahi, M. A survey and future outlook on indoor location fingerprinting privacy preservation. Comput. Netw. 2025, 262, 111199. [Google Scholar] [CrossRef]
  17. Cui, Z.; Gao, Y.; Hu, J.; Tian, S.; Cheng, J. LOS/NLOS identification for indoor UWB positioning based on Morlet wavelet transform and convolutional neural networks. IEEE Commun. Lett. 2020, 25, 879–882. [Google Scholar] [CrossRef]
  18. Chen, Y.; Wang, J.; Yang, J. Exploiting Anchor Links for NLOS Combating in UWB Localization. ACM Trans. Sen. Netw. 2024, 20, 72. [Google Scholar] [CrossRef]
  19. Zhao, Y.; Wang, M. The LOS/NLOS classification method based on deep learning for the UWB localization system in coal mines. Appl. Sci. 2022, 12, 6484. [Google Scholar] [CrossRef]
  20. Landolsi, M.A.; Almutairi, A.F.; Kourah, M.A. LOS/NLOS channel identification for improved localization in wireless ultra-wideband networks. Telecommun. Syst. 2019, 72, 441–456. [Google Scholar] [CrossRef]
  21. Liu, Q.; Zhao, Y.; Yin, Z.; Wu, Z. WDMA-UWB Indoor Positioning Through Channel Classification-Based NLOS Mitigation Approach. IEEE Sens. J. 2024, 24, 28995–29005. [Google Scholar] [CrossRef]
  22. Qin, L.; Shi, M.; Li, J.; Gu, X. LOS/NLOS classification using causal backtracking and ResNet in UWB sensing. Phys. Commun. 2025, 72, 102714. [Google Scholar] [CrossRef]
  23. Abou-Shehada, I.M.; AlMuallim, A.F.; AlFaqeh, A.K.; Muqaibel, A.H.; Park, K.-H.; Alouini, M.-S. Accurate indoor visible light positioning using a modified pathloss model with sparse fingerprints. J. Light Technol. 2021, 39, 6487–6497. [Google Scholar] [CrossRef]
  24. Dahiru Buhari, M.; Bagus Susilo, T.; Khan, I.; Olaniyi Sadiq, B. Statistical LOS/NLOS Classification for UWB Channels. arXiv 2023, arXiv:2308.07726. [Google Scholar] [CrossRef]
  25. Guo, J.; Zhang, L.; Wang, W.; Zhang, K. Hyperbolic Localization Algorithm in Mixed LOS-NLOS Environments. In Proceedings of the 2020 IEEE International Conference on Power, Intelligent Computing and Systems (ICPICS), Shenyang, China, 28–30 July 2020; IEEE: New York, NY, USA, 2020; pp. 847–850. [Google Scholar]
  26. Minango, J.; Paredes-Parada, W.; Zambrano, M. Supervised Machine Learning Algorithms for LOS/NLOS Classification in Ultra-Wide-Band Wireless Channel. In Proceedings of the International Conference on Innovation and Research, Sangolquí, Ecuador, 1–3 September 2021; Springer: Berlin/Heidelberg, Germany, 2021; pp. 555–565. [Google Scholar]
  27. Wang, S.; Ahmad, N.S. Improved UWB-based indoor positioning system via NLOS classification and error mitigation. Eng. Sci. Technol. Int. J. 2025, 63, 101979. [Google Scholar] [CrossRef]
  28. Wang, F.; Tang, H.; Chen, J. Survey on NLOS identification and error mitigation for UWB indoor positioning. Electronics 2023, 12, 1678. [Google Scholar] [CrossRef]
  29. Bregar, K.; Mohorčič, M. Improving Indoor Localization Using Convolutional Neural Networks on Computationally Restricted Devices. IEEE Access 2018, 6, 17429–17441. [Google Scholar] [CrossRef]
  30. Sung, S.; Kim, H.; Jung, J.-I. Accurate indoor positioning for UWB-based personal devices using deep learning. IEEE Access 2023, 11, 20095–20113. [Google Scholar] [CrossRef]
  31. Wang, Q.; Chen, M.; Liu, J.; Lin, Y.; Li, K.; Yan, X.; Zhang, C. 1D-CLANet: A Novel Network for NLoS Classification in UWB Indoor Positioning System. Appl. Sci. 2024, 14, 7609. [Google Scholar] [CrossRef]
  32. Wei, J.; Wang, H.; Su, S.; Tang, Y.; Guo, X.; Sun, X. NLOS identification using parallel deep learning model and time-frequency information in UWB-based positioning system. Measurement 2022, 195, 111191. [Google Scholar] [CrossRef]
  33. Hu, J.; Shen, L.; Sun, G. Squeeze-and-excitation networks. In Proceedings of the IEEE Conference on Computer Vision and Pattern Recognition, Salt Lake City, UT, USA, 18–22 June 2018; pp. 7132–7141. [Google Scholar]
  34. Pei, Y.; Chen, R.; Li, D.; Xiao, X.; Zheng, X. FCN-Attention: A deep learning UWB NLOS/LOS classification algorithm using fully convolution neural network with self-attention mechanism. Geo-Spat. Inf. Sci. 2024, 27, 1162–1181. [Google Scholar] [CrossRef]
  35. Yang, H.; Wang, Y.; Seow, C.K.; Sun, M.; Joseph, W.; Plets, D. A novel credibility evaluation and mitigation for ranging measurement in UWB localization. Measurement 2025, 256, 117721. [Google Scholar] [CrossRef]
  36. Liu, J.; Wang, T.; Li, Y.; Li, C.; Wang, Y.; Shen, Y. A transformer-based signal denoising network for AoA estimation in NLoS environments. IEEE Commun. Lett. 2022, 26, 2336–2339. [Google Scholar] [CrossRef]
  37. Tian, Y.; Lian, Z.; Núñez-Andrés, M.A.; Yue, Z.; Li, K.; Wang, P.; Wang, M. The application of gated recurrent unit algorithm with fused attention mechanism in UWB indoor localization. Measurement 2024, 234, 114835. [Google Scholar] [CrossRef]
  38. Bregar, K. Indoor UWB positioning and position tracking data set. Sci. Data 2023, 10, 744. [Google Scholar] [CrossRef]
  39. Tian, Y.; Lian, Z.; Wang, P.; Wang, M.; Yue, Z.; Chai, H. Application of a long short-term memory neural network algorithm fused with Kalman filter in UWB indoor positioning. Sci. Rep. 2024, 14, 1925. [Google Scholar] [CrossRef]
  40. Yang, H.; Wang, Y.; Seow, C.K.; Sun, M.; Coene, S.; Huang, L.; Joseph, W.; Plets, D. Fuzzy Transformer Machine Learning for UWB NLOS Identification and Ranging Mitigation. IEEE Trans. Instrum. Meas. 2025, 74, 8503817. [Google Scholar] [CrossRef]
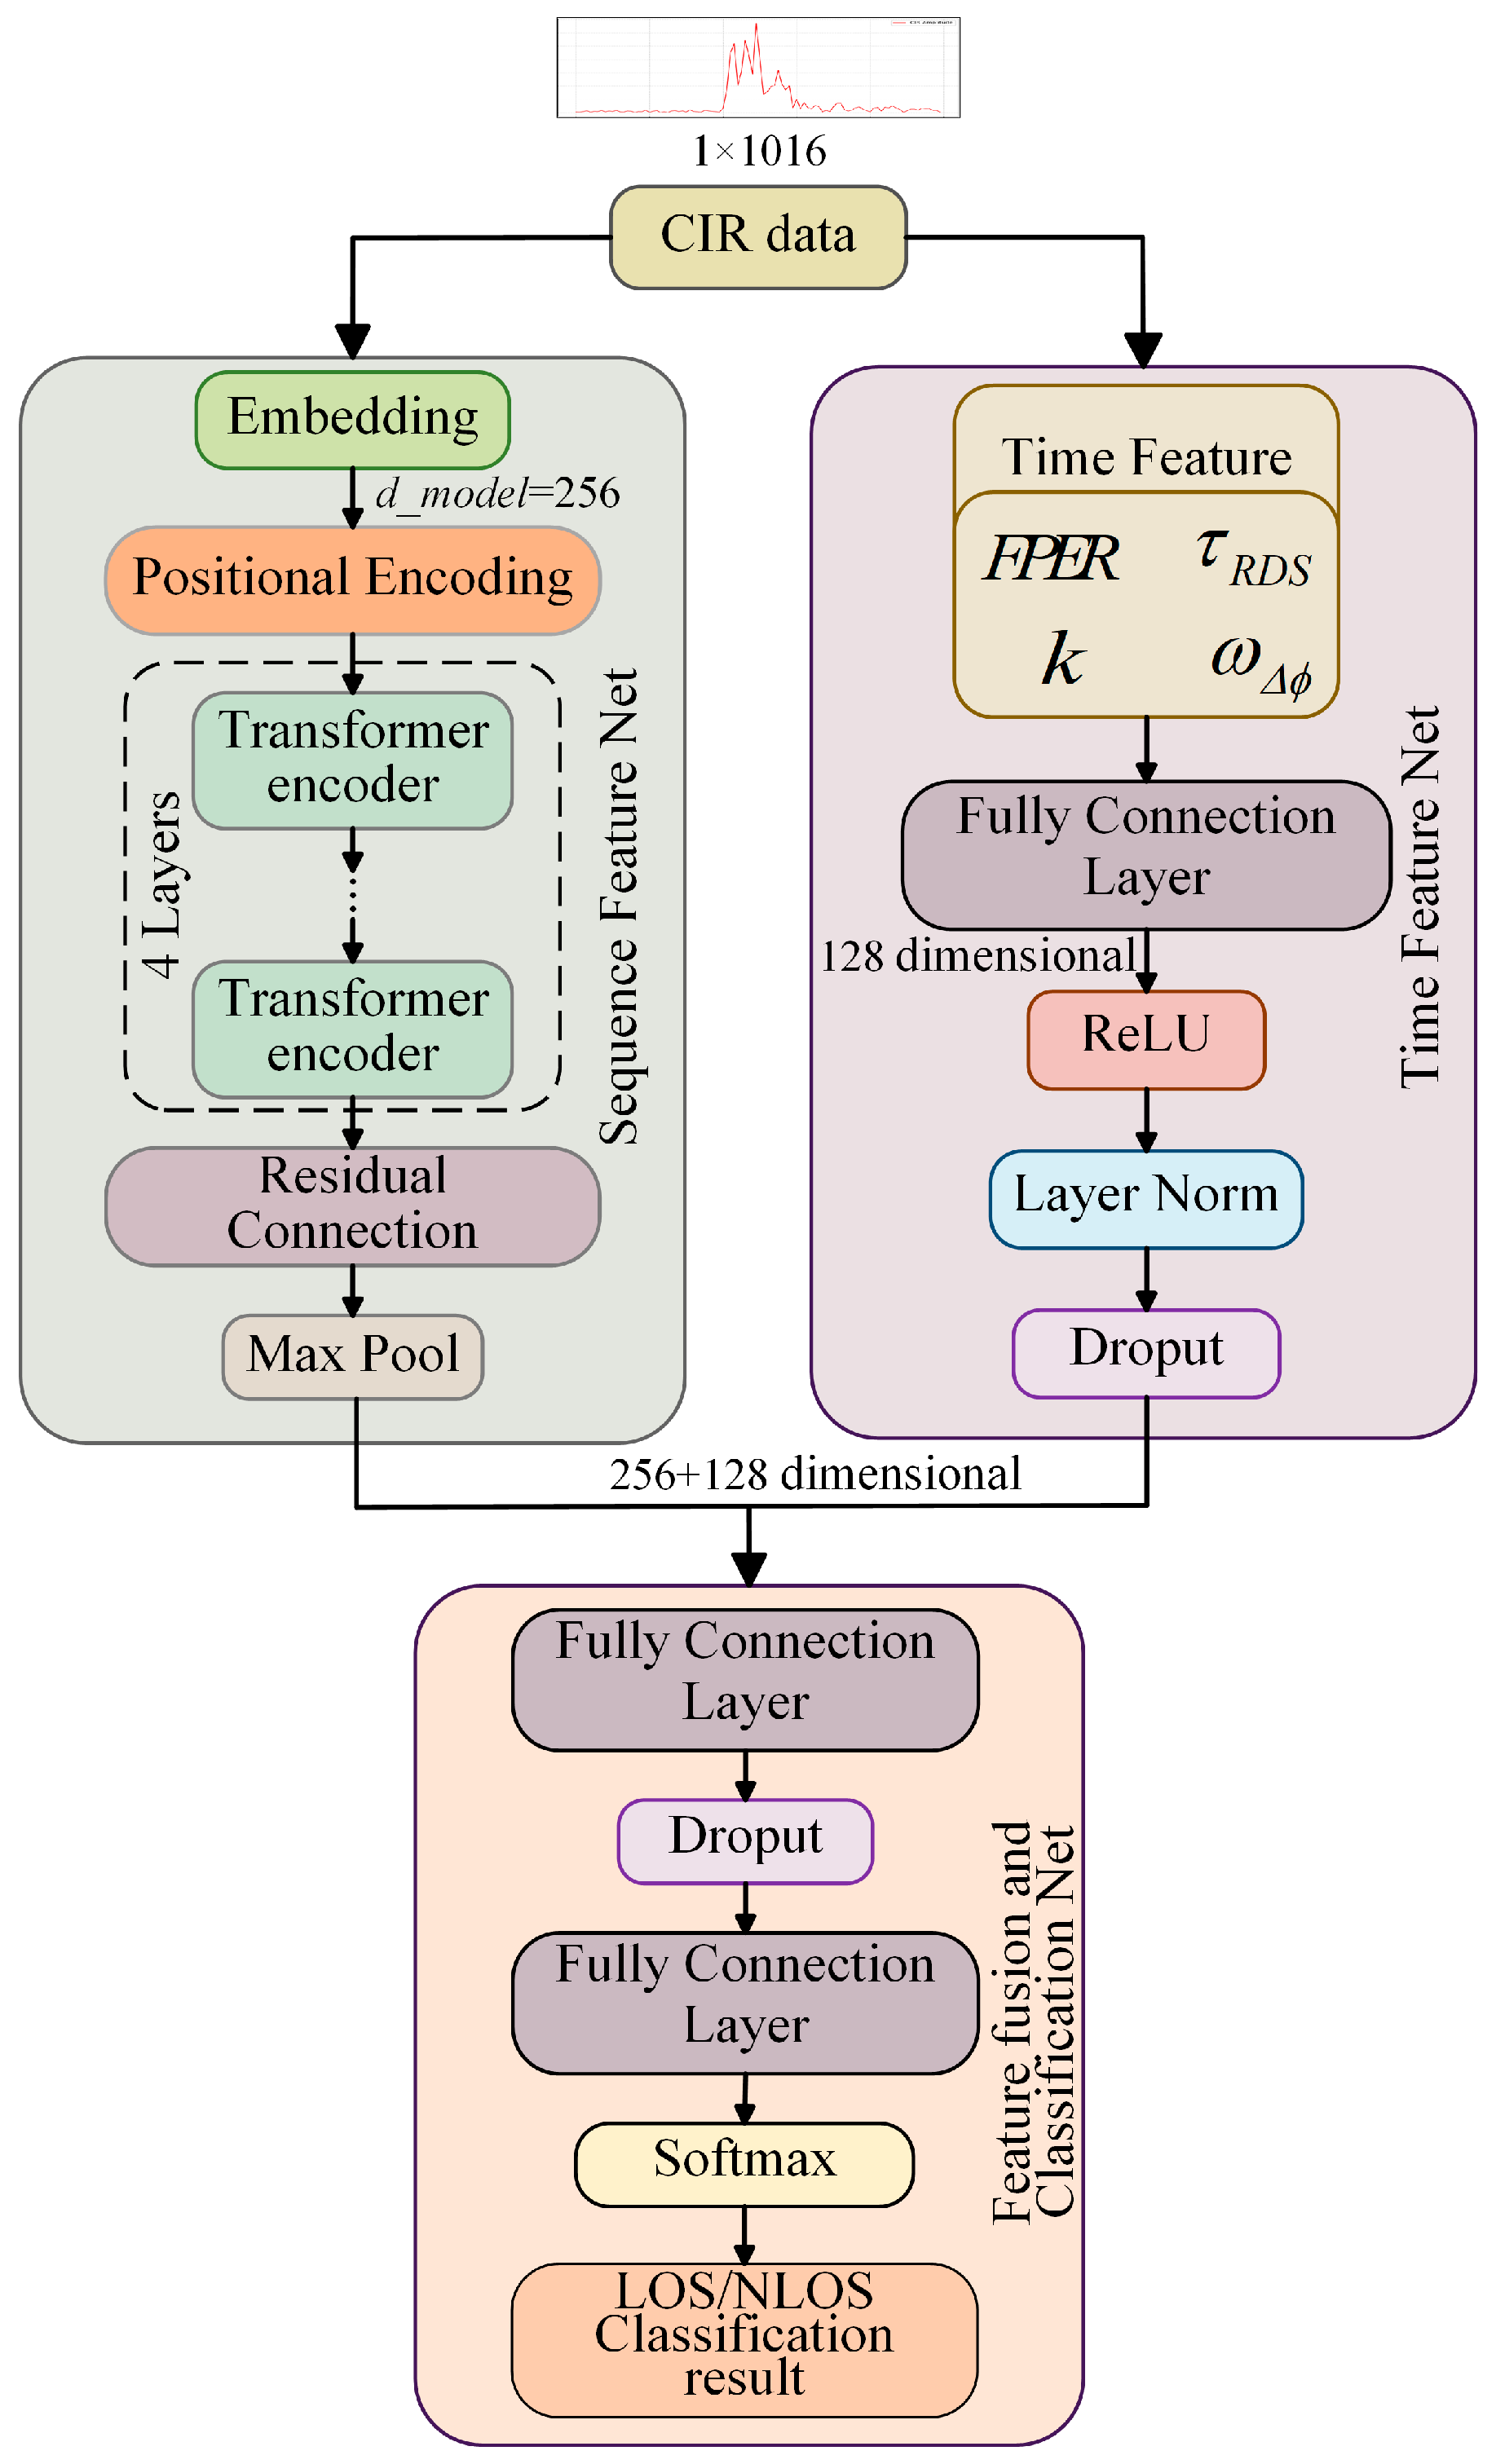
Figure 1. The overall structure of proposed DBFF-Transformer.
Information 16 01033 g001
Figure 2. The structure of the Transformer.
Information 16 01033 g002
Figure 3. The difference between (a) FPER, (b) RDS, (c) kurtosis and (d) phase difference in LOS and NLOS paths.
Information 16 01033 g003
Figure 4. The structure of the feature fusion and classification network.
Information 16 01033 g004
Figure 5. Floorplan of Environment A (a) and Environment B (b), where Environment A is an apartment and Environment B is an office.
Information 16 01033 g005
Figure 6. Ablation experimental results with different architecture configurations, including heads of attention, Transformer encoder, and remove time-domain feature.
Information 16 01033 g006
Figure 7. The confusion matrix for test results in Environment A. (a) CNN; (b) LSTM; (c) CNN-LSTM; (d) GRU; (e) FCN-Attention; (f) BERT; (g) DBFF-Transformer.
Information 16 01033 g007
Figure 8. The confusion matrix for test results for Environment B. (a) CNN; (b) LSTM; (c) CNN-LSTM; (d) GRU; (e) FCN-Attention; (f) BERT; (g) DBFF-Transformer.
Information 16 01033 g008
Figure 9. The confusion matrix for test results of verification. (a) CNN; (b) LSTM; (c) CNN-LSTM; (d) GRU; (e) FCN-Attention; (f) BERT; (g) DBFF-Transformer.
Information 16 01033 g009
Table 1. Training details and hyperparameter settings.
ComponentHyperparameterValue
Transformer d m o d e l 256
FFN dimension512
Dropout0.1
ActivationReLU
OptimizationOptimizerAdamW
Learning rate1 × 10−3
Initial cycle length10
Cycle doubling factor2
Weight decay0.01
Dropout0.1
Batch size31
Epoch200
Table 2. Ablation experiment with different structural configurations.
Structure ConfigurationNumber of Layers or HeadsAccuracy: Environment AAccuracy: Environment B
Heads of attention495.1%94.7%
895.9%95.3%
1693.4%94.6%
Transformer encoder194.3%94.6%
294.9%95.2%
495.9%95.6%
692.9%93.2%
Remove feature fusion8 + 491.9%91.9%
Table 3. The NLOS identification classification results for Environment A.
AlgorithmACCF1 ScoreRecallAUC-ROCT-Test (ACC)
CNN89.6% ± 0.14%92.8% ± 0.18%90.5% ± 0.20%95.1% ± 0.11%−41.9
LSTM85.6% ± 0.22%89.4% ± 0.24%82.3% ± 0.19%95.0% ± 0.15%−67.9
CNN-LSTM90.6% ± 0.17%93.6% ± 0.21%93.2% ± 0.23%96.2% ± 0.19%−30.2
GRU92.7% ± 0.20%94.9% ± 0.16%91.6% ± 0.18%97.7% ± 0.16%−19.2
FCN-Attention92.0% ± 0.19%94.6% ± 0.13%94.6% ± 0.12%97.3% ± 0.13%−22.8
BERT91.8% ± 0.12%94.4% ± 0.15%94.5% ± 0.22%97.5% ± 0.10%−29.6
DBFF-Transformer95.9% ± 0.12%97.2% ± 0.16%97.4% ± 0.15%99.1% ± 0.07%
Bold text indicates the optimal result. The same applies to the following table.
Table 4. The NLOS identification classification results for Environment B.
AlgorithmACCF1 ScoreRecallAUC-ROCT-Test (ACC)
CNN89.7% ± 0.14%92.8% ± 0.17%88.2% ± 0.23%97.5% ± 0.14%−82.3
LSTM89.5% ± 0.16%92.7% ± 0.21%88.5% ± 0.19%97.0% ± 0.16%−61.5
CNN-LSTM92.9% ± 0.20%95.2% ± 0.19%94.0% ± 0.21%97.7% ± 0.17%−21.9
GRU93.6% ± 0.16%95.7% ± 0.15%94.1% ± 0.19%98.2% ± 0.14%−22.2
FCN-Attention94.6% ± 0.17%96.3% ± 0.16%95.0% ± 0.14%98.7% ± 0.11%−12.6
BERT93.0% ± 0.12%95.3% ± 0.14%94.1% ± 0.13%98.1% ± 0.09%−33.1
DBFF-Transformer95.7% ± 0.13%97.1% ± 0.10%96.4% ± 0.18%99.0% ± 0.06%
Table 5. The verification results of the NLOS identification classification.
AlgorithmACCF1 ScoreRecallAUC-ROCT-Test (ACC)
CNN86.2% ± 0.23%85.6% ± 0.20%88.1% ± 0.18%90.4% ± 0.11%−25.33
LSTM82.4% ± 0.17%80.4% ± 0.21%90.9% ± 0.16%89.3% ± 0.14%−80.8
CNN-LSTM85.3% ± 0.20%85.0% ± 0.19%86.8% ± 0.22%91.1% ± 0.17%−68.4
GRU90.1% ± 0.18%89.9% ± 0.22%91.2% ± 0.21%92.9% ± 0.15%−20.0
FCN-Attention88.3% ± 0.20%88.0% ± 0.17%90.2% ± 0.19%92.3% ± 0.15%−30.9
BERT90.4% ± 0.13%90.3% ± 0.15%91.7% ± 0.16%93.6% ± 0.11%−15.2
DBFF-Transformer91.6% ± 0.15%91.5% ± 0.18%92.9% ± 0.14%94.5% ± 0.12%
Disclaimer/Publisher’s Note: The statements, opinions and data contained in all publications are solely those of the individual author(s) and contributor(s) and not of MDPI and/or the editor(s). MDPI and/or the editor(s) disclaim responsibility for any injury to people or property resulting from any ideas, methods, instructions or products referred to in the content.