Neural Network-Based Optimization of Repair Rate Estimation in Performance-Based Logistics Systems
Abstract
1. Introduction
- An NN-based framework for repair rate estimation within PBL systems, trained on samples generated from a stochastic model.
- A detailed comparative analysis of FCNN and LSTM architectures across different dataset sizes and training configurations.
- Evidence that the proposed approach provides high predictive accuracy and scalability while significantly reducing computational cost.
- A discussion on the practical implications and potential integration of the proposed framework into real-time predictive maintenance systems.
2. System Model
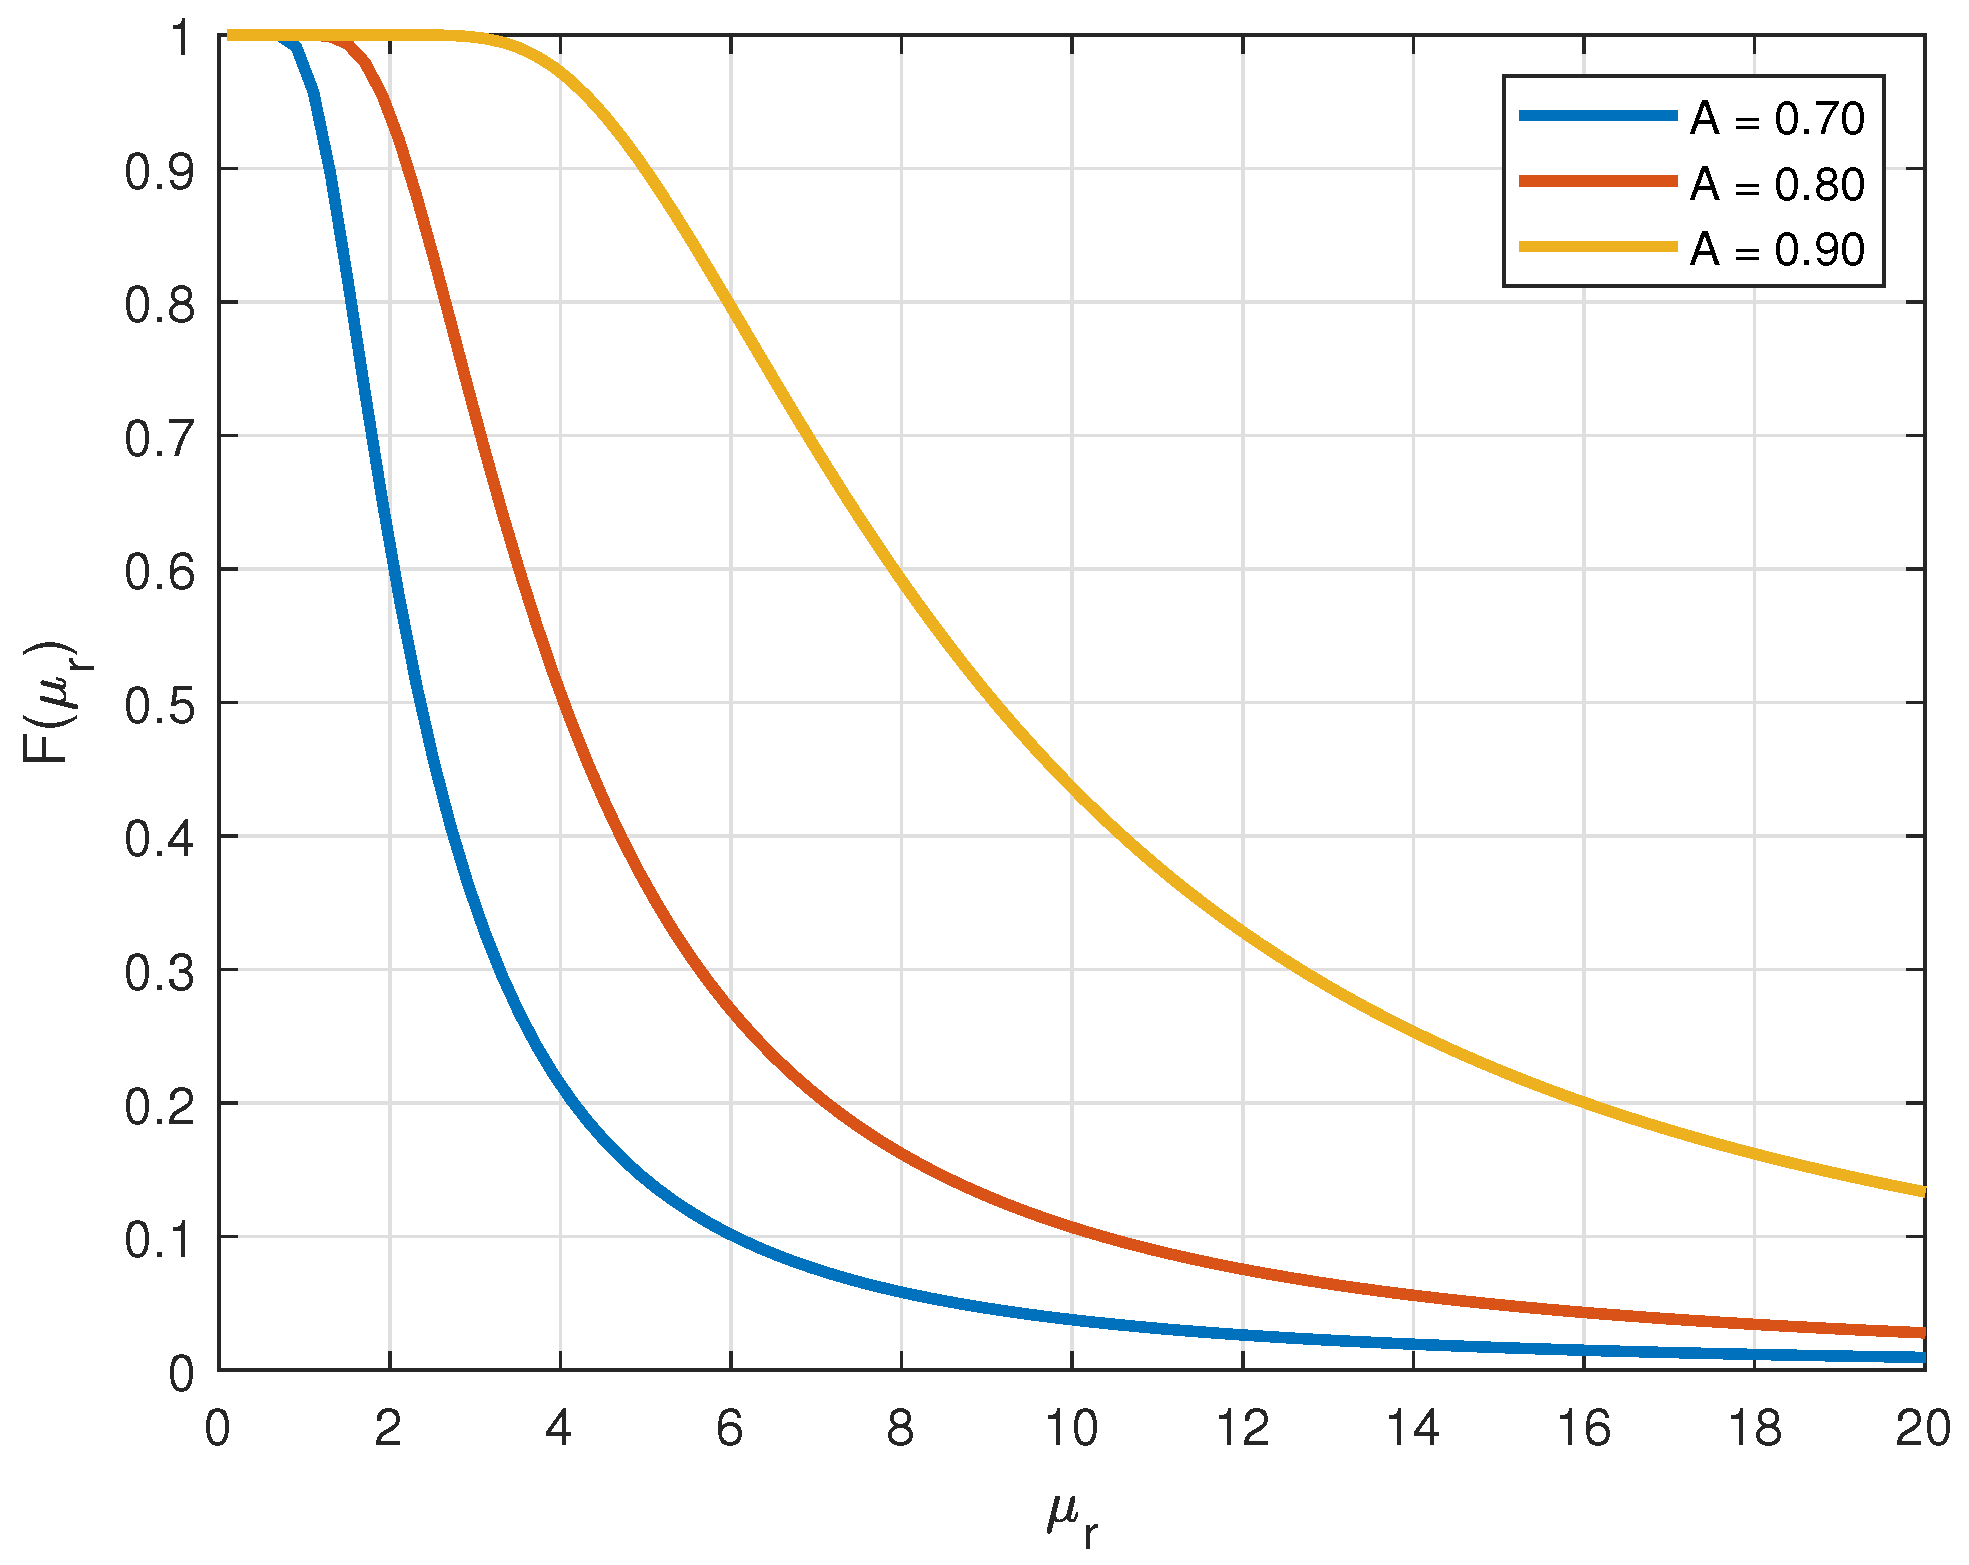
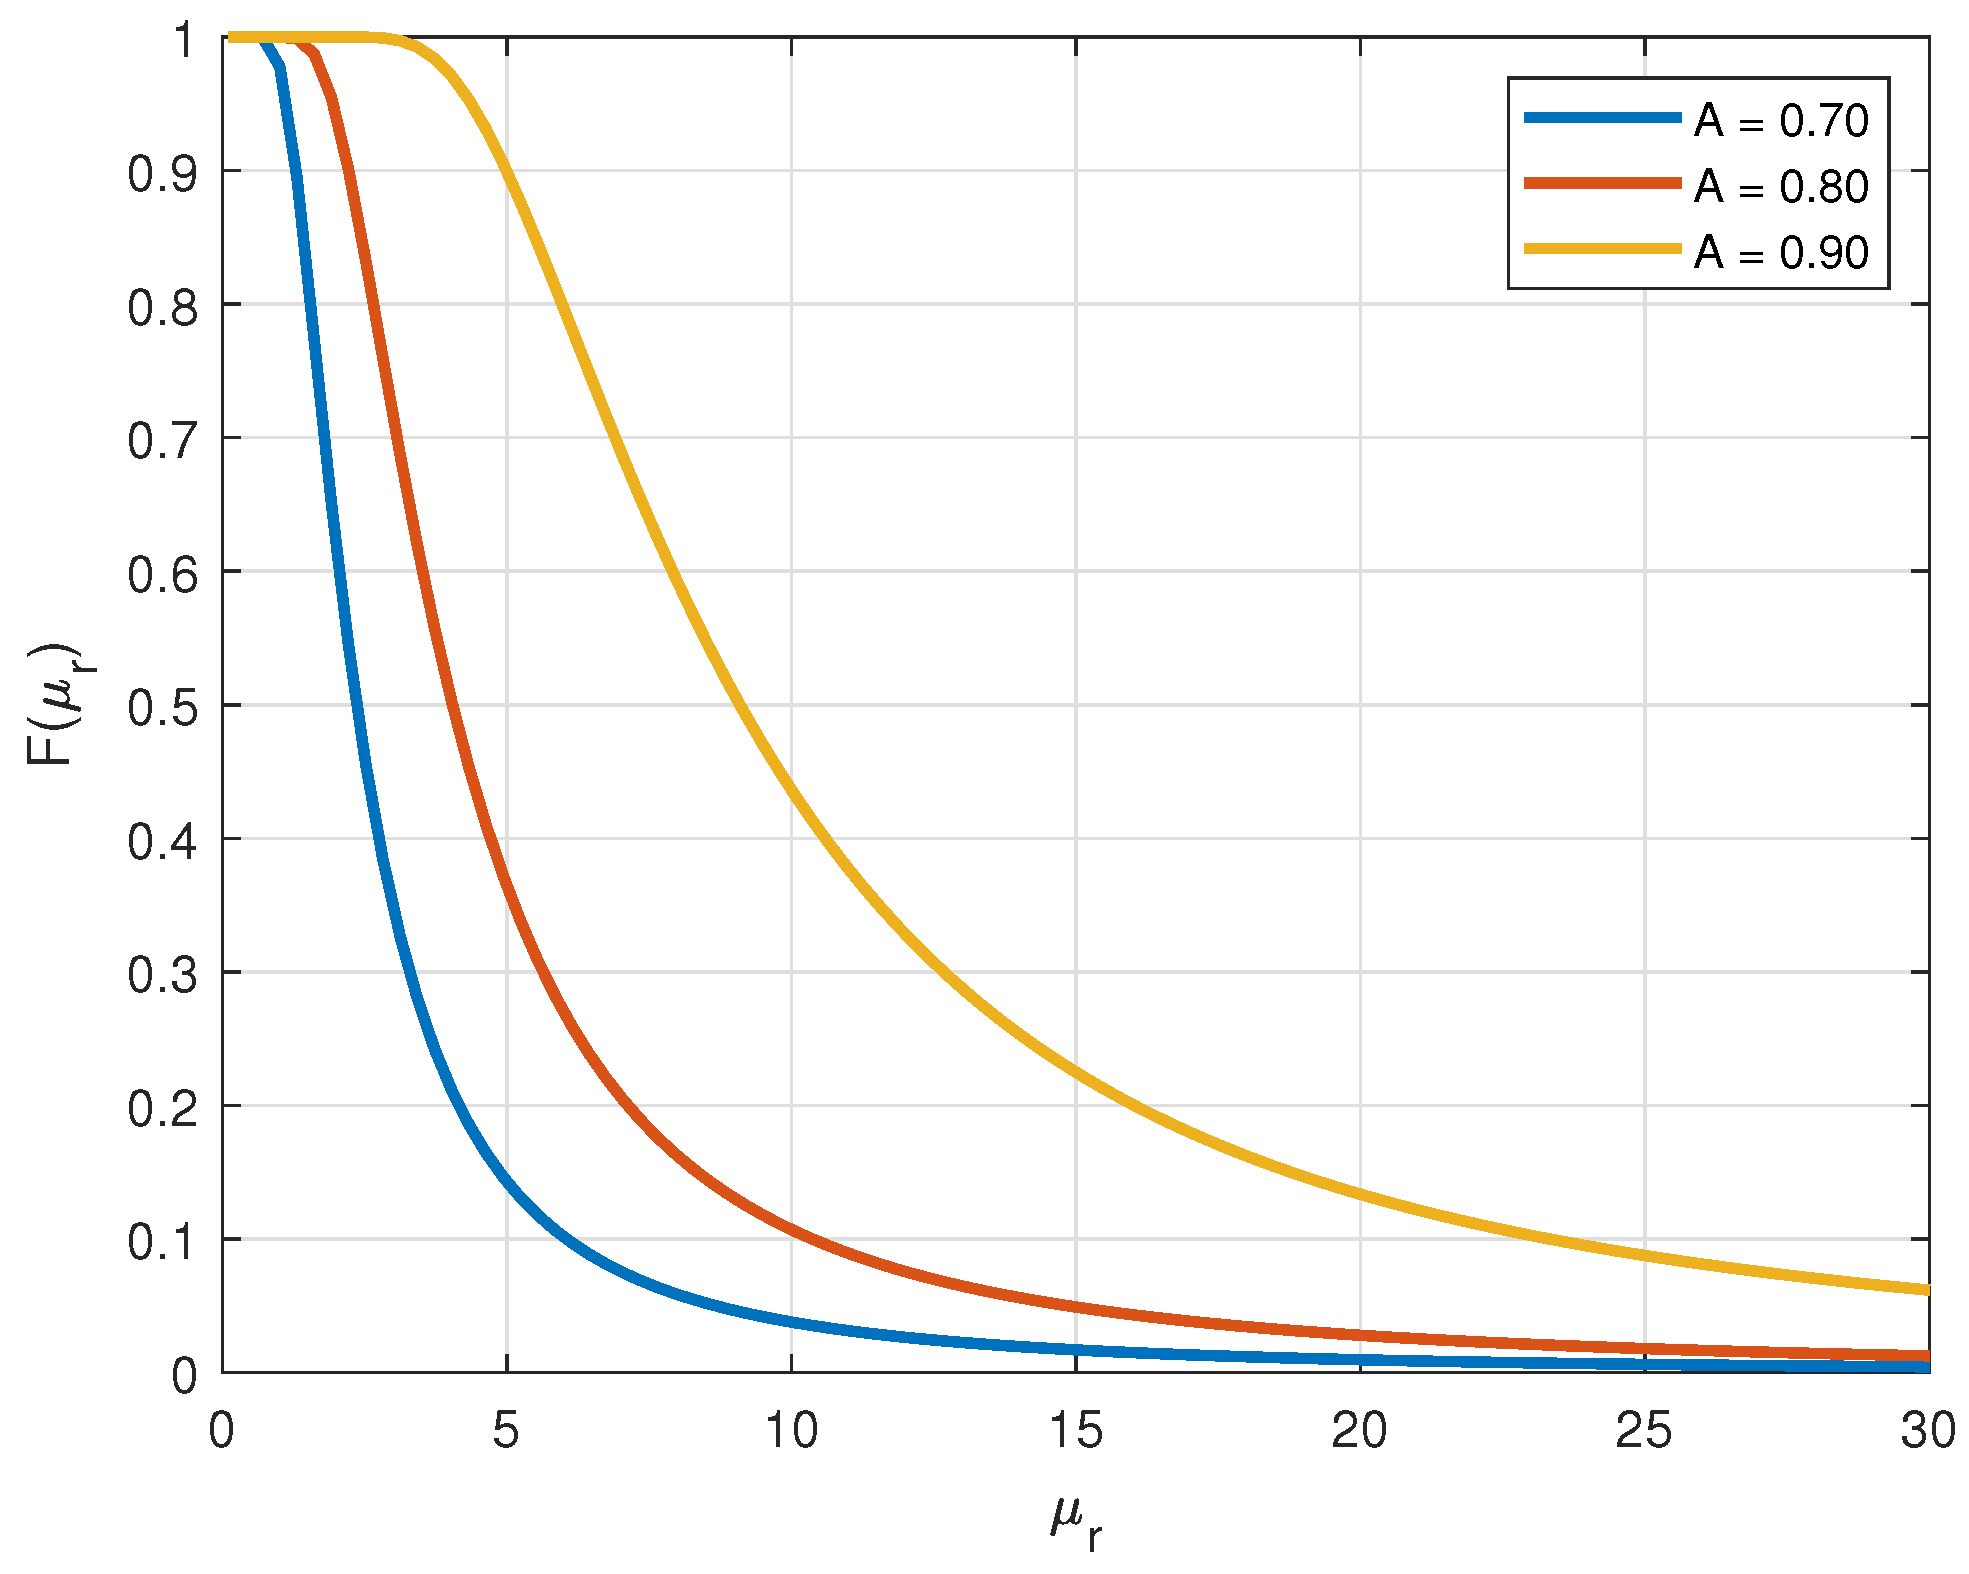
2.1. Overview of the Used Stochastic Model
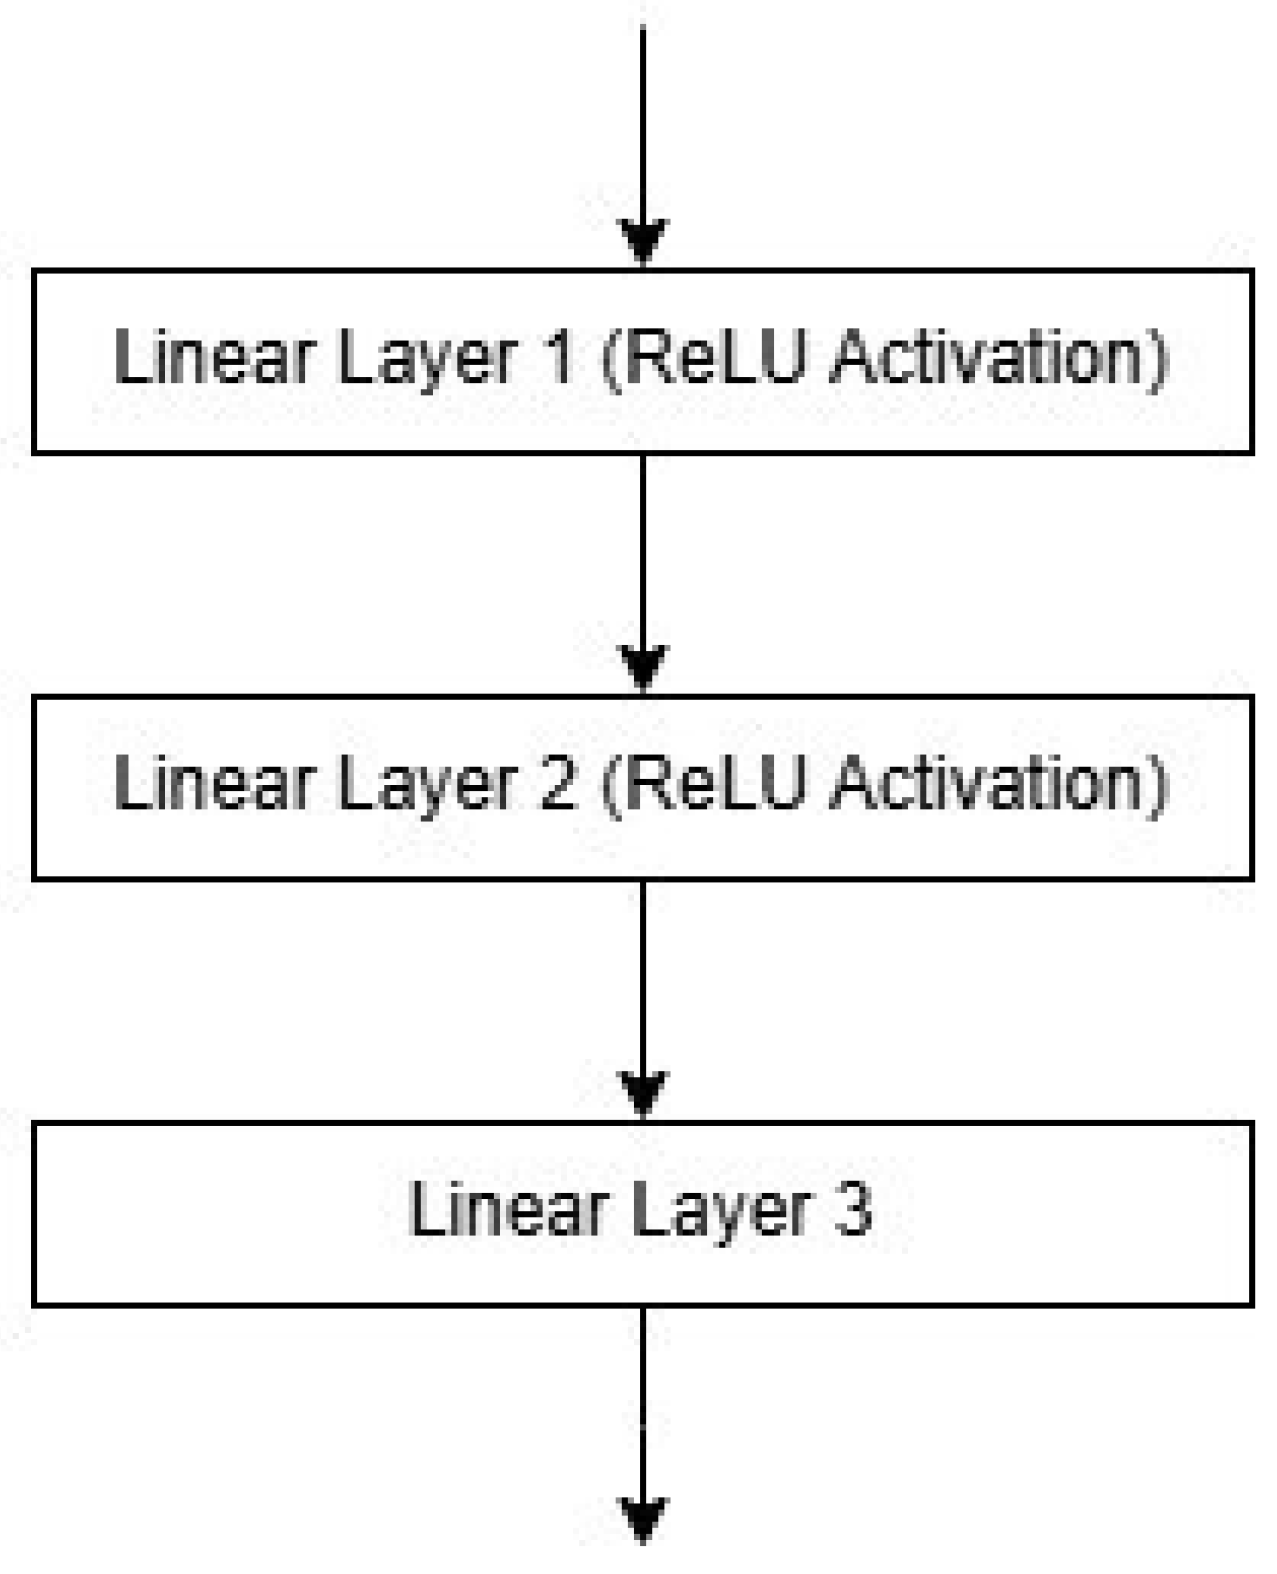
2.2. Neural Network Architecture
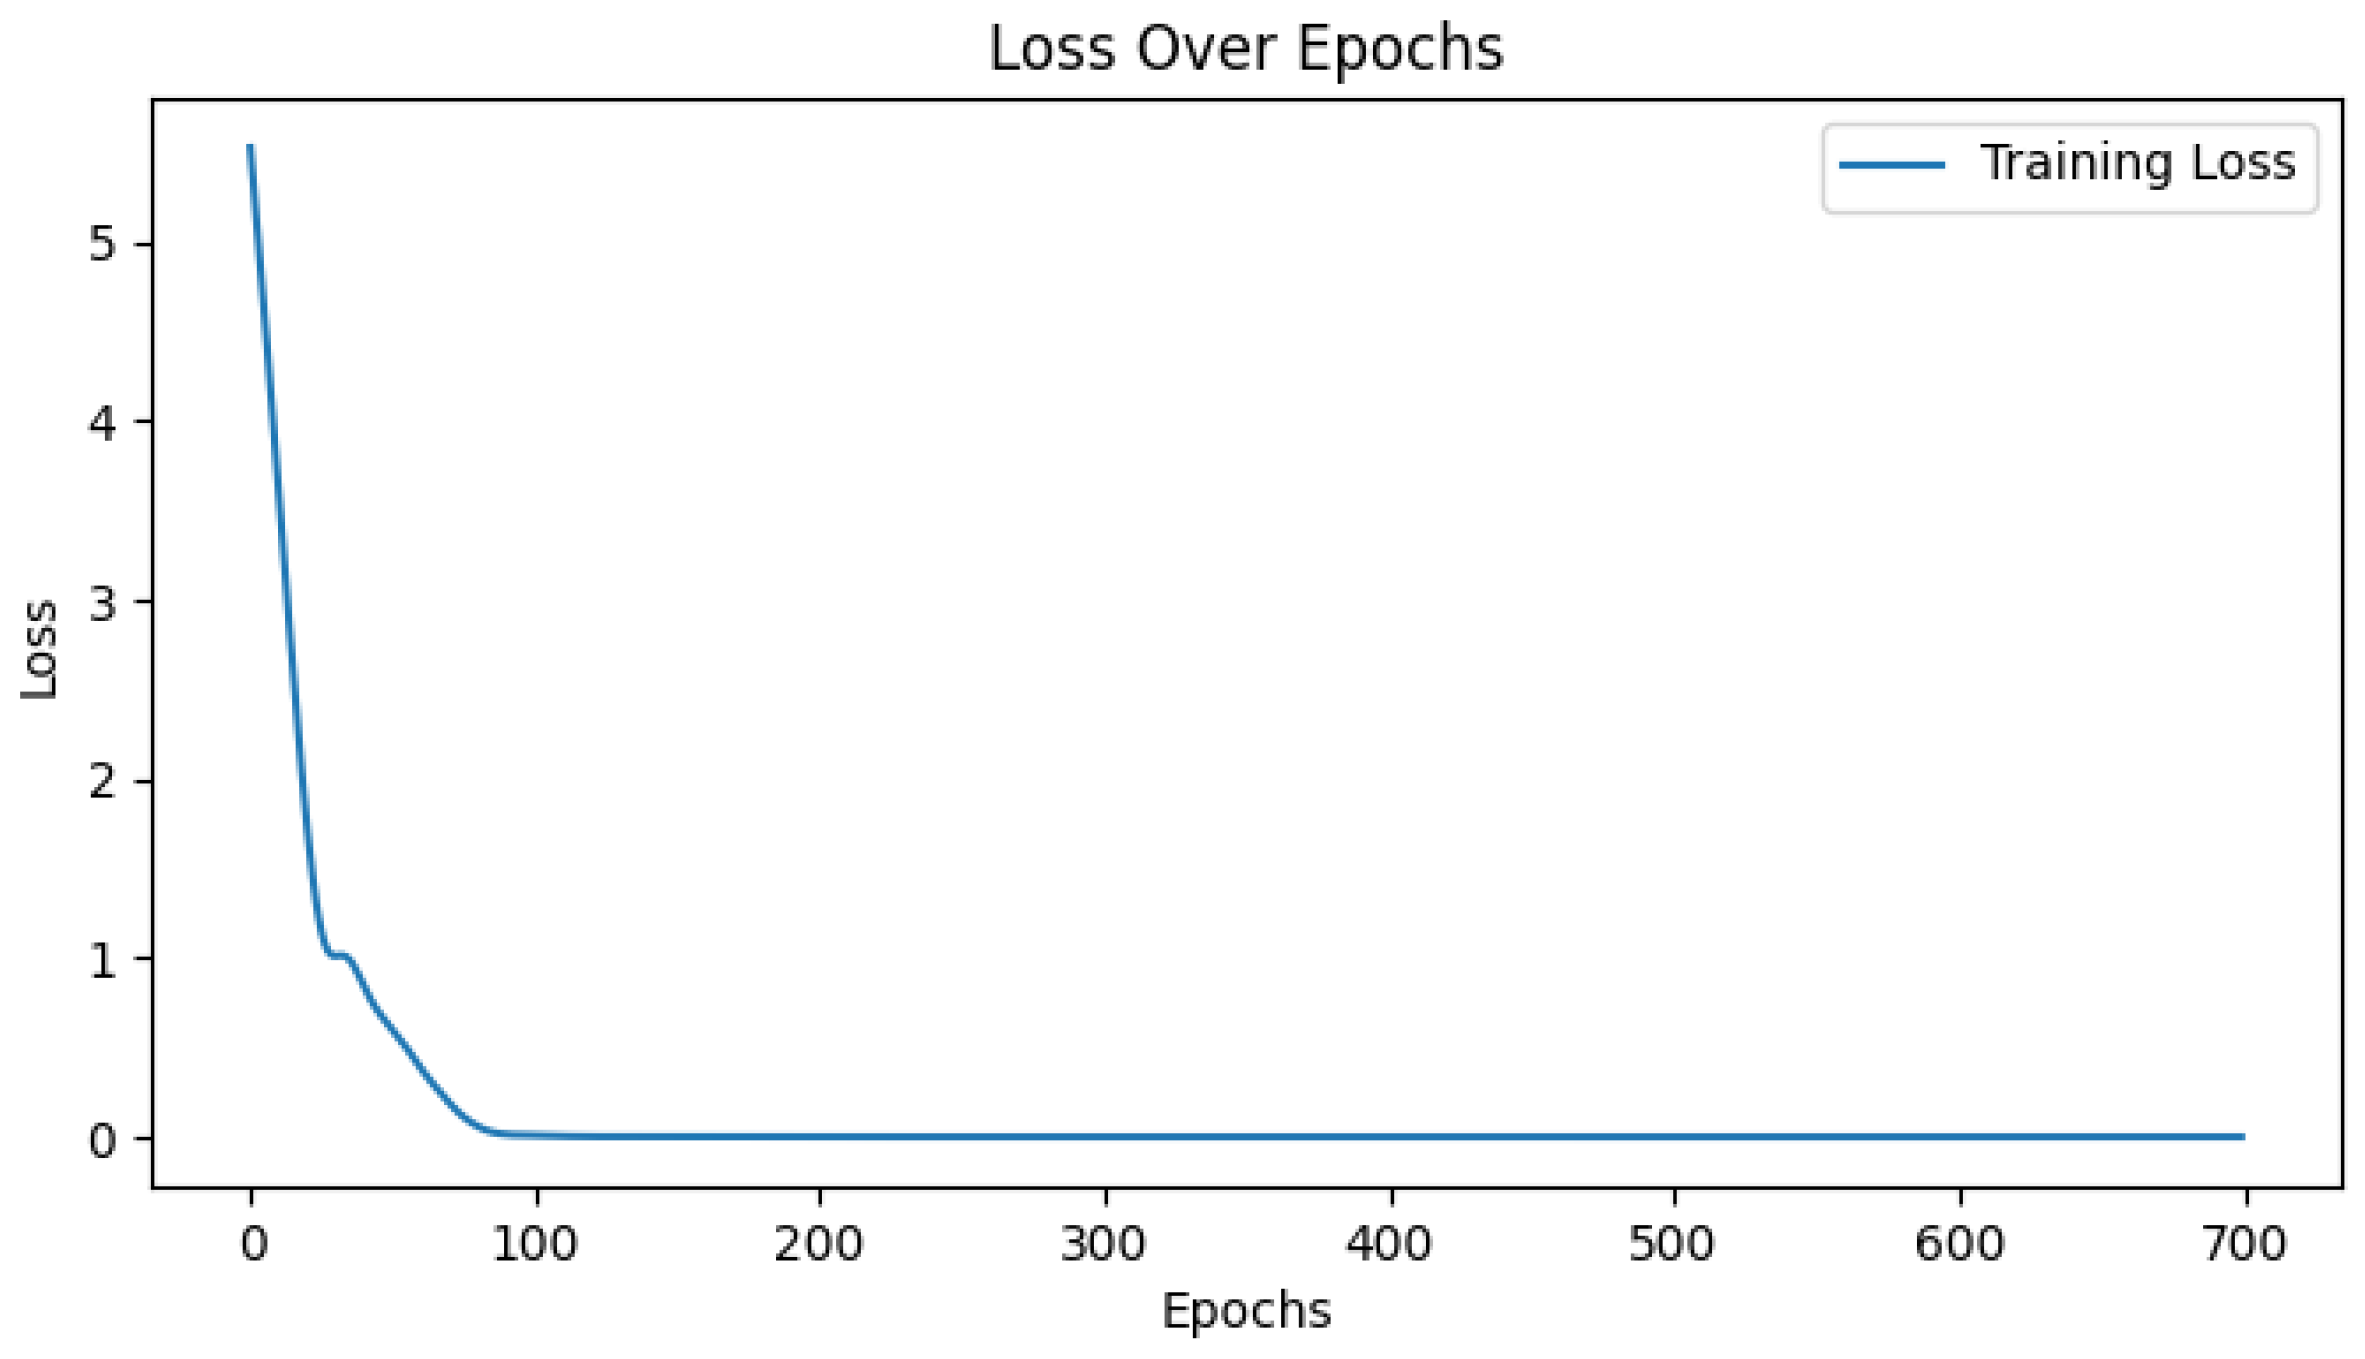
3. Results and Discussion
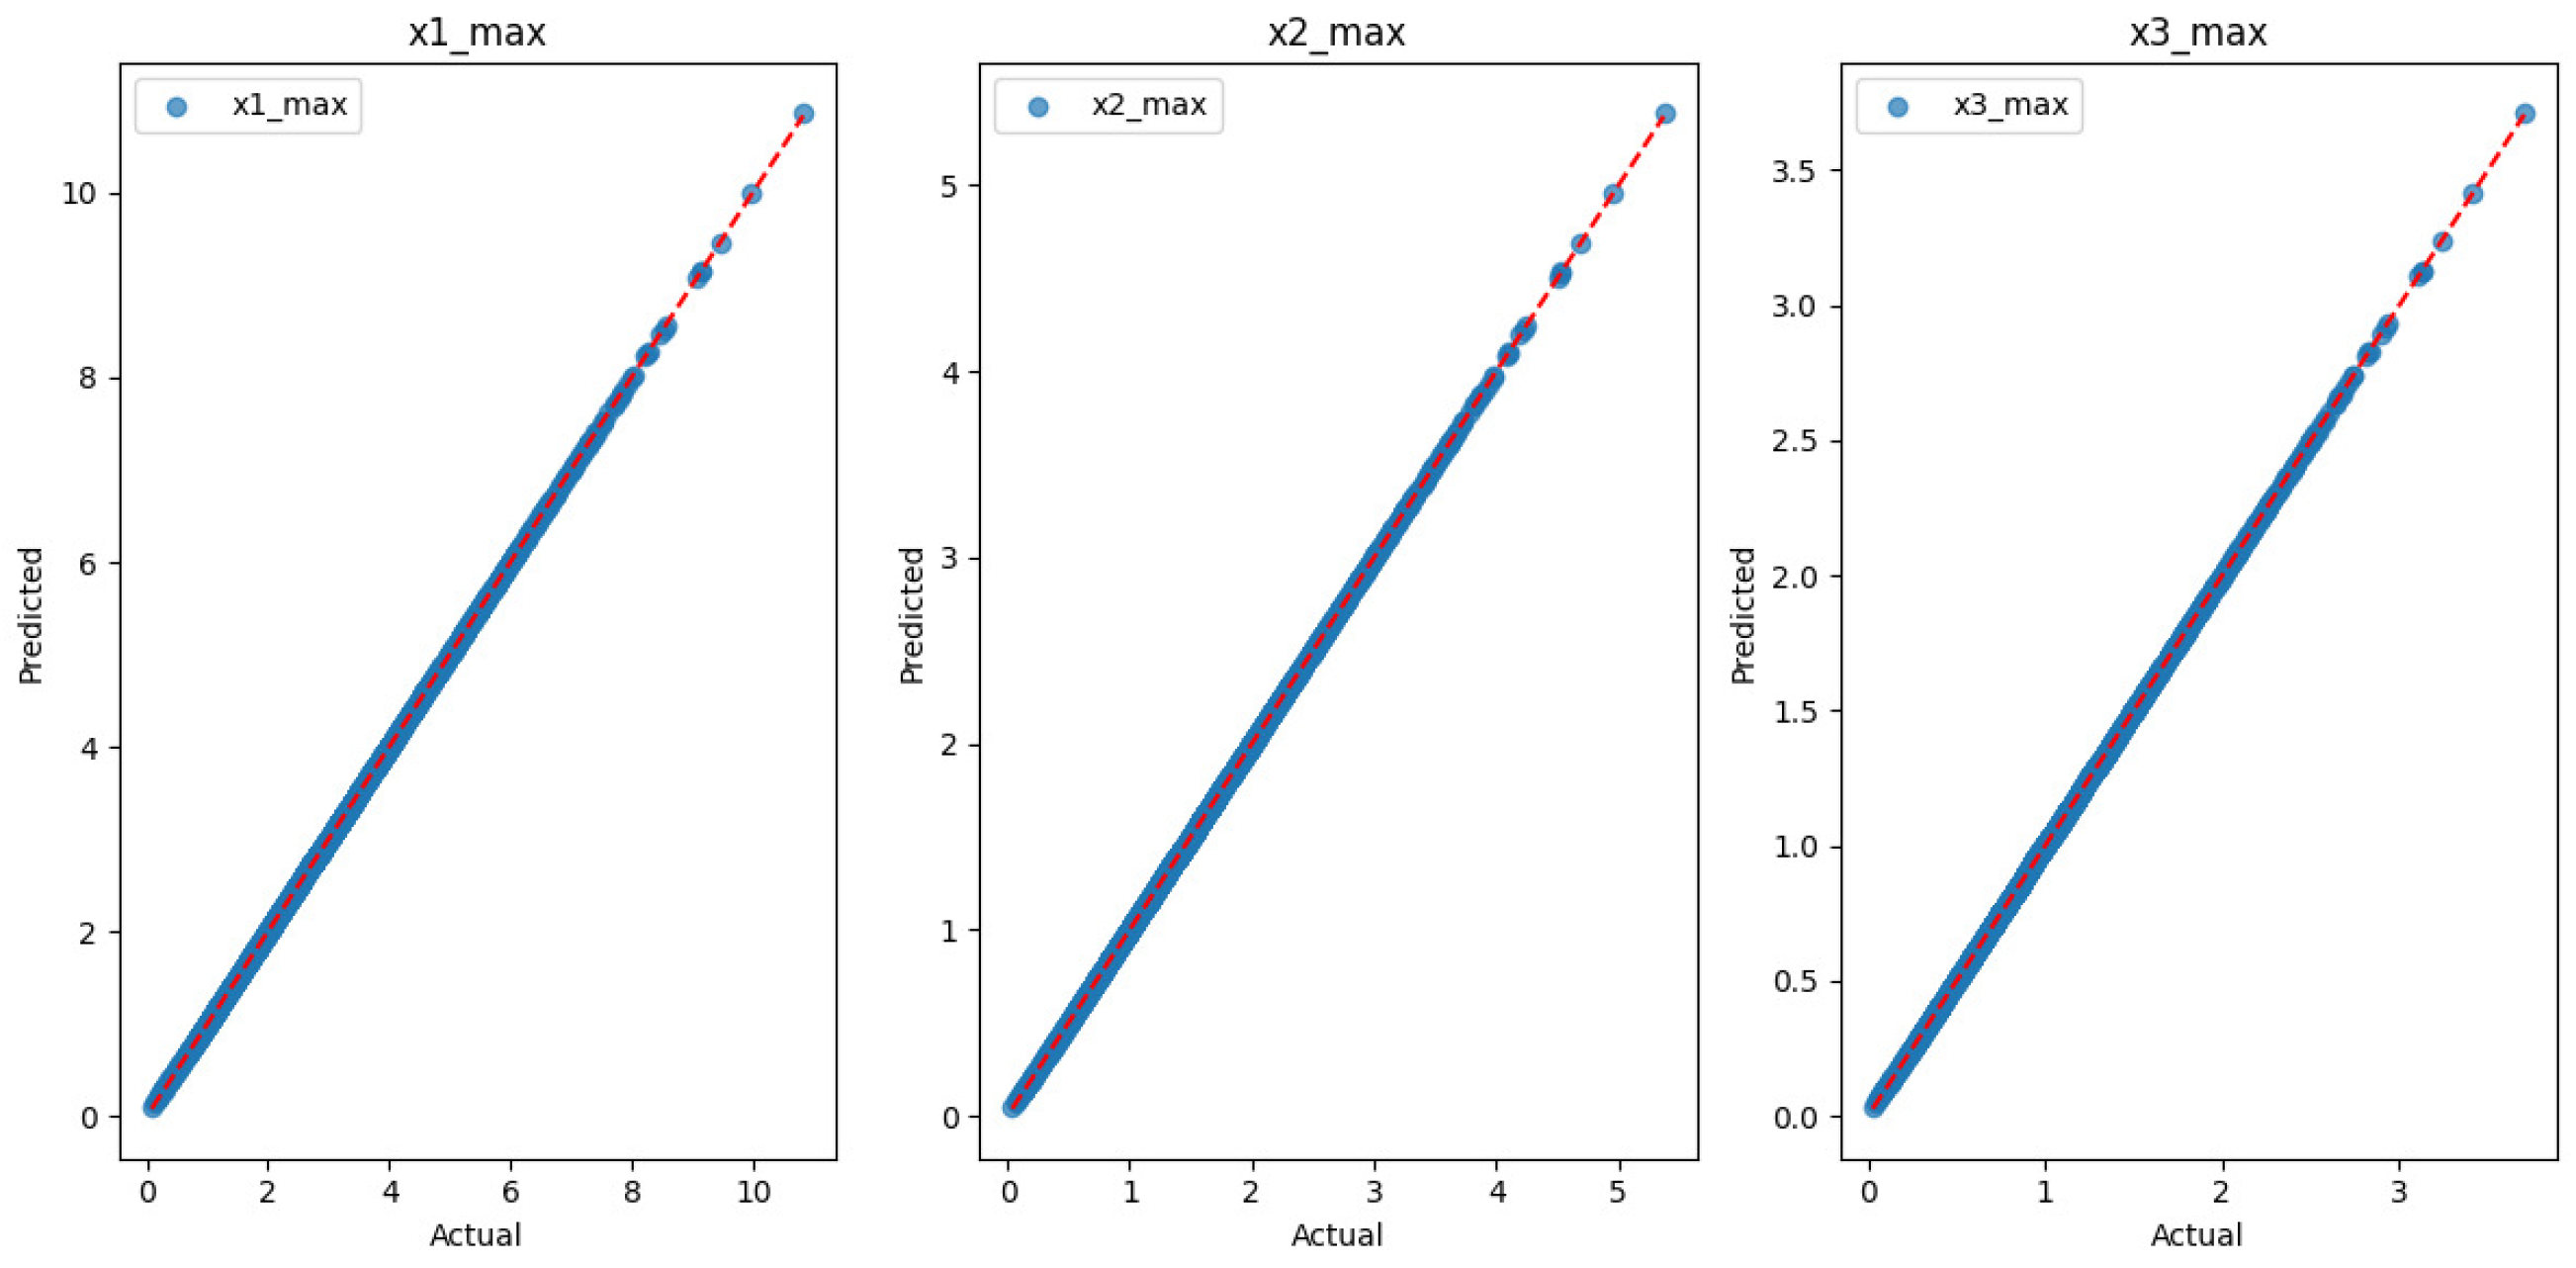
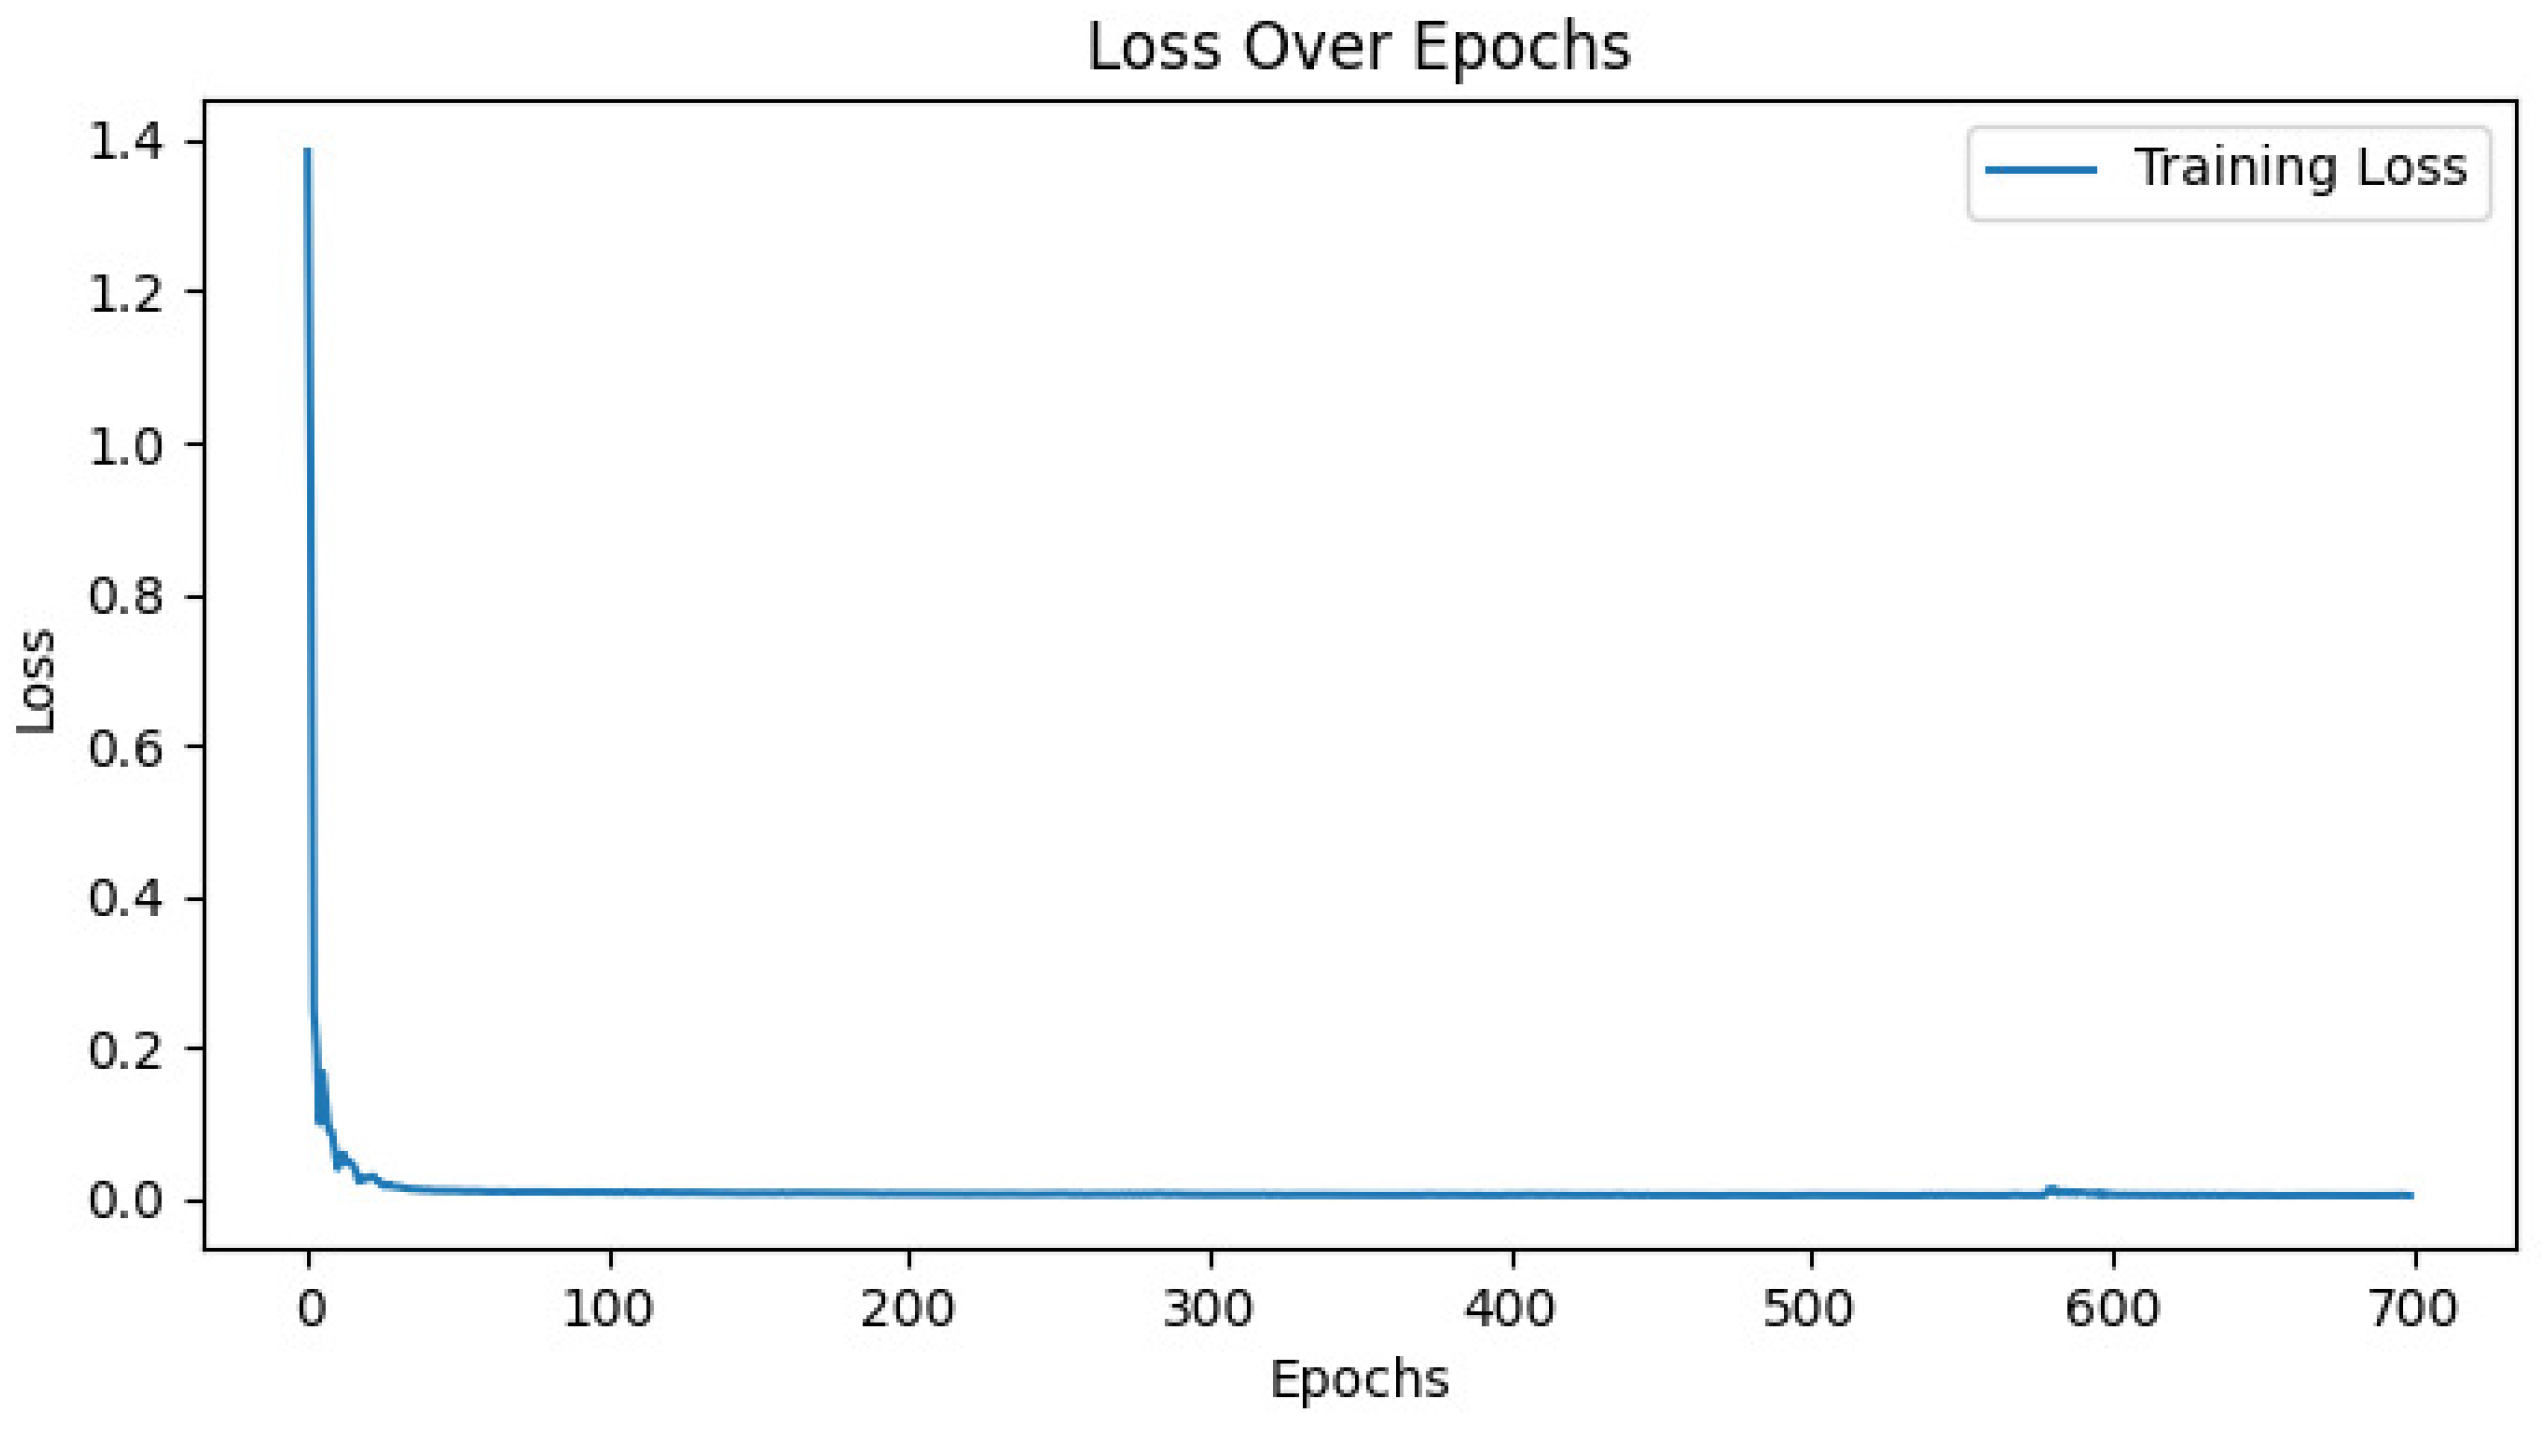
- Learning rates of 0.01 and 0.001 yielded excellent results, with MSE values close to zero and R-squared = 1.0000, indicating near perfect model accuracy.
- A learning rate of 0.0001 significantly degraded performance, leading to higher MSE, MAE, and RMSE values, along with reduced R-squared scores. This suggests that the learning rate was too small, preventing the model from converging efficiently.
- Networks with 128 and 256 neurons achieved the best results, particularly at lr = 0.01 and lr = 0.001, where the error metrics were minimal and R-squared remained at 1.0000.
- Networks trained without batch normalization and with L2 regularization (weight decay) consistently achieved the best performance, maintaining low MSE, MAE, and RMSE values, while preserving an R-squared value close to 1.0000. Batch normalization did not improve accuracy on larger datasets and, in some cases, led to slightly worse generalization performance. This suggests that for this specific problem, batch normalization does not provide a significant advantage and may even introduce unnecessary variance.
- Increasing the dataset size improved model stability, reducing variability in performance across different training runs. This confirms that the selected model configuration scales effectively and maintains robustness even with significantly larger datasets.
4. Conclusions and Future Work
Author Contributions
Funding
Institutional Review Board Statement
Informed Consent Statement
Data Availability Statement
Conflicts of Interest
References
- Kontrec, N.; Panić, S.; Petrović, M.; Milošević, H. A Stochastic Model for Estimation of Repair Rate for System Operating under Performance-Based Logistics. Ekspl. Niezawodn.—Maint. Reliab. 2018, 20, 68. [Google Scholar] [CrossRef]
- Milković, V.; Osman, K.; Jankovich, D. Reliability-Based Model for Optimizing Resources in the Railway Vehicles Maintenance. Mech. Eng. J. 2024, 11, 24–00070. [Google Scholar] [CrossRef]
- Numsong, A.; Posom, J.; Chuan-Udom, S. Artificial Neural Network-Based Repair and Maintenance Cost Estimation Model for Rice Combine Harvesters. Int. J. Agric. Eng. Technol. 2023, 16, 38–47. [Google Scholar] [CrossRef]
- Ouadah, A.; Zemmouchi-Ghomari, L.; Salhi, N. Selecting an Appropriate Supervised Machine Learning Algorithm for Predictive Maintenance. Int. J. Adv. Manuf. Technol. 2022, 119, 4277. [Google Scholar] [CrossRef]
- Dhada, M.; Parlikad, A.K.; Steinert, O.; Lindgren, T. Weibull Recurrent Neural Networks for Failure Prognosis Using Histogram Data. Neural Comput. Appl. 2022, 35, 3011. [Google Scholar] [CrossRef]
- Kontrec, N.; Panić, S.; Panić, B.; Marković, A.; Stošović, D. Mathematical Approach for System Repair Rate Analysis Used in Maintenance Decision Making. Axioms 2021, 10, 96. [Google Scholar] [CrossRef]
- Sharma, J.; Mittal, M.L.; Soni, G. Condition-Based Maintenance Using Machine Learning and the Role of Interpretability: A Review. Int. J. Syst. Assur. Eng. Manag. 2024, 15, 1345. [Google Scholar] [CrossRef]
- Zhai, S.; Kandemir, M.G.; Reinhart, G. Predictive Maintenance Integrated Production Scheduling by Applying Deep Generative Prognostics Models: Approach, Formulation and Solution. Prod. Eng. 2022, 16, 65. [Google Scholar] [CrossRef]
- Jahangard, M.; Xie, Y.; Feng, Y. Leveraging Machine Learning and Optimization Models for Enhanced Seaport Efficiency. Marit. Econ. Logist. 2025, 1–42. [Google Scholar] [CrossRef]
- Gu, X.; Han, J.; Shen, Q.; Angelov, P.P. Autonomous Learning for Fuzzy Systems: A Review. Artif. Intell. Rev. 2023, 56, 7549–7595. [Google Scholar] [CrossRef]
- Pagano, D. A Predictive Maintenance Model Using Long Short-Term Memory Neural Networks and Bayesian Inference. Decis. Anal. J. 2023, 6, 100174. [Google Scholar] [CrossRef]
- Li, Z.; He, Q.; Li, J. A Survey of Deep Learning-Driven Architecture for Predictive Maintenance. Eng. Appl. Artif. Intell. 2024, 133, 108285. [Google Scholar] [CrossRef]
- Benhanifia, A.; Ben Cheikh, Z.; Oliveira, P.M.; Valente, A.; Lima, J. Systematic Review of Predictive Maintenance Practices in the Manufacturing Sector. Intell. Syst. Appl. 2025, 26, 200501. [Google Scholar] [CrossRef]
- Kim, J.-M.; Yum, S.-G.; Das Adhikari, M.; Bae, J. A LSTM Algorithm-Driven Deep Learning Approach to Estimating Repair and Maintenance Costs of Apartment Buildings. Eng. Constr. Archit. Manag. 2024, 31, 369–389. [Google Scholar] [CrossRef]
- Aminzadeh, A.; Sattarpanah Karganroudi, S.; Majidi, S.; Dabompre, C.; Azaiez, K.; Mitride, C.; Sénéchal, E. A machine learning implementation to predictive maintenance and monitoring of industrial compressors. Sensors 2025, 25, 1006. [Google Scholar] [CrossRef] [PubMed]
- Li, W.; Li, T. Comparison of Deep Learning Models for Predictive Maintenance in Industrial Manufacturing Systems Using Sensor Data. Sci. Rep. 2025, 15, 23545. [Google Scholar] [CrossRef] [PubMed]
- Kontrec, N.; Panić, S.; Panić, B. Availability-Based Maintenance Analysis for Systems with Repair Time Threshold. Yugosl. J. Oper. Res. 2025, 35, 585–593. [Google Scholar] [CrossRef]
- Goodfellow, I.; Bengio, Y.; Courville, A. Deep Learning; MIT Press: Cambridge, MA, USA, 2016. [Google Scholar]
- Ioffe, S.; Szegedy, C. Batch Normalization: Accelerating Deep Network Training by Reducing Internal Covariate Shift. In Proceedings of the 32nd International Conference on Machine Learning (ICML), Lille, France, 7–9 July 2015; Volume 37, pp. 448–456. [Google Scholar]
- Kingma, D.P.; Ba, J. Adam: A Method for Stochastic Optimization. In Proceedings of the 3rd International Conference on Learning Representations (ICLR), San Diego, CA, USA, 7–9 May 2015. [Google Scholar]
- Pedregosa, F.; Varoquaux, G.; Gramfort, A.; Michel, V.; Thirion, B.; Grisel, O.; Blondel, M.; Prettenhofer, P.; Weiss, R.; Dubourg, V.; et al. Scikit-Learn: Machine Learning in Python. J. Mach. Learn. Res. 2011, 12, 2825. [Google Scholar]
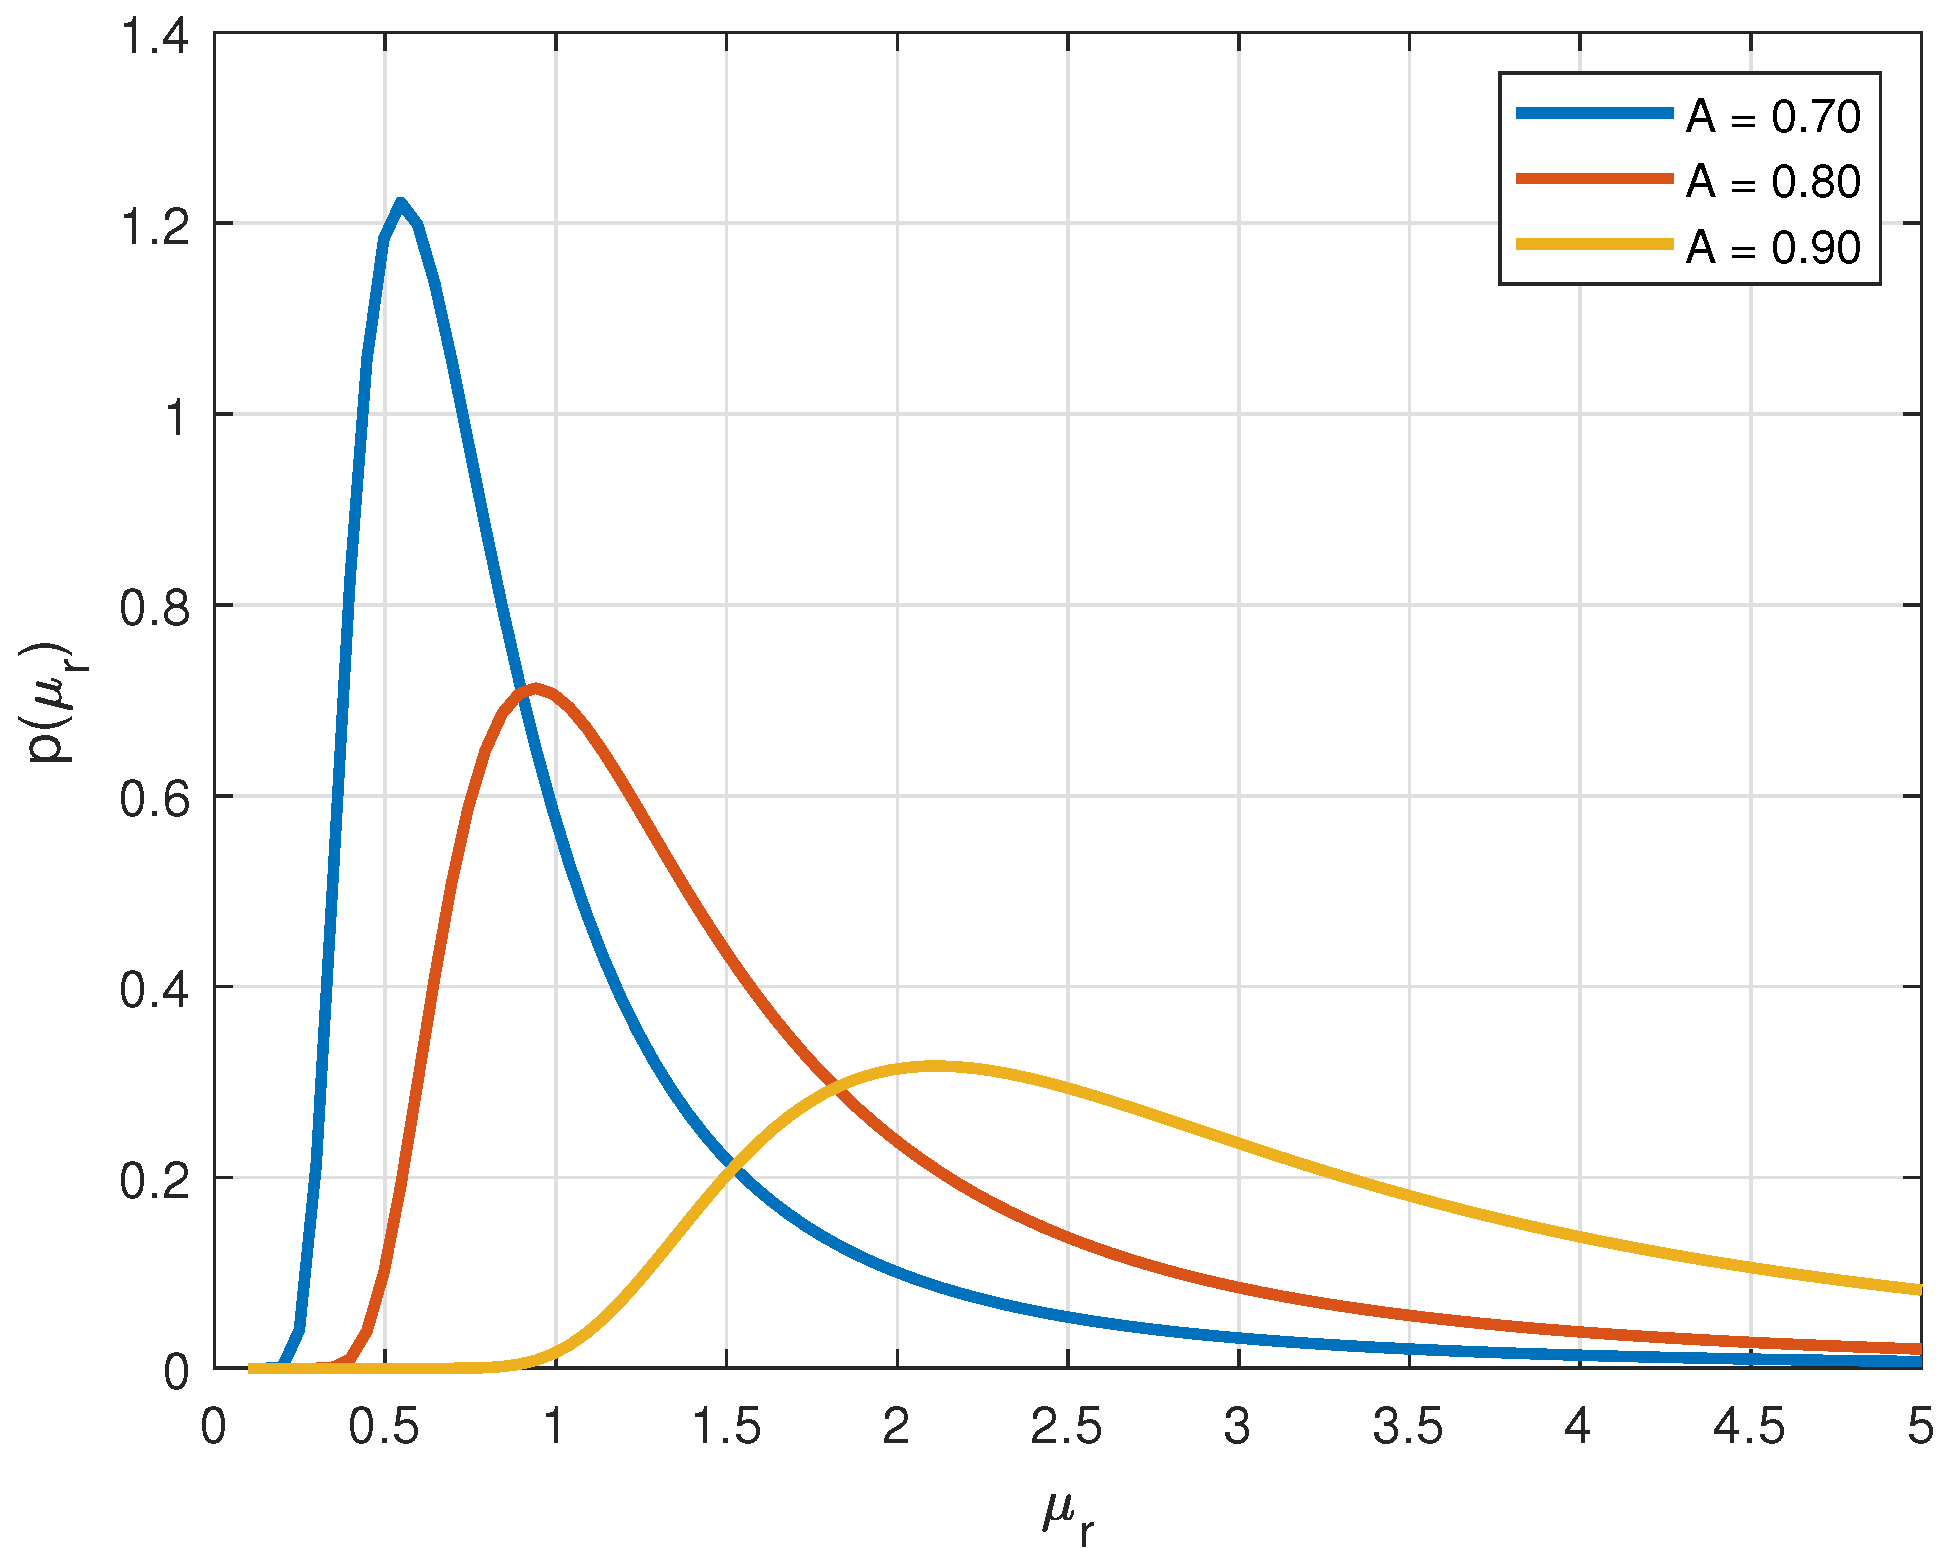
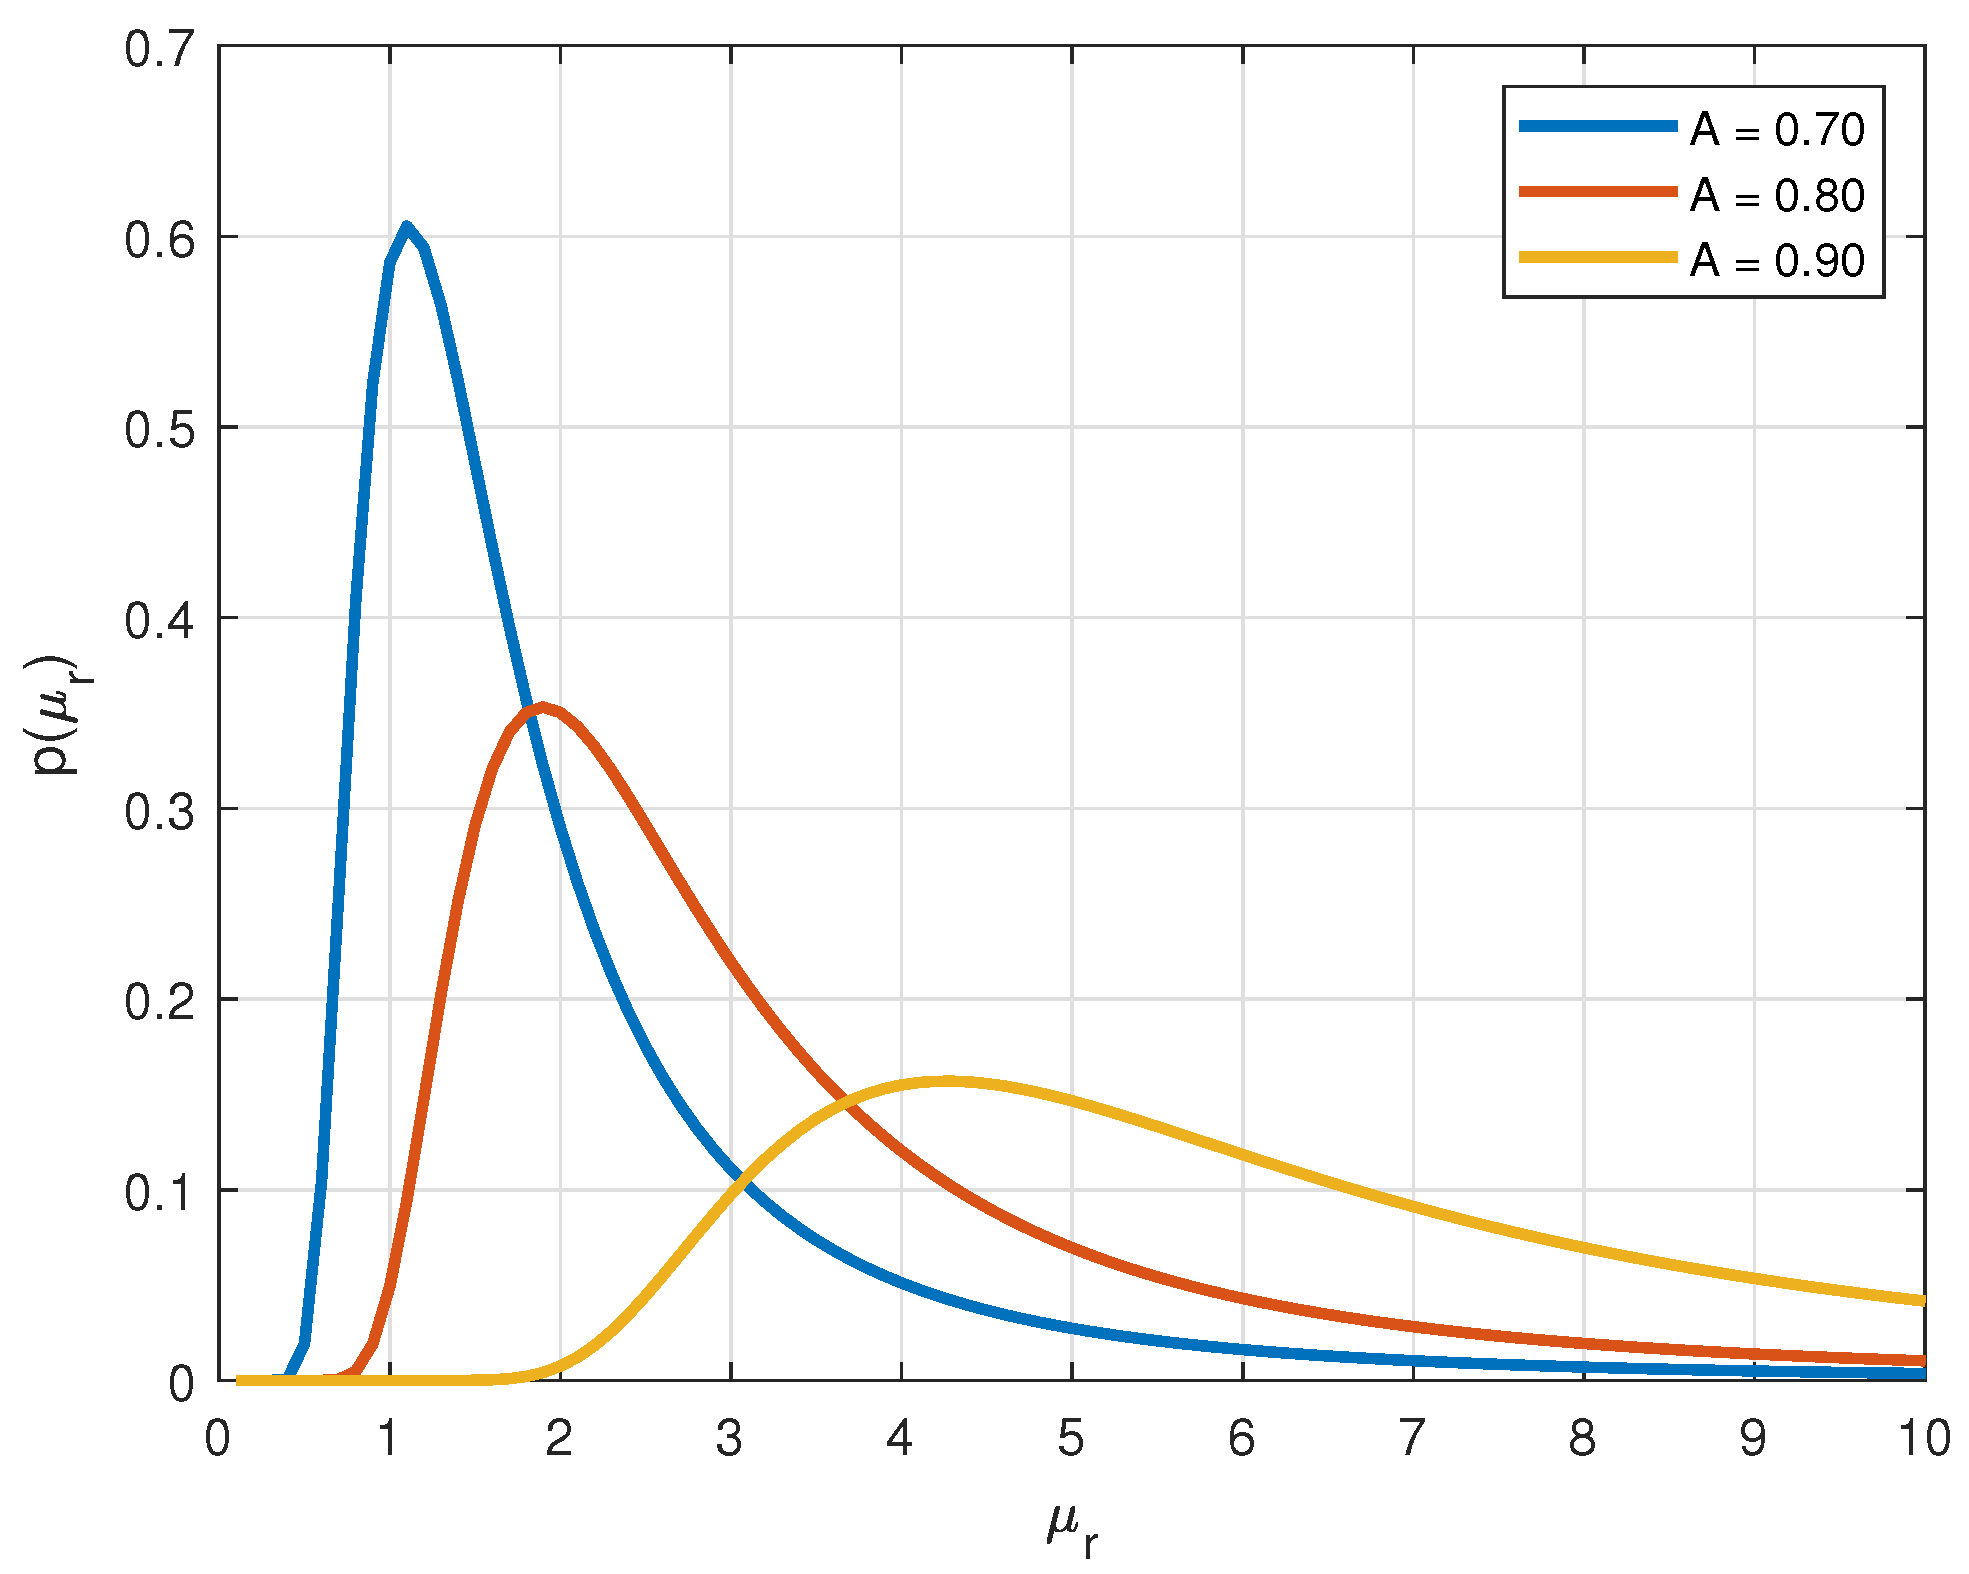
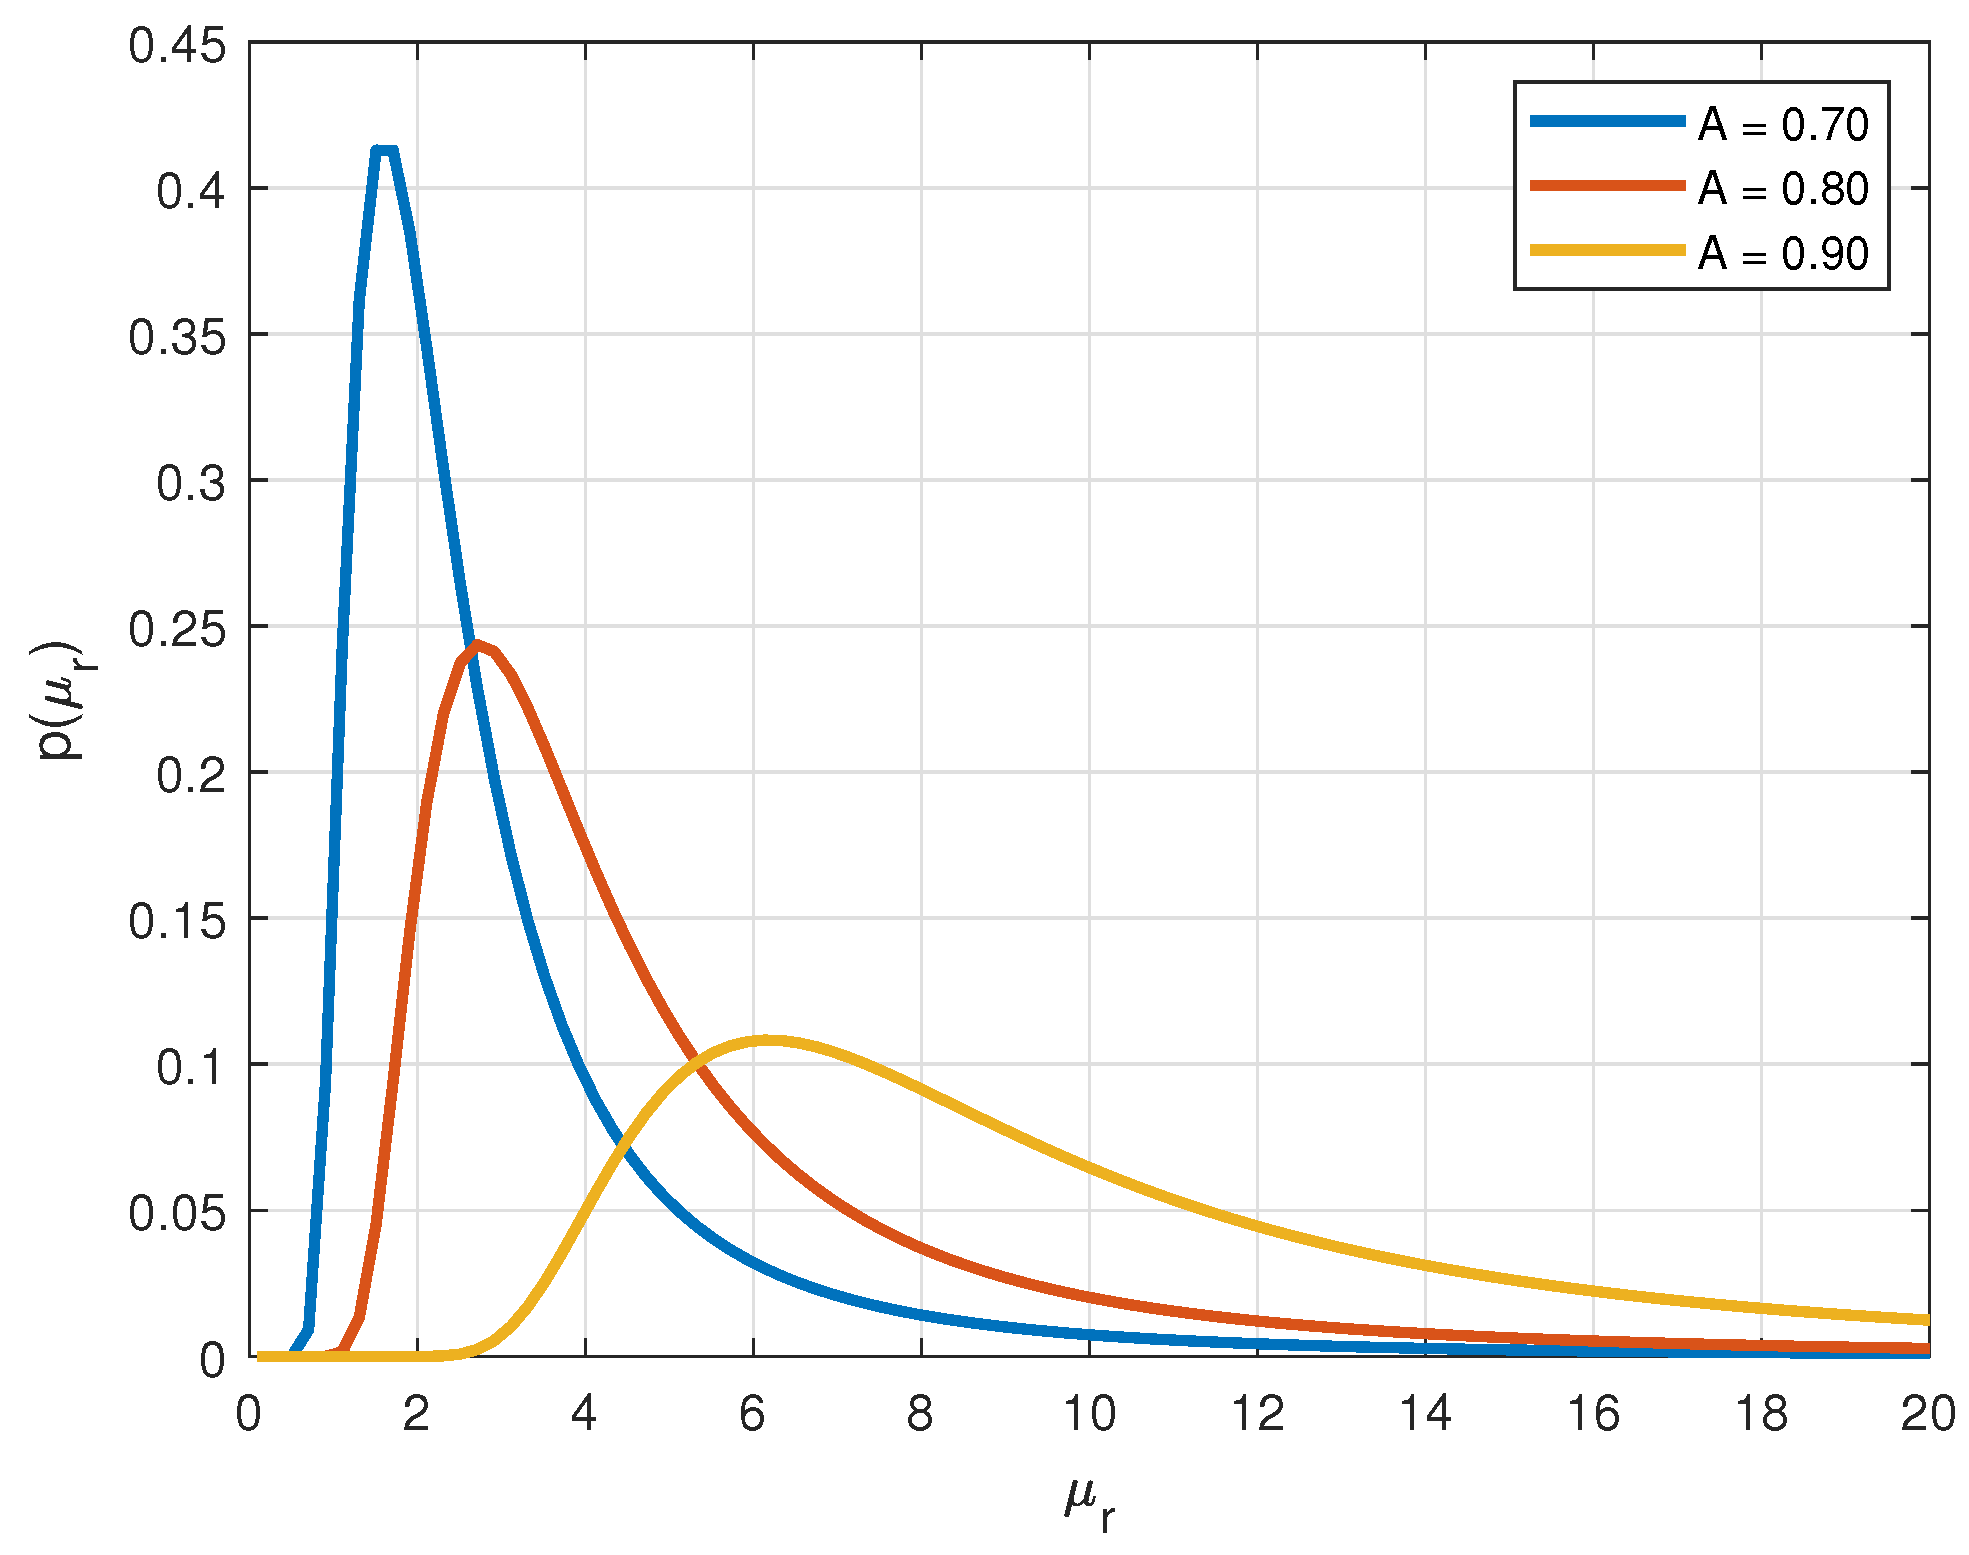
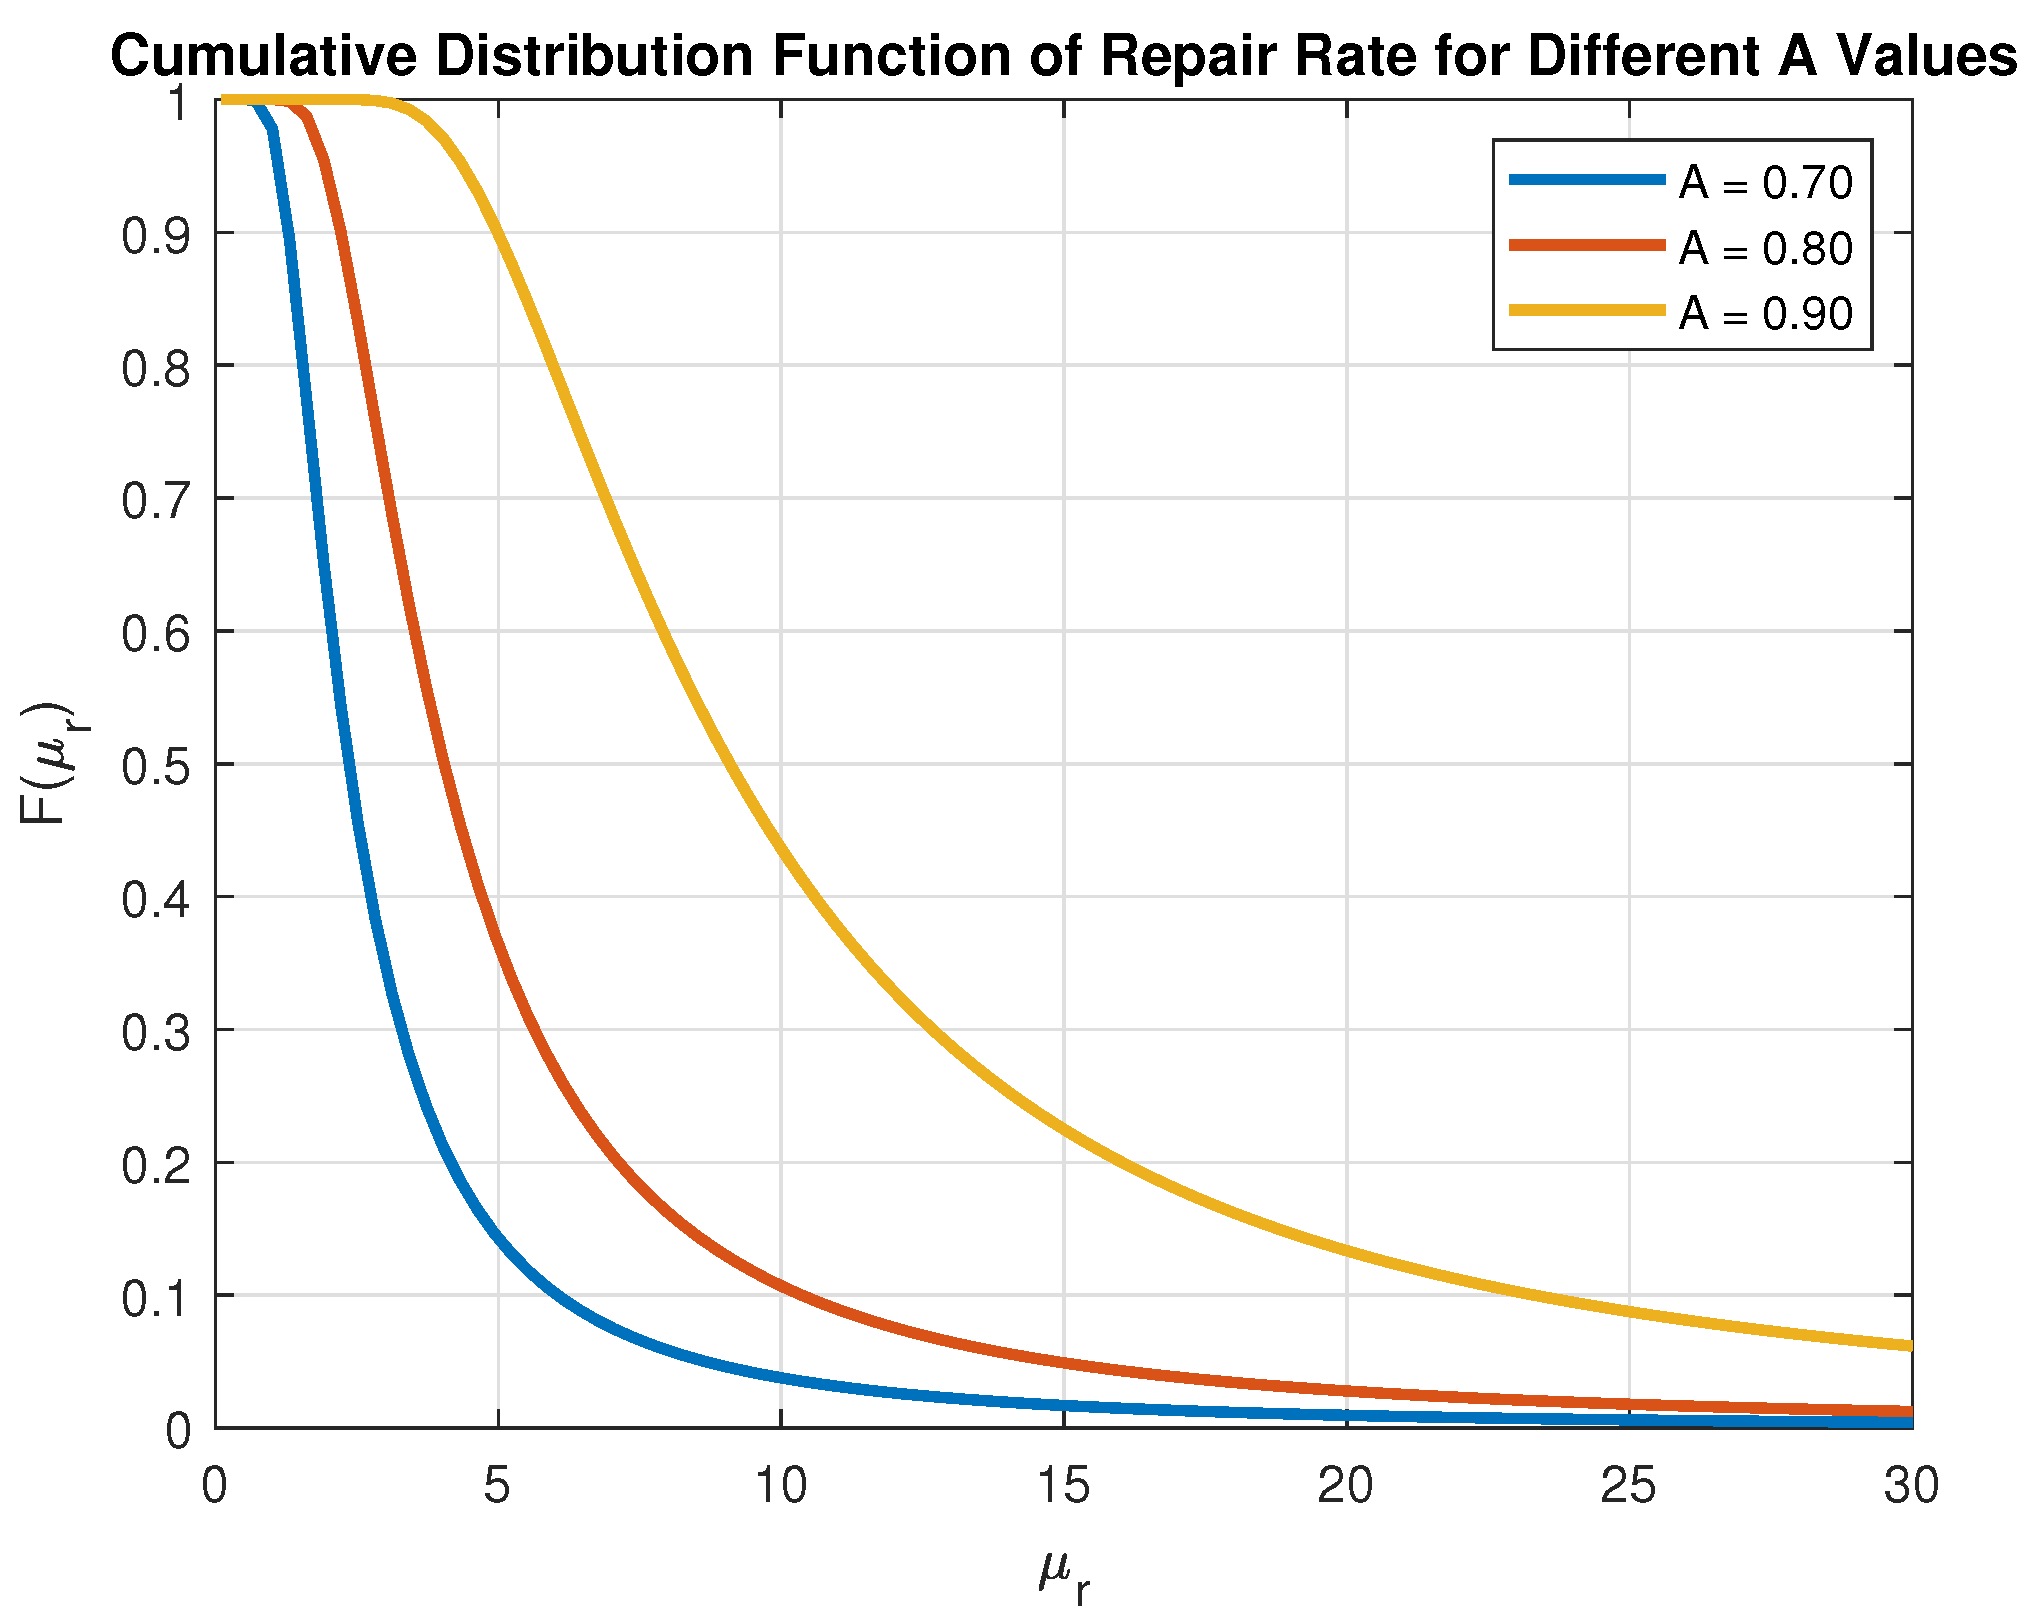

| Symbol/Abbreviation | Description |
|---|---|
| A | Target system availability |
| x | Rayleigh distribution parameter |
| Expected value of the Rayleigh parameter x | |
| y | Random variable uniformly distributed on [0, 1] |
| Repair rate () | |
| MTBF | Mean Time Between Failures |
| MTTR | Mean Time To Repair |
| CDF | Cumulative Distribution Function |
| DNN | Deep Neural Network |
| FCNN | Fully Connected Neural Network |
| LSTM | Long Short-Term Memory Network |
| MAE | Mean Absolute Error |
| MSE | Mean Squared Error |
| NN | Neural Network |
| PBL | Performance-Based Logistics |
| Probability Density Function | |
| RMSE | Root Mean Squared Error |
| R-squared | Coefficient of Determination |
| Test | Metric | ADAM | SGD | RMSprop | Adagrad |
|---|---|---|---|---|---|
| Test 1. (100 epochs) | MSE | 0.0183 | 0.0040 | 0.0044 | 0.0010 |
| MAE | 0.1073 | 0.0357 | 0.0482 | 0.0239 | |
| RMSE | 0.1354 | 0.0635 | 0.0660 | 0.0315 | |
| R-squared | 0.9850 | 0.9967 | 0.9964 | 0.9992 | |
| Test 2. (400 epochs) | MSE | 0.0001 | 0.0001 | 0.0067 | 0.0002 |
| MAE | 0.0058 | 0.0078 | 0.0544 | 0.0095 | |
| RMSE | 0.0087 | 0.0106 | 0.0818 | 0.0124 | |
| R-squared | 0.9999 | 0.9999 | 0.9945 | 0.9999 | |
| Test 3. (700 epochs) | MSE | 0.0001 | 0.0001 | 0.0062 | 0.0001 |
| MAE | 0.0043 | 0.0044 | 0.0585 | 0.0042 | |
| RMSE | 0.0057 | 0.0063 | 0.0786 | 0.0058 | |
| R-squared | 1.0000 | 1.0000 | 0.9949 | 1.0000 |
| Test | Metric | Configuration | |||
|---|---|---|---|---|---|
| Batch Norm, L2 Reg | Batch Norm, No L2 Reg | No Batch Norm, L2 Reg | No Batch Norm, No L2 Reg | ||
| Test 1. (100 epochs) | MSE | 0.3110 | 0.1971 | 0.0068 | 0.0183 |
| MAE | 0.3821 | 0.2966 | 0.0605 | 0.1073 | |
| RMSE | 0.5577 | 0.4439 | 0.0826 | 0.1354 | |
| R-squared | 0.7452 | 0.8385 | 0.9944 | 0.9850 | |
| Test 2. (400 epochs) | MSE | 0.0030 | 0.0011 | 0.0000 | 0.0001 |
| MAE | 0.0433 | 0.0236 | 0.0021 | 0.0058 | |
| RMSE | 0.0550 | 0.0332 | 0.0028 | 0.0087 | |
| R-squared | 0.9975 | 0.9991 | 1.0000 | 0.9999 | |
| Test 3. (700 epochs) | MSE | 0.0010 | 0.0037 | 0.0001 | 0.0001 |
| MAE | 0.0232 | 0.0333 | 0.0016 | 0.0043 | |
| RMSE | 0.0312 | 0.0608 | 0.0024 | 0.0057 | |
| R-squared | 0.9992 | 0.9970 | 1.0000 | 1.0000 | |
| Test | Epochs | Metric | Optimizer | |||
|---|---|---|---|---|---|---|
| ADAM | SGD | RMSprop | Adagrad | |||
| Test 31. | 700, lr = 0.0100, 64 neurons | MSE | 0.0001 | 0.0001 | 0.0320 | 0.0002 |
| MAE | 0.0027 | 0.0042 | 0.1349 | 0.0107 | ||
| RMSE | 0.0122 | 0.0042 | 0.1790 | 0.0151 | ||
| R-squared | 0.9999 | 0.9999 | 0.9737 | 0.9998 | ||
| 700, lr = 0.0010, 64 neurons | MSE | 0.0001 | 0.0017 | 0.0012 | 1.5352 | |
| MAE | 0.0024 | 0.0228 | 0.0232 | 0.9576 | ||
| RMSE | 0.0035 | 0.0407 | 0.0342 | 1.2390 | ||
| R-squared | 1.0000 | 0.9986 | 0.9990 | −0.2578 | ||
| 700, lr = 0.0001, 64 neurons | MSE | 0.8755 | 0.4151 | 0.9139 | 4.7482 | |
| MAE | 0.7373 | 0.5027 | 0.7250 | 1.7020 | ||
| RMSE | 0.9357 | 0.6443 | 0.9560 | 2.1790 | ||
| R-squared | 0.2827 | 0.6599 | 0.2512 | −2.8903 | ||
| Test 32. | 700, lr = 0.0100, 128 neurons | MSE | 0.0001 | 0.0001 | 0.0377 | 0.0001 |
| MAE | 0.0011 | 0.0025 | 0.1601 | 0.0049 | ||
| RMSE | 0.0017 | 0.0038 | 0.1943 | 0.0069 | ||
| R-squared | 1.0000 | 1.0000 | 0.9691 | 1.0000 | ||
| 700, lr = 0.0010, 128 neurons | MSE | 0.0001 | 0.0006 | 0.0072 | 0.3010 | |
| MAE | 0.0018 | 0.0161 | 0.0599 | 0.3936 | ||
| RMSE | 0.0026 | 0.0241 | 0.0849 | 0.5487 | ||
| R-squared | 1.0000 | 0.9995 | 0.9942 | 0.7534 | ||
| 700, lr = 0.0001, 128 neurons | MSE | 0.0583 | 0.2636 | 0.0339 | 4.8856 | |
| MAE | 0.1398 | 0.4029 | 0.1109 | 1.8098 | ||
| RMSE | 0.2414 | 0.5134 | 0.1840 | 2.2103 | ||
| R-squared | 0.9522 | 0.7840 | 0.9723 | −3.0028 | ||
| Test 33. | 700, lr = 0.0100, 256 neurons | MSE | 0.0001 | 0.0001 | 0.0849 | 0.0000 |
| MAE | 0.0011 | 0.0033 | 0.2240 | 0.0029 | ||
| RMSE | 0.0015 | 0.0045 | 0.2914 | 0.0047 | ||
| R-squared | 1.0000 | 1.0000 | 0.9304 | 1.0000 | ||
| 700, lr = 0.0010, 256 neurons | MSE | 0.0001 | 0.0012 | 0.0008 | 0.0404 | |
| MAE | 0.0016 | 0.0239 | 0.0254 | 0.1133 | ||
| RMSE | 0.0023 | 0.0344 | 0.0288 | 0.2009 | ||
| R-squared | 1.0000 | 0.9990 | 0.9993 | 0.9669 | ||
| 700, lr = 0.0001, 256 neurons | MSE | 0.0137 | 0.2597 | 0.0006 | 3.8895 | |
| MAE | 0.0629 | 0.4057 | 0.0190 | 1.5770 | ||
| RMSE | 0.1171 | 0.5096 | 0.0246 | 1.9722 | ||
| R-squared | 0.9888 | 0.7872 | 0.9995 | −2.1867 | ||
| Test | Dataset | Metric | Configuration | |||
|---|---|---|---|---|---|---|
| Batch, L2 Reg | Batch, No L2 Reg | No Batch, L2 Reg | No Batch, No L2 Reg | |||
| Test 13. | 100k | MSE | 0.0036 | 0.0001 | 0.0000 | 0.0001 |
| MAE | 0.0465 | 0.0062 | 0.0013 | 0.0046 | ||
| RMSE | 0.0597 | 0.0087 | 0.0020 | 0.0076 | ||
| R-squared | 0.9971 | 0.9999 | 1.0000 | 1.0000 | ||
| Test 14. | 1M | MSE | 0.0002 | 0.0001 | 0.0000 | 0.0000 |
| MAE | 0.0109 | 0.0085 | 0.0015 | 0.0022 | ||
| RMSE | 0.0153 | 0.0118 | 0.0021 | 0.0033 | ||
| R-squared | 0.9998 | 0.9999 | 1.0000 | 1.0000 | ||
| Test | Epochs | Metric | Optimizer | |||
|---|---|---|---|---|---|---|
| ADAM | SGD | RMSprop | Adagrad | |||
| Test 1. | 100 | MSE | 0.0003 | 0.2485 | 0.0015 | 0.0026 |
| MAE | 0.0123 | 0.3665 | 0.0272 | 0.0344 | ||
| RMSE | 0.0184 | 0.4985 | 0.0386 | 0.0506 | ||
| R-squared | 0.9988 | 0.0967 | 0.9946 | 0.9907 | ||
| Test 2. | 400 | MSE | 0.0003 | 0.0082 | 0.0015 | 0.0001 |
| MAE | 0.0111 | 0.0491 | 0.0283 | 0.0067 | ||
| RMSE | 0.0139 | 0.0905 | 0.0388 | 0.0109 | ||
| R-squared | 0.9993 | 0.9703 | 0.9945 | 0.9996 | ||
| Test 3. | 700 | MSE | 0.0001 | 0.0040 | 0.0008 | 0.0002 |
| MAE | 0.0049 | 0.0361 | 0.0196 | 0.0116 | ||
| RMSE | 0.0073 | 0.0632 | 0.0279 | 0.0154 | ||
| R-squared | 0.9998 | 0.9855 | 0.9972 | 0.9991 | ||
| Test | Epochs | Metric | Configuration | |||
|---|---|---|---|---|---|---|
| Batch, L2 Reg | Batch, No L2 Reg | No Batch, L2 Reg | No Batch, No L2 Reg | |||
| Test 1. | 100 | MSE | 0.0036 | 0.0007 | 0.0004 | 0.0003 |
| MAE | 0.0387 | 0.0132 | 0.0134 | 0.0123 | ||
| RMSE | 0.0603 | 0.0259 | 0.0200 | 0.0184 | ||
| R-squared | 0.9868 | 0.9976 | 0.9985 | 0.9988 | ||
| Test 2. | 400 | MSE | 0.0022 | 0.0003 | 0.0027 | 0.0003 |
| MAE | 0.0381 | 0.0120 | 0.0386 | 0.0111 | ||
| RMSE | 0.0472 | 0.0159 | 0.0521 | 0.0139 | ||
| R-squared | 0.9919 | 0.9991 | 0.9901 | 0.9993 | ||
| Test 3. | 700 | MSE | 0.0018 | 0.0001 | 0.0001 | 0.0001 |
| MAE | 0.0296 | 0.0058 | 0.0074 | 0.0049 | ||
| RMSE | 0.0422 | 0.0109 | 0.0111 | 0.0073 | ||
| R-squared | 0.9935 | 0.9996 | 0.9996 | 0.9998 | ||
| Test | Epochs | Learning Rate | Neurons | Metric | Optimizer | |||
|---|---|---|---|---|---|---|---|---|
| ADAM | SGD | RMSprop | Adagrad | |||||
| Test 31. | 700 | 0.025 | 64 | MSE | 0.0011 | 0.0161 | 0.0105 | 0.0012 |
| MAE | 0.0217 | 0.0776 | 0.0860 | 0.0284 | ||||
| RMSE | 0.0325 | 0.1270 | 0.1026 | 0.0342 | ||||
| R-squared | 0.9962 | 0.9414 | 0.9617 | 0.9957 | ||||
| 0.0025 | 64 | MSE | 0.0012 | 0.2448 | 0.0026 | 0.0073 | ||
| MAE | 0.0246 | 0.3621 | 0.0385 | 0.0591 | ||||
| RMSE | 0.0350 | 0.4947 | 0.0509 | 0.0852 | ||||
| R-squared | 0.9955 | 0.1102 | 0.9906 | 0.9736 | ||||
| 0.00025 | 64 | MSE | 0.0092 | 0.3443 | 0.0014 | 0.8367 | ||
| MAE | 0.0695 | 0.4085 | 0.0295 | 0.6814 | ||||
| RMSE | 0.0961 | 0.5868 | 0.0377 | 0.9147 | ||||
| R-squared | 0.9665 | −0.2518 | 0.9948 | −2.0417 | ||||
| Test 32. | 700 | 0.025 | 128 | MSE | 0.0010 | 0.0028 | 0.0105 | 0.0001 |
| MAE | 0.0233 | 0.0281 | 0.0794 | 0.0076 | ||||
| RMSE | 0.0319 | 0.0529 | 0.1023 | 0.0111 | ||||
| R-squared | 0.9963 | 0.9898 | 0.9620 | 0.9996 | ||||
| 0.0025 | 128 | MSE | 0.0001 | 0.1620 | 0.0027 | 0.0007 | ||
| MAE | 0.0080 | 0.2906 | 0.0437 | 0.0164 | ||||
| RMSE | 0.0107 | 0.4024 | 0.0520 | 0.0261 | ||||
| R-squared | 0.9996 | 0.4112 | 0.9902 | 0.9975 | ||||
| 0.00025 | 128 | MSE | 0.0003 | 0.2988 | 0.0001 | 0.7653 | ||
| MAE | 0.0092 | 0.3854 | 0.0050 | 0.7051 | ||||
| RMSE | 0.0160 | 0.5466 | 0.0074 | 0.8748 | ||||
| R-squared | 0.9991 | −0.0863 | 0.9998 | −1.7822 | ||||
| Test 33. | 700 | 0.025 | 256 | MSE | 0.0002 | 0.0021 | 0.0162 | 0.0004 |
| MAE | 0.0116 | 0.0223 | 0.1009 | 0.0138 | ||||
| RMSE | 0.0157 | 0.0457 | 0.1271 | 0.0190 | ||||
| R-squared | 0.9991 | 0.9924 | 0.9412 | 0.9987 | ||||
| 0.0025 | 256 | MSE | 0.0001 | 0.1896 | 0.0022 | 0.0002 | ||
| MAE | 0.0065 | 0.3197 | 0.0331 | 0.0094 | ||||
| RMSE | 0.0084 | 0.4354 | 0.0470 | 0.0123 | ||||
| R-squared | 0.9997 | 0.3108 | 0.9920 | 0.9995 | ||||
| 0.00025 | 256 | MSE | 0.0003 | 0.3202 | 0.0001 | 0.4697 | ||
| MAE | 0.0106 | 0.3941 | 0.0047 | 0.5983 | ||||
| RMSE | 0.0159 | 0.5658 | 0.0073 | 0.6853 | ||||
| R-squared | 0.9991 | −0.1639 | 0.9998 | −0.7075 | ||||
| Test | Dataset | Metric | Configuration | |||
|---|---|---|---|---|---|---|
| Batch, L2 Reg | Batch, No L2 Reg | No Batch, L2 Reg | No Batch, No L2 Reg | |||
| Test 13. | 100k | MSE | 0.0026 | 0.0001 | 0.0007 | 0.0002 |
| MAE | 0.0398 | 0.0080 | 0.0189 | 0.0095 | ||
| RMSE | 0.0513 | 0.0108 | 0.0264 | 0.0138 | ||
| R-squared | 0.9905 | 0.9996 | 0.9975 | 0.9993 | ||
| Test 14. | 1M | MSE | 0.0269 | 0.0268 | 0.0001 | 0.0001 |
| MAE | 0.1021 | 0.1020 | 0.0068 | 0.0068 | ||
| RMSE | 0.1639 | 0.1636 | 0.0101 | 0.0100 | ||
| R-squared | 0.9028 | 0.9026 | 0.9996 | 0.9996 | ||
| Model | A-Set | MSE | MAE | RMSE | Train Time (s) |
|---|---|---|---|---|---|
| FCNN | 0.70, 0.80, 0.90 | 0.0305 | 0.1338 | 0.1746 | 10.33 |
| FCNN | 0.75, 0.85, 0.95 | 0.1117 | 0.2526 | 0.3343 | 10.33 |
| FCNN | 0.60, 0.79, 0.99 | 0.6335 | 0.6039 | 0.7959 | 10.33 |
| LSTM | 0.70, 0.80, 0.90 | 0.0007 | 0.0160 | 0.0256 | 162.81 |
| LSTM | 0.75, 0.85, 0.95 | 0.1164 | 0.2791 | 0.3411 | 162.81 |
| LSTM | 0.60, 0.79, 0.99 | 0.6036 | 0.6292 | 0.7769 | 162.81 |
Disclaimer/Publisher’s Note: The statements, opinions and data contained in all publications are solely those of the individual author(s) and contributor(s) and not of MDPI and/or the editor(s). MDPI and/or the editor(s) disclaim responsibility for any injury to people or property resulting from any ideas, methods, instructions or products referred to in the content. |
© 2025 by the authors. Licensee MDPI, Basel, Switzerland. This article is an open access article distributed under the terms and conditions of the Creative Commons Attribution (CC BY) license (https://creativecommons.org/licenses/by/4.0/).
Share and Cite
Dejanović, M.; Panić, S.; Kontrec, N.; Đošić, D.; Milojević, S. Neural Network-Based Optimization of Repair Rate Estimation in Performance-Based Logistics Systems. Information 2025, 16, 1031. https://doi.org/10.3390/info16121031
Dejanović M, Panić S, Kontrec N, Đošić D, Milojević S. Neural Network-Based Optimization of Repair Rate Estimation in Performance-Based Logistics Systems. Information. 2025; 16(12):1031. https://doi.org/10.3390/info16121031
Chicago/Turabian StyleDejanović, Milan, Stefan Panić, Nataša Kontrec, Danijel Đošić, and Saša Milojević. 2025. "Neural Network-Based Optimization of Repair Rate Estimation in Performance-Based Logistics Systems" Information 16, no. 12: 1031. https://doi.org/10.3390/info16121031
APA StyleDejanović, M., Panić, S., Kontrec, N., Đošić, D., & Milojević, S. (2025). Neural Network-Based Optimization of Repair Rate Estimation in Performance-Based Logistics Systems. Information, 16(12), 1031. https://doi.org/10.3390/info16121031


