Article

UniAD: A Real-World Multi-Category Industrial Anomaly Detection Dataset with a Unified CLIP-Based Framework

School of Cyber Science and Engineering, Southeast University, Nanjing 211189, China
*
Author to whom correspondence should be addressed.
Information 2025, 16(11), 956; https://doi.org/10.3390/info16110956
Submission received: 8 September 2025 / Revised: 18 October 2025 / Accepted: 1 November 2025 / Published: 4 November 2025

Abstract

Industrial image anomaly detection is critical for automated manufacturing. However, most existing methods rely on single-category training paradigms, resulting in poor scalability and limited cross-category generalization. These approaches require separate models for each product type and fail to model the complex multi-modal distribution of normal samples in multi-category scenarios. To overcome these limitations, we propose UniCLIP-AD, a unified anomaly detection framework that leverages the general semantic knowledge of CLIP and adapts it to the industrial domain using Low-Rank Adaptation (LoRA). This design enables a single model to effectively handle diverse industrial parts. In addition, we introduce UniAD, a large-scale industrial anomaly detection dataset collected from real production lines. It contains over 25,000 high-resolution images across 7 categories of electronic components, with both pixel-level and image-level annotations. UniAD captures fine-grained, diverse, and realistic defects, making it a strong benchmark for unified anomaly detection. Experiments show that UniCLIP-AD achieves superior performance on UniAD, with an AU-ROC of 92.1% and F1-score of 89.8% in cross-category tasks, outperforming the strongest baselines (CFA and DSR) by 3% AU-ROC and 23.9% F1-score.

1. Introduction

Amid the ongoing automation wave sweeping across high-end manufacturing, industrial image anomaly detection has become a cornerstone for ensuring both product quality and production efficiency. Despite continuous technological advancements, current anomaly detection techniques face a critical bottleneck: the single-category training paradigm. Whether based on reconstruction methods such as DRAEM [1] and tGARD [2], or embedding-based approaches like PatchCore [3] and CFA [4], mainstream methods learn a bespoke “normality” model tailored to each specific product category.
As a result, in modern production environments characterized by multi-product, high-throughput manufacturing, manufacturers are compelled to maintain a separate detection model for each product line—leading to prohibitively high deployment costs, poor scalability, and hindering the development of unified, efficient quality control systems. This inherent limitation presents two fundamental challenges:
  • Lack of Cross-Category Generalization:
A model trained on one category fails to generalize to unseen categories due to significant distribution shifts. This “divide-and-conquer” approach cannot support scenarios like mixed-product manufacturing or new product introduction.
  • Incompatibility with Mixed-Category Training:
Traditional methods aim to fit compact “normal” distributions. However, when samples from multiple categories are combined, the resulting distribution becomes highly complex and multi-modal. Attempts to force a fit under these conditions often lead to over-generalization, where the model sacrifices intra-category anomaly sensitivity, severely degrading detection performance.
To transcend this category-constrained bottleneck and enable true Unified Anomaly Detection (Uni-AD), a paradigm shift is needed—from modeling category-specific pixel distributions to learning general, cross-category semantic concepts of abnormality. In this context, CLIP (Contrastive Language–Image Pre-training) naturally emerges as a promising solution, since its vision–language alignment provides category-agnostic representations that can describe abnormalities beyond a single product type.
Trained on a massive image–text corpus via contrastive learning, CLIP captures a broad spectrum of high-level visual concepts and world knowledge. It holds the potential to differentiate abstract notions like “intact” versus “damaged” objects—even without knowing the specific object category. Nevertheless, a domain gap exists between CLIP’s open-domain knowledge and the highly specialized requirements of industrial inspection, making direct deployment suboptimal.
To overcome this, we adopt Low-Rank Adaptation (LoRA), a parameter-efficient fine-tuning strategy. By injecting a small number of trainable parameters, LoRA enables precise and lightweight domain adaptation, allowing CLIP to effectively learn industrial-specific anomaly semantics while preserving its general semantic understanding.
However, a powerful algorithmic framework must be matched by an appropriate benchmark for development and validation. Existing datasets fall short of the requirements for unified detection: MVTec AD [5], a widely used benchmark, contains mostly single-object images captured under laboratory conditions with relatively simple scenes. VisA [6] presents more complex PCB scenarios but remains limited to a single domain. Even large-scale real-world datasets like Real-IAD [7] suffer from low resolution and coarse annotations, impeding detailed defect analysis. These datasets, designed for single-category evaluation, lack category diversity, defect authenticity, and sufficient normal sample variation, making them unsuitable for assessing cross-category generalization.
To address this gap, we construct a new dataset that better reflects real-world industrial scenarios. We introduce UniAD, a unified anomaly detection dataset featuring: seven mainstream electronic component categories, captured from real production lines; over 25,000 high-resolution images with fine-grained pixel-level and image-level annotations; rich diversity in normal samples—spanning different production batches, viewing angles, and lighting conditions; a wide range of minute, morphologically diverse defects, enabling rigorous, multi-level, multi-task evaluations.
In summary, this work tackles the long-standing challenge of category dependency in industrial anomaly detection. By combining CLIP’s general semantic understanding with LoRA’s efficient domain adaptation, we propose a novel unified anomaly detection framework. Furthermore, we introduce a new high-fidelity, multi-category industrial dataset to facilitate research in unified modeling for real-world quality control systems.
Our main contributions are as follows:
  • We propose UniCLIP-AD, a unified anomaly detection framework built upon CLIP and prompt learning. It enables effective anomaly detection across multiple industrial categories using a single model, substantially improving generalization and deployment efficiency.
  • We construct and release UniAD, a novel industrial anomaly detection dataset collected from actual production lines. It includes 25,000+ high-resolution images spanning 7 categories of electronic components, each with pixel-level and image-level annotations. UniAD offers authentic, diverse, and subtle defect instances, making it a strong benchmark for evaluating universal detection models.
  • Extensive experiments demonstrate the superiority of our method. On UniAD, UniCLIP-AD achieves average AU-ROC and F1-scores of 92.1% and 89.8%, respectively, in cross-category detection. It significantly outperforms leading baselines—particularly in F1-score, which is critical for practical deployment—highlighting its strong potential as a general-purpose solution for industrial quality inspection.

2. Related Work

2.1. Anomaly Detection Methods

Industrial image anomaly detection, as a core component of quality control in intelligent manufacturing, plays a critical role in high-precision applications such as semiconductor defect detection. Current research paradigms primarily follow three principal technical approaches: reconstruction-based methods, embedding-based methods, and memory bank-based methods.
Reconstruction-based methods perform anomaly detection by establishing distribution models of normal samples, with their technical evolution primarily manifested in two aspects: the shift of reconstruction targets towards feature space and the enhanced trend of multimodal fusion. In feature reconstruction, ReconFA [8] introduced a Multi-Scale Aggregation Module (MSAM) that effectively mitigated domain adaptation issues through deep feature reconstruction. DRAEM [1] innovatively combined semantic inpainting with discriminative learning, employing synthetic anomaly data for training to address the scarcity of real defect data. Furthermore, the application of diffusion models represents the latest technological breakthrough in reconstruction methods. AnoDDPM [9] optimized high-resolution image detection through partial diffusion strategies and multi-scale Simplex noise. DiffusionAD [10] proposed a single-step denoising and noise-to-norm reconstruction mechanism, significantly accelerating inference while integrating multi-scale noise to improve restoration of diverse anomaly types. However, these methods face two inherent limitations. First, there exists an inherent trade-off between the accuracy of normal pattern modeling and the effectiveness of anomaly suppression. Over-optimized reconstruction networks tend to “over-generalize,” leading to the erroneous reconstruction of subtle anomalies in complex backgrounds and reduced detection sensitivity. Second, here is a significant domain gap between synthetic data and real-world defect distributions. Current synthetic strategies struggle to cover dynamically varying defect patterns in actual production lines, severely constraining practical deployment effectiveness.
Embedding-based methods focus on mapping normal samples into a compact feature space, where anomalies are identified by measuring the distance between new samples and normal features in this space. Traditional embedding-based methods rely on single-modal visual embeddings for anomaly detection. PatchCore [3] established the methodological foundation by constructing a memory bank of patch features extracted from pre-trained CNNs, enabling efficient anomaly detection and localization. ReConPatch [11] advanced this approach through lightweight linear transformation layers and an innovative contrastive learning mechanism to optimize feature representation for industrial scenarios, significantly reducing false detection rates. CLIP-based approaches extend this paradigm to cross-modal embeddings, aligning visual and textual representations to improve zero-shot anomaly detection performance. AFR-CLIP [12] enhances zero-shot anomaly detection by rectifying text embeddings with visual defect cues and aggregating multi-patch features for fine-grained anomaly localization. Similarly, AA-CLIP [13] addresses the inherent anomaly-unawareness of CLIP by creating anomaly-aware text anchors and aligning patch-level visual features, enabling clear disentanglement of normal and abnormal semantics while preserving CLIP’s generalization. Both AFR-CLIP and AA-CLIP are zero-shot anomaly detection frameworks validated primarily on industrial inspection tasks. Despite substantial progress in detection efficiency and image-level accuracy, these methods face a fundamental challenge: constructing a generalizable embedding space with sufficient discriminative power to reliably identify subtle anomalies. Most approaches remain inherently tied to category-specific training paradigms, requiring individual training or feature tuning for each product category. This not only substantially increases deployment costs but also limits adaptability to dynamically emerging defects on production lines, with particularly noticeable performance degradation in detecting subtle defects as category diversity grows.
To highlight the advantages of UniCLIP-AD within cross-modal embedding methods, we compare it with AFR-CLIP and AA-CLIP across key dimensions, including adaptation mechanism, multi-category coverage, data requirements, and training cost. Table 1 shows that UniCLIP-AD leverages Low-Rank Adaptation (LoRA) to achieve single-model coverage across multiple industrial part categories, while maintaining low auxiliary data requirements and lightweight training. In contrast, AFR-CLIP and AA-CLIP rely more on auxiliary annotations and incur higher training costs.
Memory bank-based methods achieve anomaly detection through prototype storage and retrieval, demonstrating significant innovations across three dimensions: cross-modal extension, dynamic memory management, and multi-level architecture design. TSMAE [14] leveraged the anomaly-suppressing characteristics of memory modules to provide a feature extraction framework for vibration monitoring in semiconductor manufacturing equipment. MAAE [15] accomplished precise background-anomaly separation in hyperspectral inspection via multi-level memory enhancement. MATCAE [16] designed a dynamic memory architecture for rotating machinery, offering directly transferable spatiotemporal feature fusion strategies for cross-scale defect detection in chip images. M3DM [17] integrated 3D point clouds and RGB images for multimodal anomaly detection, providing a technical reference for the collaborative analysis of optical and electron microscope data in chip detection. These approaches have been further extended to multimodal applications, which establishes technical references for correlating optical and electron microscopy data in semiconductor defect detection. However, their limitations lie in the capacity and update strategy of the memory bank. Fixed-capacity memory banks may fail to encompass the full variability of normal patterns in complex industrial environments, potentially leading to “memory failure.” Additionally, the computational overhead required for memory retrieval may compromise real-time performance requirements.
Beyond traditional anomaly detection pipelines, recent advancements in machine learning emphasize representation fusion and structured learning for enhanced generalization. Multi-view learning offers a promising paradigm for industrial inspection by integrating heterogeneous data sources such as images and sensor signals to improve anomaly detection accuracy and robustness [18]. However, challenges such as view inconsistency, high computational complexity, and limited interpretability remain significant obstacles for large-scale industrial deployment. The Temporal Hypergraph Memory Network offers an effective framework for modeling complex temporal dependencies among multi-dimensional features, enabling richer representation learning in sequential tasks [19]. However, such methods often require substantial computational resources and may suffer from limited interpretability, which constrains their application in large-scale industrial scenarios.
In summary, while existing anomaly detection methods have achieved notable success in their respective domains, they universally confront three critical challenges: category-dependent training paradigms, limited generalization capability to novel categories, and insufficient sensitivity to subtle anomalies in complex backgrounds. These limitations stem from current approaches on prior knowledge and inherent vulnerability to data distribution shifts, resulting in high deployment costs and low efficiency when applied to diverse products and defect types in real-world industrial production lines.

2.2. Existing Datasets

The development of industrial anomaly detection has been closely driven by the availability of high-quality datasets. Existing mainstream datasets are generally constructed around four key challenges: single-modality image detection, robustness under complex environments, the integration of multimodal and 3D information, and large-scale unsupervised scenarios from real-world production lines.
In terms of single-modality image detection, MVTec AD [5] was the earliest benchmark dataset that defined the paradigm for unsupervised industrial anomaly detection. It covered 15 object and texture categories and 73 defect types, with a strict split between training and testing sets, becoming a common standard in early research. The VisA [6] dataset further expanded the number of categories and dataset scale, introducing multi-instance annotations to enhance models’ ability to handle complex structures such as PCBs. To address the more complex defect distributions in 3C electronic manufacturing, the 3CAD [20] dataset became the most comprehensive dataset for consumer electronics defects. It included 8 component categories and 47 defect types, and its design fully considered practical production line characteristics such as multi-defect coexistence and variable morphologies.
As industrial applications became more complex, robustness in challenging imaging environments also became a research focus. The MPDD [21] dataset simulated common imaging disturbances in metal production lines such as reflections and motion blur, revealing performance degradation of mainstream methods under non-ideal conditions. The RAD [22] dataset constructed more challenging multi-view and illumination variation scenarios for foreign object detection, strengthening robustness evaluation for memory-based methods. The M2AD [23] dataset further systematically expanded the combinations of viewpoints and lighting conditions, with 120 configurations, particularly suited for visualization studies of defects in precision components like chips and semiconductors.
With the rising demand for diverse inspection capabilities, multi-modality and 3D information were widely introduced. The Anomaly-ShapeNet [24] dataset became the first synthetic point cloud dataset for industrial detection, generating six typical 3D structural anomalies through geometric perturbations and opening a new direction for 3D anomaly detection. The MulSen-AD [25] dataset combined RGB imagery, laser scanning, and infrared thermography to enable joint detection across appearance, structural, and thermal attributes, supporting the diagnosis of multi-source defects in chip packaging.
Regarding dataset scale and annotation strategies, the Real-IAD [7] dataset collected over 150,000 images from real production lines, covering multiple angles and complex backgrounds, and employed a fully unsupervised training data construction based on good-product rate constraints, significantly reducing manual annotation costs. This dataset exposed performance bottlenecks of existing methods under cross-category and cross-view conditions, especially showing weaknesses in detecting micron-level, low-contrast defects.
Despite notable progress across these datasets, significant gaps remain in meeting the demands of real-world industrial applications. Many datasets are still built around single categories, limiting the generalization ability of models in multi-product environments and making it difficult to address the common need for mixed-category inspection on production lines. Moreover, the design of anomalous samples often lacks authenticity, as many are synthetically generated or captured under controlled conditions, falling short in reflecting the subtle and diverse nature of real-world defects. Additionally, the diversity of negative samples and the granularity of annotations remain insufficient, which undermines model robustness and accuracy in actual deployment scenarios. These limitations highlight the need for datasets that better represent practical conditions, motivating our work to construct a more realistic and richly annotated dataset and to develop a unified detection framework tailored to complex industrial imagery.

3. Methods

This section introduces our supervised prompt-based anomaly detection framework for industrial chip components, which leverages a pretrained CLIP model with frozen parameters. The model is fine-tuned using Low-Rank Adaptation (LoRA) modules inserted into the self-attention layers of the image encoder and text encoder. Unlike conventional anomaly detection systems that rely on reconstruction losses, one-class classification, or per-category detectors, our method formulates anomaly detection as a supervised binary classification task, using prompt-pair similarity and cross-entropy loss. This design allows for generalizable and robust anomaly identification across different chip types and defect patterns. The overall architecture is shown in Figure 1.

3.1. Dataset Analysis

In recent years, the development of industrial image anomaly detection has become increasingly reliant on large-scale, high-quality datasets. Our study constructs a comprehensive dataset for industrial anomaly detection that features multi-category coverage, high intra-class diversity, and real-world image acquisition conditions. The dataset is sourced from real production lines, encompassing a variety of commonly used electronic components. It offers high-resolution imagery, diverse defect types, and detailed annotation information.
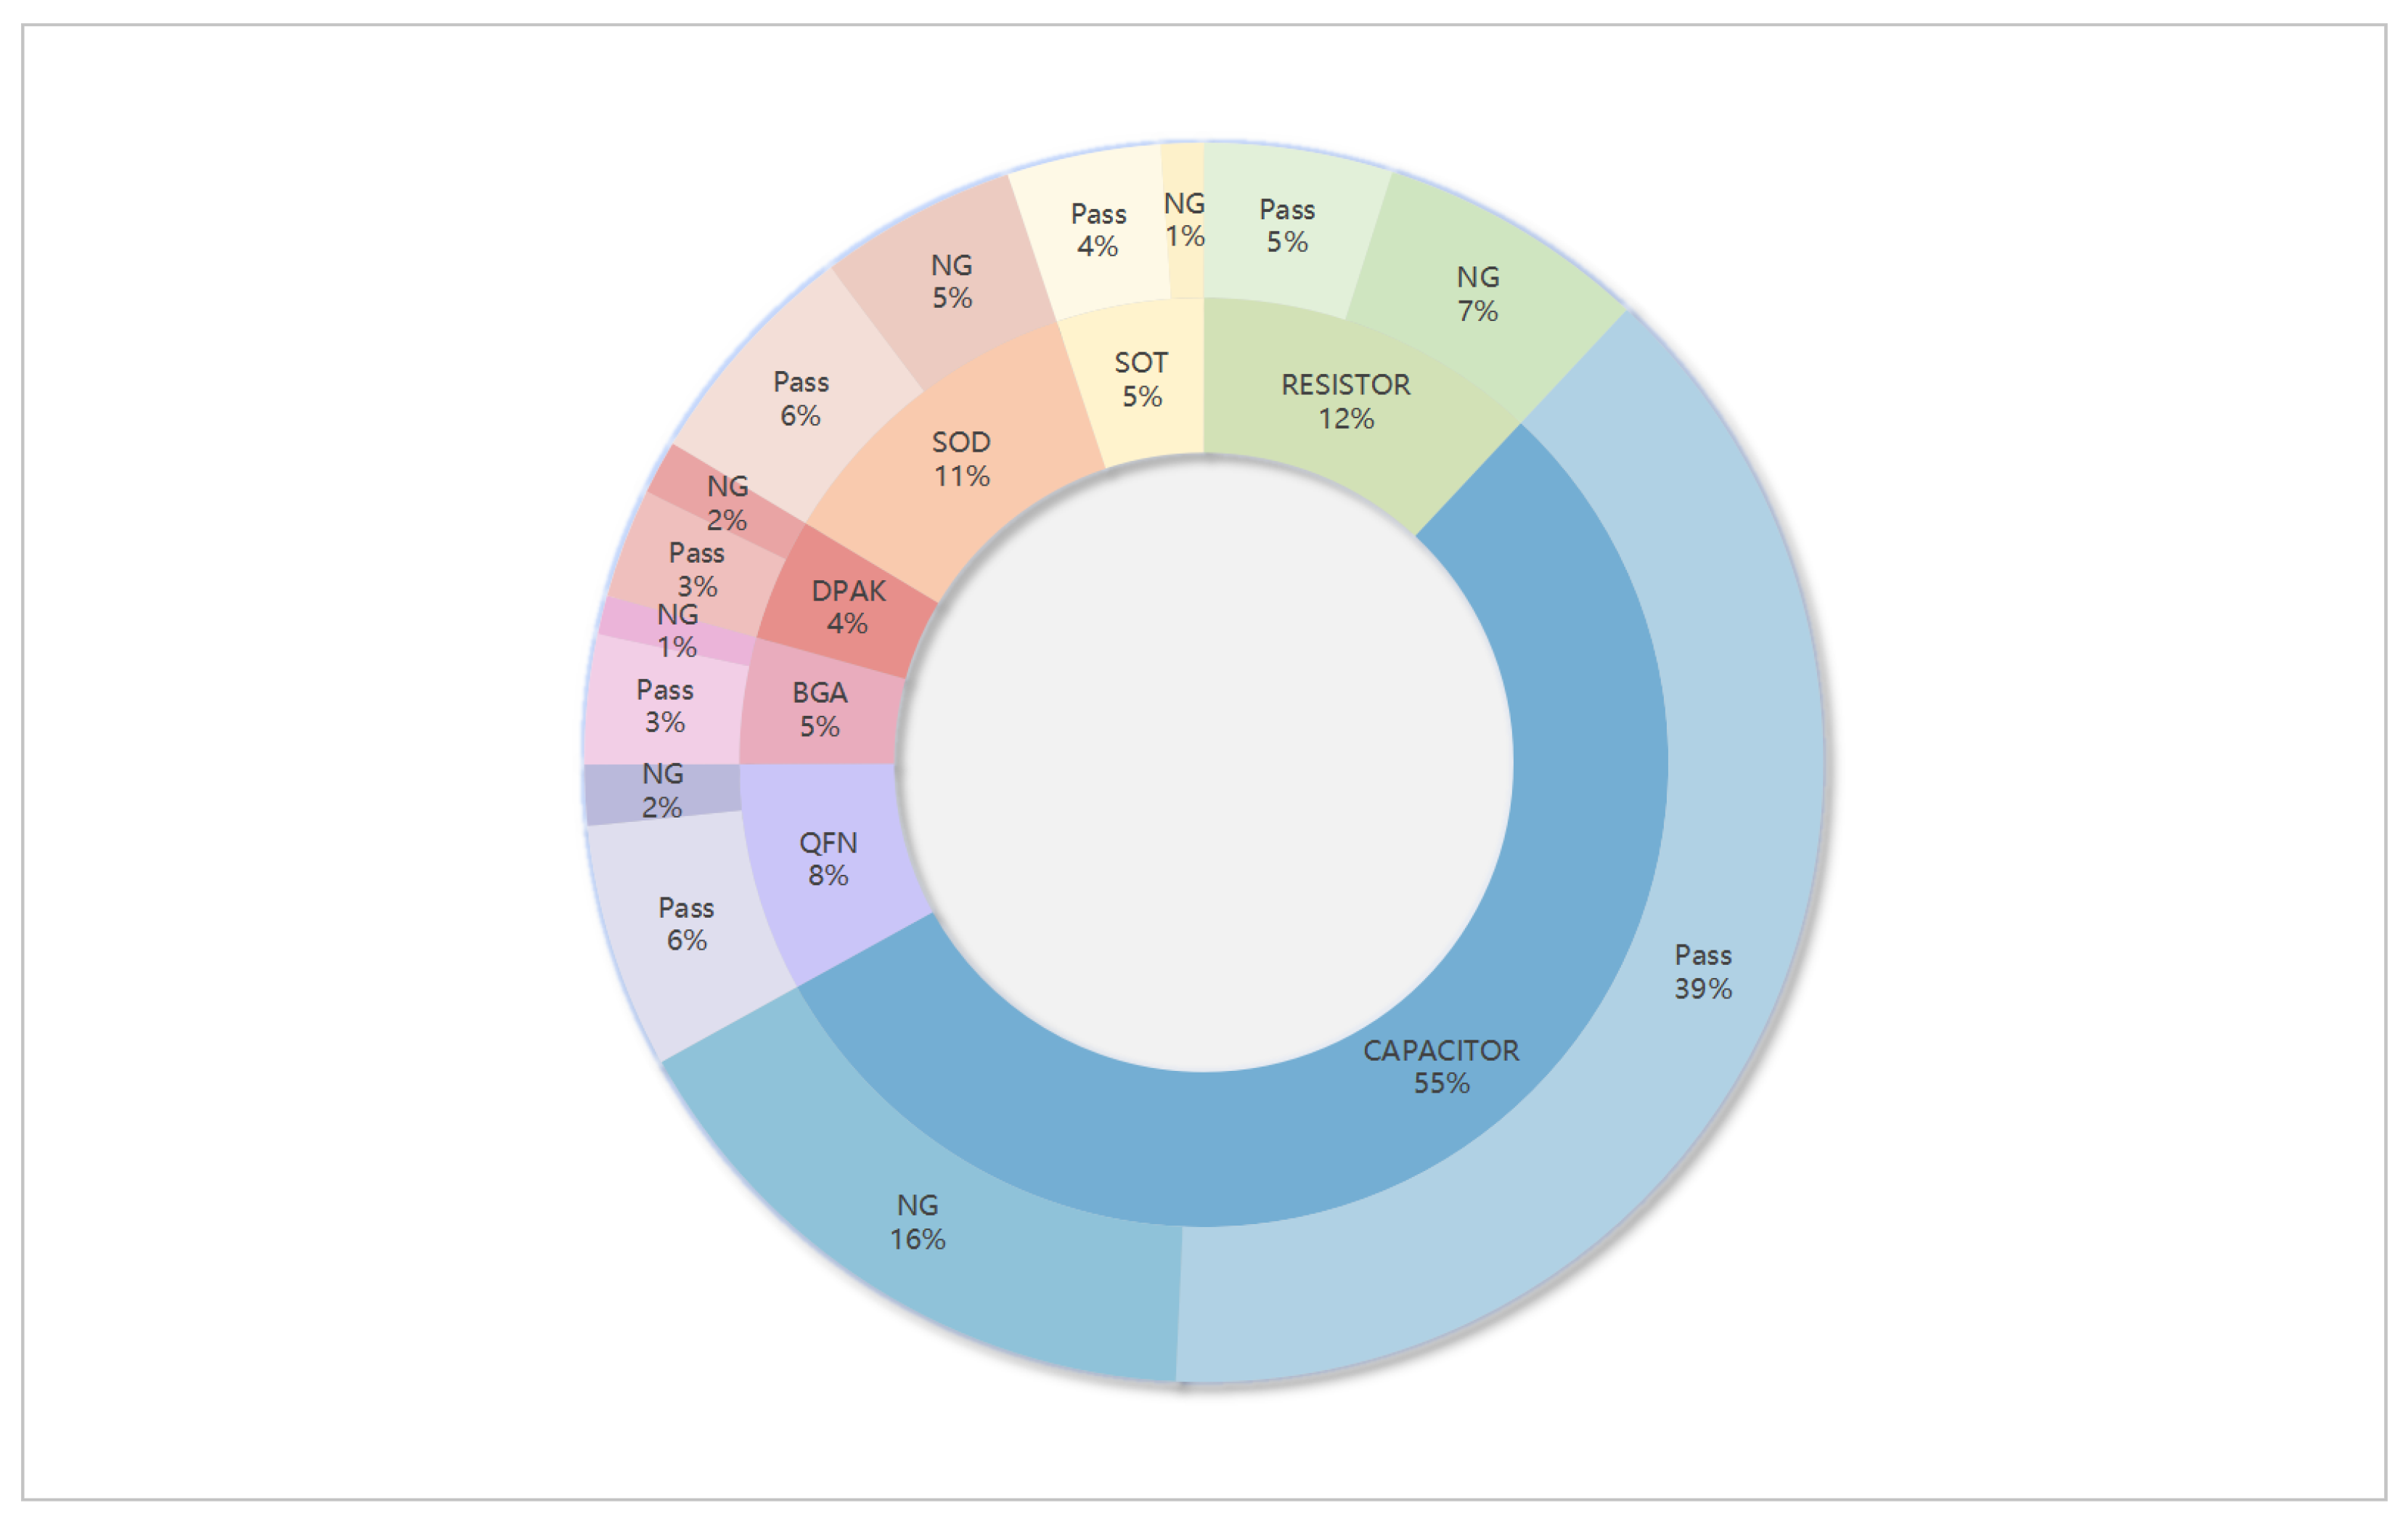
Specifically, the dataset includes seven categories of electronic components: resistors, capacitors, quad flat no-lead packages (QFN), ball grid array packages (BGA), discrete packaging for power transistors (DPAK), small-outline diode packages (SOD), and small-outline transistor packages (SOT). Each category is stored in a separate directory, with image-level labels indicating whether the sample is a normal instance (Pass) or contains an anomaly (NG). The proportion of normal and anomalous samples for each component category is shown in Figure 2.
The dataset comprises a total of 25,830 images, among which 8671 are labeled as anomalous, accounting for over 33% of the total. The detailed distribution of normal and anomalous samples across each component category is presented in Table 2. Among them, CAPACITOR is the most represented category with 14,209 samples, constituting the largest portion of the dataset, followed by RESISTOR and SOD (Small Outline Diode package). For certain categories, the number of normal samples exceeds that of anomalous ones, reflecting the natural imbalance in real-world industrial settings where anomalies are typically rare.
The dataset provides detailed annotations and statistical analysis of defect types commonly encountered on real-world production lines. These defects encompass both frequently observed anomaly patterns—such as missing components and component misalignment—as well as more complex or infrequent cases, including tombstoning, standing, cold solder joints, short circuits, side-standing, and body warping. The distribution of various defect types within the dataset is illustrated in Figure 3.
Table 3 presents the most frequently observed defect types in our dataset, reflecting their representative prevalence in real-world manufacturing environments. In contrast to mainstream datasets such as MVTec AD, which often rely on synthetic anomalies or curated settings, all images in our dataset are captured directly from real production lines. The annotated defect types closely resemble actual micro-defects encountered in industrial workflows, such as solder misalignment, surface scratches, foreign object contamination, and subtle body warping. These defects are typically fine-grained, highly similar in appearance to normal regions, and difficult to reproduce artificially—posing significant challenges rarely addressed in existing benchmarks.
The dataset also features a wide range of image resolutions, reflecting the variability of real-world acquisition conditions. Specifically, image sizes range from 40 × 38 pixels to 2810 × 2838 pixels, with an average resolution of 246 × 236 pixels. This diversity captures both microscopic component details and macroscopic board-level layouts, supporting robust multi-scale feature learning. The five most common resolution combinations each contain over a thousand samples, underscoring the heterogeneous and varied nature of the acquisition process, as summarized in Table 4.
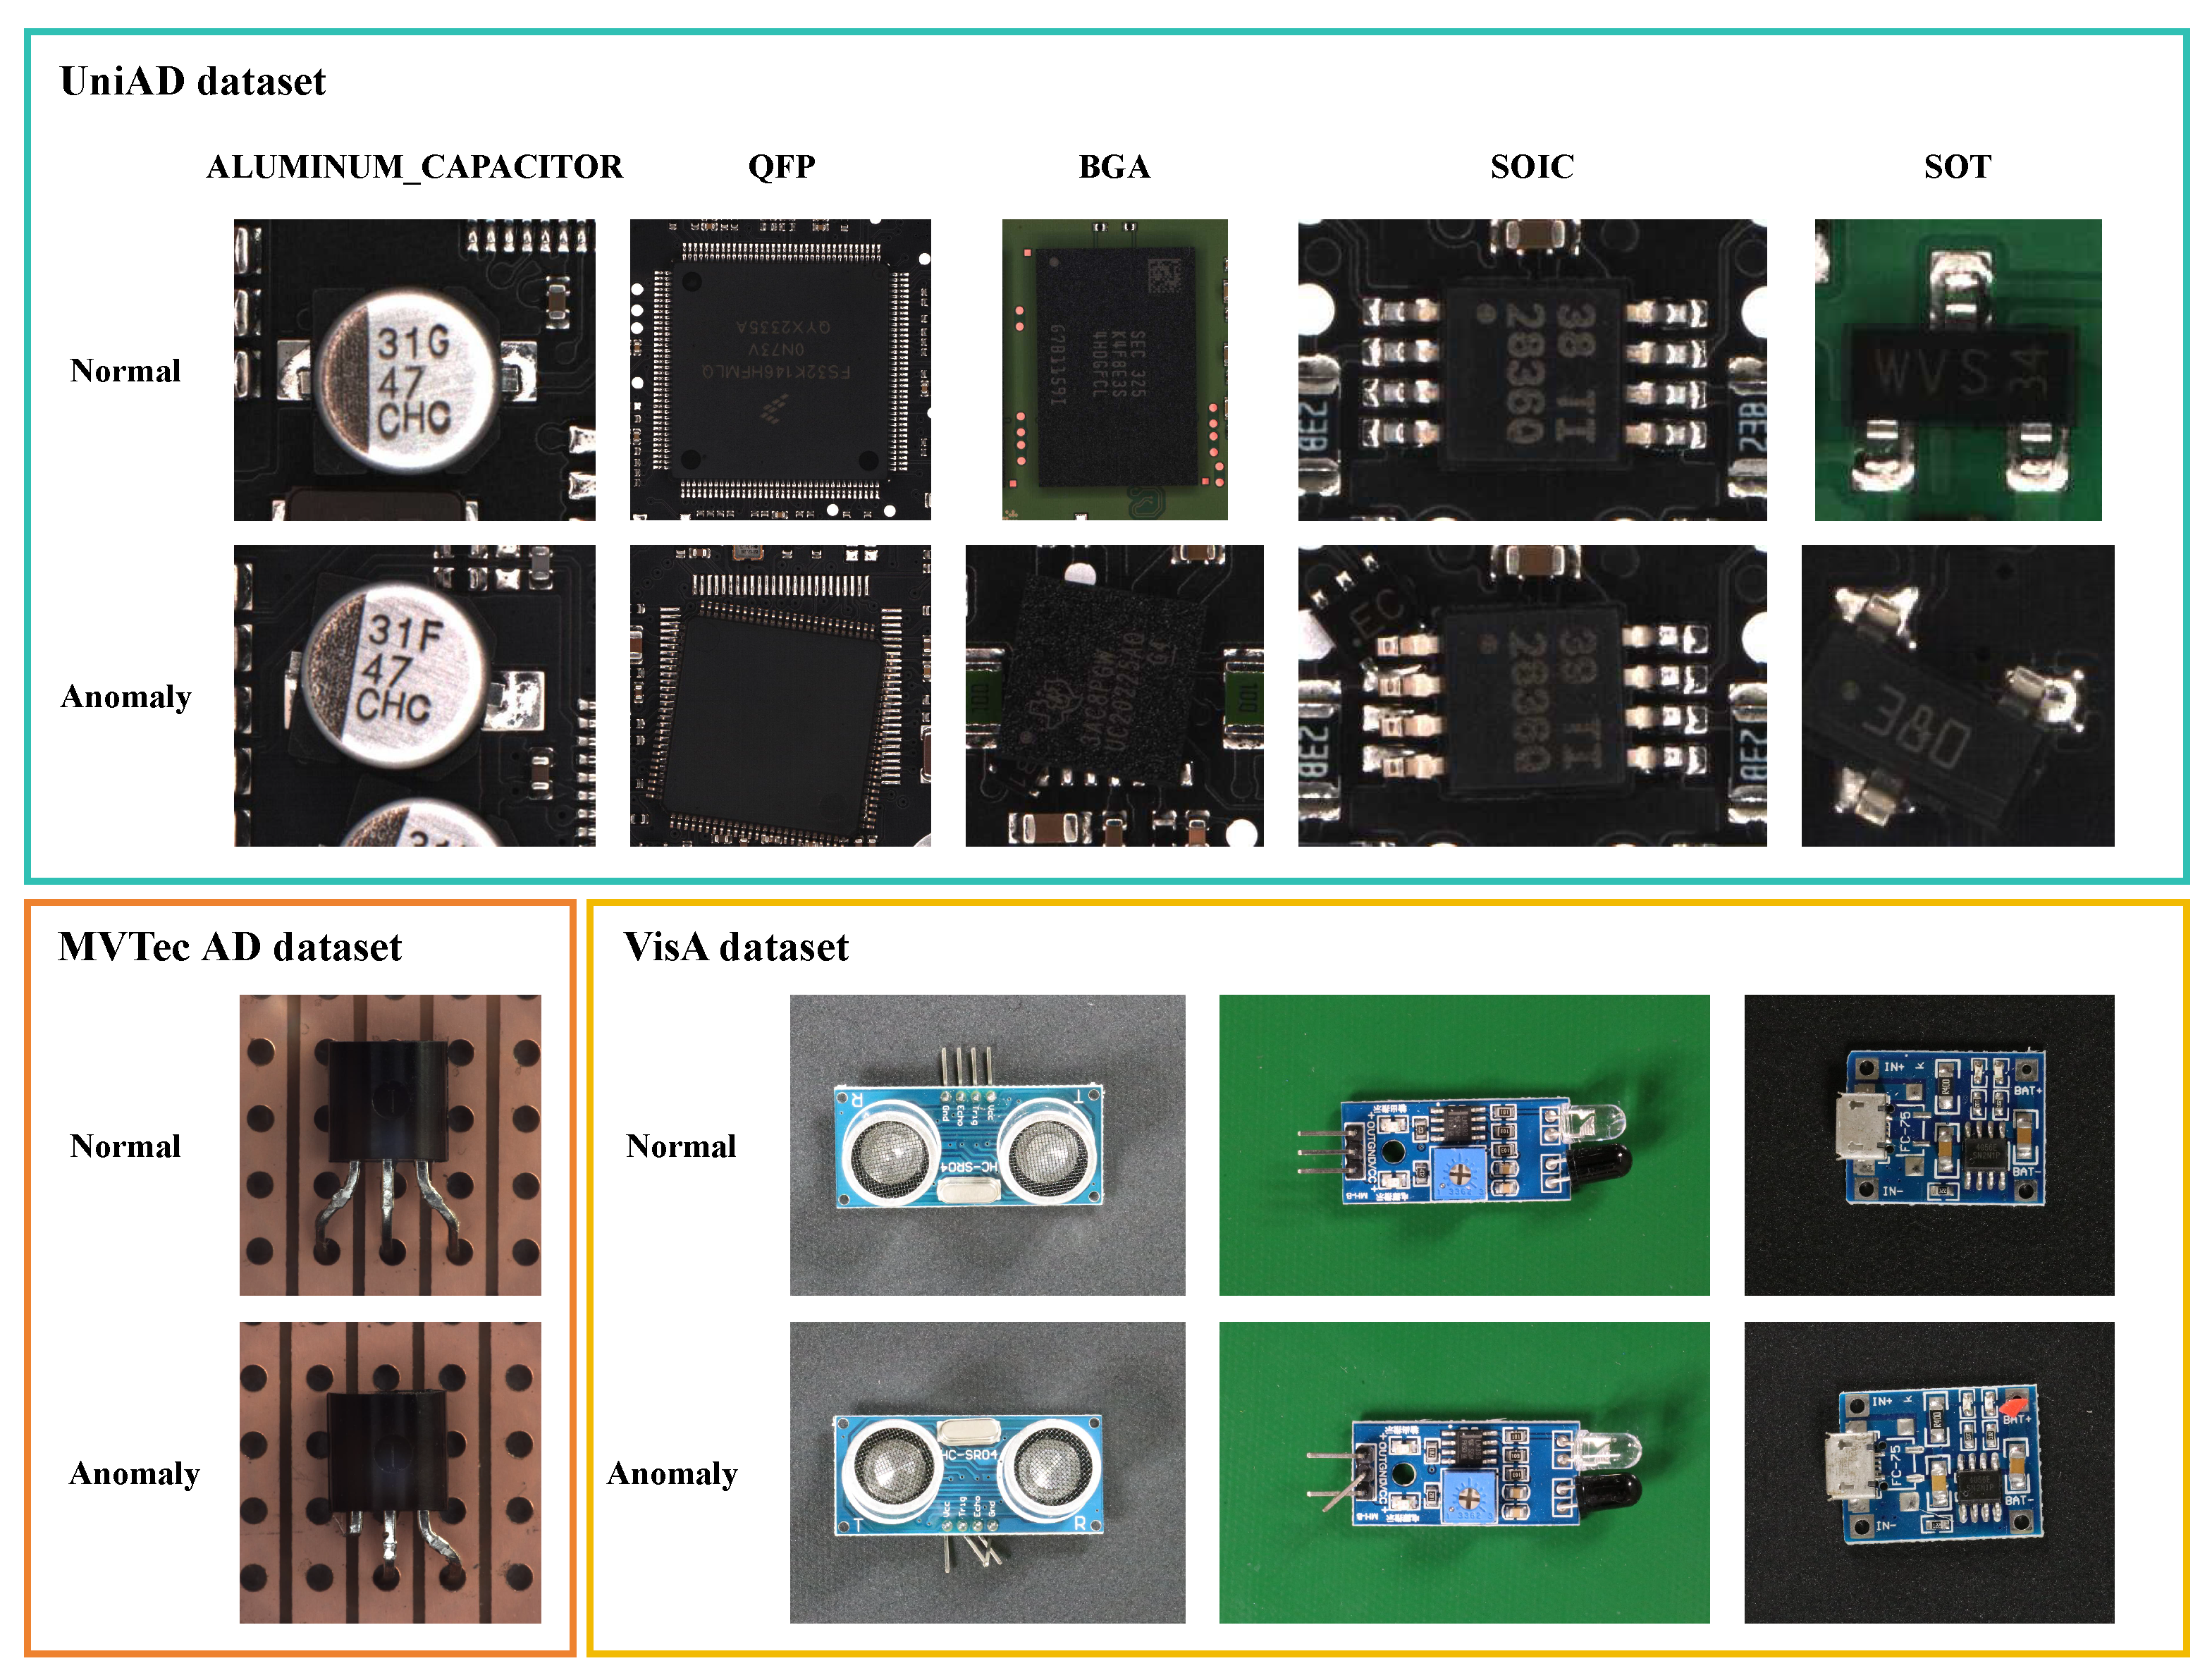
To further illustrate the characteristics of our dataset, we compared representative samples from our UniAD dataset with those from two widely used industrial anomaly detection benchmarks, MVTec AD and VisA. As is shown in Figure 4, the images from UniAD primarily cover diverse electronic components, while MVTec AD and VisA include objects from broader domains such as textiles, food, and packaging. Notably, UniAD captures more realistic defect patterns commonly observed in real-world production lines such as subtle scratches, highlighting its closer alignment with actual industrial inspection scenarios.
Table 5 compares our dataset with several widely used industrial anomaly detection benchmarks across key dimensions. MVTec AD is a classical benchmark for unsupervised anomaly detection, offering both image-level and pixel-level annotations. However, it mainly consists of images captured under controlled laboratory conditions, with relatively simple and easily modeled defect types. VisA introduces multi-instance annotations to better capture complex structural scenarios, yet remains primarily focused on printed circuit boards, limiting its generalizability. Real-IAD, though collected from real production lines, suffers from lower image resolutions and coarse annotation granularity, which hinders its utility for fine-grained localization tasks. Moreover, it falls short in representing the diversity and multi-scale complexity of industrial defects.
Existing datasets often center around single-object scenarios or narrowly defined imaging conditions, lacking the capacity for cross-category generalization. Many rely heavily on synthetic or curated samples, which limits their ability to represent the diverse, subtle, and highly variable nature of defects found in real industrial environments.
In contrast, our dataset encompasses a wide range of 3C electronic components—including capacitors, resistors, transistors, and various chip packages—providing strong category diversity and enabling robust cross-category evaluation. All images are captured from actual production lines and contain numerous fine-grained anomalies with ambiguous boundaries, irregular shapes, and scale variations. This greatly increases the realism and challenge of anomaly detection tasks. Moreover, our dataset offers both image-level and pixel-level annotations, supporting a variety of detection paradigms including classification, localization, and weakly supervised learning. These features make it well-suited for advancing research in generalized anomaly detection, particularly in zero-shot and unified frameworks.
In conclusion, our dataset outperforms existing industrial benchmarks in terms of defect realism, annotation quality, and application coverage. With its high-resolution images and extensive defect diversity drawn from real-world production scenarios, it provides a valuable resource for evaluating and developing next-generation anomaly detection systems. The inclusion of dual-level annotations lays a solid foundation for multi-paradigm research and supports future efforts toward universal, scalable, and data-efficient industrial anomaly detection.

3.2. CLIP Backbone and LORA-Based Fine-Tuning

Contrastive Language–Image Pretraining (CLIP) is a multimodal model that learns a shared embedding space for images and text. It is trained using a contrastive loss on a large-scale dataset consisting of image–caption pairs. Given a batch of N image–text pairs x i , t i CLIP minimizes the following symmetric InfoNCE loss:
L CLIP = 1 2 N i = 1 N log exp sim ( x i , t i ) / τ j = 1 N exp sim ( x i , t j ) / τ + log exp sim ( t i , x i ) / τ j = 1 N exp sim ( t i , x j ) / τ
In our framework, the CLIP model is repurposed for binary classification by comparing an input image with two text prompts: one describing a normal condition and one describing an anomaly. To adapt CLIP to the specialized domain of chip component inspection, we insert LoRA modules into the transformer-based image encoder and text encoder. LoRA introduces only a small number of trainable parameters, enabling efficient adaptation without full model finetuning. Specifically, for each self-attention projection (query, key, value), we apply:
W = W + α A B
where A R d × r , B R r × d , and r d . Only A and B are optimized during training, while the pretrained weights W remain fixed.
This strategy maintains the general-purpose knowledge of the CLIP backbone while introducing flexibility to model local domain-specific variations such as lighting conditions, chip textures, and surface defects. Notably, our method avoids overfitting to specific types of anomalies or sample imbalance by minimizing over-parameterization. This also supports plug-and-play extensibility: new defect types or domains can be supported simply by introducing new prompts, without modifying the model architecture or retraining from scratch.

3.3. Prompt Construction and Similarity-Based Classification

To model normal and abnormal conditions using natural language, we design a domain-aware prompting strategy by explicitly incorporating different chip category names into the prompts. By fine-tuning the model with these prompts, we enable it to learn and retain the distinctive features of each chip category.
Images used in fine-grained visual tasks—such as chip inspection—typically follow a specific distribution that differs significantly from the natural image distribution seen during CLIP’s pretraining. To align the textual and visual token distributions, we propose a domain-aware prompt engineering method that adapts prompts to the characteristics of the target domain.
Specifically, we formulate a unified prompt template that captures key elements relevant to the chip inspection domain:
A [domain] photo of a [state] [class]
Therefore, we define the following two prompts:
  • Normal prompt: “A cropped industrial photo without defect for anomaly detection”
  • Anomalous prompt: “A cropped industrial photo with damage for anomaly detection”
These prompts are processed through the CLIP text encoder, producing two fixed text embeddings t 0 (normal) and t 1 (anomalous). Each input image x is processed through the LoRA-augmented image encoder to yield a visual representation v.
s k = cos ( v , t k ) = v T t k v · t k , k { 0 , 1 }
We compute the cosine similarity between the image and each prompt: We then apply a softmax over the two similarity scores to obtain the predicted probability of each class:
P ( y = k x ) = e s k e s 0 + e s 1
This formulation enables the model to classify each image as either normal or anomalous by comparing its similarity to both semantic prompts.

3.4. Supervised Training with Cross-Entropy Loss

Unlike original CLIP which is trained using a contrastive objective on paired data, our method uses supervised binary labels associated with each training image. Each sample is labeled with y { 0 , 1 } , where 0 indicates a normal image and 1 indicates an anomalous image.
Given the predicted similarity-based probabilities P ( y = k x ) , we define a standard cross-entropy loss:
L cls = log P ( y x ) = log e s y e s 0 + e s 1
This loss encourages the model to maximize the similarity between the image embedding and the correct class prompt, effectively learning to map normal and anomalous samples to their corresponding language-based concepts.
This supervised prompt classification strategy offers several advantages:
  • It enables end-to-end training with clear labels, avoiding the need for reconstruction-based thresholds or latent feature distance heuristics.
  • It generalizes across categories, since the model classifies based on prompt semantics rather than fixed class prototypes.
  • It allows deployment in category-agnostic industrial settings, where defects are rare, unstructured, and continuously evolving.

3.5. Generalization and Robustness

One of the key strengths of our framework is its ability to perform general-purpose anomaly detection. Unlike traditional methods that train separate classifiers or one-class models for each defect type, our approach uses shared prompts and supervised contrastive learning to detect a wide range of anomalies with a single unified model.
The use of LoRA allows the model to adapt to chip-specific visual distributions without forgetting general representations learned by CLIP. The prompt-guided similarity mechanism further provides semantic interpretability and robustness to new or unseen anomalies, enabling better generalization than purely pixel-level or handcrafted-feature-based methods.

4. Experiments and Result

To rigorously evaluate the performance of our proposed unified anomaly detection method, UniCLIP-AD, which is based on CLIP and Low-Rank Adaptation (LoRA), this section presents a series of comprehensive comparative experiments. We conduct a direct comparison between UniCLIP-AD and four state-of-the-art anomaly detection techniques on the multi-category UniAD dataset, as described in Section 3. These experiments are designed to validate the superiority of our method across multiple dimensions, with a particular focus on its cross-category generalization capabilities.

4.1. Experimental Setup

All experiments were conducted on a high-performance computing server equipped with an Intel(R) Xeon(R) Gold 6348 CPU @ 2.60 GHz. The model training and inference processes were accelerated using NVIDIA GPUs within a CUDA 12.2 environment.
All experiments in this section were performed on our custom-built industrial anomaly detection dataset, UniAD, which was detailed in Section 3. Following the standard protocol for Unsupervised Anomaly Detection (UAD), we partitioned the dataset to comprehensively evaluate the model’s defect detection capabilities and generalization performance under real-world conditions. The UniAD dataset encompasses seven distinct subcategories of electronic components, with the detailed sample distribution presented in Table 6.

4.2. Benchmark Methods

To comprehensively and rigorously evaluate the performance of our proposed framework, we have carefully selected four representative benchmark methods from the field of industrial anomaly detection for a horizontal comparison. The selection of these methods adheres to three key principles. First, they cover mainstream technical paradigms, including data augmentation-based self-supervised methods, feature adaptation-based discriminative methods, and reconstruction-based generative methods, aligning with the technical landscape reviewed in Section 2, “Related Work.” Second, each has achieved industry-recognized outstanding performance in its respective domain. Third, and most critically, their inherent limitations precisely correspond to the core challenges this research aims to address—namely, category dependency, insufficient generalization to new classes, and the domain gap between synthetic anomalies and real defects.
Through direct comparison with these methods, we can clearly measure and highlight the unique advantages of our framework in building a unified, cross-category, and sensitive-to-real-defect general-purpose anomaly detection model. Specifically, the selected benchmark methods include:
  • CutPaste [26] is a classic data augmentation-based self-supervised learning method. It generates synthetic anomalies by cutting and pasting image patches onto random locations of normal images. By training a binary classification model on both the original normal samples and these synthetic anomalies, CutPaste effectively enhances the model’s sensitivity to local inconsistencies and structural errors. However, this method suffers from an inherent limitation: a significant “domain gap” exists between its synthetic anomalies and real industrial defects. The generated patches, lacking diversity in morphology and texture, can only crudely simulate defect features and fail to accurately cover the complex and varied patterns of real-world anomalies.
  • SimpleNet [27] is an efficient discriminative method that leverages powerful features extracted by deep neural networks pre-trained on large-scale datasets, demonstrating excellent performance in single-class anomaly detection tasks. To further enhance its discriminative power against anomalies, SimpleNet strategically injects Gaussian noise into the pre-trained feature space to generate diverse abnormal features. It also introduces shallow feature adapters to reduce the distributional shift between the pre-trained features and the target domain data. Although these strategies have led to high detection AUROC (Area Under the Receiver Operating Characteristic Curve) on benchmark datasets like MVTec AD, SimpleNet still relies on training independently with sufficient normal samples for each category, and its detection capability is confined to known, trained object classes.
  • CFA [4] (Coupled-hypersphere-based Feature Adaptation) is a feature adaptation method based on transfer learning. It fine-tunes pre-trained features by introducing learnable target-oriented patch descriptors and a scalable memory bank. The core idea is to increase the separability between normal and abnormal features by optimizing the features of normal samples to be more compact in a hyperspherical space. CFA has shown excellent detection performance on single-target datasets, achieving high AUROC. However, it is inherently designed for specialized adaptation to a specific category’s dataset. Extending it to a multi-category scenario necessitates repeating the entire adaptation process for each class, thus lacking cross-category generalization capability.
  • DSR [28] (Dual-Space Reconstructor) is a generative model-based anomaly detection method. It innovatively proposes a dual-decoder reconstruction architecture and directly generates abnormal samples within the model’s latent space, thereby avoiding reliance on external anomaly datasets. This endogenous anomaly generation mechanism significantly improves the model’s detection performance on “near-distribution” anomalies. However, DSR’s architecture is relatively complex, and its performance is highly dependent on the effectiveness of anomaly simulation in the latent space. It still lacks the capability to directly model and generalize to significant distributional differences between categories and to completely unknown defects in the real world that deviate substantially from the training data distribution.
  • AnomalyCLIP [29] is a recent CLIP-based zero-shot anomaly detection framework that introduces an object-agnostic prompt learning strategy to enhance cross-domain generalization. By decoupling anomaly understanding from specific object semantics, it learns domain-invariant textual prompts for “normal” and “abnormal” patterns. During inference, anomaly scores are computed via the cosine similarity between image embeddings and the abnormal prompt embedding. In this study, AnomalyCLIP is included as a recent CLIP variant baseline, reproduced under identical preprocessing and evaluation settings for fair comparison.

4.3. Evaluation Metrics

In the context of industrial anomaly detection, evaluation metrics must reflect the practical challenges of detecting rare and diverse defects in real-world settings. Since the task is formulated as a binary classification problem—where the model must determine whether an input chip image is normal or anomalous—we adopt two primary metrics: Area Under the ROC Curve (AUC) and F1-Score.
Area Under the ROC Curve (AUC). The AUC measures the model’s ability to distinguish between normal and anomalous samples across all possible classification thresholds. It is computed by plotting the Receiver Operating Characteristic (ROC) curve, which shows the true positive rate (recall) against the false positive rate at varying thresholds.
T P R = T P T P + F N
F P R = F P F P + T N
A U C = 0 1 T P R ( F P R ) d F P R
A high AUC (closer to 1.0) indicates that the model ranks positive samples (anomalies) higher than negative ones (normals), even if a specific threshold has not been chosen. This is particularly important in our setting where the decision boundary may shift across different production environments, and a reliable ranking of anomaly likelihood is valuable for downstream quality control systems.
F1-Score. The F1 score is the harmonic mean of precision and recall, and is especially relevant for tasks with imbalanced classes such as ours. Precision measures how many predicted anomalies are correct, while recall reflects how many actual anomalies were successfully detected.
In industrial applications, both false positives and false negatives have significant cost implications:
  • High recall ensures that defective components are not mistakenly passed as normal.
  • High precision reduces unnecessary alarms and manual inspections.
Therefore, the F1 score provides a balanced measure of model quality under these competing objectives. In our experiments, we report the F1 score at the optimal threshold (determined on a validation set) to reflect the model’s effectiveness in real deployment scenarios.

4.4. Experimental Results and Analysis

4.4.1. Overall Cross-Category Performance

To validate the macroscopic performance of our proposed method on the Unified Anomaly Detection (Uni-AD) task, we first conducted an overall performance evaluation on the full test set of the UniAD dataset. This experiment adhered to the unified training (uni-training) paradigm, where all methods were trained on a mixed training set containing normal samples from all seven subcategories. The results, presented in Table 7, clearly demonstrate the significant advantages of our method, UniCLIP-AD.
The experimental results show that our proposed UniCLIP-AD exhibits unequivocal superiority in the unified anomaly detection task. On the AU-ROC metric, which measures the overall discriminative ability of the model, UniCLIP-AD achieved 92.1%, marking a significant performance improvement of 3.8 percentage points over the next-best method, CFA (88.3%). This result indicates that our model can more reliably and stably distinguish abnormal samples from normal ones.
Even more striking is the performance on the F1-Score metric. The F1-Score, which harmonizes Precision and Recall, is crucial for evaluating a model’s balanced performance in practical applications. UniCLIP-AD achieved a remarkable score of 89.8% on this metric, creating a substantial gap with all baseline methods; for instance, it outperformed the next-best, CutPaste (66.0%), by 23.8 percentage points. This phenomenon is particularly evident with SimpleNet, which, despite a decent AU-ROC of 84.8%, saw its F1-Score plummet to 44.7%. This reveals a deep-seated issue: although traditional methods possess some theoretical discriminative potential, their prediction score distributions for normal and abnormal samples severely overlap after being trained on mixed categories. This makes it impossible to find an effective decision threshold that balances a low false negative rate and a low false positive rate. Such a limitation is critical in practical industrial deployment, as it implies the model would either be overly sensitive (leading to numerous false alarms) or overly insensitive (resulting in many missed detections).
We argue that the root cause of this performance disparity lies in the fundamental paradigms of the different methods:
  • Limitation of Baseline Methods—The Dilemma of Distribution Fitting: Traditional methods, whether based on data augmentation (CutPaste), feature discrimination (SimpleNet, CFA), or image reconstruction (DSR), all fundamentally attempt to learn a compact “normal” data distribution that represents all training samples. While this strategy is effective in single-category tasks, the target distribution in a unified detection scenario becomes exceedingly complex, multi-modal, and even internally discontinuous due to the mixture of normal samples from seven different categories. Forcing a single model to fit such a complex distribution inevitably leads to inter-class interference, causing the model to over-generalize in order to accommodate all “normal” variations. This results in a loss of sensitivity to the fine-grained features of individual categories, ultimately manifesting as performance degradation and ambiguous decision-making.
  • Advantage of UniCLIP-AD—Adaptation Based on Prior Knowledge: Our method addresses this problem from a fundamentally different perspective. Instead of learning a complex distribution from scratch, we build upon the strong foundation of CLIP. The frozen CLIP vision encoder provides a powerful, semantically coherent feature space, pre-trained on massive image–text pairs, which endows it with universal prior knowledge about what constitutes a “normal object.” Our core task shifts from difficult distribution fitting to efficient domain adaptation. By inserting lightweight LoRA modules for fine-tuning, we use a minimal number of parameters (only the LoRA parts) to capture the specific industrial domain features of the UniAD dataset and “inject” them into CLIP’s powerful general-purpose representations. This “universal prior + precise adaptation” strategy enables the model to understand both the commonalities of “resistors” and “BGA chips” as normal industrial components and their subtle differences. This leads to high-precision, high-confidence decisions in the unified detection task, ultimately reflected in the dual leadership in both AU-ROC and F1-Score.

4.4.2. Per-Category Performance Breakdown

To further investigate the generalization capability and stability of each method, we present their AU-ROC and F1-Score performance on each subcategory in Table 8 and Table 9. These results not only reveal the details behind the overall average performance but also validate the robustness of our method in accomplishing the unified anomaly detection task.
Through a detailed examination of the tabular data, we can distill two core, mutually reinforcing observations:
  • Superior Consistency and Overwhelming Advantage of Our Method: Our model demonstrates excellent and consistent performance across all subcategories. On the AU-ROC metric (Table 9), a key indicator of classification ability, it scored above 94% on all seven categories, achieving near-perfect scores of 99% on several, including CAPACITOR and RESISTOR. This indicates that our model has successfully learned a highly generalizable discriminative criterion applicable to chip components with diverse morphologies, textures, and functions. Similarly, on the more stringent and practically relevant F1-Score metric (Table 8), our method ranked first in multiple categories such as BGA, CAPACITOR, and RESISTOR, while also showing highly competitive performance in the remaining ones. This comprehensive and balanced excellence proves that our model does not exhibit category-specific biases but has successfully constructed a unified model capable of generalizing across the entire chip inspection domain.
  • Performance Instability and Scenario-Dependency of Benchmark Methods: In stark contrast to the stable performance of our method, all baseline methods exhibited significant performance imbalances. Their effectiveness was highly correlated with the component category being processed, exposing the inherent limitations of their technical paradigms.
For instance, CutPaste performed adequately on categories with clear structural contours like DPAK (F1: 88.3%) and QFN (F1: 95.4%), as its “cut-and-paste” operation can effectively simulate structural defects. However, when faced with the more texturally complex RESISTOR category, its F1-Score plummeted to 46.1%, and its AU-ROC was only 45.9%, nearly equivalent to random guessing. This suggests its data augmentation strategy fails to effectively simulate subtle textural anomalies.
Although CFA achieved an extremely high F1-Score of 98.7% on the SOD category, demonstrating the powerful potential of its feature adaptation mechanism on specific classes, its performance on the QFN category (F1: 55.1%) was far inferior, indicating that its adaptation process may be less sensitive to the feature distributions of certain categories.
DSR’s performance fluctuated particularly dramatically. It performed well on CAPACITOR (F1: 71.4%) but almost completely failed on RESISTOR (F1: 5.4%), highlighting the immense challenge its strategy of generating anomalies in latent space faces when attempting to simulate diverse, cross-category real-world defects.
This widespread phenomenon of category-specific performance bias provides strong evidence that when these traditional methods are forced into a “unified detection” task, their core mechanisms struggle to adapt to the diversity of the data distribution, leading to severe performance degradation on certain categories.

4.4.3. Result Analysis

Synthesizing the detailed cross-category comparisons above, we can draw the following conclusions:
On the UniAD dataset, our proposed method not only comprehensively surpasses all benchmark methods with an average AU-ROC of 92.1% and an average F1-Score of 89.8%, but more importantly, this advantage is not an artifact of averaging extreme performance on a few categories. Instead, it maintains a leading or top-tier performance across almost all subcategories.
The root cause of this performance gap lies in a fundamental difference in model paradigms. Traditional methods, whether based on reconstruction, feature adaptation, or data augmentation, are designed to model the compact distribution of normal samples for a single category. When tasked with handling training data from multiple mixed categories, the “normal” model they attempt to learn becomes an “averaged-out,” blurry, and compromised wide-ranging representation. This model is insufficiently precise for any specific category, rendering it ineffective when confronting anomalies from that particular class.
Our method fundamentally resolves this issue. It does not learn a mixed distribution from scratch but instead skillfully leverages the powerful visual prior knowledge of the CLIP model. The frozen CLIP backbone provides a high-dimensional, abstract semantic prior, enabling it to understand the conceptual difference between “flawless industrial components” and “damaged industrial components,” rather than being confined to the pixel-level textures of a specific chip type. Building on this solid foundation, the lightweight LoRA modules only need to learn a small number of critical domain adaptation parameters to precisely align this general semantic understanding with the specific domain of industrial chip inspection. This combination of a “universal semantic foundation + targeted domain fine-tuning” allows the model to move beyond the rote memorization of specific physical features and achieve a deeper understanding of the concept of “anomaly”.
As shown in Table 10, the model’s performance is highly consistent across different textual prompts, indicating that our framework is not overly sensitive to prompt wording. Even when replacing the default prompt with alternative hand-written sentences of varying semantics, the average AUROC only fluctuates within 0.4%, demonstrating the robustness of CLIP’s language–vision alignment under industrial contexts. Moreover, introducing a learnable soft prompt yields a modest yet consistent improvement (+1.2% AUROC on average). This suggests that learnable prompt tokens can better adapt textual representations to specific visual domains, capturing subtle cross-category semantics that static templates may overlook. Importantly, this enhancement requires minimal additional parameters (<0.1 M) and no change to the CLIP backbone or LoRA configuration, keeping the method efficient and easily deployable. These findings verify that our unified framework is robust and adaptable in practice: it generalizes well across diverse product categories without being heavily dependent on handcrafted textual inputs, and can be easily extended to new product types by adjusting or learning prompt tokens rather than retraining the entire model.
Therefore, the experimental results strongly demonstrate that our method far exceeds existing technologies in terms of robustness and generalization. It provides an effective and efficient path toward achieving true, category-agnostic Unified Anomaly Detection (Uni-AD), showcasing its immense potential and practical value as a universal solution for industrial quality inspection.

4.4.4. Comparative Analysis with AnomalyCLIP and Cross-Domain Validation

To further verify the effectiveness and cross-domain robustness of the proposed UniCLIP-AD, we reproduced the official implementation of AnomalyCLIP and conducted comparative experiments under identical settings. Both methods were evaluated on our UniAD dataset and the public MVTec AD benchmark to assess performance consistency across different industrial domains. The results demonstrate that UniCLIP-AD consistently outperforms AnomalyCLIP on both datasets. Specifically, UniCLIP-AD achieves an average AU-ROC of 97.6% on MVTec AD, which is higher than AnomalyCLIP’ s 95.8%, and obtains 92.1% AU-ROC and 89.8% F1-score on UniAD. These results indicate that UniCLIP-AD possesses stronger generalization capability and better cross-category adaptability. To evaluate the statistical reliability of the observed improvements, we performed two-tailed paired t-tests across all product categories. The resulting p-values, listed in Table 11, confirm that UniCLIP-AD significantly outperforms AnomalyCLIP on both datasets (p < 0.05). These outcomes indicate that the gains are not attributable to random fluctuation, but stem from the enhanced cross-domain adaptability conferred by our LoRA-based lightweight fine-tuning strategy. Overall, these findings confirm that UniCLIP-AD achieves superior anomaly detection performance while maintaining robustness and generalization across different industrial datasets.

4.4.5. Additional Comparison with Other Supervised Methods

To further validate that the performance gains of UniCLIP-AD are not merely due to supervised training, we compared it against two standard fully supervised architectures: a fine-tuned ResNet-50 classifier and a Vision Transformer (ViT-Supervised). Both models were trained using the same binary labels and train/test splits as UniCLIP-AD. As shown in Table 12, although the supervised baselines performed well on several categories, they exhibited significant performance variation across categories and lower average results. UniCLIP-AD achieved consistently higher AUROC (92.1%) and F1-Score (89.8%) than both supervised baselines. These findings indicate that the superior performance of UniCLIP-AD stems from its semantic-driven generalization rather than the supervision level alone. Its unified prompt-based design allows a single model to handle multiple categories effectively, demonstrating better scalability and practicality for industrial deployment.

4.5. Ablation Results

To evaluate the effectiveness of the proposed LoRA-based fine-tuning strategy, we conduct an ablation study comparing two variants of the model: CLIP-zero shot, which directly applies the pretrained CLIP model without any adaptation, and CLIP-lora, which introduces LoRA modules into the image encoder and trains them using our supervised prompt-based classification loss. The evaluation results are summarized in Table 13. We observe that: The zero-shot CLIP achieves an AUROC of 63.2% and an F1 Score of 67.4%, indicating limited anomaly detection capability when directly applied to industrial chip data without domain adaptation. In contrast, the CLIP-lora variant significantly improves both metrics, achieving an AUROC of 92.1% and an F1 Score of 89.8%. This demonstrates that even a lightweight adaptation of the image encoder via LoRA can substantially enhance the model’s ability to discriminate between normal and anomalous samples. These results validate the importance of domain-specific fine-tuning. The large performance gap highlights that while CLIP has strong general representations, task-specific supervision is crucial in specialized domains such as chip anomaly detection. Our LoRA-based tuning approach enables this adaptation without modifying the large backbone, maintaining efficiency and generalization.
To examine the robustness of UniCLIP-AD, As shown in Table 14, we study the effect of two major hyperparameters: the LoRA rank r and the number of training epochs. Since our task remains a binary anomaly detection problem across multiple product domains, the goal is to verify whether these parameters affect cross-category generalization or overfitting. The model’s performance remains consistent across ranks and epochs, confirming that LoRA adaptation primarily captures low-rank domain shifts that generalize well to unseen product types. A moderate rank (r = 8) and 5 epochs provide the best trade-off between efficiency and accuracy, with minimal risk of overfitting.
This section has systematically validated the effectiveness of our proposed UniCLIP-AD method through comprehensive quantitative and qualitative comparative experiments. The results clearly indicate that in the task of unified anomaly detection across multiple categories, our method comprehensively surpasses existing mainstream technologies in both AU-ROC and F1-Score. More importantly, the per-category performance breakdown and case studies further confirm that this advantage stems from its strong generalization capability and robustness, enabling it to maintain consistently high performance across different categories. These findings offer a novel, efficient, and viable paradigm for addressing the complex and varied challenges of real-world industrial quality inspection.

4.6. Visualization of LoRA Adaptation

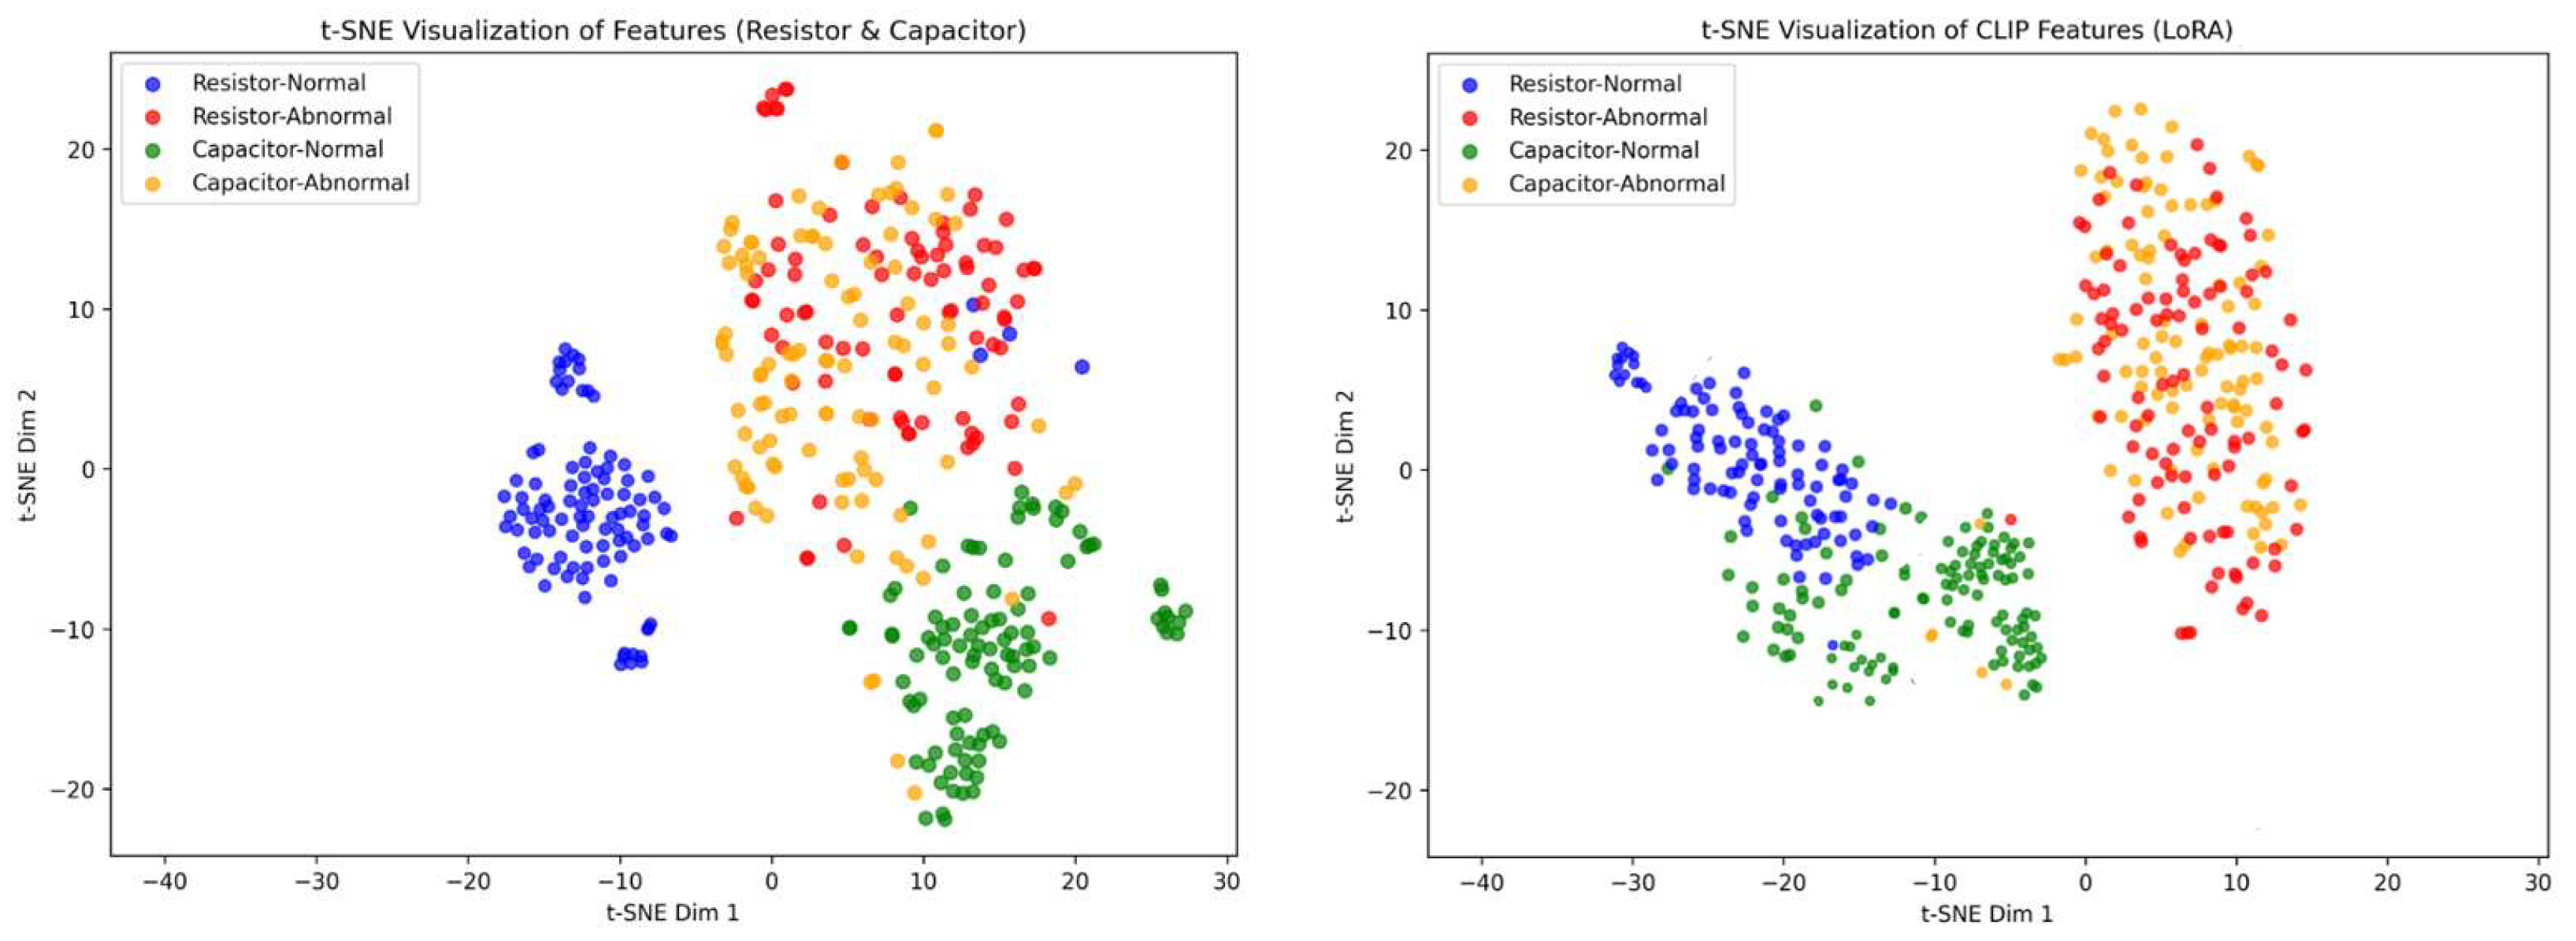
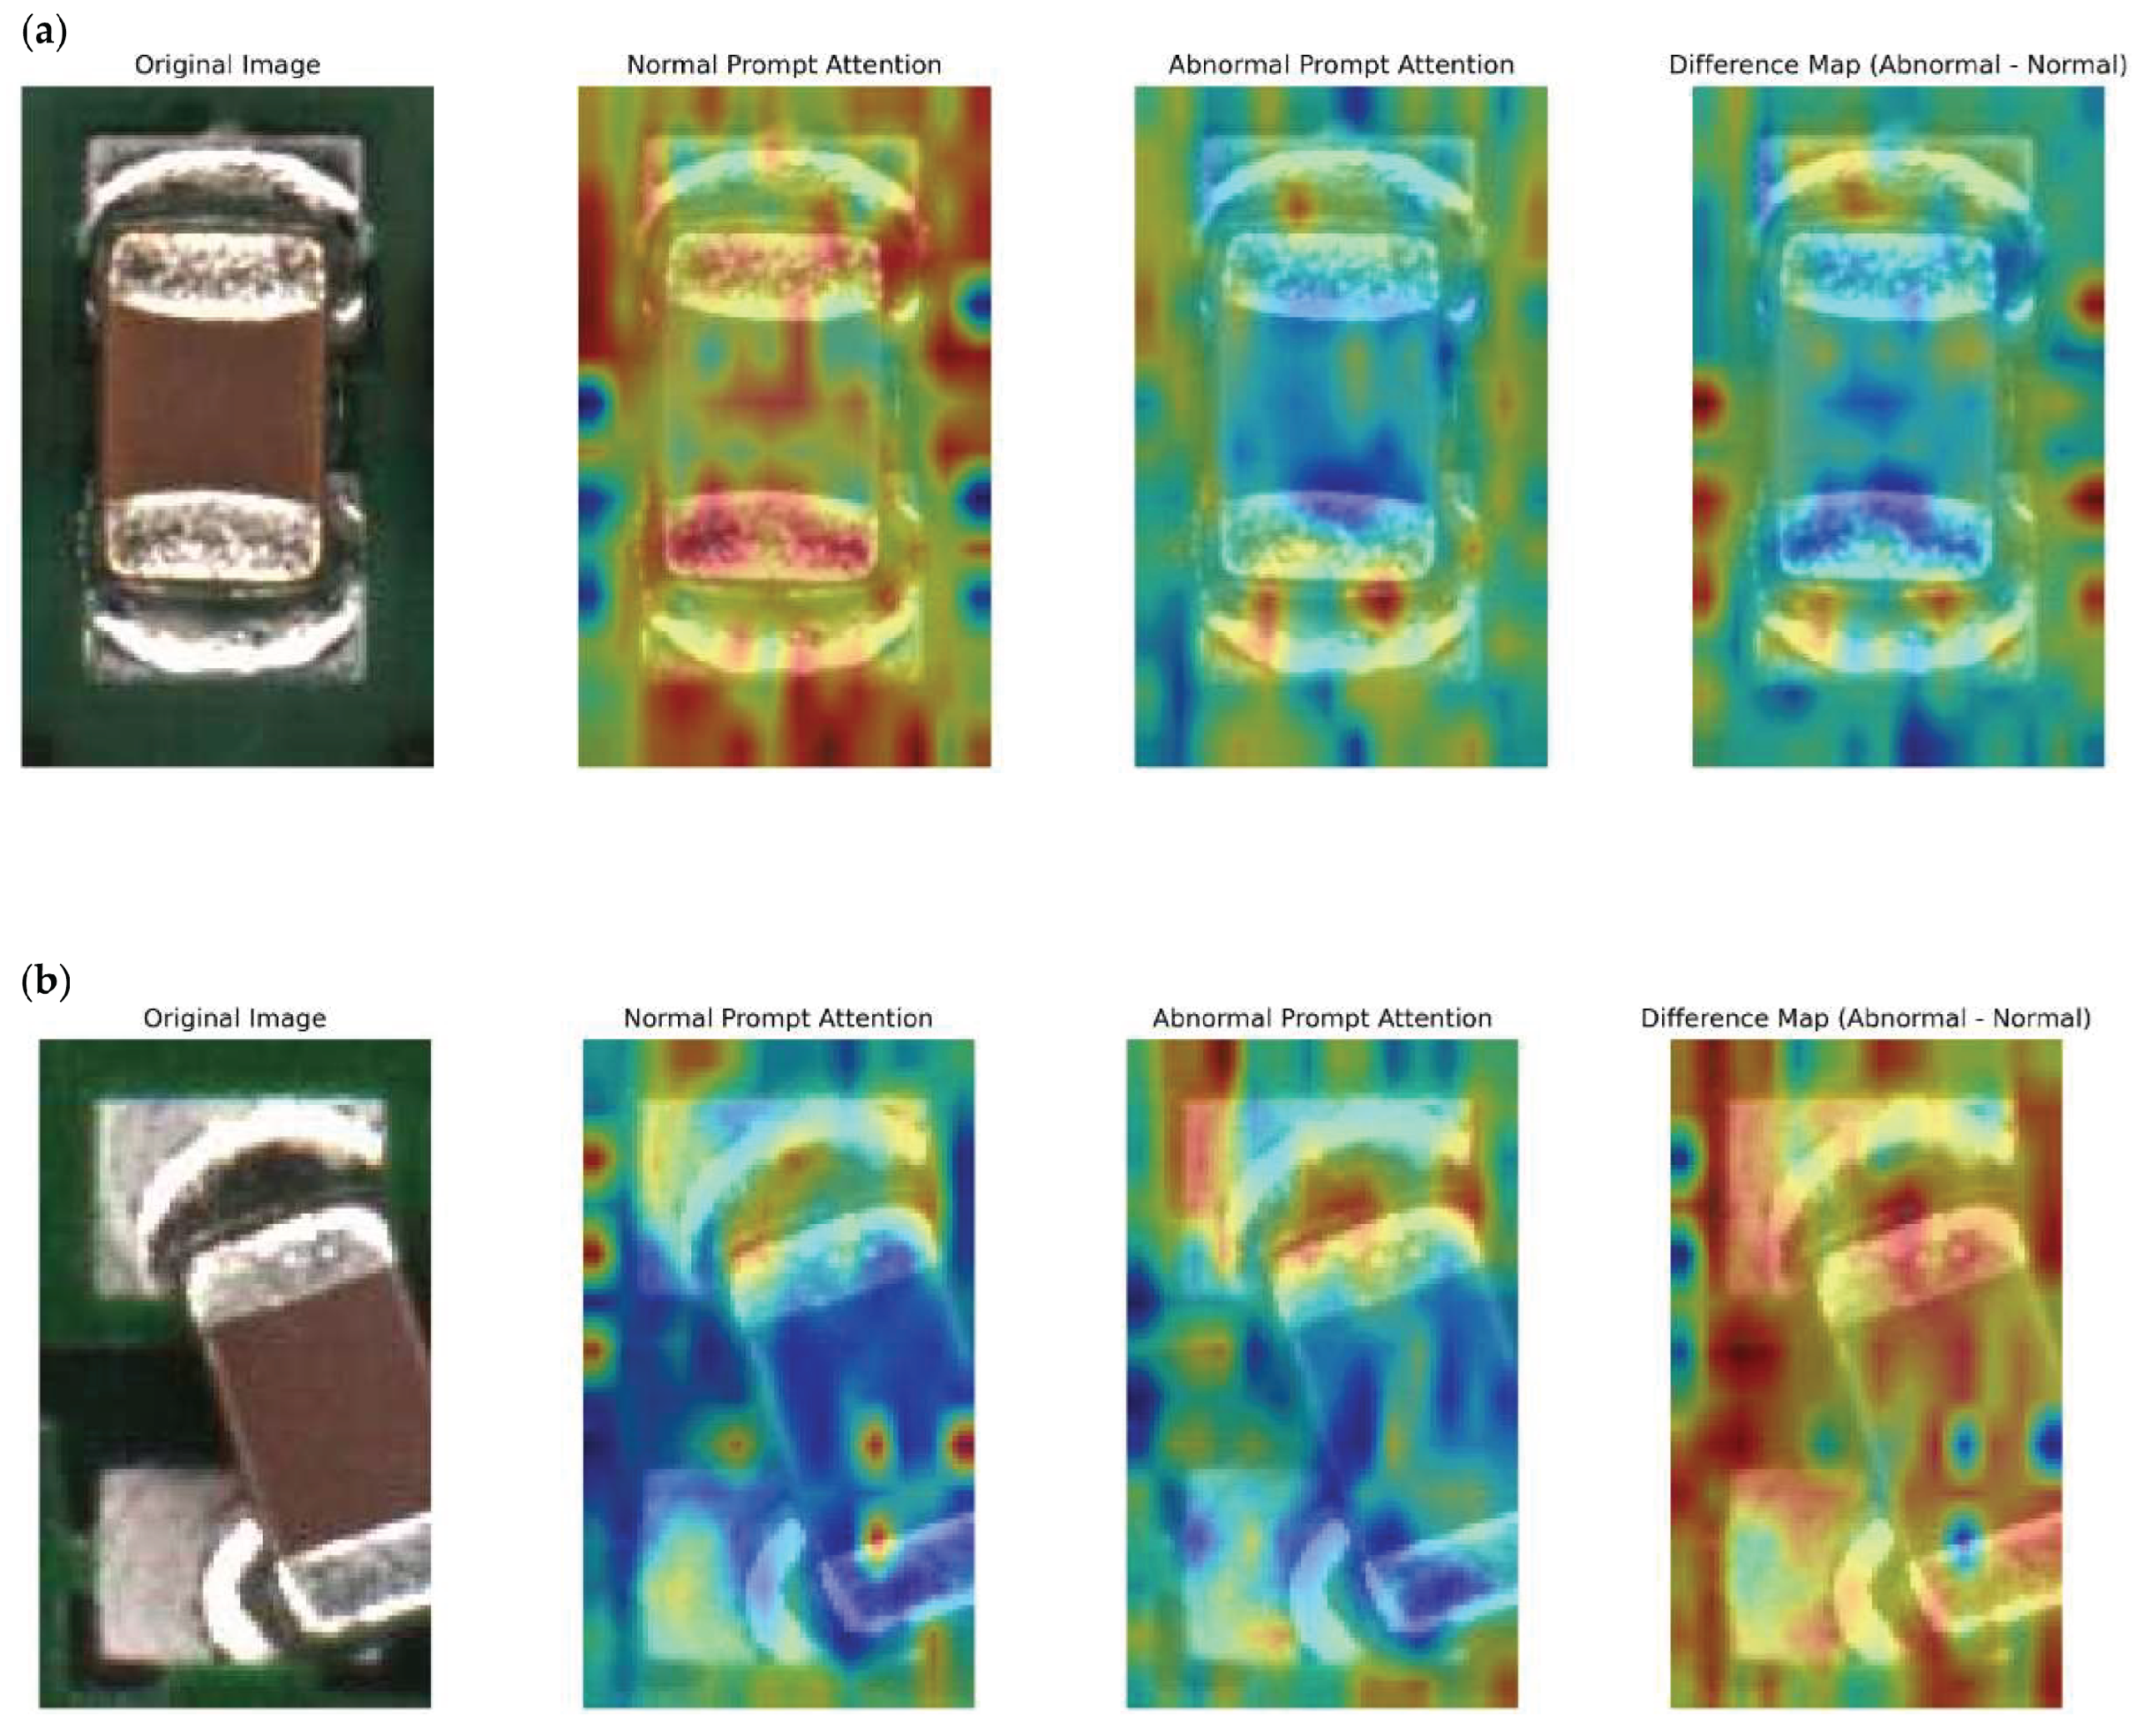
To further understand the behavior of LoRA adaptation, we analyze both the embedding space and the attention distribution before and after adaptation. Figure 5 illustrates t-SNE projections of CLIP embeddings on two representative categories from UniAD. The heatmap visualizations in Figure 6 provide valuable insights into how the model processes both normal and abnormal images. The heatmaps are generated under three different conditions.
  • Normal Prompt Attention: Shows even attention across normal capacitor features.
  • Abnormal Prompt Attention: Reveals focused attention on anomalous regions in abnormal images.
  • Difference Map: Highlights significant attention shifts towards anomalies when comparing abnormal and normal prompts.
These visualizations confirm that LoRA improve defect detection accuracy. The results demonstrate that LoRA maintains cross-category semantic alignment while enhancing the separability of anomalous features.

4.7. Robustness to Noisy and Imbalanced Data

To further assess the robustness of UniCLIP-AD under real-world imperfections such as noisy labels and class imbalance, we conducted two additional experiments.
(1)
Few-shot and Imbalanced Categories: We evaluated the model on categories with limited defect samples (BGA and SOT).
(2)
Noisy Labels: We randomly introduced 10% label corruption into the RESISTOR training set.
Results are shown in Table 15, where UniCLIP-AD retains high robustness with only moderate degradation (average AUROC drop of 3.2% and F1-score drop of 3.9%) compared to clean training.
This stability demonstrates that the model effectively leverages semantic priors and avoids overfitting through LoRA-based fine-tuning, maintaining reliable detection under imperfect industrial data conditions.

4.8. Generalization Evaluation

Building on the cross-dataset experiments described in Section 4.4, we further analyze the generalization capability of UniCLIP-AD. The consistent performance improvements observed on both UniAD and MVTec AD demonstrate that our model is not overfitted to a specific dataset but effectively transfers to different industrial domains.
The results indicate that the proposed LoRA-based lightweight fine-tuning strategy enables UniCLIP-AD to retain strong vision–language alignment while adapting to variations in texture, material, and defect distribution across datasets. This ensures that the model can generalize to unseen manufacturing scenarios with minimal domain shift.
Overall, the experiments confirm that UniCLIP-AD achieves robust generalization and domain transferability, which is essential for practical industrial anomaly detection applications.

4.9. Practical Deployment Considerations

To evaluate the deployability of UniCLIP-AD in real-world inspection pipelines, we analyzed its computational efficiency and practical trade-offs. The LoRA-enhanced CLIP model processes a 224 × 224 image in ≈55 ms on a single NVIDIA RTX 4090 GPU (batch = 16), achieving a throughput of ∼18 fps while maintaining GPU utilization below 35%. Memory consumption remains under 4.6 GB, and the lightweight LoRA adaptation adds only 80 MB to the model size (<1% parameter increase), enabling on-device deployment on mid-range GPUs or optimized edge hardware.
These results indicate that UniCLIP-AD meets the latency and efficiency requirements of most real-time industrial vision systems. Nevertheless, challenges such as long-tailed defect distributions and hardware constraints in low-power environments still exist. In practice, balanced sampling and adaptive thresholding can alleviate imbalance, while quantization or model distillation may further reduce deployment cost. Future work will explore these directions to enhance scalability and robustness in full production environments.

5. Conclusions

This work addresses the limitations of category-specific approaches in industrial anomaly detection by introducing a unified framework and a large-scale benchmark called UniAD. By leveraging vision–language pretraining with efficient adaptation, our method enables a single model to handle diverse product types while maintaining high detection accuracy. Experiments on real manufacturing data validate its effectiveness, showing clear improvements in scalability and cross-category generalization. Methodologically, the framework moves beyond compact distribution modeling and instead captures high-level semantic cues of abnormality. Through lightweight domain adaptation, it effectively distinguishes subtle, realistic defects across multiple categories. Complemented by a new dataset with diverse defect types and fine-grained annotations, this work provides both a practical solution and a strong foundation for future research. Empirical results demonstrate consistent gains over state-of-the-art baselines, particularly in mixed-category scenarios where conventional methods struggle. These findings highlight the promise of semantic-driven detection for industrial inspection, offering reduced deployment costs and improved generality. Future extensions of the dataset to broader industrial domains will further support the development of robust, universal anomaly detection systems.

Author Contributions

Conceptualization, J.Y.; Methodology, J.Y.; Software, J.Y.; Validation, C.D.; Resources, C.D.; Data curation, C.D.; Writing—original draft, J.Y.; Writing—review and editing, J.C. All authors have read and agreed to the published version of the manuscript.

Funding

This research received no external funding.

Institutional Review Board Statement

Not applicable.

Informed Consent Statement

Not applicable.

Data Availability Statement

The data presented in this study are available on request from the corresponding author. The data are not publicly available due to confidentiality agreements with the industrial partners. As the dataset originates from actual manufacturing plants, it contains sensitive operational and production information that cannot be disclosed openly for reasons of industrial secrecy and data security. Access may therefore be granted upon reasonable request and subject to approval under these restrictions.

Conflicts of Interest

The funders had no role in the design of the study; in the collection, analyses, or interpretation of data; in the writing of the manuscript; or in the decision to publish the results.

References

  1. Zavrtanik, V.; Kristan, M.; Skočaj, D. Draem-a discriminatively trained reconstruction embedding for surface anomaly detection. In Proceedings of the IEEE/CVF International Conference on Computer Vision, Virtual, 11–17 October 2021; pp. 8330–8339. [Google Scholar]
  2. Qiang, Y.; Cao, J.; Zhou, S.; Yang, J.; Yu, L.; Liu, B. tGARD: Text-Guided Adversarial Reconstruction for Industrial Anomaly Detection. IEEE Trans. Ind. Inform. 2025. [Google Scholar] [CrossRef]
  3. Roth, K.; Pemula, L.; Zepeda, J.; Schölkopf, B.; Brox, T.; Gehler, P. Towards total recall in industrial anomaly detection. In Proceedings of the IEEE/CVF Conference on Computer Vision and Pattern Recognition, New Orleans, LA, USA, 21–24 June 2022; pp. 14318–14328. [Google Scholar]
  4. Lee, S.; Lee, S.; Song, B.C. Cfa: Coupled-hypersphere-based feature adaptation for target-oriented anomaly localization. IEEE Access 2022, 10, 78446–78454. [Google Scholar] [CrossRef]
  5. Bergmann, P.; Fauser, M.; Sattlegger, D.; Steger, C. MVTec AD—A comprehensive real-world dataset for unsupervised anomaly detection. In Proceedings of the IEEE/CVF Conference on Computer Vision and Pattern Recognition, Long Beach, CA, USA, 15–20 June 2019; pp. 9592–9600. [Google Scholar]
  6. Zou, Y.; Jeong, J.; Pemula, L.; Zhang, D.; Dabeer, O. Spot-the-difference self-supervised pre-training for anomaly detection and segmentation. In Proceedings of the European Conference on Computer Vision, Tel Aviv, Israel, 23–27 October 2022; Springer: Berlin/Heidelberg, Germany, 2022; pp. 392–408. [Google Scholar]
  7. Wang, C.; Zhu, W.; Gao, B.B.; Gan, Z.; Zhang, J.; Gu, Z.; Qian, S.; Chen, M.; Ma, L. Real-iad: A real-world multi-view dataset for benchmarking versatile industrial anomaly detection. In Proceedings of the IEEE/CVF Conference on Computer Vision and Pattern Recognition, Seattle, WA, USA, 17–21 June 2024; pp. 22883–22892. [Google Scholar]
  8. Zuo, Z.; Wu, Z.; Chen, B.; Zhong, X. A reconstruction-based feature adaptation for anomaly detection with self-supervised multi-scale aggregation. In Proceedings of the ICASSP 2024—2024 IEEE International Conference on Acoustics, Speech and Signal Processing (ICASSP), Seoul, Republic of Korea, 14–19 April 2024; IEEE: Piscataway, NJ, USA, 2024; pp. 5840–5844. [Google Scholar]
  9. Wyatt, J.; Leach, A.; Schmon, S.M.; Willcocks, C.G. Anoddpm: Anomaly detection with denoising diffusion probabilistic models using simplex noise. In Proceedings of the IEEE/CVF Conference on Computer Vision and Pattern Recognition, New Orleans, LA, USA, 21–24 June 2022; pp. 650–656. [Google Scholar]
  10. Zhang, H.; Wang, Z.; Zeng, D.; Wu, Z.; Jiang, Y.G. DiffusionAD: Norm-guided one-step denoising diffusion for anomaly detection. IEEE Trans. Pattern Anal. Mach. Intell. 2025. [Google Scholar] [CrossRef]
  11. Hyun, J.; Kim, S.; Jeon, G.; Kim, S.H.; Bae, K.; Kang, B.J. Reconpatch: Contrastive patch representation learning for industrial anomaly detection. In Proceedings of the IEEE/CVF Winter Conference on Applications of Computer Vision, Waikoloa, HI, USA, 1–6 January 2024; pp. 2052–2061. [Google Scholar]
  12. Yuan, J.; Gao, C.; Jie, P.; Xia, X.; Huang, S.; Liu, W. AFR-CLIP: Enhancing Zero-Shot Industrial Anomaly Detection with Stateless-to-Stateful Anomaly Feature Rectification. 2025. Available online: http://arxiv.org/abs/2503.12910 (accessed on 15 August 2025).
  13. Ma, W.; Zhang, X.; Yao, Q.; Tang, F.; Wu, C.; Li, Y.; Yan, R.; Jiang, Z.; Zhou, S.K. Aa-clip: Enhancing zero-shot anomaly detection via anomaly-aware clip. In Proceedings of the Computer Vision and Pattern Recognition Conference, Nashville, TN, USA, 11–15 June 2025; pp. 4744–4754. [Google Scholar]
  14. Gao, H.; Qiu, B.; Barroso, R.J.D.; Hussain, W.; Xu, Y.; Wang, X. Tsmae: A novel anomaly detection approach for internet of things time series data using memory-augmented autoencoder. IEEE Trans. Netw. Sci. Eng. 2022, 10, 2978–2990. [Google Scholar] [CrossRef]
  15. Huo, Y.; Cheng, X.; Lin, S.; Zhang, M.; Wang, H. Memory-augmented autoencoder with adaptive reconstruction and sample attribution mining for hyperspectral anomaly detection. IEEE Trans. Geosci. Remote Sens. 2024, 62, 5518118. [Google Scholar] [CrossRef]
  16. Li, W.; Shang, Z.; Zhang, J.; Gao, M.; Qian, S. A novel unsupervised anomaly detection method for rotating machinery based on memory augmented temporal convolutional autoencoder. Eng. Appl. Artif. Intell. 2023, 123, 106312. [Google Scholar] [CrossRef]
  17. Wang, Y.; Peng, J.; Zhang, J.; Yi, R.; Wang, Y.; Wang, C. Multimodal industrial anomaly detection via hybrid fusion. In Proceedings of the IEEE/CVF Conference on Computer Vision and Pattern Recognition, Vancouver, BC, Canada, 17–24 June 2023; pp. 8032–8041. [Google Scholar]
  18. Yu, Z.; Dong, Z.; Yu, C.; Yang, K.; Fan, Z.; Chen, C.P. A review on multi-view learning. Front. Comput. Sci. 2025, 19, 197334. [Google Scholar] [CrossRef]
  19. Mohammadi, M.; Berahmand, K.; Sadiq, S.; Khosravi, H. Knowledge tracing with a temporal hypergraph memory network. In Proceedings of the International Conference on Artificial Intelligence in Education, Palermo, Italy, 22–26 July 2025; Springer: Berlin/Heidelberg, Germany, 2025; pp. 77–85. [Google Scholar]
  20. Yang, E.; Xing, P.; Sun, H.; Guo, W.; Ma, Y.; Li, Z.; Zeng, D. 3CAD: A Large-Scale Real-World 3C Product Dataset for Unsupervised Anomaly Detection. In Proceedings of the AAAI Conference on Artificial Intelligence, Philadelphia, PA, USA, 25 February–4 March 2025; Volume 39, pp. 9175–9183. [Google Scholar]
  21. Jezek, S.; Jonak, M.; Burget, R.; Dvorak, P.; Skotak, M. Deep learning-based defect detection of metal parts: Evaluating current methods in complex conditions. In Proceedings of the 2021 13th International Congress on Ultra Modern Telecommunications and Control Systems and Workshops (ICUMT), Brno, Czech Republic, 25–27 October 2021; IEEE: Piscataway, NJ, USA, 2021; pp. 66–71. [Google Scholar]
  22. Cheng, Y.; Cao, Y.; Chen, R.; Shen, W. Rad: A comprehensive dataset for benchmarking the robustness of image anomaly detection. In Proceedings of the 2024 IEEE 20th International Conference on Automation Science and Engineering (CASE), Bari, Italy, 28 August–1 September 2024; IEEE: Piscataway, NJ, USA, 2024; pp. 2123–2128. [Google Scholar]
  23. Cao, Y.; Cheng, Y.; Xu, X.; Zhang, Y.; Sun, Y.; Tan, Y.; Zhang, Y.; Huang, X.; Shen, W. Visual Anomaly Detection under Complex View-Illumination Interplay: A Large-Scale Benchmark. arXiv 2025, arXiv:2505.10996. [Google Scholar]
  24. Li, W.; Xu, X.; Gu, Y.; Zheng, B.; Gao, S.; Wu, Y. Towards scalable 3d anomaly detection and localization: A benchmark via 3d anomaly synthesis and a self-supervised learning network. In Proceedings of the IEEE/CVF Conference on Computer Vision and Pattern Recognition, Seattle, WA, USA, 17–21 June 2024; pp. 22207–22216. [Google Scholar]
  25. Li, W.; Zheng, B.; Xu, X.; Gan, J.; Lu, F.; Li, X.; Ni, N.; Tian, Z.; Huang, X.; Gao, S.; et al. Multi-sensor object anomaly detection: Unifying appearance, geometry, and internal properties. In Proceedings of the Computer Vision and Pattern Recognition Conference, Nashville, TN, USA, 11–15 June 2025; pp. 9984–9993. [Google Scholar]
  26. Li, C.L.; Sohn, K.; Yoon, J.; Pfister, T. Cutpaste: Self-supervised learning for anomaly detection and localization. In Proceedings of the IEEE/CVF Conference on Computer Vision and Pattern Recognition, Virtual, 19–25 June 2021; pp. 9664–9674. [Google Scholar]
  27. Liu, Z.; Zhou, Y.; Xu, Y.; Wang, Z. Simplenet: A simple network for image anomaly detection and localization. In Proceedings of the IEEE/CVF Conference on Computer Vision and Pattern Recognition, Vancouver, BC, Canada, 17–24 June 2023; pp. 20402–20411. [Google Scholar]
  28. Zavrtanik, V.; Kristan, M.; Skočaj, D. Dsr—A dual subspace re-projection network for surface anomaly detection. In Proceedings of the European Conference on Computer Vision, Milan, Italy, 29 September–4 October 2022; Springer: Berlin/Heidelberg, Germany, 2022; pp. 539–554. [Google Scholar]
  29. Zhou, Q.; Pang, G.; Tian, Y.; He, S.; Chen, J. Anomalyclip: Object-agnostic prompt learning for zero-shot anomaly detection. arXiv 2023, arXiv:2310.18961. [Google Scholar]
Figure 1. Overview of the Supervised Prompt-Based Anomaly Detection Framework Using LoRA-Enhanced CLIP for Industrial Chip Inspection.
Information 16 00956 g001
Figure 2. Distribution of normal and anomalous samples across component categories in UniAD. This figure shows the proportion of Pass (normal) and NG (anomalous) samples in seven electronic component categories collected from real production lines.
Information 16 00956 g002
Figure 3. Distribution of annotated defect types in the dataset. This figure summarizes typical industrial defects such as missing components, component offset, tombstoning, and cold solder joints, reflecting realistic production conditions.
Information 16 00956 g003
Figure 4. Visual comparison of samples from UniAD, MVTec AD, and VisA datasets. UniAD captures fine-grained, realistic industrial defects such as subtle scratches, reflecting real production-line characteristics.
Information 16 00956 g004
Figure 5. The t-SNE visualization of features before and after lora adaptation.
Information 16 00956 g005
Figure 6. The heatmap visualization of normal and abnormal image. (a) An normal image of capacitor. (b) An abnormal image of capacitor.
Information 16 00956 g006
Table 1. Comparison of Zero-Shot and Few-Shot Anomaly Detection Methods. This table details the core adaptation mechanism, category coverage, data requirements, and relative training cost for UniCLIP-AD and competing CLIP-based approaches.
MethodAdaptation MechanismMulti-Category CoverageData RequirementTraining Cost
UniCLIP-ADLow-Rank Adaptation (LoRA)Single model covering multiple industrial categoriesFew auxiliary samplesLightweight
AFR-CLIPCross-modal Feature Rectification + SP + MPFAPartial zero-shot generalizationRequires auxiliary annotationsHigh
AA-CLIPTwo-stage text anchors + Residual adaptersZero-shot generalizationDependent on auxiliary annotationsMedium
Table 2. Detailed sample statistics for each electronic component category in the dataset, including total image count, normal samples (Pass), and anomalous samples (NG). These figures reveal the dataset’s composition and highlight both category dominance and the natural imbalance between normal and defective instances observed in practical industrial environments.
CategoryTotal SamplesPassNG
RESISTOR309012721818
CAPACITOR14,20910,0114198
QFN20591650409
BGA1135873262
DPAK1103739364
SOD291115791332
SOT13231035288
Table 3. Sample counts for representative defect types in the dataset. The table highlights a range of common and rare anomalies encountered on actual production lines.
Defect TypeSample Count
Missing Part324
Component Misalignment173
Tombstoning25
Standing15
Cold Solder7
Short Circuit/Tilting/Body Warping<10
Table 4. Distribution of the five most frequent image resolution pairs in the dataset, illustrating the varied scale and diversity of image acquisition conditions.
WidthHeightCount
5434011713
87461424
46871415
8747982
4787751
Table 5. Comparison of key features among mainstream industrial anomaly detection datasets and the proposed dataset. Our dataset offers high-resolution, real production line images with detailed annotations, supporting multi-category inspection and fine-grained localization, surpassing existing benchmarks in realism and task diversity.
Comparison DimensionMVTec ADVisAReal-IADUniAD
Annotation GranularityImage-level/Pixel-levelImage-level + Region annotationsImage-levelImage-level + Pixel-level
Data SourceLab-captured + syntheticIndustrial (partially synthetic)Factory-collectedReal-world production line images
Defect RealismControlled/partially fakeSemi-realistic with some synthesisHighly realisticHighly realistic, with production-level detail
Task CoverageSingle-object, lab settingPrimarily PCB analysisMulti-class electronic partsMulti-type components + surface defect detection
ApplicabilityLimited to specific setupsSuitable for pattern/board analysisCoarse-grained classificationSupports fine-grained localization + zero-shot detection
Table 6. Comparison of sample sizes between the training set and the test set.
CategoryTrain TotalTrain NormalTrain AnomalousTest TotalTest NormalTest Anomalous
RESISTOR21628901272928382546
CAPACITOR994570072938426430041260
QFN14411155286618495123
BGA79461118334126279
DPAK771517254332222110
SOD20371105932874474400
SOT92572420139831187
Table 7. Overall performance comparison of all methods on the UniAD dataset (All values are in %).
MethodMean AU-ROCMean F1-Score
CutPaste74.166
SimpleNet84.844.7
CFA88.365.6
DSR81.565.9
Ours (UniCLIP-AD)92.189.8
Table 8. Per-category F1-Score performance comparison of all methods on the dataset (all values are in %).
CategoryCutPasteSimpleNetCFADSRUniCLIP-AD
BGA94.148.867.847.198.9
CAPACITOR50.940.458.871.499.4
DPAK88.345.767.637.962.9
QFN95.455.655.160.582.9
RESISTOR46.120.659.95.499.1
Table 9. Per-category AU-ROC performance comparison of all methods on the dataset (all values are in %).
CategoryCutPasteSimpleNetCFADSRUniCLIP-AD
BGA90.686.092.086.399.5
CAPACITOR65.685.094.381.098.0
DPAK85.085.089.378.097.4
QFN68.684.075.886.896.3
RESISTOR45.983.080.775.096.9
Table 10. Optimality and efficiency issues need to be questioned about the adaptation mechanism itself. While LoRA provides parameter efficiency, the authors never speak to why exactly this particular adaptation mechanism is optimal for anomaly detection.
Prompt TypeDescription (Abnormal)Params AddedAUROC
Hand-craft“A cropped industrial photo with defect for anomaly detection”092.1
Hand-craft“Irregular shape, tilt, or incomplete connection.”092.0
Hand-craft“A soldered chip joint with visible misalignment, tilt or irregular welding defect in an industrial image.”092.4
Soft promptLearnable tokens optimized during training+0.1 M93.3
Table 11. Cross-dataset performance comparison and statistical significance analysis. Mean AU-ROC and F1-score (mean ± std) are reported on both UniAD and MVTec AD, with p-values computed via one-sample t-tests relative to UniCLIP-AD (significance level α = 0.05 ). (All values are in %).
MethodDatasetAU-ROC (%)F1-Score (%)p-Value (vs. Ours)
AnomalyCLIPUniAD90.8 ± 0.787.9 ± 0.80.011
UniCLIP-AD (ours)UniAD92.1 ± 0.489.8 ± 0.5-
AnomalyCLIPMVTec AD95.8 ± 1.092.0 ± 0.70.012
UniCLIP-AD (ours)MVTec AD97.6 ± 0.694.5 ± 0.5-
Table 12. Comparison with Fully Supervised Baselines on the UniAD Dataset (all values are in %).
MethodTraining TypeAUROCF1-ScoreMulti-Category Generalization
ResNet-50 (Fine-tuned)Fully Supervised83.779.1× (requires per-class training)
ViT-SupervisedFully Supervised85.581.3× (requires per-class training)
UniCLIP-AD (Ours)Lightly Supervised (Prompt + LoRA)92.189.8✓ (single unified model)
Table 13. Evaluation results of model under zero shot and finetuning (all values are in %).
VariantsAU-ROCF1 Score
CLIP-zero shot63.267.4
CLIP-lora92.189.8
Table 14. Illustrative examples of anomalies and CLIP embeddings are sparse; add visualizations of attention maps or anomaly heatmaps on UniAD samples to elucidate framework mechanics. (All values are in %).
LoRA Rank (r)Training EpochsAUROCF1 Score
4591.888.9
8592.189.1
16591.988.6
8388.488.8
81092.089.2
Table 15. Robustness Assessment: Under label noise (10% label damage in the RESISTOR category) and few-sample imbalanced scenarios (BGA, SOT), the AUROC and F1-score performance of UniCLIP-AD were evaluated (all values are in %).
SettingCategoryAUROCF1-Score
Baseline (clean)RESISTOR96.999.1
10% noisy labelsRESISTOR92.795.2
Few-shotBGA94.897.3
Few-shotSOT89.192.4
Disclaimer/Publisher’s Note: The statements, opinions and data contained in all publications are solely those of the individual author(s) and contributor(s) and not of MDPI and/or the editor(s). MDPI and/or the editor(s) disclaim responsibility for any injury to people or property resulting from any ideas, methods, instructions or products referred to in the content.