Article

Are We Ready for Synchronous Conceptual Modeling in Augmented Reality? A Usability Study on Causal Maps with HoloLens 2

by
Anish Shrestha
1 and
Philippe J. Giabbanelli
2,*
1
Department of Computer Science & Software Engineering, Miami University, Oxford, OH 45056, USA
2
Virginia Modeling, Analysis, and Simulation Center (VMASC), Old Dominion University, Norfolk, VA 23435, USA
*
Author to whom correspondence should be addressed.
Information 2025, 16(11), 952; https://doi.org/10.3390/info16110952
Submission received: 13 August 2025 / Revised: 3 October 2025 / Accepted: 26 October 2025 / Published: 3 November 2025
(This article belongs to the Special Issue Extended Reality and Its Applications)

Abstract

(1) Background: Participatory modeling requires combining individual views to create a shared conceptual model. While remote collaboration tools have enabled synchronous online modeling, they are limited to desktop settings. Augmented reality (AR) offers a new approach by potentially providing the sense of presence found in physical collaboration, which may better support participants in achieving the sense of presence found in physical locations, thus supporting them in negotiating meaning and building a shared model. (2) Methods: Building on prior works that developed technology, we performed a usability study with pairs of modelers to examine their ability at performing key conceptual modeling tasks (e.g., merging or deleting concepts) in AR. Our study pays particular attention to the time spent on these tasks and distinguishes how long it takes to perform the action (as enabled by the technology) from how long the participants discussed the action (e.g., to jointly decide whether a new concept should be created). (3) Results: Users completed every task and rated the usability from 3.68 (creating an edge) to 4.37 (finding a node) on a scale from 1 (very difficult) to 5 (very easy). (4) Conclusions: Low familiarity with AR and high time per task limits adoption for conceptual modeling.

1. Introduction

While there are different perspectives on the nature and purpose of a conceptual model, practitioners agree that it conveys the structure of a system under investigation in a format that can be used by both modelers and stakeholders [1]. Some practitioners operate under a broad definition in which a conceptual model includes model objectives, assumptions, and simplifications (i.e., specifying how an abstraction was operated by leaving out parts of a target system); others emphasize that the main task of a conceptual model is to encode concepts and their relations [1]. This encoding can take many formats, depending on the application area. For example, (Enhanced) Entity-Relationship (ER) models [2], process models [3], using the Business Process Model and Notation (BPMN) and extensions [4], and the Unified Modeling Language (UML) and its accompanying queries [5,6] are familiar to the ER community, with many applications in software engineering and industry-focused projects. Symbolic representations are commonplace in AI (e.g., ontologies, knowledge graphs) [7], while diagramming approaches from systems thinking and soft systems methodologies (e.g., causal/cognitive map, mind map) can support participatory modeling projects [8]. For the factors that shape the choice of conceptual model and their contributions to science, we refer the reader to [9,10].
In this paper, we focus on conceptual models in the form of causal maps, which encode concepts as labeled nodes and specify their causal relations through directed typed edges (Figure 1). Causal maps align with the view that conceptual models help communicate the structure of a system; so, they emphasize visual and intuitive representations (as soft systems methods) rather than formal representations. In contrast to formal or symbolic models, causal maps are tailored for collaborative interpretation rather than automated execution or database design. Consequently, causal maps are frequently encountered in participatory modeling, which is an interdisciplinary field in which stakeholders from various backgrounds seek to arrive at a shared vision about a system by negotiating meanings through fruitful interactions [11]. Our selection of causal maps is thus aligned with our primary objective of assessing how a software tool can support (or hinder) participants in arriving at a shared conceptual model.
Conceptual modeling can build credibility, guide experimentation, or determine the appropriateness of the model [1]. However, these benefits can only be unlocked if a team succeeds in creating the conceptual model. In an ideal situation, stakeholders in every facet of the system under investigation would be available for an in-person meeting where they would express their views unambiguously, which would be straightforwardly integrated, as participants would use a shared terminology and hold compatible thoughts on the system. In reality, all of these idealized assumptions can be challenged. A complex system may require the expertise of an interdisciplinary team of geographically distributed experts who cannot physically meet. Inaccuracies can occur when the mental model held by a participant is externalized. Terminology is unlikely to be shared when participants from different backgrounds or disciplines are gathered; therefore, variations in language are expected. As a result, we need tools that support participants in collaboratively interpreting data [12] or building class diagrams [13,14] and causal maps [15,16], for instance, by identifying and merging equivalent concepts across their individual models (i.e., conceptual alignment). We are thus specifically interested in whether software tools can support remote participants in building a causal map, for instance by negotiating a shared terminology.
Head-mounted displays or ‘headsets’ are gaining traction for synchronous collaborative modeling. As shown in Figure 1, they are broadly divided, based on whether the interface replaces the user’s view (virtual reality; VR) or is super-imposed to the existing view (augmented reality; AR). A 2023 review reported that 6.7% of tools use AR for conceptual modeling [17], whereas a 2012 review reported AR in only 2.8% of the articles reviewed [18]. The slow growth in this space begets the question of whether AR really ‘works’ for conceptual modeling. Usability studies can provide guidance for tool development and avoid a potential disconnect between the promises of intuitive products and actual user experiences. At present, there is a paucity of usability studies for conceptual modeling in AR. They focused on developing prototypes (e.g., UML and AR [19], SysML and VR [20]) and occasionally provided a case study intended as a software demonstration (e.g., for business processes and VR [21]), which leaves usability assessment as the logical next step. While studies have evaluated synchronous collaborative modeling with headsets, this has been in the context of VR rather than AR and for UML rather than causal maps. For example, the evaluation by Yigitbas and colleagues using a MetaQuest2 showed that VR decreased the effectiveness and efficiency, while the developers positively noted “the feeling of being in the same room with a remote collaborator, and the naturalness of collaboration were increased” [14]. The more recent evaluation by Stancek et al. also focused on software teams modeling formal UML diagrams with VR and reinforced the idea that immersion and presence are enablers of trust [13]. In their evaluation, VR is not faster, but it is more satisfying for collaboration.
Our main contribution is thus to perform the first usability study of collaborative modeling in AR with causal graphs, focusing on how participants gradually align their individual models to reach a consensus. In line with a recent research roadmap for enhancing accessibility in conceptual modeling, we examine how multimodal and non-keyboard-centric interactions (e.g., gesture-based input and gaze tracking) can support diverse user needs. Since users interact, negotiate, and reach consensus in a real-time shared AR environment, typical metrics such as the time to task completion conflate the time spent on discussing a consensual action (e.g., do these two constructs have a similar enough meaning that we could merge them?) and enacting it through the software. Our study thus dissociates the time spent on discussing vs. software manipulation, in order to isolate the effect of the virtual environment. To support transparency and replicability in research, our study uses a recent open source AR application [22], and we provide the complete video/sound recordings of all usability sessions in our third-party repository at https://osf.io/sy395/, with consent of the participants and approval by the Institutional Review Board at Miami University.
The remainder of this paper is organized as follows. Since we evaluate an emerging practice that may be unfamiliar with modelers, Section 2 keeps the paper self-contained by explaining the core principles of real-time collaborative modeling, briefly covering the modeling tools using augmented reality and summarizing the design of the AR application evaluated here. Section 3 details the design of our usability assessment, consisting of a pre- and post-questionnaire, as well as recorded tasks completed by pairs of participants. The results on these three study instruments are summarized in Section 4 and contextualized in Section 5.

2. Background

2.1. From Asynchronous to Real-Time Collaborative Modeling

Practices in conceptual modeling have changed over time [23]. Historically and well into the 2010s, software for conceptual modeling was predominantly asynchronous (Figure 1): multiple users could not work at the same time on the same model [24]. Collaboration was addressed through concurrency. Users shared files and agreed on who would edit them at a time (‘one user at once’ policy), or they relied on version control and integration (e.g., via a repository) to assign different parts of the model to different users and commit them for integration [24]. Some tools facilitated integration and relied on pessimistic or optimistic locking for (parts of) a model [25]. However, real-time or synchronous collaboration of interest goes further: it requires seeing others’ actions as they are unfolding on the same model [25]. In the context of Model-Driven Software Engineering (MDSE), Saini and Mussbacher noted the need for real-time support, rather than only collaborating via version control systems [26]. This need is underpinned by the geographically distributed nature of teams, which has only increased in recent years given the rising popularity of remote jobs and the ongoing globalization of companies [27]. This need has been confirmed in a recent survey where 95% of industry participants identified real-time collaboration as a core topic, and about half already engaged in real-time collaboration [28]. The shift from asynchronous to synchronous collaboration is thus “emerging as an impactful improvement over the current state of the practice” [28].
In an assessment of collaboration in modeling tools published in March 2023 [27], the author noted that two thirds of approaches now support real-time collaboration. To illustrate the paradigm shift, consider that 72% of tools currently identify the cascading effects of a user’s action and inform them before merging their work into a group’s model—this feature was only available in 23% of the packages developed from 2003 to 2015 [27]. Although the proposed mechanisms come in a dizzying variety, they are often motivated by one central aim: collaborative modeling requires participants to refine their individual views of a system until they come to a global consensus. This calls for efficient communication (e.g., knowing the intent of other users) and a careful handling of changes (e.g., to avoid a tug-of-war on parts of the model). As summarized by David et al. (emphasis added), “conflict awareness and the automation of conflict resolution are expected to be among the most impactful developments overall” [28]. These aspects have been studied in the conceptual modeling literature, particularly in the area of model composition [29]. For example, there is abundant research on the intricacies of aligning individual models [30].
Features such as communicating user intent (e.g., conflict awareness) are often presented as binary ‘supported’ or ‘not supported’, but “in practice, there are shades of grey, and of course no communication is entirely free of latency” [25]. For example, consider two users A and B. If A immediately sees changes made by B, we have perfect transparency, as proposed in [26]. However, A may unknowingly interfere with B’s work-in-progress. Conversely, the work of B may only be committed in its entirety once it is ready for review (using the notion of ‘design transactions’ in  [25]), but then it may move in different a direction from A, and significant efforts will go into composing two views that have drifted apart. Another illustration of the complexity of intents in real-time collaboration is the handling of the undo operation in a synchronous environment [26]. A last-write-wins is simple: if multiple users edit a part of the model, then the edit requests are handled in the order in which they arrive. An undo request is a type of edit; hence, it would also be handled when it arrives. Consider that A then B make edits; then, A realizes their mistake and sends an undo request. The request arrives after B’s edit; so, it undoes B’s work instead of A. We could modify the semantics so that A’s undo request cancels their own edits, but what if they actually wanted to undo B’s work?).

2.2. Modeling in Virtual and Augmented Reality: Prevalence, Prototypes, and Usability

Augmented reality devices can contribute to communicating user intent, as participants can hear each other and/or see each other’s presence by superimposing digital artifacts to their real-world environments. As stated by Mikkelsen et al., AR can allow participants to “use any room in your office space to do the work you need as well using documents and other real life objects during work” [19]. The authors’ intent is that AR will make “UML and planning architectures fun, interactive and intuitive” [19], which exemplifies the enthusiasm of modelers for this emerging approach, as shown in Section 2.3 of Muff’s recent volume [31].
Since conceptual modeling in AR is a recent endeavor, progress in the field has mostly been documented within reviews dedicated to the broader field of conceptual modeling tools [17,32]. A 2021 systematic review found 72 articles devoted to the user interface design for conceptual modeling tool, dating as far back as 1980 [32]. Most works focused on Graphical User Interfaces, while Natural User Interfaces (NUI) were mostly preoccupied with electronic boards using digital pens or touch-sensitive interfaces where gestures consist of finger movements. AR was only found in two studies: the earliest from 2012 superimposed process-related information [18], while the other tool, introduced in 2017, augmented process documentation through voice and video [33]. At the time, the authors of the review found it “striking that […] the question of how [NUI- and Virtual Reality-based approaches] can adequately support the creation of conceptual models has so far received only very little attention” [32]. Only two years later, a review on conceptual modelling reported that 6.7% of tools use AR [17]. New tools emerging during this time include a prototype by Muff and Fill to project 2D BPMN-diagrams using the Microsoft HoloLens 2 [34] or the ability to add a model’s content in real 3D space using the cameras of mobile phones [35].
The review by [14] reported four papers that used immersive VR, out of which only one supported collaboration. Based on this evidence, the authors developed their own collaborative environment in VR, with a focus on UML. Their study is notable, as it combines software development with usability assessment, whereas prior works focused on prototyping [19]. Usability was conducted on pairs of participants who had to collaboratively create a UML class diagram (which inspires our approach to usability) using both the authors’ solution and a popular web app, Lucidchart. Participants were recruited among college students who were taking, or had completed, a course on UML modeling. In addition, half of them had used VR previously. Users were thus very familiar with both the content (UML) and somewhat knowledgeable about interactions (VR), and they also followed an onboarding tutorial on VR. The results showed that the VR app scored lower than the web app on all recorded metrics. Effectiveness (measured as the error rate per minute) for VR was half of the web app, efficiency (measured as time for task completion) was also about half, and an intention-to-use questionnaire showed that seven participants did not want to use the VR application in the future vs. only one participant for the web app. Overall, the authors expected that VR would improve the feeling or presence and the ease of collaboration, at the expense of effectiveness and efficiency. This expectation is in line with prior research, which emphasized that VR benefits immersion and a sense of presence [36].
Despite several prototypes demonstrating the potential of AR for conceptual modeling, existing tools have rarely undergone systematic usability assessments, particularly in collaborative contexts (Table 1). Most prior works emphasize feasibility or single-user interactions, often targeting UML or business process diagrams. Our study explicitly advances understanding by focusing on causal maps, systematically disentangling the discussion time from the action time, and evaluating collaboration using a publicly available open-source AR tool.

2.3. A Microsoft HoloLens 2Open Source Application to Resolve Conflicts in Causal Maps

The application used in our study assumes that each user provides their initial map (i.e., their individual views of the system), and the goal is to arrive at one shared map. This application was released open source with an accompanying open access publication [22], building on Microsoft HoloLens 2, Unity, and the Photon Unity Networking plug-in for Unity. The design of this remote collaborative system in AR builds on three pillars: environment (how do we render 3D objects and superimpose them onto the real world?), avatars (how do we see others?), and interaction [37]. Given that the app is designed for causal maps, its environment projects the labeled factors/nodes of a map along with their directed typed (+ or −) causal edges. Users view the same maps, but each user can choose to use a flattened 2D representation (similar to a ‘portable whiteboard’) or the full 3D representation. This is similar to the app in [34], which allowed for either a 3D mode or a 2D mode by flattening the depth coordinates. The views are synchronized, as shown for a pair of users in Figure 2. Since users view the same maps and refer to shared spatial positions (e.g., “the node on the left of Stress”), the app supports AR viewpoint sharing [37].
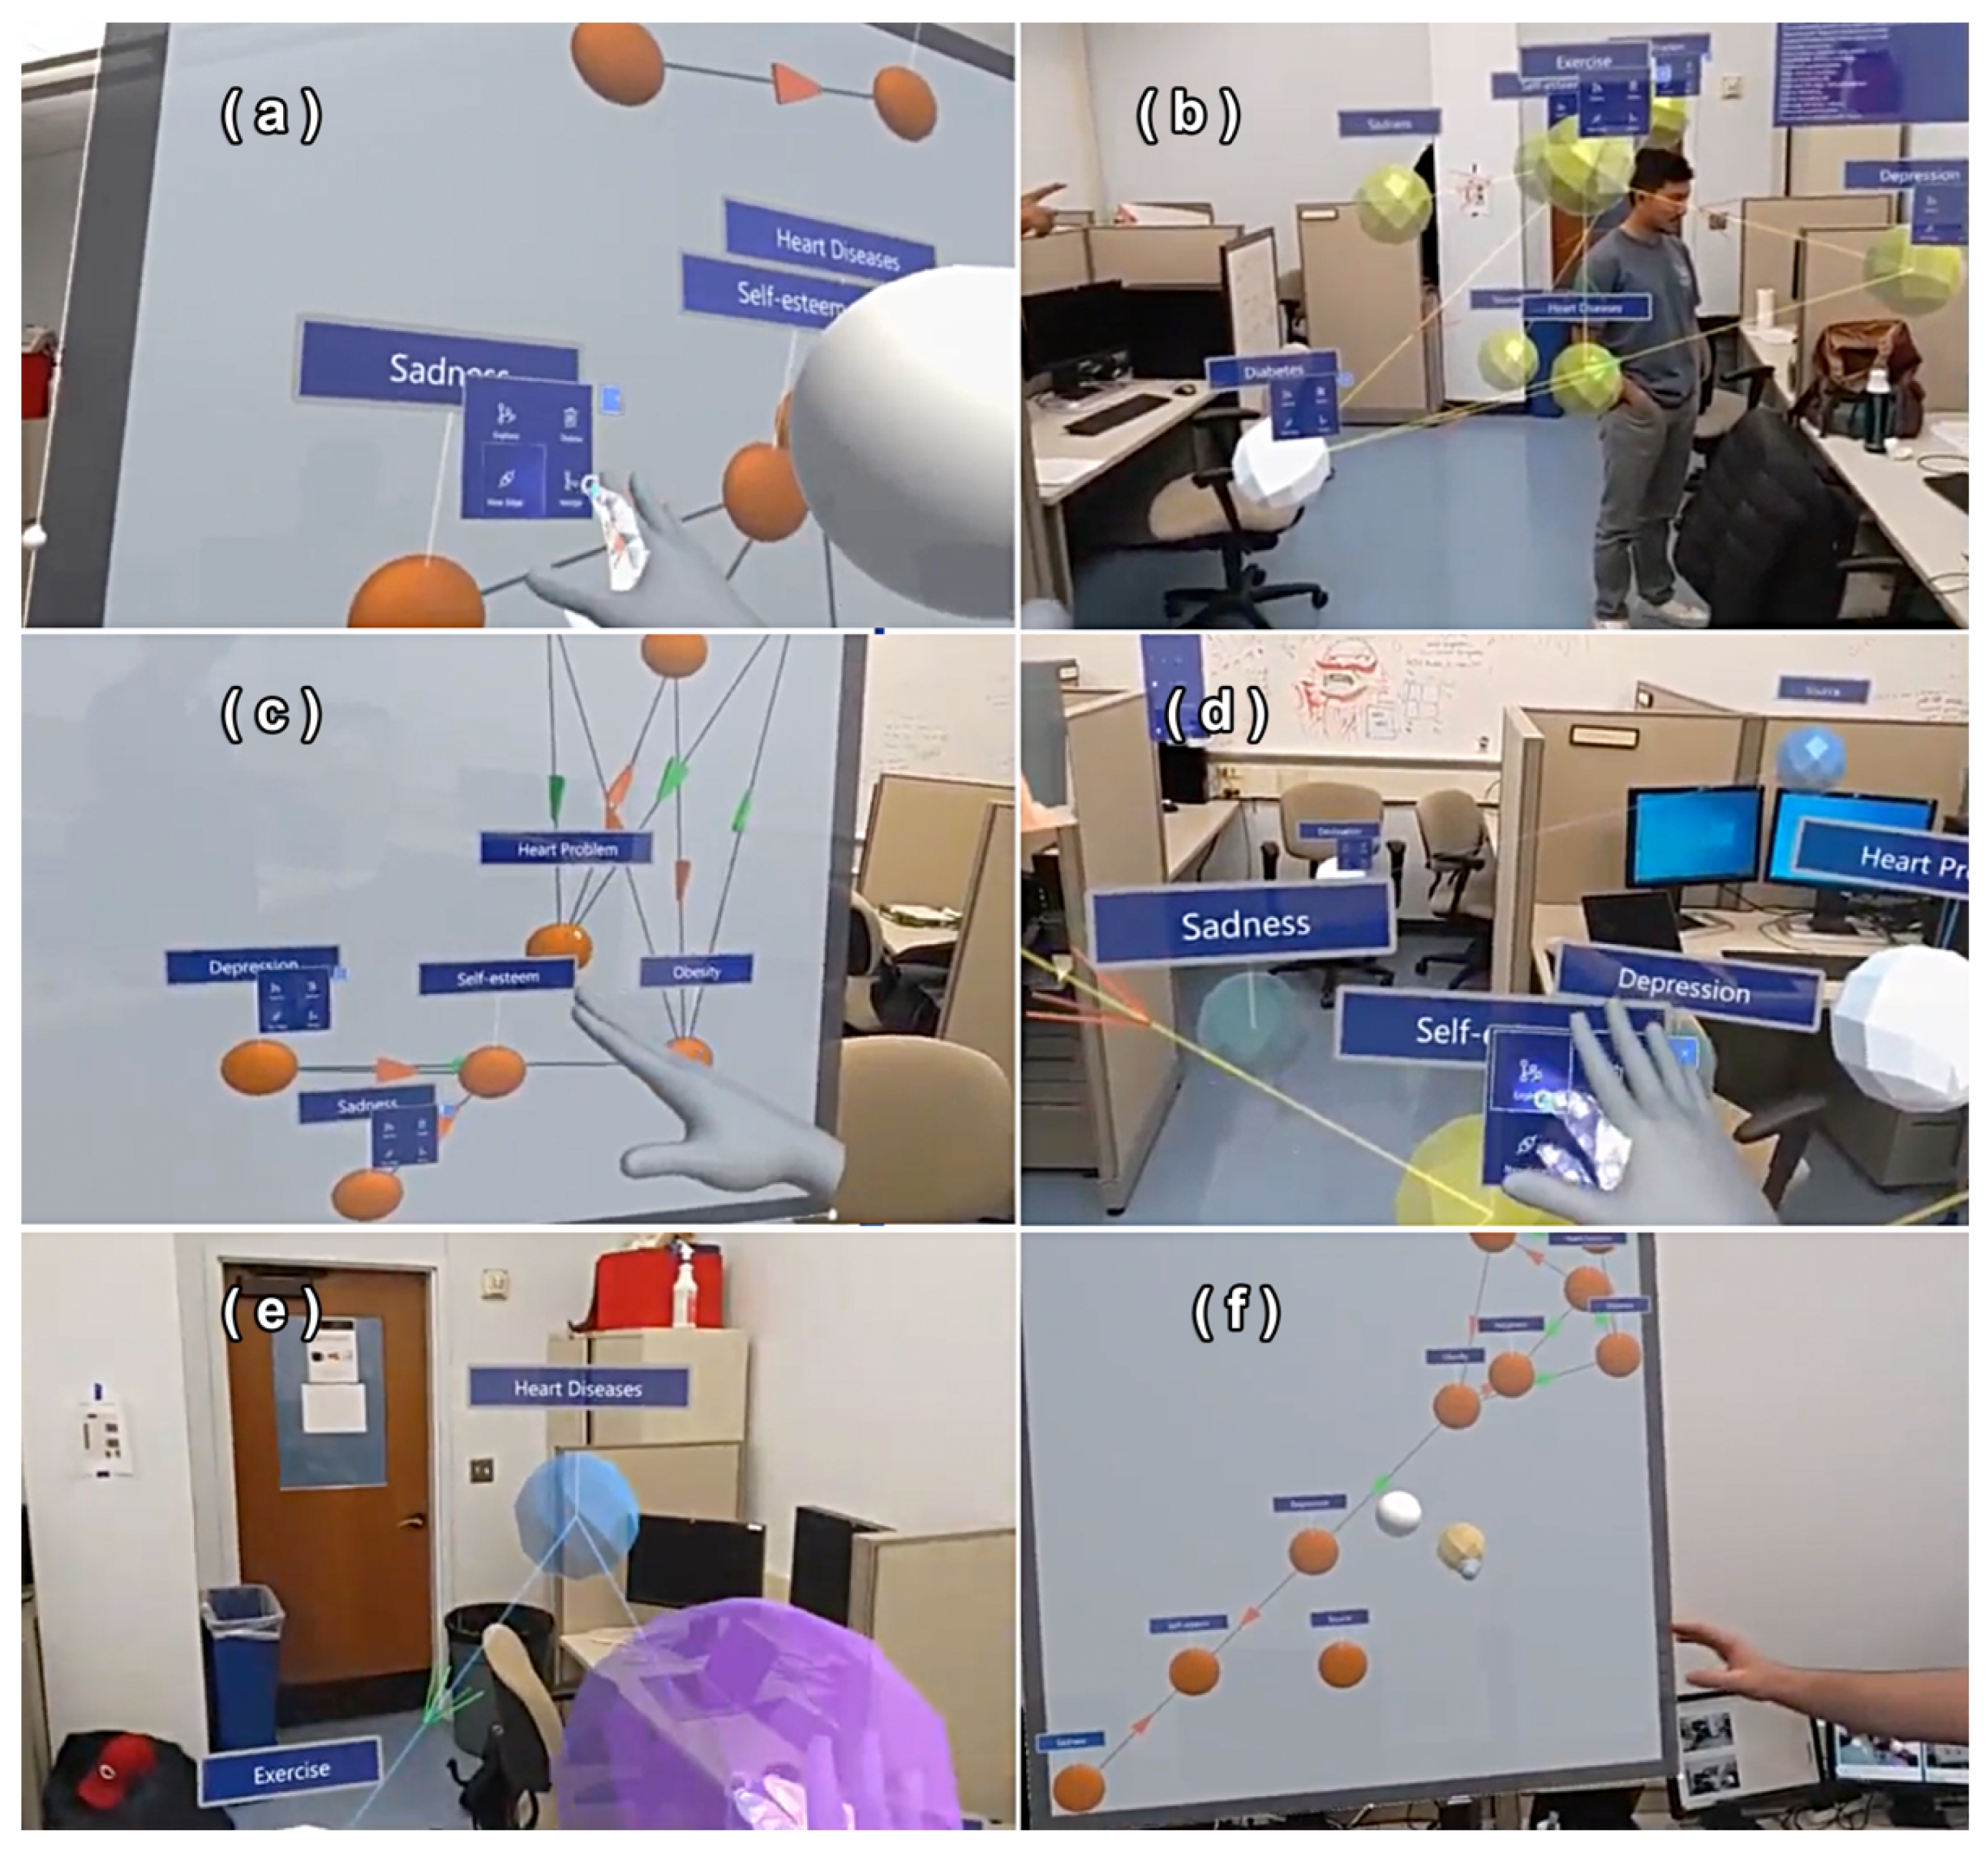
While our study examines one open-source app, we note that its design parallels several other real-time AR collaborative systems. It uses avatars that show the virtual hands of other users [37] to know where they are operating, since the interaction of AR-based systems is primarily through hand tracking. As in other systems [14], the hand tracking acts as a laser pointer, which allows selecting elements, moving them, or triggering a contextual menu (visible in Figure 2b,d,f). It is common in an AR application to implement a focus-plus-context mechanism, through which the visualization can be distorted to display both the overview and details of a specific item [17]. This app implements this mechanism: when a user selects a node, its neighbors are shown locally (even if they are physically far) through ‘ghost nodes’ (i.e., local copies of the nodes), so that users can understand the local context of a model element (Figure 2d). Finally, as stated by Schafer et al., “the most commonly shared feature between remote collaboration systems is the possibility to interact and manipulate shared 3D objects in a virtual space” [37]. This app allows for shared 3D object manipulation, which requires a form of locking. While apps for other artifacts such as UML lock at the finest granularity possible [25] (e.g., individual properties of an object), note that objects in a causal map have a single property: a node has a name, and an edge has a type. The app thus locks an entire object when it is edited. The app does not support an undo operation, whose semantics can be confusing in a collaborative environment, as noted above. There are also minor differences between the app used in this study compared to other applications. Mikkelsen et al. enabled stretching an object in one dimension, thus modifying its aspect ratio [19]. In contrast, aspect ratios are kept constant in this app: if a user extends their 2D whiteboard in one dimension, then the other dimension extends accordingly to keep the center of gravity constant and avoid moving the map’s content. This means that the preconfigured hand gestures of the HoloLens are augmented with custom protocols to enforce desired visual effects.

2.4. Usability in Collaborative Settings via Augmented and Virtual Reality

Several issues can occur to prevent users from employing software as expected. The software may have bugs, which can be identified through software methods such as model checking (e.g., to exhaustively and formally verify a critical system) or unit testing (to assert the behavior of smaller parts of the code). However, even if the software works as intended, the users do not necessarily know how to operate it. Consequently, usability testing focuses on design issues by observing users as they engage in typical tasks with the software [38]. Usability testing is not the last step in developing a product, but rather a part of a product development cycle, such that issues can be identified and addressed as far as possible given technical limitations, and the product can be re-assessed. Common themes in usability testing include findability (do users know where to find the control?), mapping of controls to functions (can users predict the result of an action before performing it?), or feedback (how do users know that the action has been successfully performed?) [39].
Within the real-world collaborative settings studied in this paper, usability issues can pose serious barriers to adoption. For instance, interaction latency could mean that users are not getting timely feedback; so, they perform the action again (e.g., clicking a button repeatedly) without knowing that it was already registered. Gesture recognition can be a challenge for mapping controls to functions, as users should neither inadvertently make a movement that triggers an unwanted action nor struggle to achieve the right movement for a desired effect such as selecting an object. Field-of-view constraints also have an impact, as they can make it harder to find objects. For these reasons, multiple recent studies have measured the usability of the HoloLens in the context of human–human collaboration, often within a heavy industrial setting such as assembling turbines [40], molds [41], electrical cabinets [42], or automative parts [43]. These studies illutrate the growing importance and viability of remote collaborations through augmented and extended reality in industry, not only for manufacturing but also to review and co-design (which is closer to our study) [44]. Findings in manufacturing applications show that, despite an absence of prior experience with augmented reality, participants find the device easy to operate, while noting a number of technical issues such as limited visibility. Other applications such as collaborative learning also noted that AR promoted participation (by analyzing conversations) despite software and hardware issues [45]. Studies may use different devices for the same task and application domain, such as HoloLens or a smartphone/tablet to support collaborative learning in higher education [46]. It is thus useful to know which specific usability issues were encountered so that future system designs can address them. However, despite this growing literature in industrial and educational domains, no study to date has examined these challenges in the context of collaborative causal modeling, even though it is a common task in modeling and simulation. Our work addresses this gap by evaluating usability in this domain, so that future AR tools can be grounded in user experience. Without such grounding, AR tools risk being developed without adequately supporting user experiences, thus reducing uptake among practitioners despite the potential benefits of using technology to support the complexity of conceptual modeling.

3. Methods

3.1. Overview, Goals, and Participants

To evaluate the usability of an AR app in helping a pair of participants to reach a shared causal map when they start with two individual causal maps, we perform the following:
  • Assess the correctness, confidence, and time spent to complete routine actions required for causal map modeling in a novel augmented reality environment.
  • Evaluate how the visual environment (2D vs. 3D projection of a map) acts as a mediating factor in the ability of users to interact with the causal map.
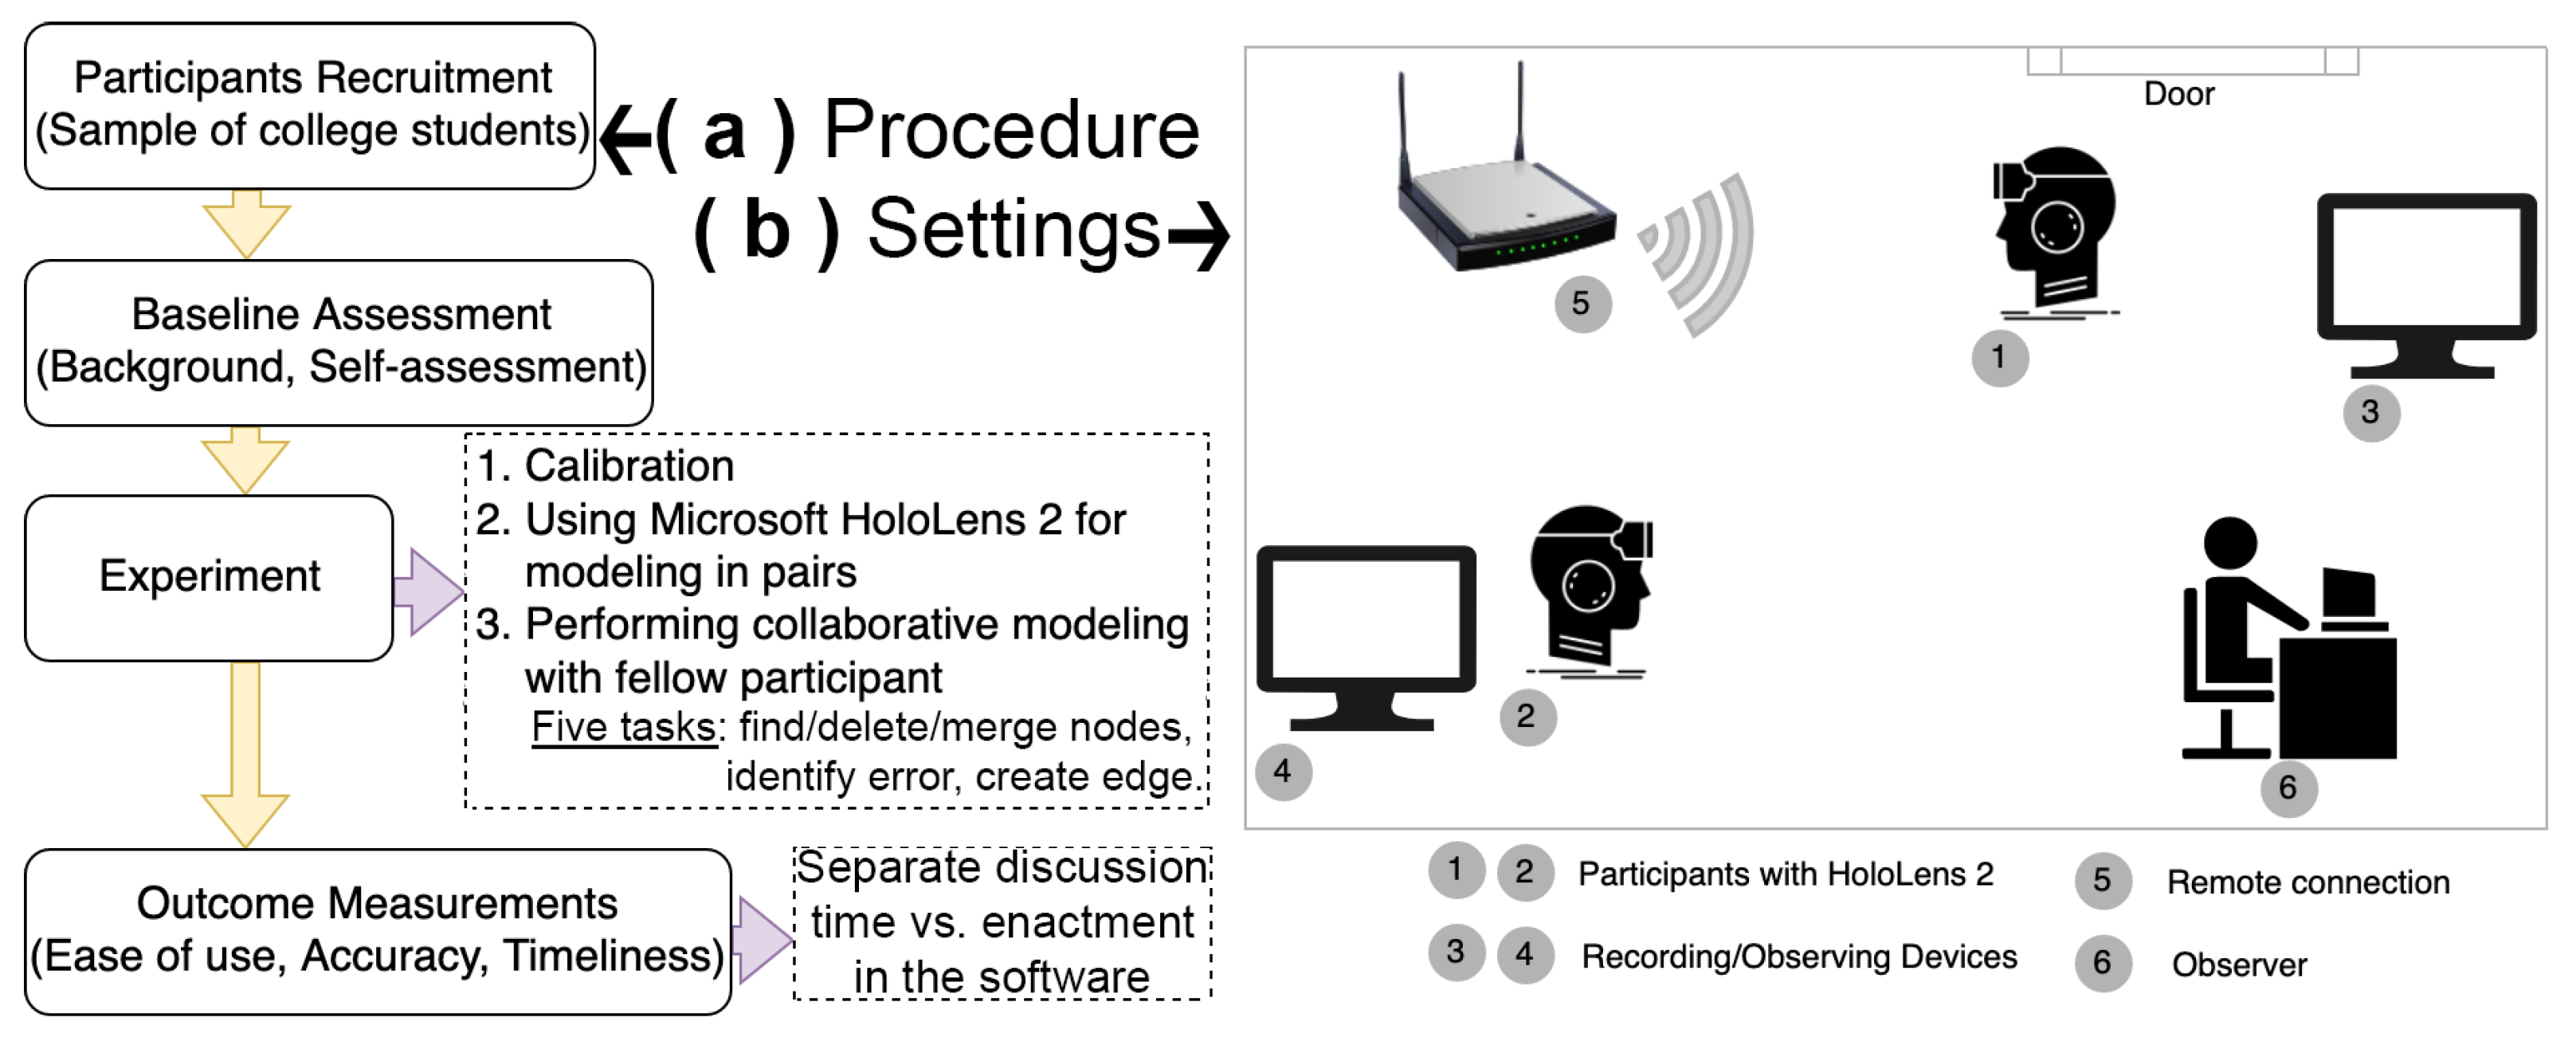
An overview of our methods is shown in Figure 3a. Our protocol was approved by Miami University on 15 November 2022 from the Institutional Review Board (IRB) under number #02120r. A usability study starts by identifying participants. The inclusion criteria for eligible participants were (i) aged 18 and above and (ii) students of Miami University. Note that we do not require familiarity with collaborating and modeling in a virtual environment or prior experience with VR and related technologies. Collaborative modeling with causal maps can involve subject matter experts and community members; hence, they should know about the topic rather than being experts in modeling methods or a specific hardware. This is an important difference in our experimental setup with the usability assessment in [14] which required a modeling course, and where half of the participants had prior experience with VR. The next step was the recruitment and selection of subjects. In our case, the study was (i) announced to all new graduate students in our department and (ii) communicated by word-of-mouth by study team members. Students who expressed interest in the study by contacting us (either in person or by email) were provided with the study details, consisting of the subject information and consent form, which stated that experiments would be recorded (video and sound) for analysis, and recordings would be shared as supplementary online material in scientific publications. To stress that participation was purely voluntary and not compensated, the form informed potential participants that they were free to withdraw from the study at any time without any consequences and that the study was not linked to any course (i.e., no bonus points) and did not trigger any reward, monetary or otherwise.
Students who agreed to take part in the study were then scheduled to come to our lab (Figure 3b) in pairs, since our goal was to evaluate collaborative modeling; this approach echoes the usability protocol from [19]. As in other dyadic usability studies with the HoloLens 2 [47], we formed pairs at random. Only one pair needed to be available for a single experiment session. The subjects did not need to know each other before joining the study. Note that the first pair to volunteer was only be used for the study team to practice the protocol and ensure compliance with IRB approval. The first pair was not be informed that their participation only served as a rehearsal, to avoid biasing their behaviors. Consequently, our team encountered X pairs of participants, used the first pair to ensure that sessions ran in accordance to plan, and we report results in this paper from the next X 1 pairs.

3.2. Questionnaires and Tasks

3.2.1. Pre-Study Questionnaire

A pre-study questionnaire form (see Appendix A) was completed in person to evaluate the familiarity of participants with the technology (no familiarity was required, but it may be a confounding variable in the subject’s performance) and their ability at using a causal map. Since causal maps are usually designed for complex and open-ended socio-environmental problems, we provided a small sample causal map and asked questions about semantics (which concepts seem equivalent in the context of this model) and structure (which concepts cannot be reached from a given concept).

3.2.2. Usability

Before the usability experiment, each participant had to read an overview document. This was a requirement for each person to ensure compliance with the protocol. The overview introduced users to interactions with virtual objects in augmented reality by showing generic gestures and actions that can be performed to produce a desired output in the virtual world. For example, one of the basic actions is to move a virtual object. In order to do this, they need to make a ‘C’ shape with their thumb and the index finger and pinch to grab the object, and then move their hand to the desired place. The document covered the following actions: select and move virtual objects, open and close contextual menus (when selecting objects), select an option or toggle a section from contextual menus, open the main ‘hand menu’ and scroll through its options. Participants could access the same manual in the app if they needed assistance.
During the experiment, each participant was provided with a HoloLens 2 device that we calibrated for them. The Microsoft HoloLens caused only negligible symptoms of simulator (motion) sickness across all subjects in prior works. Furthermore, most participants in prior works faced no symptoms, while only a few experienced minimal discomfort in training environments similar to our application [48]. Calibrating devices in our study provides visual quality and comfort while mitigating such risks. Our protocol also covered events such as motion sickness or participants needing a break—neither events were encountered in our study. The devices were connected to one of the monitoring computers for live capture (Figure 3b). We also gave each participant a printed copy of their model and emphasized that they could not see the other’s copy, just like in the real world, as participants upload their models. The two graphs are shown in Figure 4. Participants were asked to use the ‘think aloud’ protocol, to verbalize their thoughts while performing the study. Each pair performed five tasks (Table 2). Every participant was asked to find a node in the graph, and the remaining four tasks were randomly assigned across the participants (two tasks each) in random order to avoid a scaffolding effect:
  • Deleting an unnecessary concept. In real-world scenarios, participants may include tangential concepts and realize through discussions that the model could be reduced. We thus included irrelevant concepts in the map. This is a common activity in conceptual modeling, as maps with a large diameter may signal that a participant went beyond the boundaries of the problem space (i.e., on a tangent) [49]. Among several approaches, the deletion of peripheral concepts (i.e., ‘exogenous variables’) [50] helps to reduce model complexity by omission—alternatives include aggregation and substitution [51].
  • Creating a new edge to causally link one concept onto another. We ensured that several concepts in the maps had plausible yet missing connections.
  • Finding one error in the graph (wrong causality).
  • Merging semantically related concepts. This is an important task to negotiate a shared meaning, as participants must find a pair of concepts that should be merged. The individual graphs contained a pair of closely related nodes (‘heart diseases’, ‘heart problem’) as well as a distractor pair (‘depression’, ‘happiness’). We expected this task to trigger a discussion and several software actions to select and move a concept onto its merging target. Merging related concepts is a well-known time-consuming modeling task, which is performed manually for small maps or increasingly benefits from AI solutions to identify potential concepts to merge in large maps [15,52].
Participants were recorded by connecting their devices to a monitoring computer for live capture, in addition to video footage of the room.

3.2.3. Post-Usability Questionnaire

Upon performing the tasks, participants completed a post-questionnaire. An open-ended question asked participants to suggest improvements. Using a Likert scale from 1 (very difficult) to 5 (very easy), they rated each of the four tasks and the overall app usability. Participants also expressed how likely they were to use a (hypothetical) paper-based, desktop application, or our XR solution for collaborative modeling. Note that our focus was not on producing a standardized usability benchmark for tool certification, but rather on comparing participant impressions across tasks and gauging receptiveness to an immersive collaborative modeling experience. The Likert-style ratings allowed participants to rate each task individually, which would not be directly supported by standardized instruments such as the System Usability Scale (SUS) and NASA Task Load Index (NASA-TLX) without altering their validated forms.
Note that a usability study is usually divided into two stages, with usability experts identifying implementation issues that affect usability (stage 1) and then involving users through tasks (stage 2). The open-access publication associated with the open-source application used in this study conducted stage 1 usability prior to the official release, thus we focused on engaging with users.

4. Results

4.1. Pre-Study Questionnaire

Eighteen participants contributed to our study as nine pairs. We did not set a target a priori, as we accepted all participants who wished to partake. Our sample size is in line with prior studies that sought major usability bottlenecks in immersive interfaces. For example, Stancek et al. involved twelve participants for the usability of their VR UML tool [13], while Pintani et al. had twenty participants when using the HoloLens 2 for studies involving pairs of users [47]. In addition, a recent review of 221 studies in the related field of immersive analytics found that the median number of participants for quantitative experiments was 17 [53].
The first pair served to practice the study and ensure compliance with our protocol approved by the Institutional Review Board (IRB); hence, we now report on the eight pairs used for analysis. The pre-study questionnaire (see Appendix A) found that 75% (n = 12 out of 16) of the participants had experience with a virtual reality device. Note that a device for augmented reality such as the Microsoft HoloLens 2 (USD 3500 each) typically targets the enterprise or industrial/professional market, whereas more affordable devices such as Meta Quest target the consumer VR market. Consequently, we asked for familiarity with VR (as it provides transferable skills) as well as AR. While the familiarity of our users with VR devices is higher than the general US population (60% have used a headset based on a 2024 Harris Poll [54]), our numbers may reflect self-selection by participants seeking to participate in our study, as well as the younger demographic of graduate students. Only one participant had used the HoloLens 2 previously, in another lab.
Most participants self-rated their knowledge of concept mapping as little to none (n = 9), while a few participants had some (n = 6) and only one self-rated as very knowledgeable. In addition to self-rating their knowledge, we required each participant to complete two exercises aligned with collaborative mapping tasks: identifying two nodes that should be merged in a given map (semantic knowledge) and following the direct and indirect neighbors of a node (structural knowledge). Half of the participants correctly merged the nodes, five made a mistake, and three merged the wrong nodes. Similarly, most participants correctly found neighboring nodes (n = 9), three made one mistake, and the remaining four made multiple mistakes. There was a low Pearson correlation coefficient between self-rated knowledge and either merging (r = 0.24) or following neighbors (r = 0.08), as well as between the two tasks (r = 0.13), which suggests that they measure different aspects of systems thinking; hence, participants should not be categorized as ‘novice’ or ‘experts’ on the basis of a single item. Note that the literature on systems thinking does not have a ‘typical’ correlation between self-rated systems thinking skills and task performance on specific maps, as the same cohort may exhibit a negative or position correlation depending on the scoring method [55].

4.2. Usability Results

All participants eventually completed every task; hence, correctness is not a useful measure for analysis. We thus focus on the time to completion, which is divided into the time spent performing the action and the time devoted to discussing it.
We make three observations from the usability results (Figure 5). First, the bimodal distributions suggest that our users fell into two groups when it came to performances. In particular, the distributions for discussions echo the experimental results of Pintani et al. with the HoloLens 2, who observed from similar violin plots that “there is no middle ground: users either talk a lot or very little” [47]. Second, time is not necessarily associated with the number or the nature of the actions involved. For example, to merge a node, users select the source node, click the merge action, and drop the node onto its destination. The same sequence of operations is involved to create an edge (by choosing the edge action), yet it took almost twice as long as merging nodes, on average. Third, the average time is generally longer than would be expected on paper on through a desktop application. For instance, merging nodes or deleting a node takes half a minute on average, whereas we may expect a few seconds through other media. Since there is only a very weak correlation between a user’s VR experience and their action time ( r = 0.11 ), we posit that the time is mostly attributable to the interaction mechanisms of the HoloLens device specifically, which was new to most participants. Indeed, participants occasionally struggled to perform operations such as closing a menu, which is achieved by touching the surface of a button, but users often went through the button. We also noted that users were sometimes too far from a node’s menu to discern it clearly; however, they still attempted to interact with it (hence missing the right action) instead of bringing the node and its menu closer.
No correlation was found between either the 2D or 3D interface, on the one hand, and the action time, on the other hand. Once two outliers were removed, the action times for a user were moderately correlated across tasks ( r = 0.41 ).

4.3. Post-Usability Questionnaire

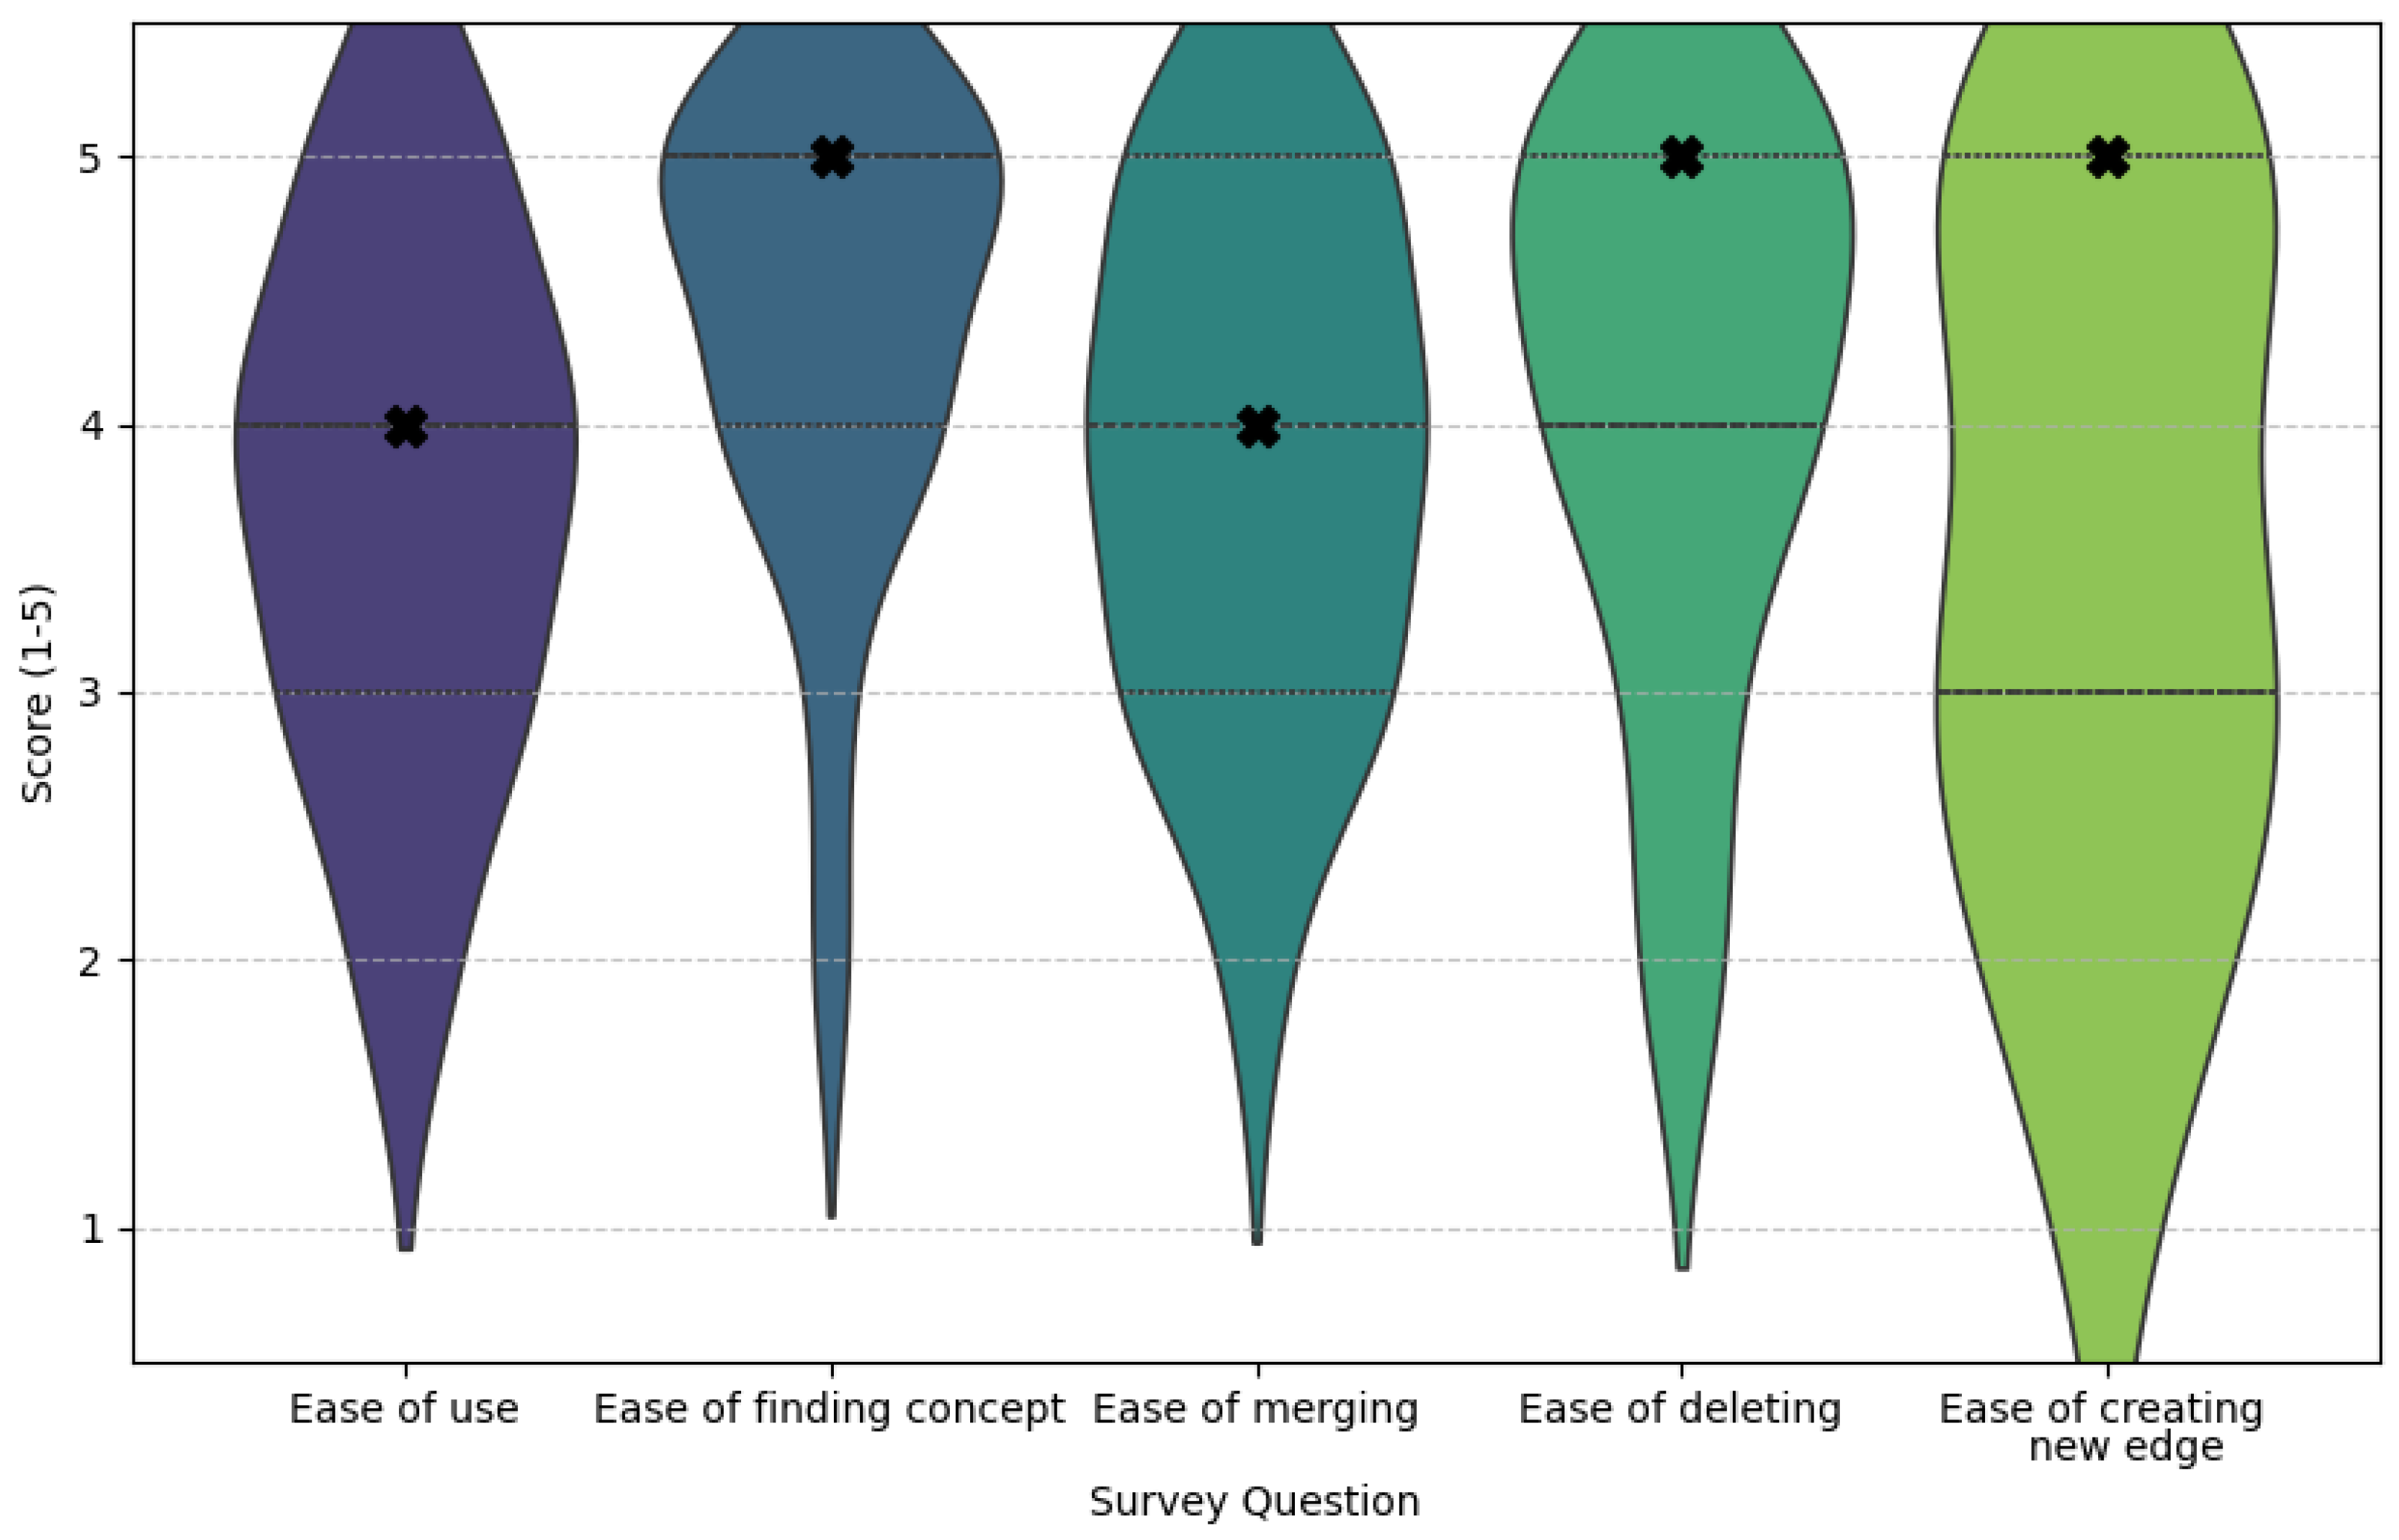
Participants rated the usability for each task and overall on a Likert scale from 1 (very difficult) to 5 (very easy) (Figure 6). Since the Likert scale provides ordinal data, we performed a non-parametric Kruskal–Wallis H test to compare the distributions of the answers. The results indicate that there was no statistically significant difference between the distribution of the survey questions (H-statistic: 7.0005, p-value: 0.1359 > 0.05). That is, participants rated the usability rather consistently across tasks and overall. Each task was rated from 3.68 ± 1.19 (creating an edge) to 4.37 ± 0.88 (finding a node), while the overall usability was rated 3.81 ± 0.98 . There was no correlation between a user’s VR experience and their usability rating ( r = 0.11 ), and a Chi-squared test also rejected the hypothesis that users experienced in VR provide higher usability ratings ( χ 2 = 0.66 , degrees of freedom 15). However, we noted a moderate association between a high usability rating (4 and above) and performing tasks under 30 s ( r = 0.35 ). Participants also expressed how likely they were to use a (hypothetical) paper-based, desktop application, or the HoloLens app for collaborative modeling (Figure 7). The desktop application was preferred over pen and paper, which was favored over the app. We noted that the usability rating was moderately associated with the likeliness to use the application ( r = 0.32 ).
In terms of suggested improvements, several participants echoed this verbatim response: “Difficulties that I faced while using the application were more related to me not being familiar with Hololens rather than the app itself. The application itself was intuitive to work with.” In particular, another participant mentioned that “the dialog windows (or boxes) are difficult to close. Nevertheless the overall user experience is very nice.” As an alternative to the problematic built-in mechanism of precisely clicking on a button to close a menu, one participant suggested that menus should close automatically if they are not within the focus of a user, unless the user purposely ‘pinned’ them.

5. Discussion

5.1. Key Findings

This is the first usability study on collaborative causal mapping in AR. In our protocol, participants wore HoloLens 2 headsets while also using printed copies of their individual maps. Because the display is optical see-through, participants could glance between the holographic causal map and the paper without mode switching or importing/scanning documents. This would not have been possible in a ‘pure VR’ setup that hides the physical layer, unless documents were recreated digitally, which may add to the complexity of using the application. The lessons learned here can contribute to guiding the next generation of immersive modeling tools. Despite the slower task completion times and participants’ stated preferences for traditional media, our findings reflect common characteristics of exploratory work with emerging technologies. The ability of all users (only one of whom had prior experience with the HoloLens) to complete every task points to the tool’s fundamental usability. Observed delays were largely due to hardware constraints (e.g., difficulty closing menus), not conceptual flaws in the modeling interface itself. Importantly, video and audio recordings showed that participants were able to communicate fluidly and collaborate effectively. The combination of spatialized visuals and real-time voice communication created a strong sense of co-presence, making it easy for participants to discuss and agree on modeling decisions—even when the physical interactions with the interface were less intuitive. Participants’ feedback suggests that with improved gesture recognition and interface clarity, such tools could become more viable. As other scholars, we thus “expect a prosperous future for AR/VR-based approaches once the underlying technologies and SDKs mature” [17].

5.2. Limitations

As with any usability study, our findings should be interpreted in light of several expected constraints. First, our sample consisted of a small group of graduate students. This small sample size limits the statistical power and focuses on exploratory insights, while being consistent with prior AR usability studies (typically 12–20 participants). While such cohorts are commonly used in exploratory AR/VR research and are appropriate for identifying key usability bottlenecks, they limit generalization to other populations. Second, our environment was restricted to a laboratory setting and dyadic collaborations as discussed below. This controlled design allowed us to isolate task and interface effects, but it does not capture the complexity of larger real-world teams. Third, hardware characteristics of the HoloLens 2 (discussed below) contributed to longer task times. Issues related to the limited field of view and occasional difficulties in closing menus are well-known with current AR headsets and we may expect them to improve as the technology evolves. Finally, our task scope focused on five essential operations on relatively small causal maps. This simplification was deliberate, as it ensured comparability across participants and emphasized fundamental interaction mechanisms. These limitations are consistent with the stage of maturity in AR usability research, while highlighting opportunities for future studies (see Section 5.3) with larger and more diverse samples, richer collaborative scenarios, newer hardware, and expanded task repertoires, thereby extending the foundation provided by our work.
The limitation of our study to dyadic (two-person) collaborations aligns with prior usability research on immersive modeling tools and allows for focused observation of shared decision-making [56]. By intentionally using a relatively small causal model and pairs of participants, our experimental design isolates the influence of specific variables: the AR interface design, the task, and participants’ prior experience. These effects would be more difficult to disentangle in a real-world setting involving multi-user coordination, varying levels of domain-specific knowledge, and a sequence of multiple, potentially overlapping, tasks. Moreover, if usability issues and performance bottlenecks are already evident in this simplified best-case environment with relatively low cognitive load and minimal interpersonal coordination, we can expect such challenges to persist or even intensify in more complex ecologically valid contexts. Note that studying pairs within a controlled lab setting is common in AR usability research. For example, CoCreatAR was developed to facilitate outdoor AR collaborations; however, its evaluation used prototyped locations in a lab [57]. Similarly, Chan and colleagues applied AR to a manufacturing process for folding material into pleats, but mitigated the risks of setting up scaffolds and climbing to access the center of a large piece by simulating the task on a whiteboard [58].
The HoloLens 2 hardware provides a broader Field of View (43° by 29°) than its predecessor, the Hololens 1 (30° by 17°), which intuitively means that participants do not need as much head motion to interact with holographic objects. However, this field of view is still a limitation compared to the natural view of a person [59]. Although the conceptual maps used in our study were sized to fit comfortably within the FoV during normal use, scenarios involving larger maps may force users to pan and zoom frequently, which could cause interruptions or disorientation. While interface mechanisms such as ghost nodes (used in this app) and contextual minimaps may help, additional studies on causal maps with different characteristics (e.g., size, density) and various layout algorithms are needed to evaluate strategies within limited AR viewports. Alternatively, larger maps may be used with other hardware such as the Meta Orion and Magic Leap 2, which have a larger field of view (45° by 55°, or about 70° diagonal).
Our study was comprehensive in data collection by incorporating pre- and post-questionnaires, headset calibration, and a structured usability session. However, several additional factors could influence performance. We examined the participants’ ability to resolve differences in their mental models using a collaborative tool, focusing on how tool design and prior experience mediated task outcomes. However, the use of a collaborative tool is also shaped by the participants’ underlying interpersonal tendencies. For example, questionnaires can assess whether individuals are more socially oriented or self-focused [60], and instruments such as the Big Five Inventory and its short forms [61] capture traits linked to cooperation and conflict avoidance. A highly conscientious individual may devote more time to verifying correctness (e.g., validating edges), meaning that ‘discussion time’ may reflect personality in addition to task difficulty or prior experience. Conversely, an assertive user may be more likely to take the lead and verbalize decisions, potentially increasing ‘action time’ through greater initiative while shortening ‘discussion time’ via clearer turn-taking. The use of personality traits as mediators in AR/XR usability research is gradually gaining traction, although findings are mixed, because studies measure different traits and address different tasks [62]. For instance, Katifori et al. found correlations between task duration and several personality traits when individuals navigated virtual obstacles (e.g., electric current, barbed wire) in a single-user VR setting [63]. In another study on manufacturing workflows, usability ratings were higher among ‘tech-savvy’ participants, that is, individuals who score high on stimulation-seeking and novelty-oriented traits [64].

5.3. Future Works

Extending the approach to three or more users introduces new challenges, such as increased coordination complexity, potential for conflicting interactions, and the need for more robust mechanisms to indicate user intent and resolve conflicts. For instance, the CIDER system for synchronous collaborative editing of virtual scenes with HoloLens 2 devices compared two types of commit: a ‘forced’ commit, in which a single user can make an update without an in-app agreement from others, and a ‘voting’ (or ‘proposal’) commit, in which the modification is pending until others agree to it [47]. These strategies result in different dynamics for the pairs of users, as the voting method leads to fewer changes (users talk during the voting process) than the forced method (in which users eventually settle for a final version). The inclusion of such mechanisms changes how collaboration is mediated by the app; thus, additional usability studies in teams could examine their implications with respect to interaction flow, cognitive load, and satisfaction.
A natural extension of our study would be to conduct a controlled comparison of task completion times and success rates between AR, desktop, and pen-and-paper media using the same set of causal mapping tasks. While such an evaluation would provide stronger quantitative benchmarks, it also raises several methodological complexities. First, the number of participants required to demonstrate statistically meaningful differences across three media would be substantially larger than the sample size of typical AR usability studies, which often involve fewer than 20 participants. Second, lengthening the protocol to include multiple media may create participant fatigue and decrease ecological validity, particularly when each medium involves a full set of tasks. Third, a ‘contamination’ or spillover effect must be anticipated: if participants complete a task (e.g., merging nodes) on pen-and-paper first, they may already know which nodes to merge and where they are located, artificially reducing both the discussion and execution times when repeating the task in the next interface. To mitigate this effect, researchers would need to design equivalent causal maps for each medium, carefully balancing the content and structure. A rigorous cross-media comparison is thus a valuable avenue for future work that will require a carefully designed experimental procedure. Beyond such methodological considerations, further research can also focus on refining the interaction design of AR tools themselves.
Several improvements suggested by the participants could guide the next generation of AR collaborative modeling applications. For example, menus could automatically close when out of focus unless deliberately pinned, reducing visual clutter. Increasing the size of interactive targets (‘hit boxes’) could lower error rates when selecting buttons, while more adaptive gesture recognition could minimize missed inputs and enhance the fluidity of interaction. Finally, multimodal input options such as combining voice commands with gestures may provide flexibility to accommodate diverse user preferences and contexts. Incorporating such design refinements would directly address the usability bottlenecks identified in our study and make AR-based conceptual modeling more practical for extended use.

6. Conclusions

Our study explored how augmented reality can support synchronous collaborative conceptual modeling through causal maps. We found that all participants were able to complete modeling tasks in AR, which took on average less than six minutes to discuss and perform the actions. Usability ratings were generally positive (M = 3.8/5), with finding a node being rated the highest (M = 4.4/5) and the multi-step task of creating an edge being the lowest (M = 3.7/5). These results suggest that AR is a feasible approach to support essential causal mapping tasks (finding, deleting, and merging nodes; creating edges; and correcting errors). By separating the time spent on actions from the time spent in discussion, our results show that task duration was largely driven by interaction challenges specific to the hardware, while the social negotiation process was fluid and effective. Social negotiation is an important component of AR as it relates to building a sense of presence; thus, we view a potential increase in the time spent performing actions as tolerable if, in exchange, the environment facilitates social interactions. Finally, user perceptions of usability for an AR solution compared to more traditional approaches (e.g., desktop applications, pen-and-paper) reveal a preference for familiar environments such as desktop tools. This preference highlights that AR may provide a strong sense of presence and co-located collaboration, yet a lack of familiarity may limit its uptake. Given these results, we suggest that current AR tools can complement the current software ecosystem [65] by supporting distributed participatory modeling workshops during early brainstorming and negotiation, before transitioning to more familiar options such as desktop tools.

Author Contributions

Conceptualization, P.J.G.; methodology, P.J.G.; formal analysis, A.S. and P.J.G.; investigation, A.S. and P.J.G.; data curation, A.S.; writing—original draft preparation, A.S. and P.J.G.; writing—review and editing, P.J.G.; visualization, A.S.; supervision, P.J.G. All authors have read and agreed to the published version of the manuscript.

Funding

This research received no external funding.

Institutional Review Board Statement

The study was conducted in accordance with the Declaration of Helsinki and approved by the Institutional Review Board of Miami University (protocol code #02120r, 12 February 2023).

Informed Consent Statement

Informed consent was obtained from all subjects involved in the study.

Data Availability Statement

Data generated during the study and supporting the reported results can be found in our public archive at https://osf.io/sy395/.

Acknowledgments

The authors are thankful to all the individuals who volunteered their time to participate in this study.

Conflicts of Interest

The authors declare no conflicts of interest.

Abbreviations

The following abbreviations are used in this manuscript:
ARAugmented Reality
BPMNBusiness Process Model and Notation
EREntity-Relationship Models
IRBInstitutional Review Board
MDSEModel-Driven Software Engineering
NUINatural User Interfaces
SUSSystem Usability Scale
UMLUnified Modeling Language
VRVirtual reality

Appendix A

Full Name:Information 16 00952 i001
Do you have experience with a virtual reality device?☐Yes☐No
Have you used a Microsoft HoloLens before?☐Yes☐No
Do you have knowledge about concept mapping?☐1 (None)–☐2–☐3–☐4–☐5 (Very Knowledgeable)
The two questions below will assess your understanding of concept mapping in general. You are not expected to be an expert in this field.
The picture below shows a concept map. Please list all pairs of nodes that seem equivalent and can be merged. Information 16 00952 i002Information 16 00952 i003
Imagine that there is an improvement in coping skills. Please list all of the factors that would not be affected.
☐Behavior problems ☐Coping skills ☐Punishment ☐Difficult behavior ☐Death ☐Suicidal ideas ☐Suicidal attempts ☐Firearm ownership ☐Hospitalization ☐ Mentorship

References

  1. Robinson, S.; Arbez, G.; Birta, L.G.; Tolk, A.; Wagner, G. Conceptual modeling: Definition, purpose and benefits. In Proceedings of the 2015 Winter Simulation Conference (WSC), Huntington Beach, CA, USA, 6–9 December 2015; IEEE: New York, NY, USA, 2015; pp. 2812–2826. [Google Scholar]
  2. Thalheim, B. The enhanced entity-relationship model. In Handbook of Conceptual Modeling: Theory, Practice, and Research Challenges; Springer: Berlin/Heidelberg, Germany, 2011; pp. 165–206. [Google Scholar]
  3. Farshidi, S.; Kwantes, I.B.; Jansen, S. Business process modeling language selection for research modelers. Softw. Syst. Model. 2024, 23, 137–162. [Google Scholar] [CrossRef]
  4. Strutzenberger, D.; Mangler, J.; Rinderle-Ma, S. Evaluating BPMN Extensions for Continuous Processes Based on Use Cases and Expert Interviews. Bus. Inf. Syst. Eng. 2024, 66, 709–735. [Google Scholar] [CrossRef]
  5. Gogolla, M. UML and OCL in Conceptual Modeling. In Handbook of Conceptual Modeling: Theory, Practice, and Research Challenges; Springer: Berlin/Heidelberg, Germany, 2011; pp. 85–122. [Google Scholar]
  6. Vallecillo, A.; Gogolla, M. Modeling behavioral deontic constraints using UML and OCL. In Proceedings of the International Conference on Conceptual Modeling, Vienna, Austria, 3–6 November 2020; Springer: Berlin/Heidelberg, Germany, 2020; pp. 134–148. [Google Scholar]
  7. Keet, C.M. The What and How of Modelling Information and Knowledge: From Mind Maps to Ontologies; Springer Nature: Cham, Switzerland, 2023. [Google Scholar]
  8. Voinov, A.; Jenni, K.; Gray, S.; Kolagani, N.; Glynn, P.D.; Bommel, P.; Prell, C.; Zellner, M.; Paolisso, M.; Jordan, R.; et al. Tools and methods in participatory modeling: Selecting the right tool for the job. Environ. Model. Softw. 2018, 109, 232–255. [Google Scholar] [CrossRef]
  9. Karagiannis, D.; Lee, M.; Hinkelmann, K.; Utz, W. Domain-Specific Conceptual Modeling: Concepts, Methods and ADOxx Tools; Springer Nature: Cham, Switzerland, 2022. [Google Scholar]
  10. Delcambre, L.M.; Liddle, S.W.; Pastor, O.; Storey, V.C. Articulating conceptual modeling research contributions. In Proceedings of the Advances in Conceptual Modeling: ER 2021 Workshops CoMoNoS, EmpER, CMLS, St. John’s, NL, Canada, 18–21 October 2021; Springer: Berlin/Heidelberg, Germany, 2021; pp. 45–60. [Google Scholar]
  11. Argent, R.M.; Sojda, R.S.; Giupponi, C.; McIntosh, B.; Voinov, A.A.; Maier, H.R. Best practices for conceptual modelling in environmental planning and management. Environ. Model. Softw. 2016, 80, 113–121. [Google Scholar] [CrossRef]
  12. Nafis, F.A.; Rose, A.; Su, S.; Chen, S.; Han, B. Are We There Yet? Unravelling Usability Challenges and Opportunities in Collaborative Immersive Analytics for Domain Experts. In Proceedings of the International Conference on Human-Computer Interaction, Gothenburg, Sweden, 22–27 June 2025; Springer: Berlin/Heidelberg, Germany, 2025; pp. 159–181. [Google Scholar]
  13. Stancek, M.; Polasek, I.; Zalabai, T.; Vincur, J.; Jolak, R.; Chaudron, M. Collaborative software design and modeling in virtual reality. Inf. Softw. Technol. 2024, 166, 107369. [Google Scholar] [CrossRef]
  14. Yigitbas, E.; Gorissen, S.; Weidmann, N.; Engels, G. Design and evaluation of a collaborative uml modeling environment in virtual reality. Softw. Syst. Model. 2023, 22, 1397–1425. [Google Scholar] [CrossRef]
  15. Freund, A.J.; Giabbanelli, P.J. Automatically combining conceptual models using semantic and structural information. In Proceedings of the 2021 Annual Modeling and Simulation Conference (ANNSIM), Fairfax, VA, USA, 19–22 July 2021; IEEE: New York, NY, USA, 2021; pp. 1–12. [Google Scholar]
  16. Reddy, T.; Giabbanelli, P.J.; Mago, V.K. The artificial facilitator: Guiding participants in developing causal maps using voice-activated technologies. In Proceedings of the Augmented Cognition: 13th International Conference, AC 2019, Held as Part of the 21st HCI International Conference, HCII 2019, Orlando, FL, USA, 26–31 July 2019; Springer: Berlin/Heidelberg, Germany, 2019; pp. 111–129. [Google Scholar]
  17. Bork, D.; De Carlo, G. An extended taxonomy of advanced information visualization and interaction in conceptual modeling. Data Knowl. Eng. 2023, 147, 102209. [Google Scholar] [CrossRef]
  18. Poppe, E.; Brown, R.; Johnson, D.; Recker, J. Preliminary evaluation of an augmented reality collaborative process modelling system. In Proceedings of the 2012 International Conference on Cyberworlds, Darmstadt, Germany, 25–27 September 2012; IEEE: New York, NY, USA, 2012; pp. 77–84. [Google Scholar]
  19. Mikkelsen, A.; Honningsøy, S.; Grønli, T.M.; Ghinea, G. Exploring microsoft hololens for interactive visualization of UML diagrams. In Proceedings of the 9th International Conference on Management of Digital EcoSystems, Bangkok, Thailand, 7–10 November 2017; pp. 121–127. [Google Scholar]
  20. Lutfi, M.; Valerdi, R. Integration of SysML and Virtual Reality Environment: A Ground Based Telescope System Example. Systems 2023, 11, 189. [Google Scholar] [CrossRef]
  21. Oberhauser, R.; Baehre, M.; Sousa, P. VR-EvoEA+ BP: Using Virtual Reality to Visualize Enterprise Context Dynamics Related to Enterprise Evolution and Business Processes. In Proceedings of the International Symposium on Business Modeling and Software Design, Utrecht, The Netherlands, 3–5 July 2023; Springer: Berlin/Heidelberg, Germany, 2023; pp. 110–128. [Google Scholar]
  22. Giabbanelli, P.; Shrestha, A.; Demay, L. Design and Development of a Collaborative Augmented Reality Environment for Systems Science. In Proceedings of the 57th Hawaii International Conference on System Sciences, Honolulu, HI, USA, 3–6 January 2024; pp. 589–598. [Google Scholar]
  23. Storey, V.C.; Lukyanenko, R.; Castellanos, A. Conceptual modeling: Topics, themes, and technology trends. ACM J. Comput. Cult. Herit. 2023, 55, 1–38. [Google Scholar] [CrossRef]
  24. Riemer, K.; Holler, J.; Indulska, M. Collaborative process modelling-tool analysis and design implications. In Proceedings of the European Conference on Information Systems (ECIS), Helsinki, Finland, 9–11 June 2011. [Google Scholar]
  25. Kelly, S.; Tolvanen, J.P. Collaborative modelling and metamodelling with MetaEdit+. In Proceedings of the 2021 ACM/IEEE International Conference on Model Driven Engineering Languages and Systems Companion (MODELS-C), Fukuoka, Japan, 10–15 October 2021; IEEE: New York, NY, USA, 2021; pp. 27–34. [Google Scholar]
  26. Saini, R.; Mussbacher, G. Towards conflict-free collaborative modelling using VS code extensions. In Proceedings of the 2021 ACM/IEEE International Conference on Model Driven Engineering Languages and Systems Companion (MODELS-C), Fukuoka, Japan, 10–15 October 2021; IEEE: New York, NY, USA, 2021; pp. 35–44. [Google Scholar]
  27. Gois, M.I.F. Collaborative Modelling Interaction Mechanisms. Master’s Thesis, NOVA University, Lisbon, Portugal, 2023. [Google Scholar]
  28. David, I.; Aslam, K.; Malavolta, I.; Lago, P. Collaborative Model-Driven Software Engineering—A systematic survey of practices and needs in industry. J. Syst. Softw. 2023, 199, 111626. [Google Scholar] [CrossRef]
  29. Robinson, S. Conceptual modelling for simulation: Progress and grand challenges. J. Simul. 2019, 14, 1–20. [Google Scholar] [CrossRef]
  30. Tolk, A. Conceptual alignment for simulation interoperability: Lessons learned from 30 years of interoperability research. Simulation 2023, 100, 709–726. [Google Scholar] [CrossRef]
  31. Muff, F. State-of-the-Art and Related Work. In Metamodeling for Extended Reality; Springer Nature: Cham, Switzerland, 2025; pp. 17–60. [Google Scholar]
  32. Ternes, B.; Rosenthal, K.; Strecker, S. User interface design research for modeling tools: A literature study. Enterp. Model. Inf. Syst. Archit. (EMISAJ) 2021, 16, 1–30. [Google Scholar]
  33. Fellmann, M.; Metzger, D.; Jannaber, S.; Zarvic, N.; Thomas, O. Process modeling recommender systems: A generic data model and its application to a smart glasses-based modeling environment. Bus. Inf. Syst. Eng. 2018, 60, 21–38. [Google Scholar] [CrossRef]
  34. Muff, F.; Fill, H.G. Initial Concepts for Augmented and Virtual Reality-based Enterprise Modeling. In Proceedings of the ER Demos/Posters, St. John’s, NL, Canada, 18–21 October 2021; pp. 49–54. [Google Scholar]
  35. Brunschwig, L.; Campos-López, R.; Guerra, E.; de Lara, J. Towards domain-specific modelling environments based on augmented reality. In Proceedings of the 2021 IEEE/ACM 43rd International Conference on Software Engineering: New Ideas and Emerging Results (ICSE-NIER), Madrid, Spain, 25–28 May 2021; IEEE: New York, NY, USA, 2021; pp. 56–60. [Google Scholar]
  36. Cardenas-Robledo, L.A.; Hernández-Uribe, Ó.; Reta, C.; Cantoral-Ceballos, J.A. Extended reality applications in industry 4.0.—A systematic literature review. Telemat. Inform. 2022, 73, 101863. [Google Scholar] [CrossRef]
  37. Schäfer, A.; Reis, G.; Stricker, D. A Survey on Synchronous Augmented, Virtual, andMixed Reality Remote Collaboration Systems. ACM Comput. Surv. 2022, 55, 1–27. [Google Scholar] [CrossRef]
  38. Riihiaho, S. Usability testing. The Wiley Handbook of Human Computer Interaction; Wiley: Hoboken, NJ, USA, 2018; Volume 1, pp. 255–275. [Google Scholar]
  39. Giabbanelli, P.J.; Vesuvala, C.X. Human factors in leveraging systems science to shape public policy for obesity: A usability study. Information 2023, 14, 196. [Google Scholar] [CrossRef]
  40. Vidal-Balea, A.; Blanco-Novoa, O.; Fraga-Lamas, P.; Vilar-Montesinos, M.; Fernández-Caramés, T.M. Creating collaborative augmented reality experiences for industry 4.0 training and assistance applications: Performance evaluation in the shipyard of the future. Appl. Sci. 2020, 10, 9073. [Google Scholar] [CrossRef]
  41. Knopp, S.; Klimant, P.; Allmacher, C. Industrial use case-ar guidance using hololens for assembly and disassembly of a modular mold, with live streaming for collaborative support. In Proceedings of the 2019 IEEE International Symposium on Mixed and Augmented Reality Adjunct (ISMAR-Adjunct), Beijing, China, 10–18 October 2019; IEEE: New York, NY, USA, 2019; pp. 134–135. [Google Scholar]
  42. O’Keeffe, V.; Jang, R.; Manning, K.; Trott, R.; Howard, S.; Hordacre, A.L.; Spoehr, J. Forming a view: A human factors case study of augmented reality collaboration in assembly. Ergonomics 2024, 67, 1828–1844. [Google Scholar] [CrossRef]
  43. Wang, J.; Hu, Y.; Yang, X. Multi-person collaborative augmented reality assembly process evaluation system based on hololens. In Proceedings of the International Conference on Human-Computer Interaction, Online, 26 June–1 July 2022; Springer: Berlin/Heidelberg, Germany, 2022; pp. 369–380. [Google Scholar]
  44. Wang, P.; Yang, H.; Billinghurst, M.; Zhao, S.; Wang, Y.; Liu, Z.; Zhang, Y. A survey on XR remote collaboration in industry. J. Manuf. Syst. 2025, 81, 49–74. [Google Scholar] [CrossRef]
  45. Hidalgo, R.; Kang, J. Navigating Usability Challenges in Collaborative Learning with Augmented Reality. In Proceedings of the International Conference on Quantitative Ethnography, Philadelphia, PA, USA, 3–7 November 2024; Springer: Berlin/Heidelberg, Germany, 2024; pp. 70–78. [Google Scholar]
  46. Upadhyay, B.; Brady, C.; Madathil, K.C.; Bertrand, J.; Gramopadhye, A. Collaborative augmented reality in higher education settings–strategies, learning outcomes and challenges. In Proceedings of the Human Factors and Ergonomics Society Annual Meeting, Washington, DC, USA, 23–27 October 2023; SAGE Publications: Los Angeles, CA, USA, 2023; Volume 67, pp. 1090–1096. [Google Scholar]
  47. Pintani, D.; Caputo, A.; Mendes, D.; Giachetti, A. Cider: Collaborative interior design in extended reality. In Proceedings of the 15th Biannual Conference of the Italian SIGCHI Chapter, Torino, Italy, 20–22 September 2023; pp. 1–11. [Google Scholar]
  48. Vovk, A.; Wild, F.; Guest, W.; Kuula, T. Simulator sickness in augmented reality training using the Microsoft HoloLens. In Proceedings of the 2018 CHI Conference on Human Factors in Computing Systems, Montreal, QC, Canada, 23–26 April 2018; pp. 1–9. [Google Scholar]
  49. Giabbanelli, P.J.; Tawfik, A.A. How perspectives of a system change based on exposure to positive or negative evidence. Systems 2021, 9, 23. [Google Scholar] [CrossRef]
  50. Asif, M.; Inam, A.; Adamowski, J.; Shoaib, M.; Tariq, H.; Ahmad, S.; Alizadeh, M.R.; Nazeer, A. Development of methods for the simplification of complex group built causal loop diagrams: A case study of the Rechna doab. Ecol. Model. 2023, 476, 110192. [Google Scholar] [CrossRef]
  51. van der Zee, D.J. Approaches for simulation model simplification. In Proceedings of the 2017 Winter Simulation Conference (WSC), Las Vegas, NV, USA, 3–6 December 2017; IEEE: New York, NY, USA, 2017; pp. 4197–4208. [Google Scholar]
  52. Valdivia Cabrera, M.; Johnstone, M.; Hayward, J.; Bolton, K.A.; Creighton, D. Integration of large-scale community-developed causal loop diagrams: A Natural Language Processing approach to merging factors based on semantic similarity. BMC Public Health 2025, 25, 923. [Google Scholar] [CrossRef] [PubMed]
  53. Friedl-Knirsch, J.; Pointecker, F.; Pfistermüller, S.; Stach, C.; Anthes, C.; Roth, D. A Systematic Literature Review of User Evaluation in Immersive Analytics. In Proceedings of the Computer Graphics Forum, Savannah, GA, USA, 23–25 April 2024; Wiley Online Library: Hoboken, NJ, USA, 2024; Volume 43, p. e15111. [Google Scholar]
  54. Vigderman, A. Virtual Reality Awareness and Adoption Report. 2024. Available online: https://www.security.org/digital-security/virtual-reality-annual-report/ (accessed on 30 May 2025).
  55. Hu, M.; Shealy, T. Methods for measuring systems thinking: Differences between student self-assessment, concept map scores, and cortical activation during tasks about sustainability. In Proceedings of the 2018 ASEE Annual Conference & Exposition, Salt Lake City, UT, USA, 24–27 June 2018. [Google Scholar]
  56. Vona, F.; Stern, M.; Ashrafi, N.; Kojić, T.; Hinzmann, S.; Grieshammer, D.; Voigt-Antons, J.N. Investigating the impact of virtual element misalignment in collaborative Augmented Reality experiences. In Proceedings of the 2024 16th International Conference on Quality of Multimedia Experience (QoMEX), Karlshamn, Sweden, 18–20 June 2024; IEEE: New York, NY, USA, 2024; pp. 293–299. [Google Scholar]
  57. Numan, N.; Brostow, G.; Park, S.; Julier, S.; Steed, A.; Van Brummelen, J. CoCreatAR: Enhancing authoring of outdoor augmented reality experiences through asymmetric collaboration. In Proceedings of the 2025 CHI Conference on Human Factors in Computing Systems, Yokohama, Japan, 26 April–1 May 2025; pp. 1–22. [Google Scholar]
  58. Chan, W.P.; Hanks, G.; Sakr, M.; Zhang, H.; Zuo, T.; Van der Loos, H.M.; Croft, E. Design and evaluation of an augmented reality head-mounted display interface for human robot teams collaborating in physically shared manufacturing tasks. ACM Trans. Human-Robot Interact. (THRI) 2022, 11, 1–19. [Google Scholar] [CrossRef]
  59. Hoogendoorn, E.M.; Geerse, D.J.; Helsloot, J.; Coolen, B.; Stins, J.F.; Roerdink, M. A larger augmented-reality field of view improves interaction with nearby holographic objects. PLoS ONE 2024, 19, e0311804. [Google Scholar] [CrossRef] [PubMed]
  60. Murphy, R.O.; Ackermann, K.A.; Handgraaf, M.J. Measuring social value orientation. Judgm. Decis. Mak. 2011, 6, 771–781. [Google Scholar] [CrossRef]
  61. Soto, C.J.; John, O.P. Short and extra-short forms of the Big Five Inventory–2: The BFI-2-S and BFI-2-XS. J. Res. Personal. 2017, 68, 69–81. [Google Scholar] [CrossRef]
  62. Wiepke, A.; Heinemann, B. A systematic literature review on user factors to support the sense of presence in virtual reality learning environments. Comput. Educ. X Real. 2024, 4, 100064. [Google Scholar] [CrossRef]
  63. Katifori, A.; Lougiakis, C.; Roussou, M. Exploring the effect of personality traits in VR interaction: The emergent role of perspective-taking in task performance. Front. Virtual Real. 2022, 3, 860916. [Google Scholar] [CrossRef]
  64. Malin, J.; Winkler, S.; Brade, J.; Lorenz, M. Personality Traits and Presence Barely Influence User Experience Evaluation in VR Manufacturing Applications–Insights and Future Research Directions (Between-Subject Study). Int. J. Hum.-Comput. Interact. 2025, 1–22. [Google Scholar] [CrossRef]
  65. Knox, C.; Furman, K.; Jetter, A.; Gray, S.; Giabbanelli, P.J. Creating an FCM with Participants in an Interview or Workshop Setting. In Fuzzy Cognitive Maps: Best Practices and Modern Methods; Springer: Berlin/Heidelberg, Germany, 2024; pp. 19–44. [Google Scholar]
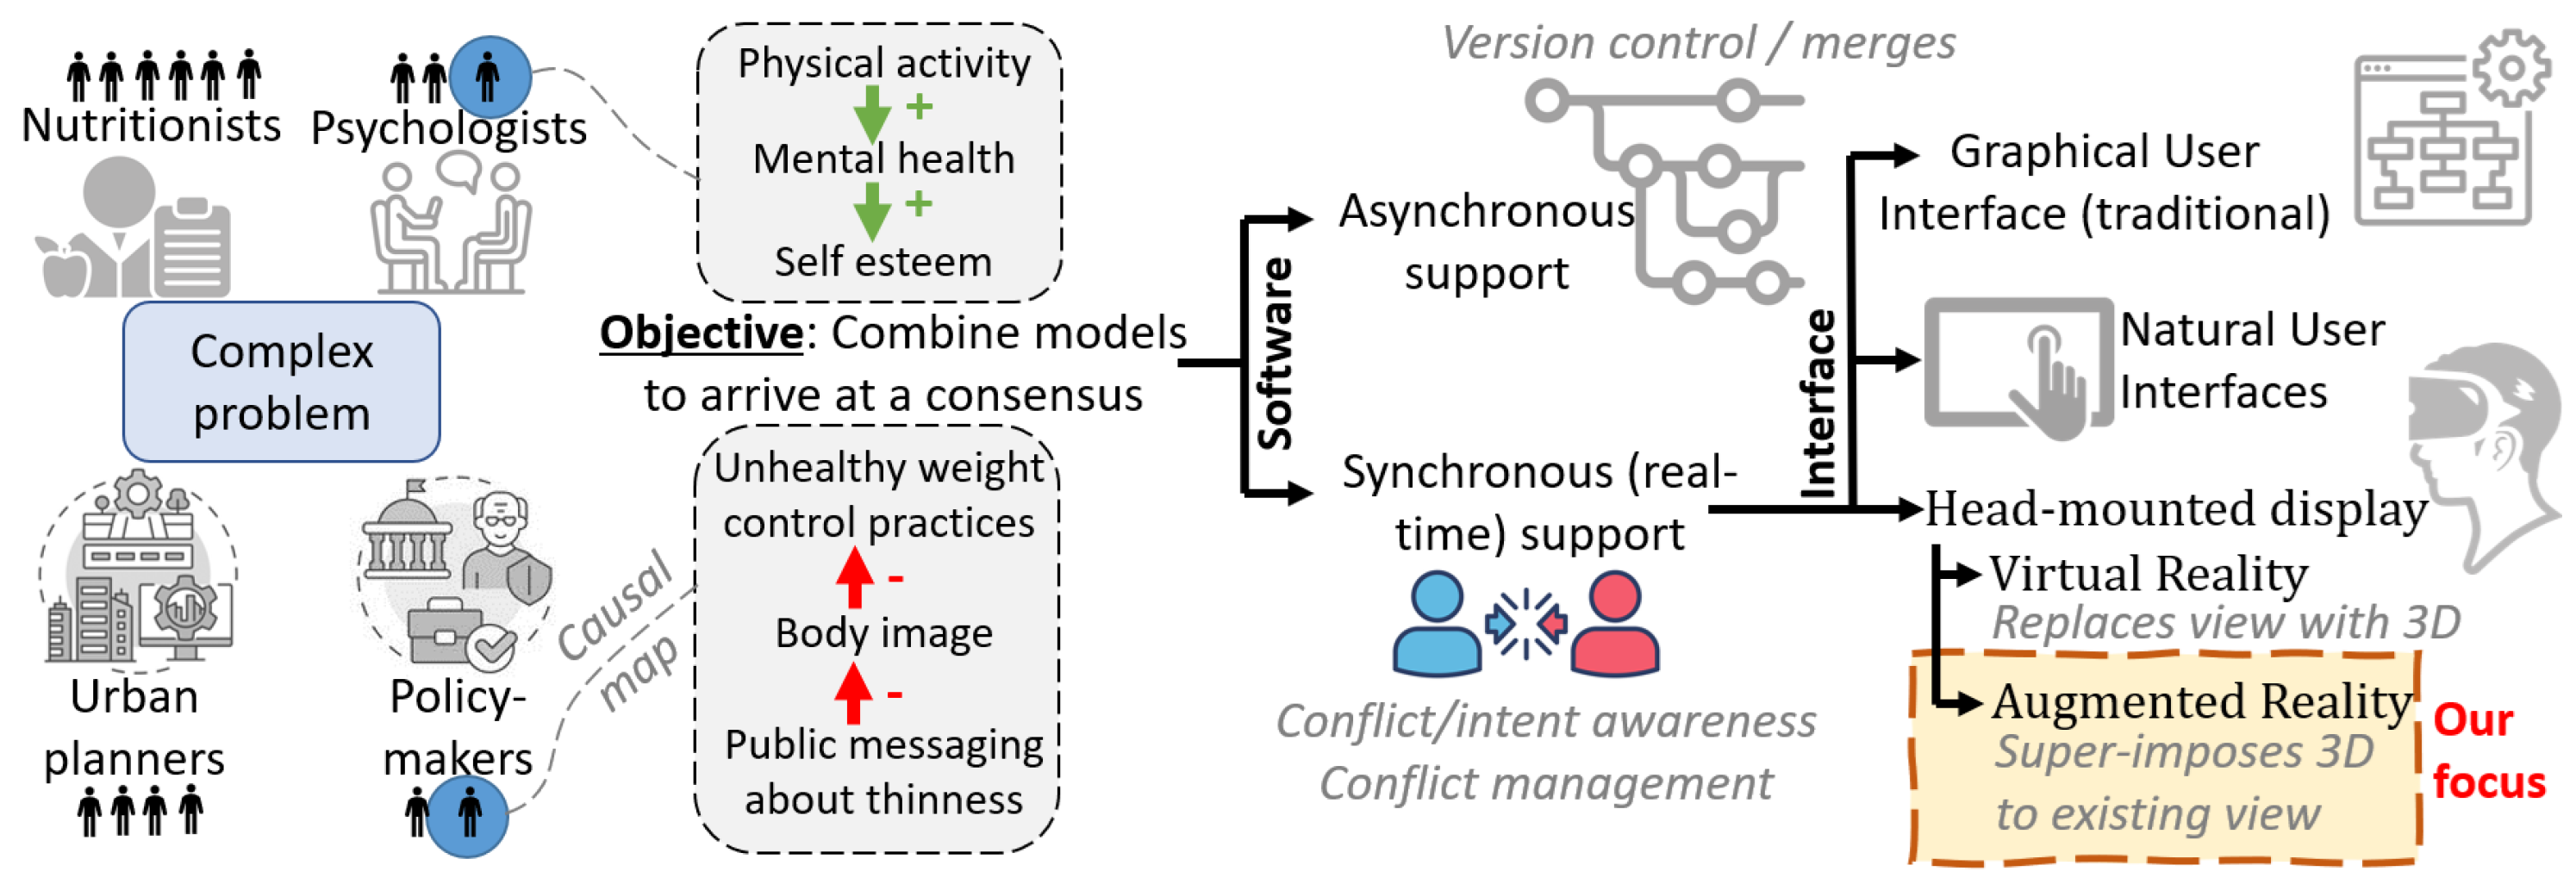
Figure 1. Complex problems require multiple participants, e.g., to cover diverse domains of expertise. We need to combine their individual models; here, this consists of causal maps. Historically, this was an offline collaboration where each individual works on a part of the model, and they are merged through version control tools. In real-time collaboration, the software must convey the intent of the users, in part through visual cues and interactions. We focus on augmented reality for real-time collaborative modeling.
Information 16 00952 g001
Figure 2. Our study uses an open-source AR app for synchronous collaborative modeling, which was not assessed via a usability study. These screenshots are reproduced with permission of the authors to exemplify key interactions and functionalities. Using the HoloLens 2, node menus are open for both the 2D user (a) and the 3D user (b), who look at different parts of the same graph. One user is aware of another’s actions: the 2D user sees the hand of the other user (c), who is looking at the neighbors of self-esteem and has triggered the ghost node (see definition in Section 2.3) ‘sadness’ (d). Users are creating an edge (e,f).
Information 16 00952 g002
Figure 3. Overview of our research procedure (a) and location of participants and equipment within our laboratory space (b).
Information 16 00952 g003
Figure 4. The same two causal graphs were used in each session. The content was chosen to be relatable, so that participants could identify unnecessary concepts or suggest additional and causally valid links (e.g., exercise lowers heart problems and depression). Green shows a causal increase (i.e., the more obesity, the higher the risk for diabetes) while red shows a causal decrease (the higher the heart problems, the lower the ability to engage in exercise).
Information 16 00952 g004
Figure 5. Distribution across nine user pairs of time spent performing (‘action’) and discussing (‘discuss’) five collaborative mapping tasks.
Information 16 00952 g005
Figure 6. Distribution and mode (cross) for answers in the post-usability questionnaire, scored on a Likert scale from 1 (very difficult) to 5 (very easy).
Information 16 00952 g006
Figure 7. The post-usability questionnaire asked “Imagine that you and another person have each made a map, and you need to create a shared version. Assume you have a HoloLens 2 if needed. How likely are you to use each of the solutions below?” The three solutions for comparison were (a) a desktop application, (b) pen and paper, and (c) the proposed XR application. Participants imagined the desktop or pen-and-paper settings, since they did not actually use them.
Information 16 00952 g007
Table 1. Comparison of related studies on conceptual modeling in immersive environments. Checkmarks indicate the presence of a given characteristic.
StudyAR/VRModeling FormalismCollaborativeUsability Assessed
[18]ARBusiness processesPrototype only
[19]ARUML diagramsPrototype only
[14]VRUML class diagrams
[13]VRUML class diagrams
[34]ARBPMN diagramsPrototype only
[22]ARCausal mapsStage 1 only
Our workARCausal maps✓ (with users)
Table 2. Summary of collaborative causal mapping tasks used in the usability study.
TaskDescriptionRationale in Collaborative Causal Mapping
Find NodeLocate a specific node within the causal map.Ensures participants can navigate the shared model and refer to common elements during discussion.
Delete NodeRemove an unnecessary or irrelevant concept.Models often contain tangential or redundant concepts; deleting nodes is essential for simplifying and refining shared maps.
Create EdgeAdd a directed causal link between two nodes.Captures new consensus knowledge by explicitly encoding causal relationships identified during negotiation.
Identify ErrorDetect and correct an incorrect causal relation.Promotes critical review and correction of the shared model, maintaining accuracy and consistency across participants.
Merge ConceptsCombine two semantically related nodes into one.Resolves differences in terminology or perspective, supporting conceptual alignment and a unified representation.
Disclaimer/Publisher’s Note: The statements, opinions and data contained in all publications are solely those of the individual author(s) and contributor(s) and not of MDPI and/or the editor(s). MDPI and/or the editor(s) disclaim responsibility for any injury to people or property resulting from any ideas, methods, instructions or products referred to in the content.