Article

MDFA-AconvNet: A Novel Multiscale Dilated Fusion Attention All-Convolution Network for SAR Target Classification

Field Engineering College, Army Engineering University of PLA, Nanjing 210007, China
*
Authors to whom correspondence should be addressed.
Information 2025, 16(11), 1007; https://doi.org/10.3390/info16111007
Submission received: 13 October 2025 / Revised: 12 November 2025 / Accepted: 17 November 2025 / Published: 19 November 2025

Abstract

Synthetic aperture radar (SAR) features all-weather and all-day imaging capabilities, long-range detection, and high resolution, making it indispensable for battlefield reconnaissance, target detection, and guidance. In recent years, deep learning has emerged as a prominent approach for the classification of SAR image targets, owing to its hierarchical feature extraction, progressive refinement, and end-to-end learning capabilities. However, challenges such as the high cost of SAR data acquisition and the limited number of labeled samples often result in overfitting and poor model generalization. In addition, conventional layers typically operate with fixed receptive fields, making it difficult to simultaneously capture multiscale contextual information and dynamically focus on salient target features. To address these limitations, this paper proposes a novel architecture: the Multiscale Dilated Fusion Attention All-Convolution Network (MDFA-AconvNet). The model incorporates a multiscale dilated attention mechanism that significantly broadens the receptive field across varying target scales in SAR images without compromising spatial resolution, thereby enhancing multiscale feature extraction. Furthermore, by introducing both channel attention and spatial attention mechanisms, the model is able to selectively emphasize informative feature channels and spatial regions relevant to target recognition. These attention modules are seamlessly integrated into the All-Convolution Network (A-convNet) backbone, resulting in comprehensive performance improvements. Extensive experiments on the MSTAR dataset demonstrate that the proposed MDFA-AconvNet achieves a high classification accuracy of 99.38% in ten target classes, markedly outperforming the original A-convNet algorithm. These compelling results highlight the model’s robustness against target variations and its significant potential for practical deployment, paving the way for more efficient SAR image classification and recognition systems.

Graphical Abstract

1. Introduction

Synthetic Aperture Radar (SAR) is an active remote sensing system for airborne and spaceborne platforms that employs pulse compression and synthetic aperture techniques to achieve high-resolution two-dimensional imaging. It can effectively detect objects that are camouflaged or obscured by environmental elements [1]. With its capability for all-weather, all-day observation and moderate penetration into ground surfaces, SAR offers distinct advantages over optical and infrared sensors [2]. These advantages arise from three fundamental principles [2,3]: First, SAR systems use their own illumination sources, allowing them to operate effectively even in complete darkness. Second, the electromagnetic wavelengths utilized by SAR can penetrate clouds and water vapor with minimal distortion. Third, the scattering behavior of electromagnetic waves differs significantly between radar and optical modalities, allowing SAR to provide complementary, and in some cases superior, information for surface characterization tasks. As a result, SAR has been widely adopted in applications such as geological exploration, environmental monitoring, battlefield reconnaissance, and precision targeting. Nonetheless, due to its unique imaging mechanism and the presence of speckle noise, interpreting SAR images remains more challenging than analyzing optical imagery [4], prompting extensive research into accurate and efficient methods for SAR target detection and recognition.
The standard SAR Automatic Target Recognition (ATR) framework, defined by MIT Lincoln Laboratory, comprises three stages: detection, discrimination, and classification [5]. Target classification is the final stage and typically follows one of three paradigms: template-based methods [6], model-based methods [7], or machine learning approaches [8].
Driven by advances in machine learning and deep learning, convolutional neural networks (CNNs) have become increasingly prevalent in SAR target classification due to their ability to perform hierarchical feature extraction and end-to-end learning [9].
Recent work has introduced various deep learning-based approaches. For instance, Chen et al. proposed the A-ConvNet, a fully convolutional network that eliminates fully connected layers to reduce parameter count and mitigate overfitting [9]. Ding et al. employed data augmentation techniques to improve training efficiency [10], while Deng et al. developed a supervised multilayer autoencoder with Euclidean constraints for improved generalization using limited training data [11]. Xu et al. introduced a complex-valued deep CNN for fully polarimetric SAR land cover classification, achieving 95% accuracy on the Flevoland dataset [12]. Zhou et al. proposed a morphological segmentation method with a large-margin softmax classifier and batch normalization to improve feature separability and convergence [13]. Wang et al. designed the Enhanced Squeeze-and-Excitation Network (ESENet) to extract more discriminative features from SAR images [14]. Zhang et al. employed the Convolutional Block Attention Module (CBAM) for feature refinement [15], and Y. Zhang et al. combined label propagation and multi-view learning to reduce annotation costs and improve recognition performance [16]. D. Wang et al. developed a multi-scale attention superclass CNN (MSA-SCNN) that integrates multi-scale feature fusion, attention, and superclass labels to enhance interclass distinctiveness [17].
However, traditional CNNs rely on fixed-scale convolutional kernels, limiting their ability to capture multiscale features. Even networks employing multiple scales often lack adaptability and introduce high computational costs. While attention mechanisms [18] have enhanced feature weighting and improved classification accuracy, they still struggle to jointly capture both global context and local detail, especially in complex multiscale scenarios.
To address these limitations, we propose a novel Multiscale Dilated Fusion Attention All-Convolution Network (MDFA-AconvNet) for SAR target classification. The architecture combines multiscale feature fusion with dual attention mechanisms within a fully convolutional framework to enhance feature representation. The MDFA module comprises: (1) a multiscale dilated attention branch with five parallel convolutional paths using different dilation rates to expand receptive fields and capture multiscale spatial information; and (2) a dual-attention module that integrates spatial and channel attention to emphasize salient features and suppress irrelevant background responses. Together, these modules enhance both contextual and fine-grained feature extraction while improving the model’s generalization capability.
The main contributions of this paper are as follows:
  • We introduce MDFA-AconvNet, a new architecture that integrates multiscale dilated convolution and dual attention mechanisms to enhance the representation and discriminability of SAR target features by fusing multiscale receptive fields and adaptively emphasizing informative content.
  • The MDFA module extracts features at multiple scales using five parallel convolutional branches with varied dilation rates and incorporates spatial and channel attention to strengthen both global and local features while reducing background clutter and redundancy.
  • The use of an all-convolutional structure eliminates fully connected layers, reducing model parameters to only 310,000 and the model size to 1.19 MB, thereby maintaining high classification accuracy while significantly lowering computational and storage demands and mitigating overfitting under limited-data conditions.
  • We employ Grad-CAM and SHAP interpretability techniques to visually validate the model’s ability to accurately extract scattering center features and global structural information, offering physical insight into the model’s decision-making process.
The remainder of this paper is organized as follows. Section 2 reviews related work. Section 3 details the proposed methodology. Section 4 describes the datasets, implementation setup, and experimental results. Section 5 concludes the paper.

2. Related Work

2.1. Multiscale Receptive Fields for Target Feature Extraction

Neuroscientific research has revealed that neurons within the same region of the primate visual cortex naturally exhibit receptive fields of varying sizes [19]. This fundamental insight has significantly influenced the design of artificial neural networks, highlighting that effective visual processing necessitates the simultaneous extraction of information at multiple spatial scales, rather than relying on a fixed receptive field size at each processing stage. In deep learning, the receptive field refers to the region in the input image that corresponds to each pixel in a feature map output by a convolutional layer. In conventional convolutional neural networks, both the feature representation capability and the receptive field size increase with network depth. For example, VGG [20] increases depth by stacking small convolutional filters, while ResNet [21] employs residual connections to alleviate the vanishing gradient problem, thereby enabling deeper architectures. However, due to the limited size of SAR target datasets, deeper networks are prone to overfitting. Thus, beyond increasing depth, alternative strategies are needed to enhance feature extraction performance.
Recent research has focused on expanding receptive fields through multiscale methods, which can be broadly categorized as follows. Parallel branches with varying kernel sizes: GoogleNet, introduced by Szegedy et al. [22], achieved first place in the ImageNet Large-Scale Visual Recognition Challenge. This architecture employs a parallel branch structure where each convolutional path uses a distinct kernel size. As a result, a single input is processed through multiple receptive fields, facilitating multiscale feature extraction at each layer. Multiscale pooling: Initially introduced as spatial pyramid matching by Lazebnik [23] and later extended by Kaiming He et al. into spatial pyramid pooling (SPP) [24], this approach applies pooling operations with different kernel sizes either in parallel or sequentially to extract spatial features at multiple levels of granularity. Dilated convolutions: When applied in a cascaded fashion, dilated convolutions exponentially expand the receptive field, in contrast to the linear expansion achieved by standard convolutions. This allows networks to effectively capture multiscale contextual features without reducing spatial resolution or relying on image rescaling [25]. Building upon these insights, this study applies convolutional kernels with varying dilation rates to extract features from SAR images. As illustrated in Figure 1, feature maps generated using dilation rates of 6, 12, and 18 reveal that increasing the dilation rate enlarges the receptive field, thereby capturing more comprehensive global features. On this basis, we further introduce attention mechanisms to emphasize salient features and suppress irrelevant ones, enhancing overall feature representation for SAR target classification.

2.2. Attention Mechanism

The attention mechanism is a computational paradigm inspired by the human visual system’s ability to selectively focus on salient stimuli. Its core function is to dynamically assign weights that emphasize informative features while suppressing redundant or irrelevant information. The Vision Transformer (ViT) introduced the Transformer architecture into computer vision by partitioning images into fixed-size patches and applying self-attention, thereby demonstrating strong capabilities in modeling long-range dependencies [26]. SE-Net pioneered the use of channel attention by adaptively recalibrating channel-wise feature responses, significantly improving model performance in the ImageNet classification task and laying the foundation for subsequent research in channel attention [27]. ECANet further optimized this approach by employing adaptive one-dimensional convolutions to efficiently model inter-channel relationships, reducing computational complexity without sacrificing accuracy [28]. In contrast to channel attention, spatial attention focuses on identifying salient regions within the spatial dimensions of feature maps [29]. A representative model is the Spatial Transformer Network (STN), which enables networks to apply spatial transformations to input features [30,31]. Spatial attention is particularly advantageous in tasks requiring precise localization, as it guides the network to concentrate on relevant areas while suppressing background noise [32]. Hybrid approaches such as the Convolutional Block Attention Module (CBAM) [33] and the Bottleneck Attention Module (BAM) [34] combine spatial and channel attention to enrich feature representation. DANet further extends this idea by incorporating self-attention into both spatial and channel dimensions, effectively capturing long-range dependencies [35].
While increasing the multiscale receptive field enhances the network’s capacity to extract both fine-grained details and global contextual information, attention mechanisms allow for adaptive focusing on discriminative features while filtering out noise. To harness the complementary strengths of both techniques, we propose MDFA-AconvNet, a fully convolutional network that integrates a multiscale dilated fusion module with dual attention mechanisms.

3. Method

In this section, we propose a novel method for SAR image target classification, termed MDFA-AconvNet. At its core is the Multiscale Dilated Fusion Attention (MDFA) module, which is designed to provide multiscale receptive fields and dynamic attention to salient regions, thereby enhancing the completeness of SAR target feature representation. The following subsections describe the overall architecture of MDFA-AconvNet and the configuration used during training.

3.1. Architecture of MDFA-AconvNet

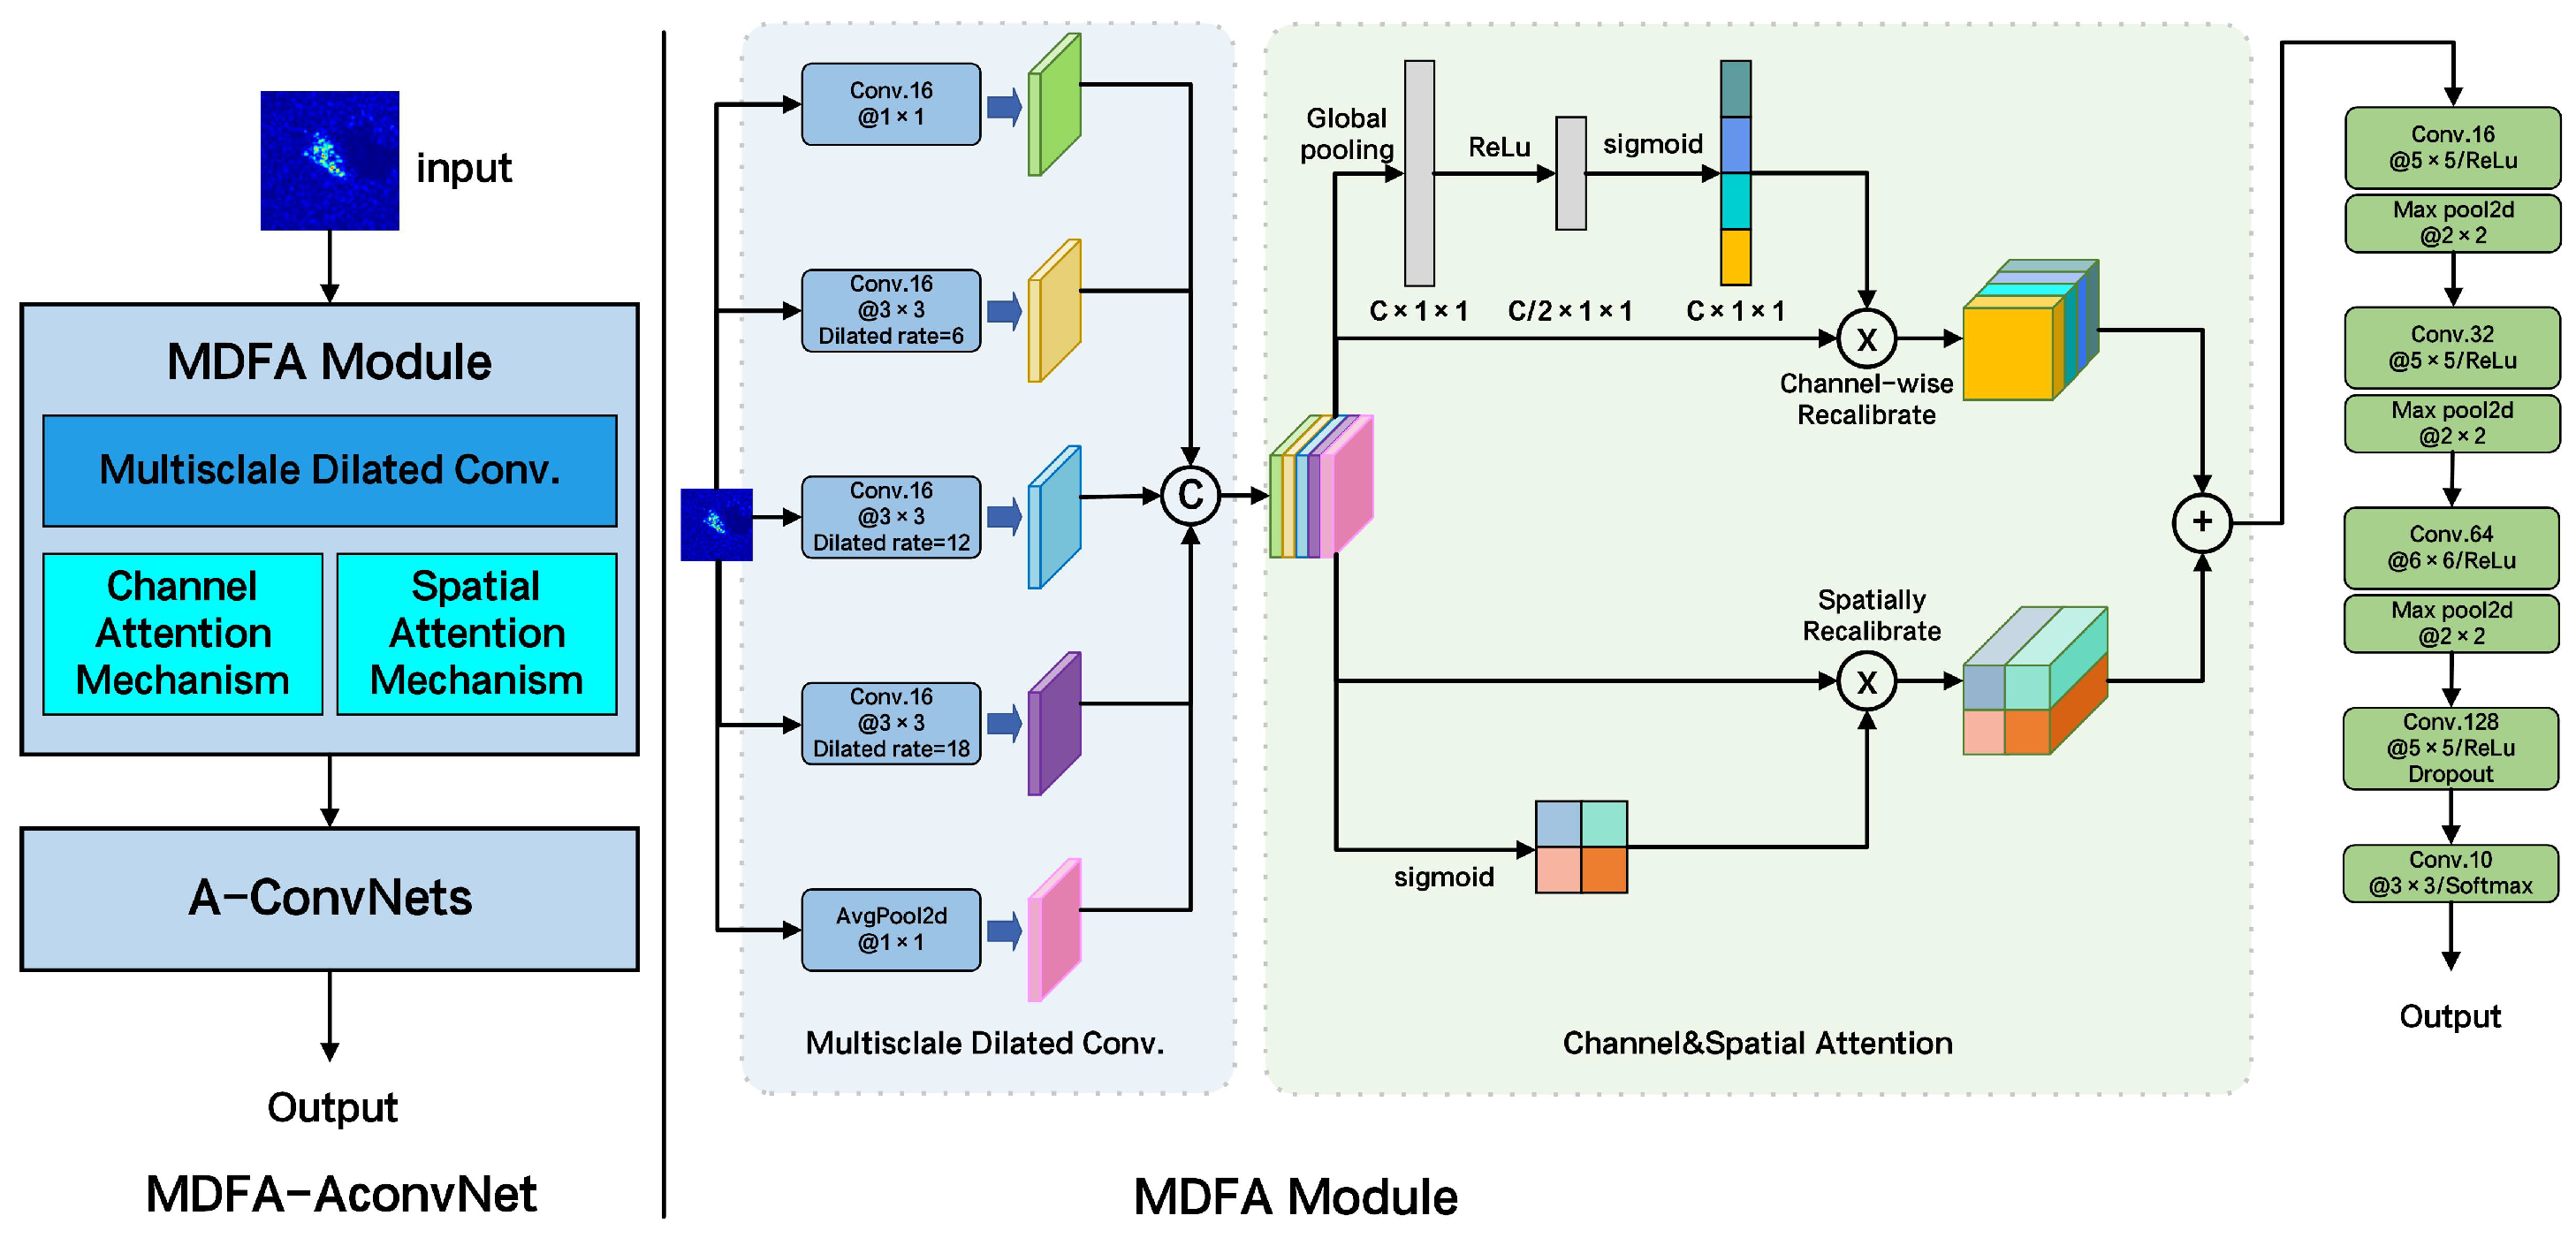
The overall architecture of the proposed MDFA-AconvNet is illustrated in Figure 2. The model comprises two main components: the Multiscale Dilated Fusion Attention (MDFA) module and an All Convolutional Network (A-ConvNets) backbone. The MDFA module consists of two submodules. The first is a multiscale dilated convolutional block, which employs convolution layers with different dilation rates to capture features across multiple receptive field scales. The second is an attention fusion module that integrates both channel attention and spatial attention, enabling the network to adaptively recalibrate feature responses and focus on informative regions. To mitigate the overfitting issues typically associated with limited training data, the A-ConvNets backbone adopts a fully convolutional architecture [9], which eliminates fully connected layers and significantly reduces the number of trainable parameters while maintaining strong discriminative capability.

3.2. Multiscale Dilated Fusion Attention Module

The Multiscale Dilated Fusion Attention (MDFA) module is the core component of the proposed architecture, designed to extract rich, attention-weighted multiscale features. As illustrated in Figure 2, let the input feature be denoted by F R C × H × W , where C, H, and W represent the number of channels, height, and width, respectively. The input feature F is processed by five parallel branches: four dilated convolution branches with dilation rates of 1, 6, 12, and 18, and one global context pooling branch. The first branch uses a standard 1 × 1 convolution to retain local detail. The next three branches employ 3 × 3 dilated convolutions with increasing dilation rates, enabling exponential expansion of the receptive field and facilitating the capture of long-range dependencies. The fifth branch applies a global average pooling operation followed by a 1 × 1 convolution to encode global contextual information, enhancing the network’s understanding of the overall scene structure. The fifth branch serves as a global context encoder. By applying global average pooling, it captures the overall statistical properties of the SAR image, which is particularly useful for identifying target characteristics that depend on the entire object structure rather than local features. The subsequent upsampling distributes this global information uniformly across all spatial locations, allowing it to be fused with local features from other branches. This design is inspired by the fact that SAR target recognition often benefits from both local scattering centers (captured by branches 1–4) and global shape information (captured by branch 5). The outputs of these five branches are concatenated along the channel dimension, forming a composite multiscale feature representation. Specifically, for an input feature map F R 1 × H × W where H = W = 128 for the original SAR image (or H = W = 88 after random cropping during training), the five parallel branches process the input as follows:
F 1 = ReLU ( BN ( Conv 1 × 1 , 16 ( F ) ) ) R 16 × H × W
F 2 = ReLU ( BN ( Conv 3 × 3 , 16 d = 6 , p = 6 ( F ) ) ) R 16 × H × W
F 3 = ReLU ( BN ( Conv 3 × 3 , 16 d = 12 , p = 12 ( F ) ) ) R 16 × H × W
F 4 = ReLU ( BN ( Conv 3 × 3 , 16 d = 18 , p = 18 ( F ) ) ) R 16 × H × W
F 5 = Upsample ( ReLU ( BN ( Conv 1 × 1 , 16 ( A v g P o o l ( F ) ) ) ) )
where Conv k × k , c d , p denotes convolution with kernel size k, c output channels, dilation rate d, and padding p. The outputs are concatenated:
F MDcat = Concat [ F 1 , F 2 , F 3 , F 4 , F 5 ] R 80 × H × W
To further improve feature fusion and enhance the model’s ability to focus on informative cues while suppressing irrelevant ones, we incorporate a dual-attention mechanism that combines channel and spatial attention in parallel. This module allows the network to selectively emphasize salient features across both dimensions. In the channel attention branch, the multiscale feature map F MDcat undergoes global average pooling to extract channel-wise descriptors. These descriptors are passed through two fully connected layers with ReLU and Sigmoid activations to compute the channel attention weights W c h a n n e l . These weights are then applied to the feature map via element-wise multiplication, yielding channel-refined features F c h a n n e l . This process is described by Equations (7) and (8):
W c h a n n e l = σ ReLU F C A v g P o o l F M D c a t
F c h a n n e l = F M D c a t W c h a n n e l
where ⊙ denotes element-wise multiplication and σ is the Sigmoid function.
For spatial attention, the multiscale feature map F M D c a t is first processed with a 1 × 1 convolution across all channels to generate a spatial attention map. After applying the Sigmoid function, the resulting weights W s p a t i a l are used to reweight the feature map spatially, producing F s p a t i a l . The process is captured in Equations (9) and (10):
W s p a t i a l = σ Conv 1 × 1 F M D c a t
F s p a t i a l = F M D c a t W s p a t i a l
where Conv 1 × 1 ( · ) represents a 1 × 1 convolution.
In contrast to many existing approaches that apply channel and spatial attention sequentially, we adopt a parallel attention fusion strategy. The two attention mechanisms operate independently, and the final output is obtained by taking the element-wise maximum of their respective outputs. The max operation was chosen over summation or weighted averaging to preserve the strongest discriminative features from either attention pathway, preventing dilution of salient responses that could occur with averaging operations [36,37]. This design allows the network to adaptively highlight the most salient features, whether emphasized by spatial or channel attention. The overall feature fusion process is formalized in Equation (11):
F M D F A = m a x F c h a n n e l , F s p a t i a l

3.3. All Convolutional Network Module

The multiscale attention-enhanced features extracted by the MDFA module are passed to the All Convolutional Network (A-ConvNets) for final target classification. This architecture is specifically designed to address overfitting, a common challenge in SAR image classification caused by limited training samples [9]. Unlike conventional convolutional neural networks, A-ConvNets entirely removes fully connected layers and is composed solely of convolution and pooling operations, substantially reducing the number of parameters.
As shown in the right panel of Figure 2, the A-ConvNets module is composed of five convolutional layers interleaved with three max-pooling layers. Each convolutional layer is followed by a ReLU activation function to introduce non-linearity. The first three convolutional layers use filters of size 5 × 5, 5 × 5, and 6 × 6, respectively, and each is followed by a 2 × 2 max-pooling operation with a stride of 2, effectively halving the spatial resolution while preserving key feature representations. The fourth convolutional layer employs 128 filters of size 5 × 5 and incorporates a dropout mechanism with a dropout rate of 0.5 to prevent overfitting. The final layer applies 10 filters of size 3 × 3, and its output is passed through a softmax activation function to produce the class probabilities for target classification.
The forward propagation for the i-th convolutional layer is expressed as:
O j ( i ) ( x , y ) = ReLU m = 1 M i 1 u , v = 0 k 1 w j , m ( i ) ( u , v ) · O m ( i 1 ) ( x u , y v ) + b j ( i )
where O j ( i ) ( x , y ) denotes the activation value at position ( x , y ) in the j-th feature map of the i-th layer, w j , m ( i ) ( u , v ) represents the convolution kernel weight connecting the m-th feature map in the ( i 1 ) -th layer to the j-th feature map in the i-th layer, b j ( i ) is the bias term, and M i 1 indicates the number of feature maps in the ( i 1 ) -th layer.
Max-pooling is computed as:
O i ( l + 1 ) ( x , y ) = max u , v = 0 , , G 1 O i ( l ) ( x · s + u , y · s + v )
where G denotes the size of the pooling window and s is the stride, which determines the spacing between adjacent pooling windows.
Dropout, applied in the fourth convolutional layer, is formulated as:
O j ( 4 ) ( x , y ) = m j ( x , y ) · ReLU m = 1 64 u , v = 0 4 w j , m ( 4 ) ( u , v ) · O m ( 3 ) ( x u , y v ) + b j ( 4 )
where m j x , y is a Bernoulli random variable that takes the value 0 or 1 with a probability of 0.5.
The softmax activation function is used in the final layer to compute class probabilities:
p c = exp ( O c ( 5 ) ) j = 1 10 exp ( O j ( 5 ) )
where p c denotes the probability that the input image belongs to class c.
Training is conducted using mini-batch stochastic gradient descent with momentum. The loss function is cross-entropy with an L2 regularization term:
L = 1 N i = 1 N c = 1 10 y c i l o g p c i + λ W 2 2
where y c i denotes the ground truth label (0 or 1) indicating whether the i-th sample belongs to class c, p c i is the predicted probability that the network assigns the i-th sample to class c, λ is the regularization coefficient, and W 2 2 is the L2 norm of all weights.
Parameters are updated using the following momentum-based rules:
v i + 1 = 0.9 · v i 0.004 · ε · w i ε · L w i i
w i + 1 = w i + v i + 1
where i is the iteration step, ε is the learning rate, v is the momentum velocity parameter and L w i i denotes the average gradient of the loss function with respect to w i .
To augment the training data, 88 × 88 image patches are randomly cropped from the original 128 × 128 SAR images, enabling up to ( 128 88 + 1 ) 2 = 1681 samples per class. Compared with traditional CNNs, A-ConvNets reduces the parameter count from several million to just a few hundred thousand, while maintaining strong feature representation capabilities. This makes it particularly well-suited for SAR image classification tasks under limited data conditions, improving generalization and offering robust classification performance for the overall MDFA-AconvNet framework. Figure 3 illustrates an example of a randomly cropped SAR image.

4. Experiments and Analysis

4.1. Experimental Dataset

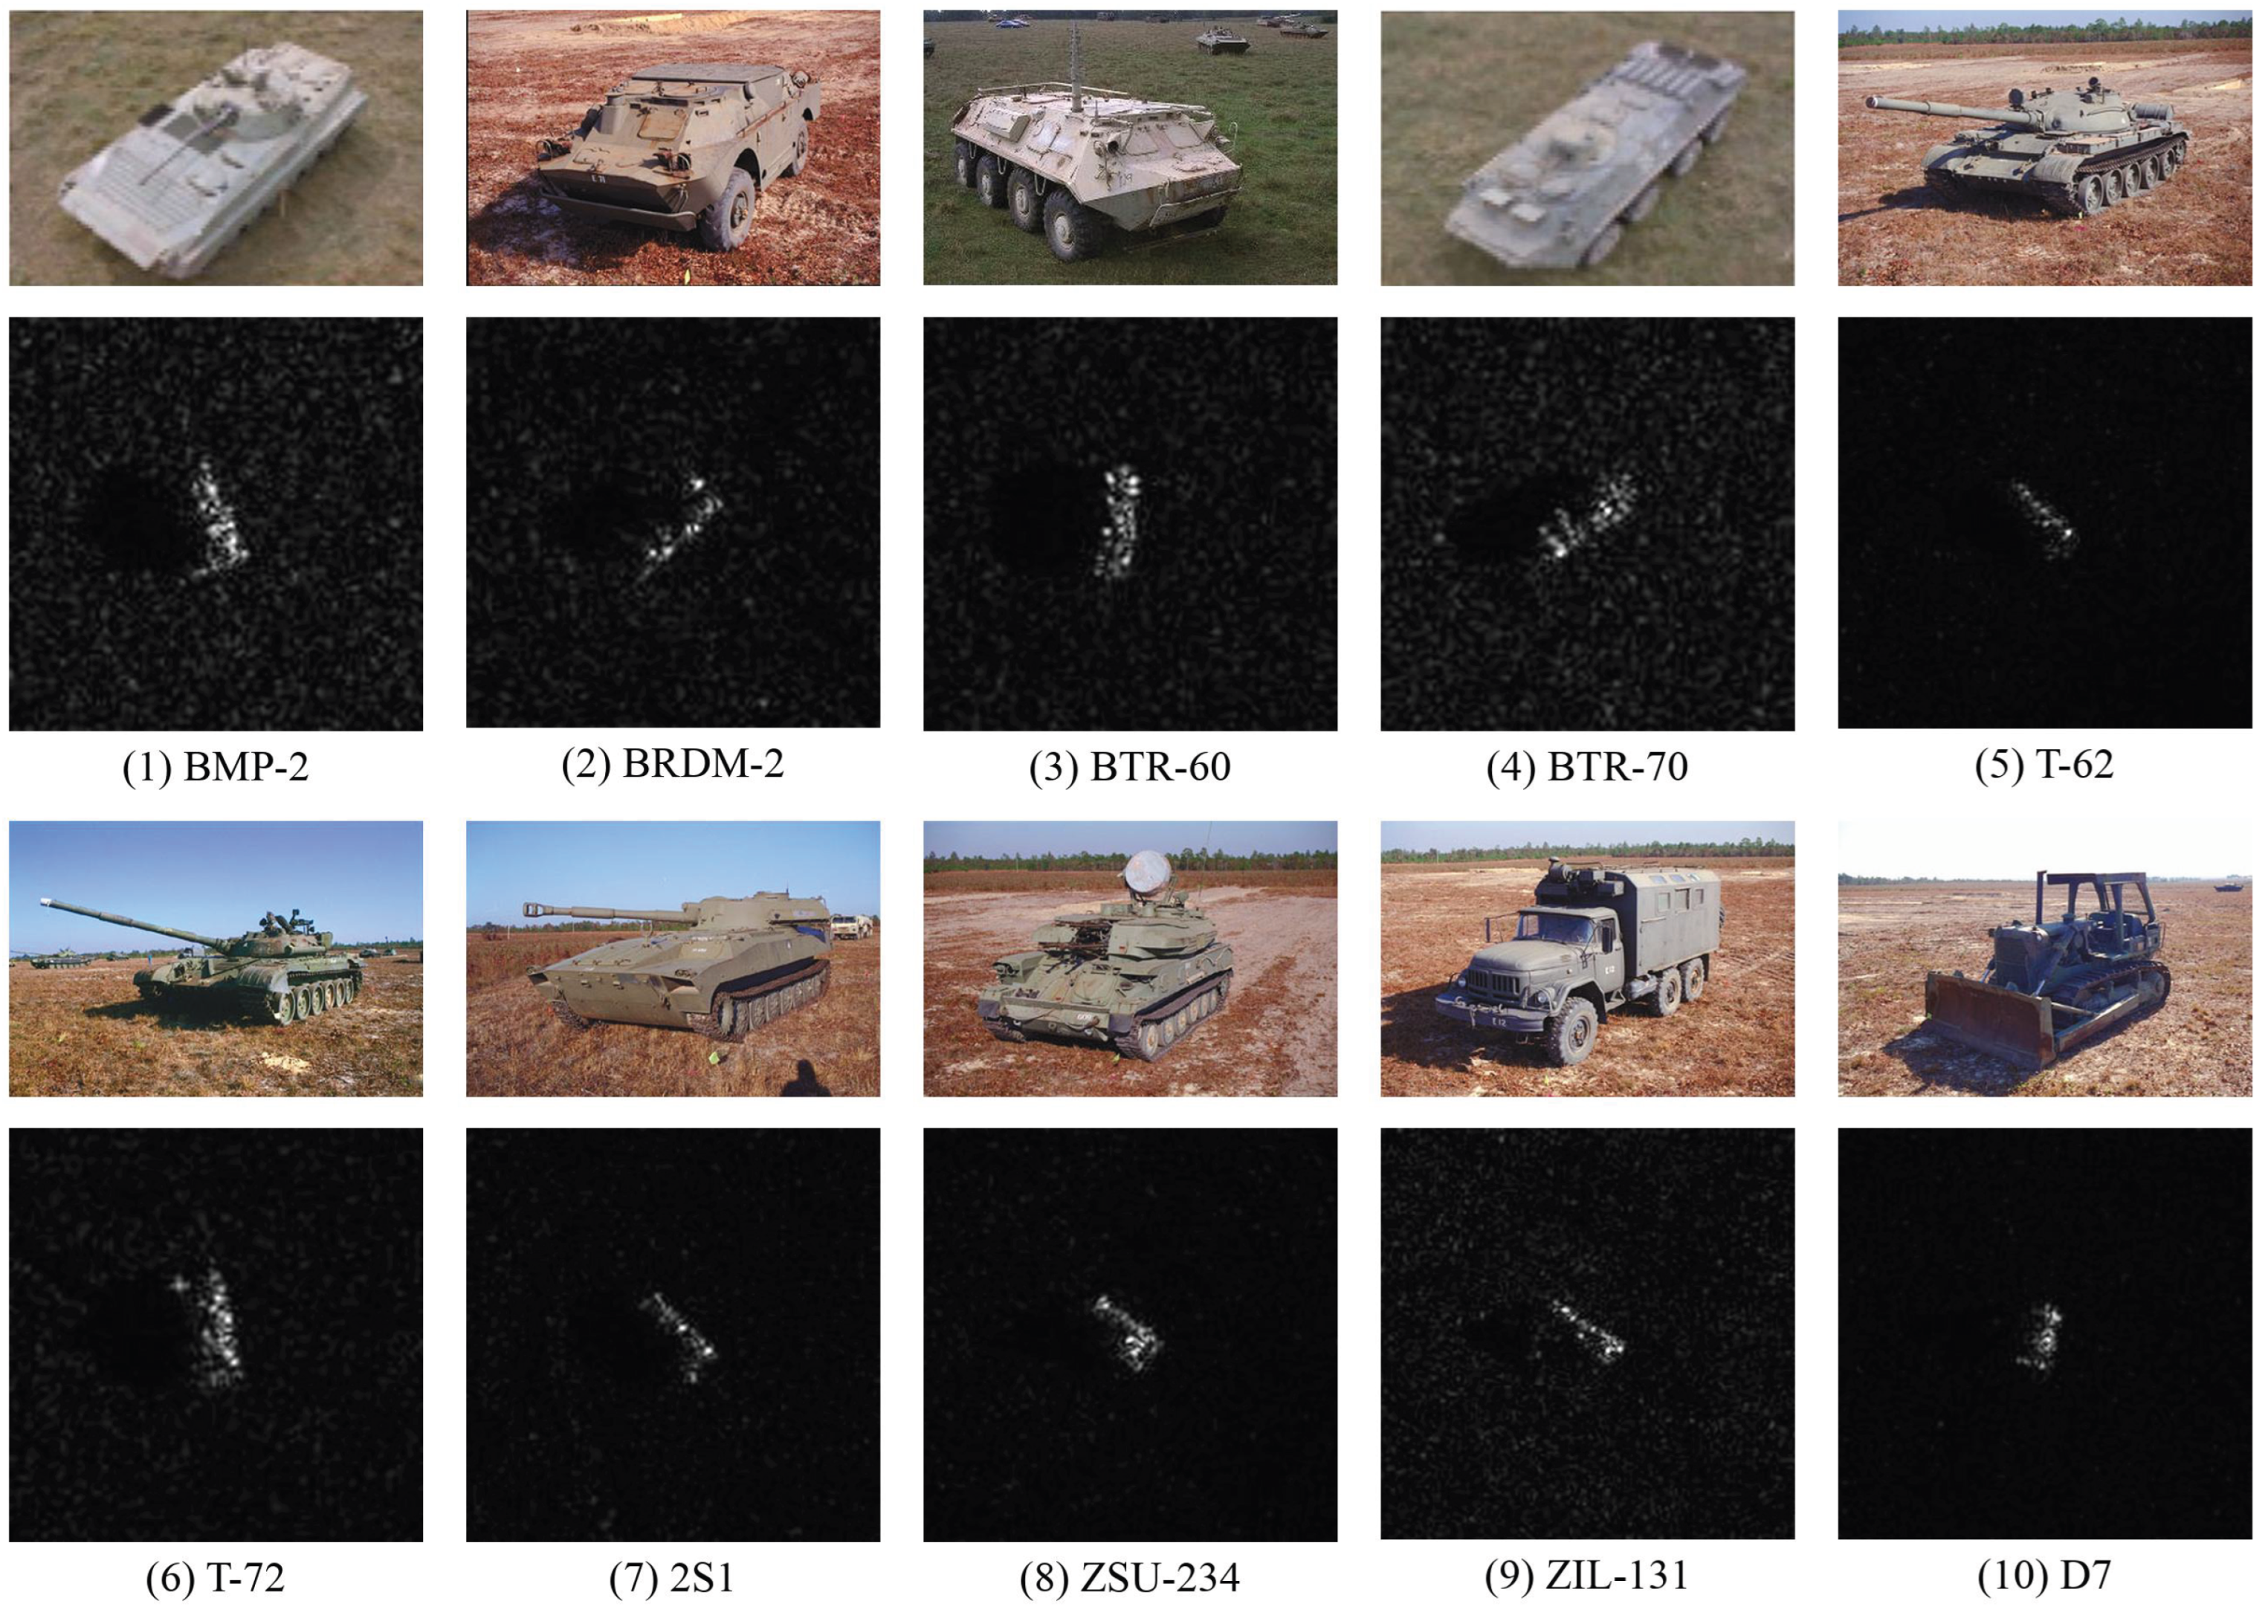
This study employs the Moving and Stationary Target Acquisition and Recognition (MSTAR) dataset [38], a widely used benchmark in SAR-based automatic target recognition (ATR). The dataset was collected by Sandia National Laboratories (SNL) between 1995 and 1997, with support from the Defense Advanced Research Projects Agency (DARPA) and the Air Force Research Laboratory (AFRL). Data acquisition was performed using an X-band high-resolution spotlight SAR system, achieving a spatial resolution of 0.3 m × 0.3 m. Each image has a size of 128 × 128 pixels, is acquired in HH polarization mode, and covers a full 360° azimuth range. The publicly released MSTAR dataset contains ten categories of ground military targets, including armored personnel carriers (BMP2, BRDM2, BTR60, and BTR70), tanks (T-62 and T-72), a rocket launcher (2S1), an air defense unit (ZSU234), a truck (ZIL131), and a bulldozer (D7). Figure 4 provides representative SAR images and their corresponding optical counterparts for these target types.
To thoroughly evaluate the classification performance of the proposed Multiscale Dilated Fusion Attention (MDFA) module, experiments are conducted under both Standard Operating Conditions (SOC) and Extended Operating Conditions (EOC). SOC refers to scenarios in which the target serial numbers and configurations are consistent between training and test sets, with only minor sensor variations, such as slight changes in elevation angle. As shown in Table 1, SAR images acquired at an elevation angle of 17° are used for training, while those collected at 15° serve as the test set. In contrast, EOC represents more challenging situations involving significant differences in sensor angle, target configuration, or target model version. In this study, these are further categorized into three types: EOC-1, which involves large elevation angle variations; EOC-2-CV, which includes target configuration variants; and EOC-2-VV, which involves target version variants. Since SAR imagery is highly sensitive to such changes, evaluations under EOC provide a more rigorous test of model robustness and generalization capability. Table 2 presents the experimental setup for EOC-1, where the dataset includes only four target types (T-72, 2S1, BRDM2, and ZSU234), with training data acquired at a 17° elevation angle and testing data at 30°. Table 3 and Table 4 detail the experimental configurations for EOC-2-CV and EOC-2-VV, respectively, enabling comprehensive assessment of the model’s performance under more realistic and challenging conditions.

4.2. Results and Analysis Under SOC

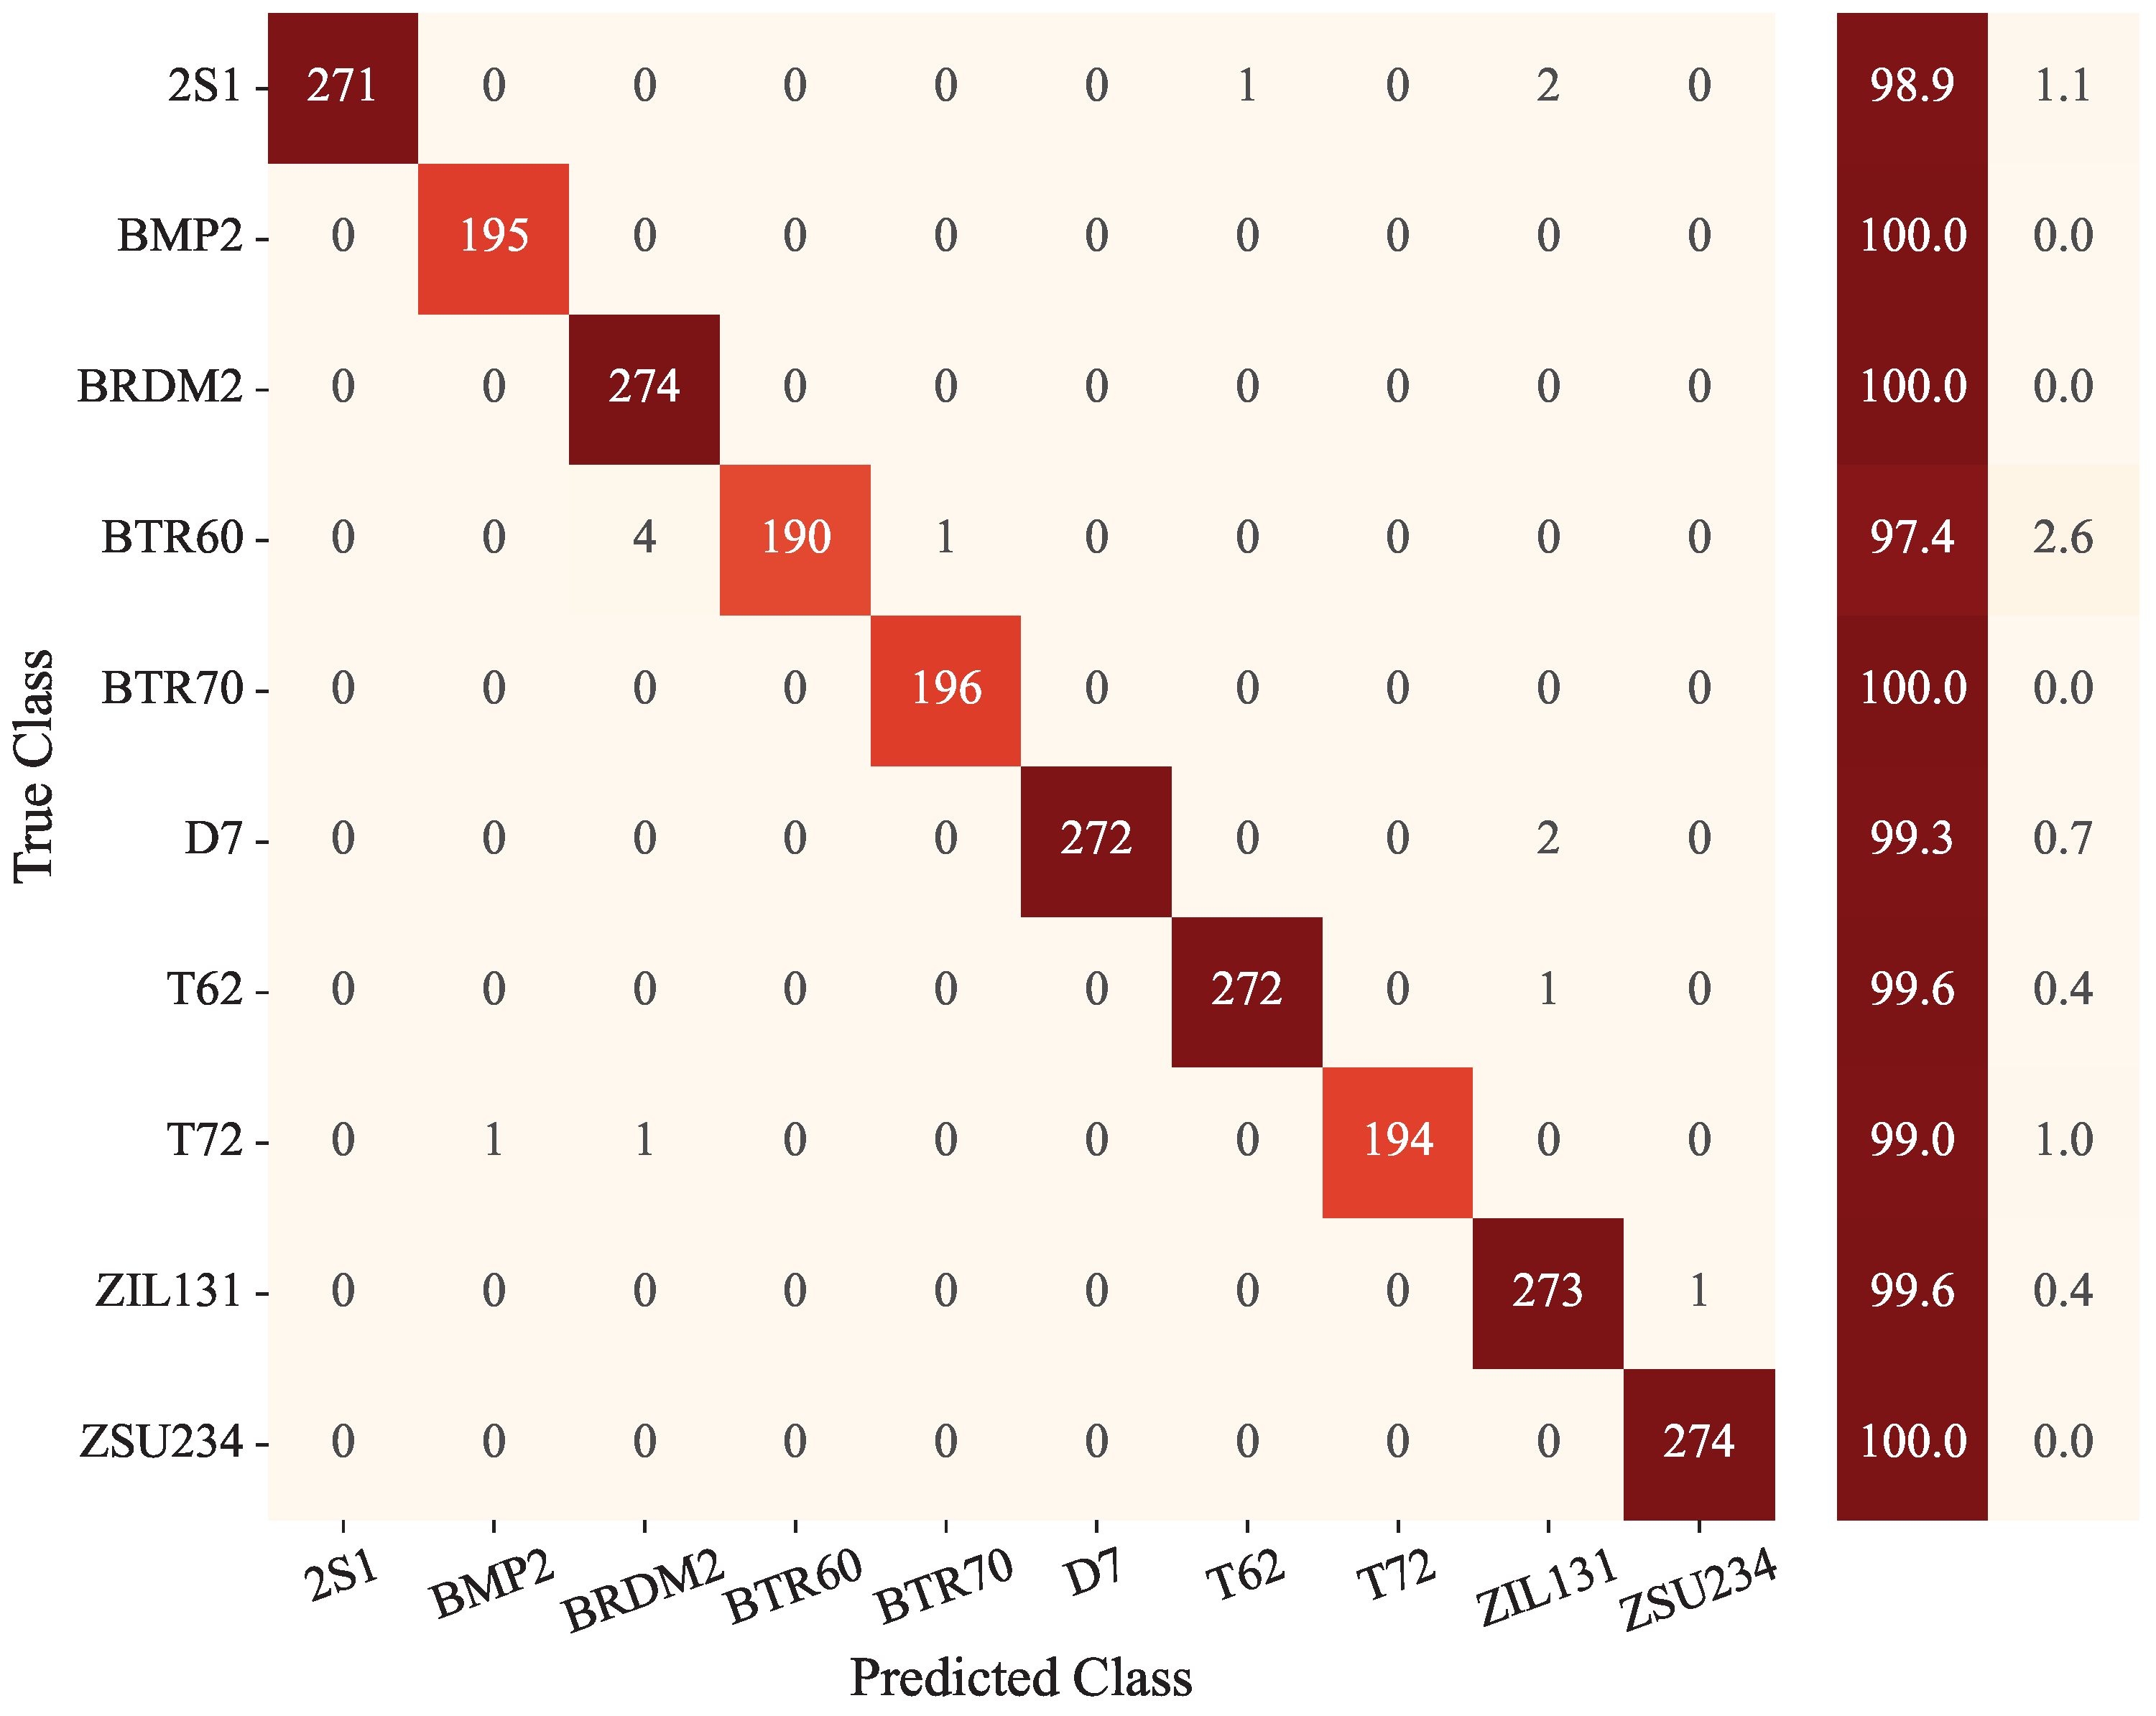
The results reported in this section represent the best performing model from our experiments. A comprehensive statistical analysis across multiple runs is presented in Section 4.6. This section evaluates the performance of the proposed MDFA-AconvNet under SOC. The dataset partitioning and label distribution are provided in Table 1. All training SAR images were augmented using random cropping to enrich the training set. The model was trained for 100 epochs using the Adam optimizer with an initial learning rate of 0.001. To enhance training stability and convergence, a step decay learning rate schedule (StepLR) was adopted, reducing the learning rate by a factor of 0.1 every 50 epochs. The loss function incorporates label smoothing ( ε = 0.1) within a cross-entropy framework to promote generalization and reduce overfitting. Figure 5 presents the classification results of MDFA-AconvNet in the form of a confusion matrix. Each row corresponds to the ground truth label, and each column represents the predicted class. The model achieved an average classification accuracy of 99.38% across ten target categories. The dominance of values along the diagonal indicates high classification consistency. Notably, four categories, BMP2, BRDM2, BTR70, and ZSU234 achieved 100% accuracy.
To comprehensively demonstrate the effectiveness of the proposed MDFA-AconvNet, we conducted a comparative analysis against several representative methods for SAR target classification. These include classical deep convolutional neural networks such as VGG-Net [20] and ResNet [21], as well as A-ConvNet [9], a fully convolutional network designed to reduce the number of trainable parameters and effectively mitigate overfitting. We also compared with VDCNN [39], a multi-view deep network that progressively aggregates features from SAR images of the same target captured from different perspectives. Transformer-based models, including ViT-B/16 [26] and Swin-T [40], were evaluated as state-of-the-art approaches in image classification. Additionally, we included ConvNeXt [41], a modernized CNN architecture that achieves transformer-like performance by refining the structure of ResNet. Finally, MKSFF-CNN [42] was considered, which employs multiple convolutional kernels of different sizes to extract multiscale deep features from SAR targets and optimally fuses them to minimize classification loss. This broad comparison provides a robust foundation for evaluating the superiority and generalization capability of MDFA-AconvNet across different model paradigms.
The performance of these models is summarized in Table 5. While VGG and ResNet benefit from increased depth, their fixed convolution kernel sizes limit their ability to capture multiscale information. A-ConvNet reduces overfitting by eliminating fully connected layers, but this may compromise its capacity to model global semantic structure. VDCNN incorporates domain-specific priors to enhance SAR feature representation, though acquiring such priors is often complex and dataset-dependent. Transformer-based models like ViT and Swin-T achieve state-of-the-art performance but generally require larger datasets for effective training. ConvNeXt offers competitive performance with lower data dependency, yet may still face overfitting in small-sample settings. MKSFF-CNN improves feature diversity through kernel variation but lacks sufficient attention to salient features, leading to redundancy.
In contrast, the proposed MDFA-AconvNet model focuses on enhancing informative features by integrating multiscale dilated convolutions with both spatial and channel attention mechanisms. This architecture allows the network to effectively enlarge its receptive field while remaining sensitive to fine-grained details and broad contextual dependencies. As a result, it achieves a strong balance between capturing global spatial structures and preserving local information, thereby strengthening the extraction of salient channel-wise features and key regions in SAR images. The model demonstrates superior generalization performance, particularly under limited data scenarios, achieving a final classification accuracy of 99.38%, surpassing all baseline methods. Notably, it achieves perfect or near-perfect accuracy in several target categories, including BMP2, BRDM2, BTR70, and ZSU234.
To further evaluate model performance, we report precision, recall, and F1 scores, standard metrics in SAR target recognition. These are defined as follows:
P r e c i s i o n = T P T P + F P
R e c a l l = T P T P + F N
F 1 s c o r e = 2 × P r e c i s i o n × R e c a l l P r e c i s i o n + R e c a l l
where T P , F P , and F N denote the number of true positives, false positives, and false negatives, respectively.
As shown in Figure 6, MDFA-AconvNet achieves higher values in all three metrics compared to competing methods under SOC conditions, confirming its superior classification capability and robustness.

4.3. Results and Analysis Under EOC

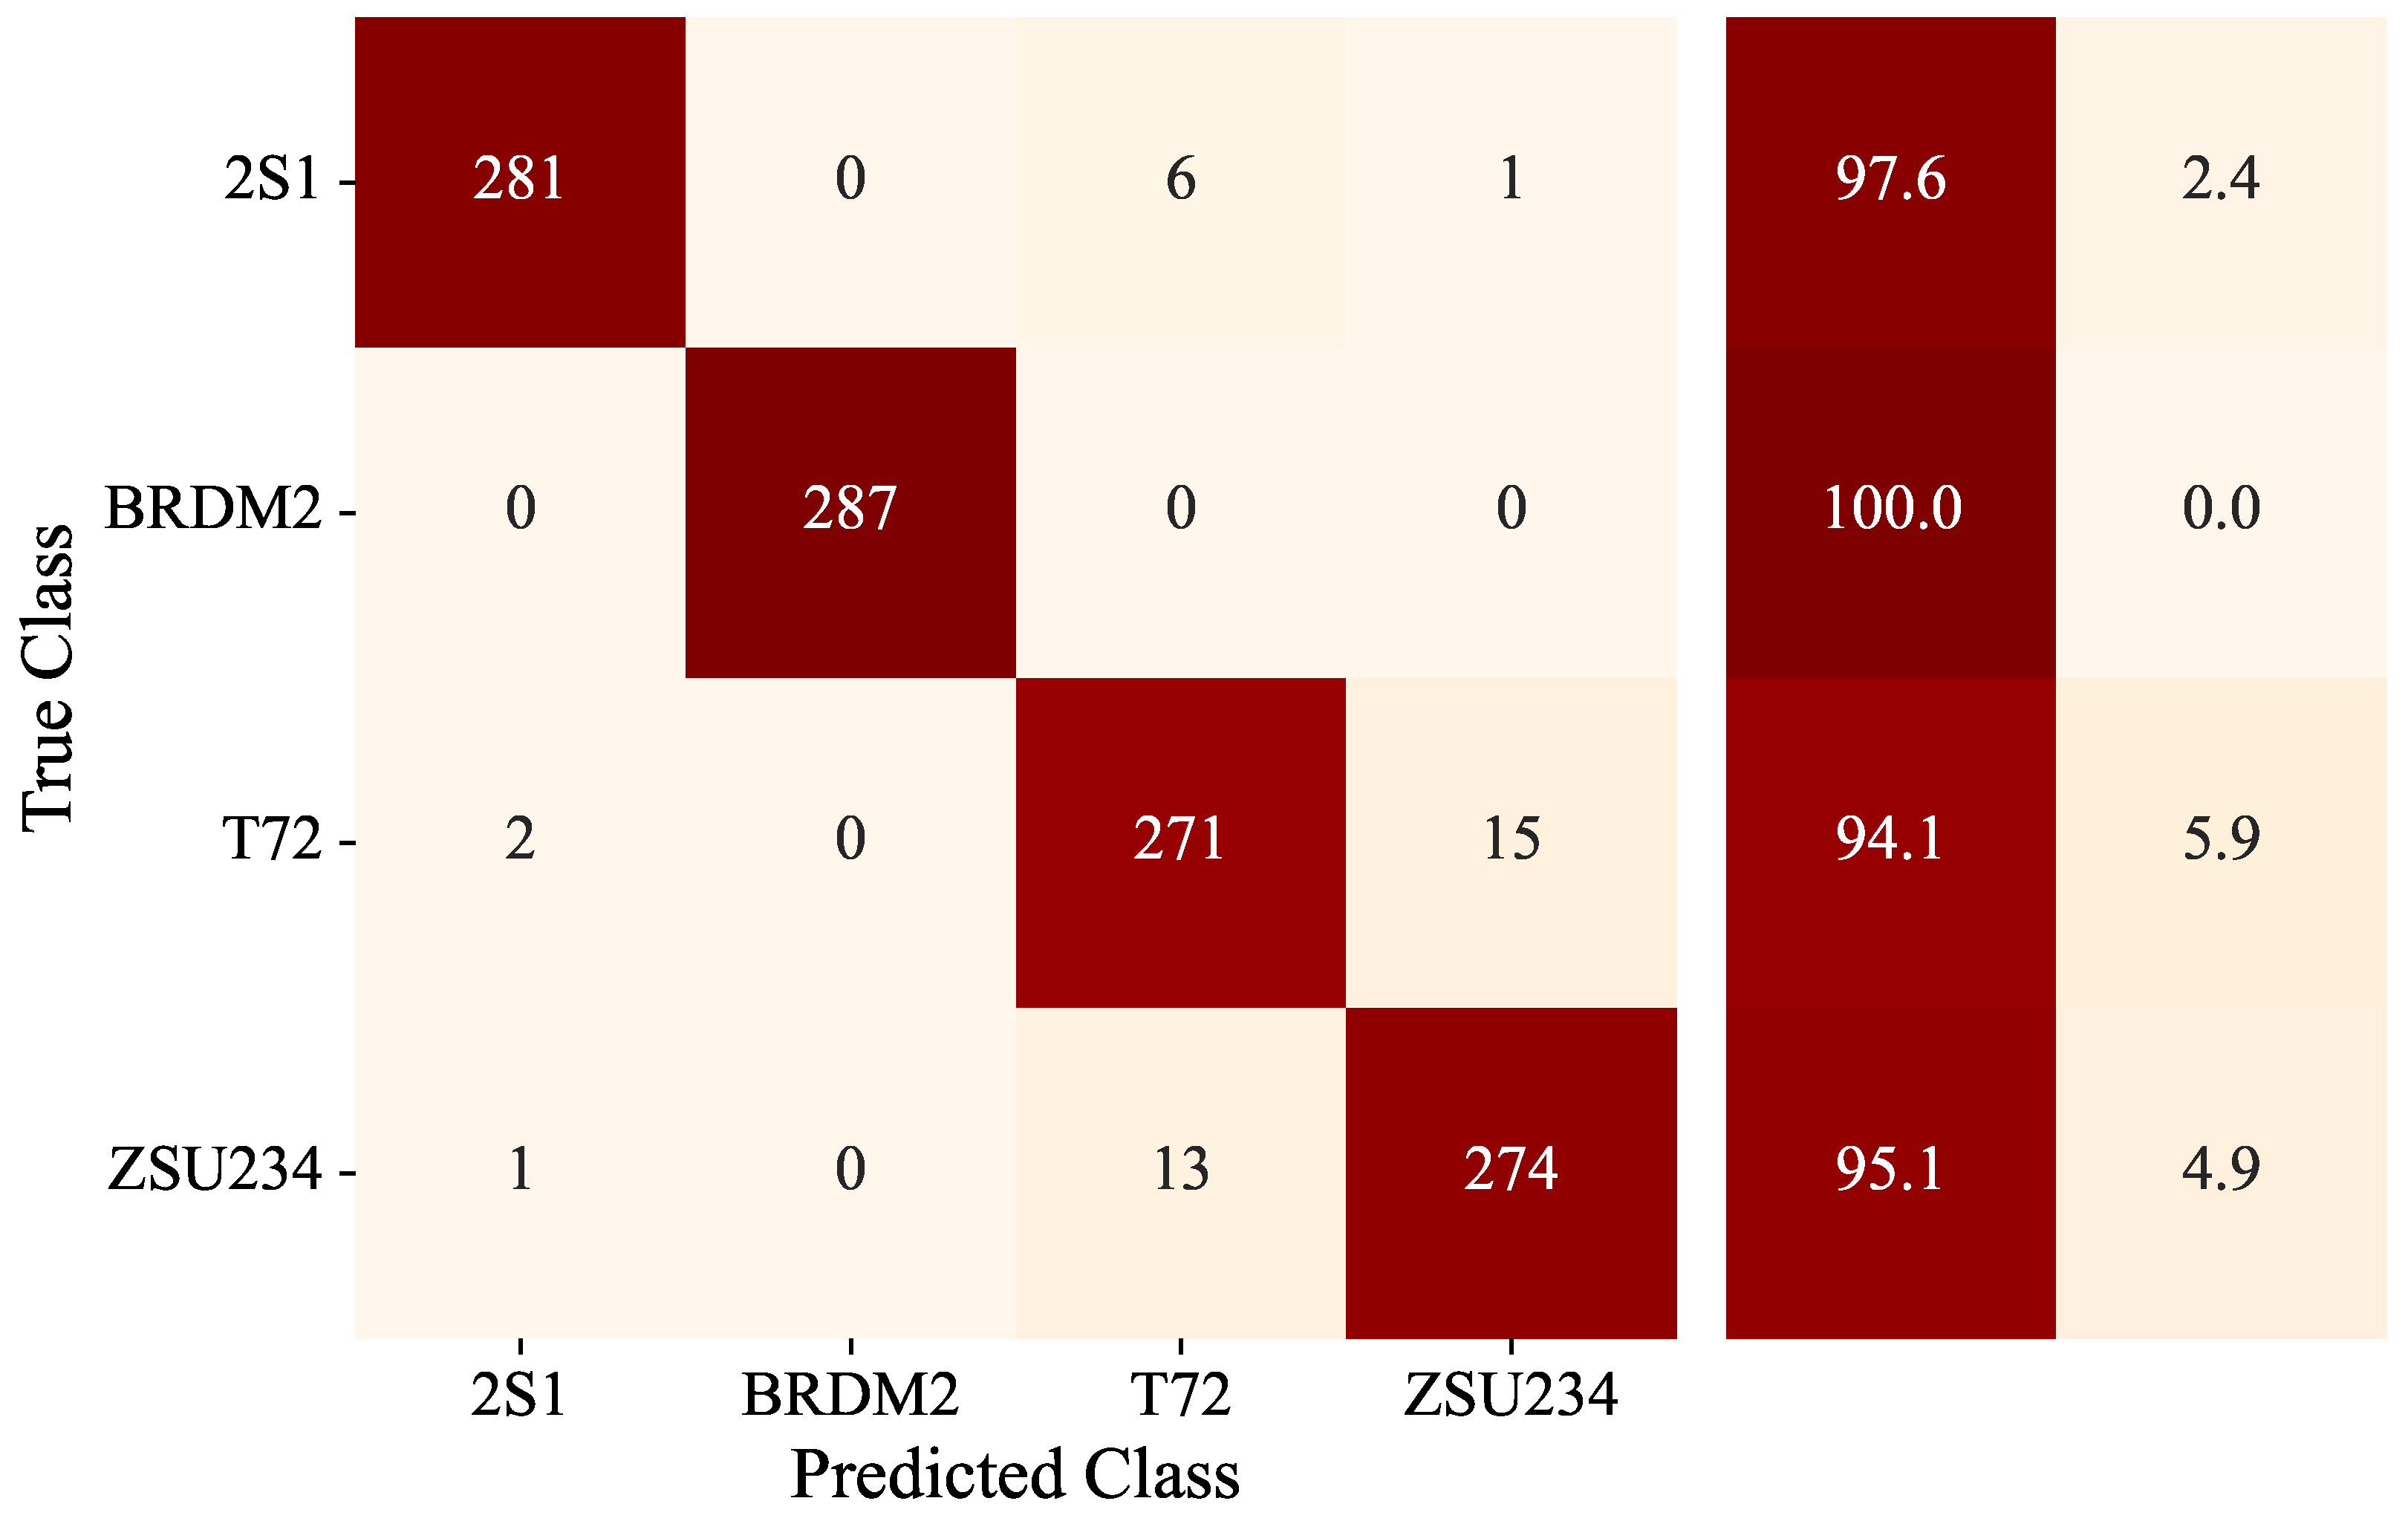
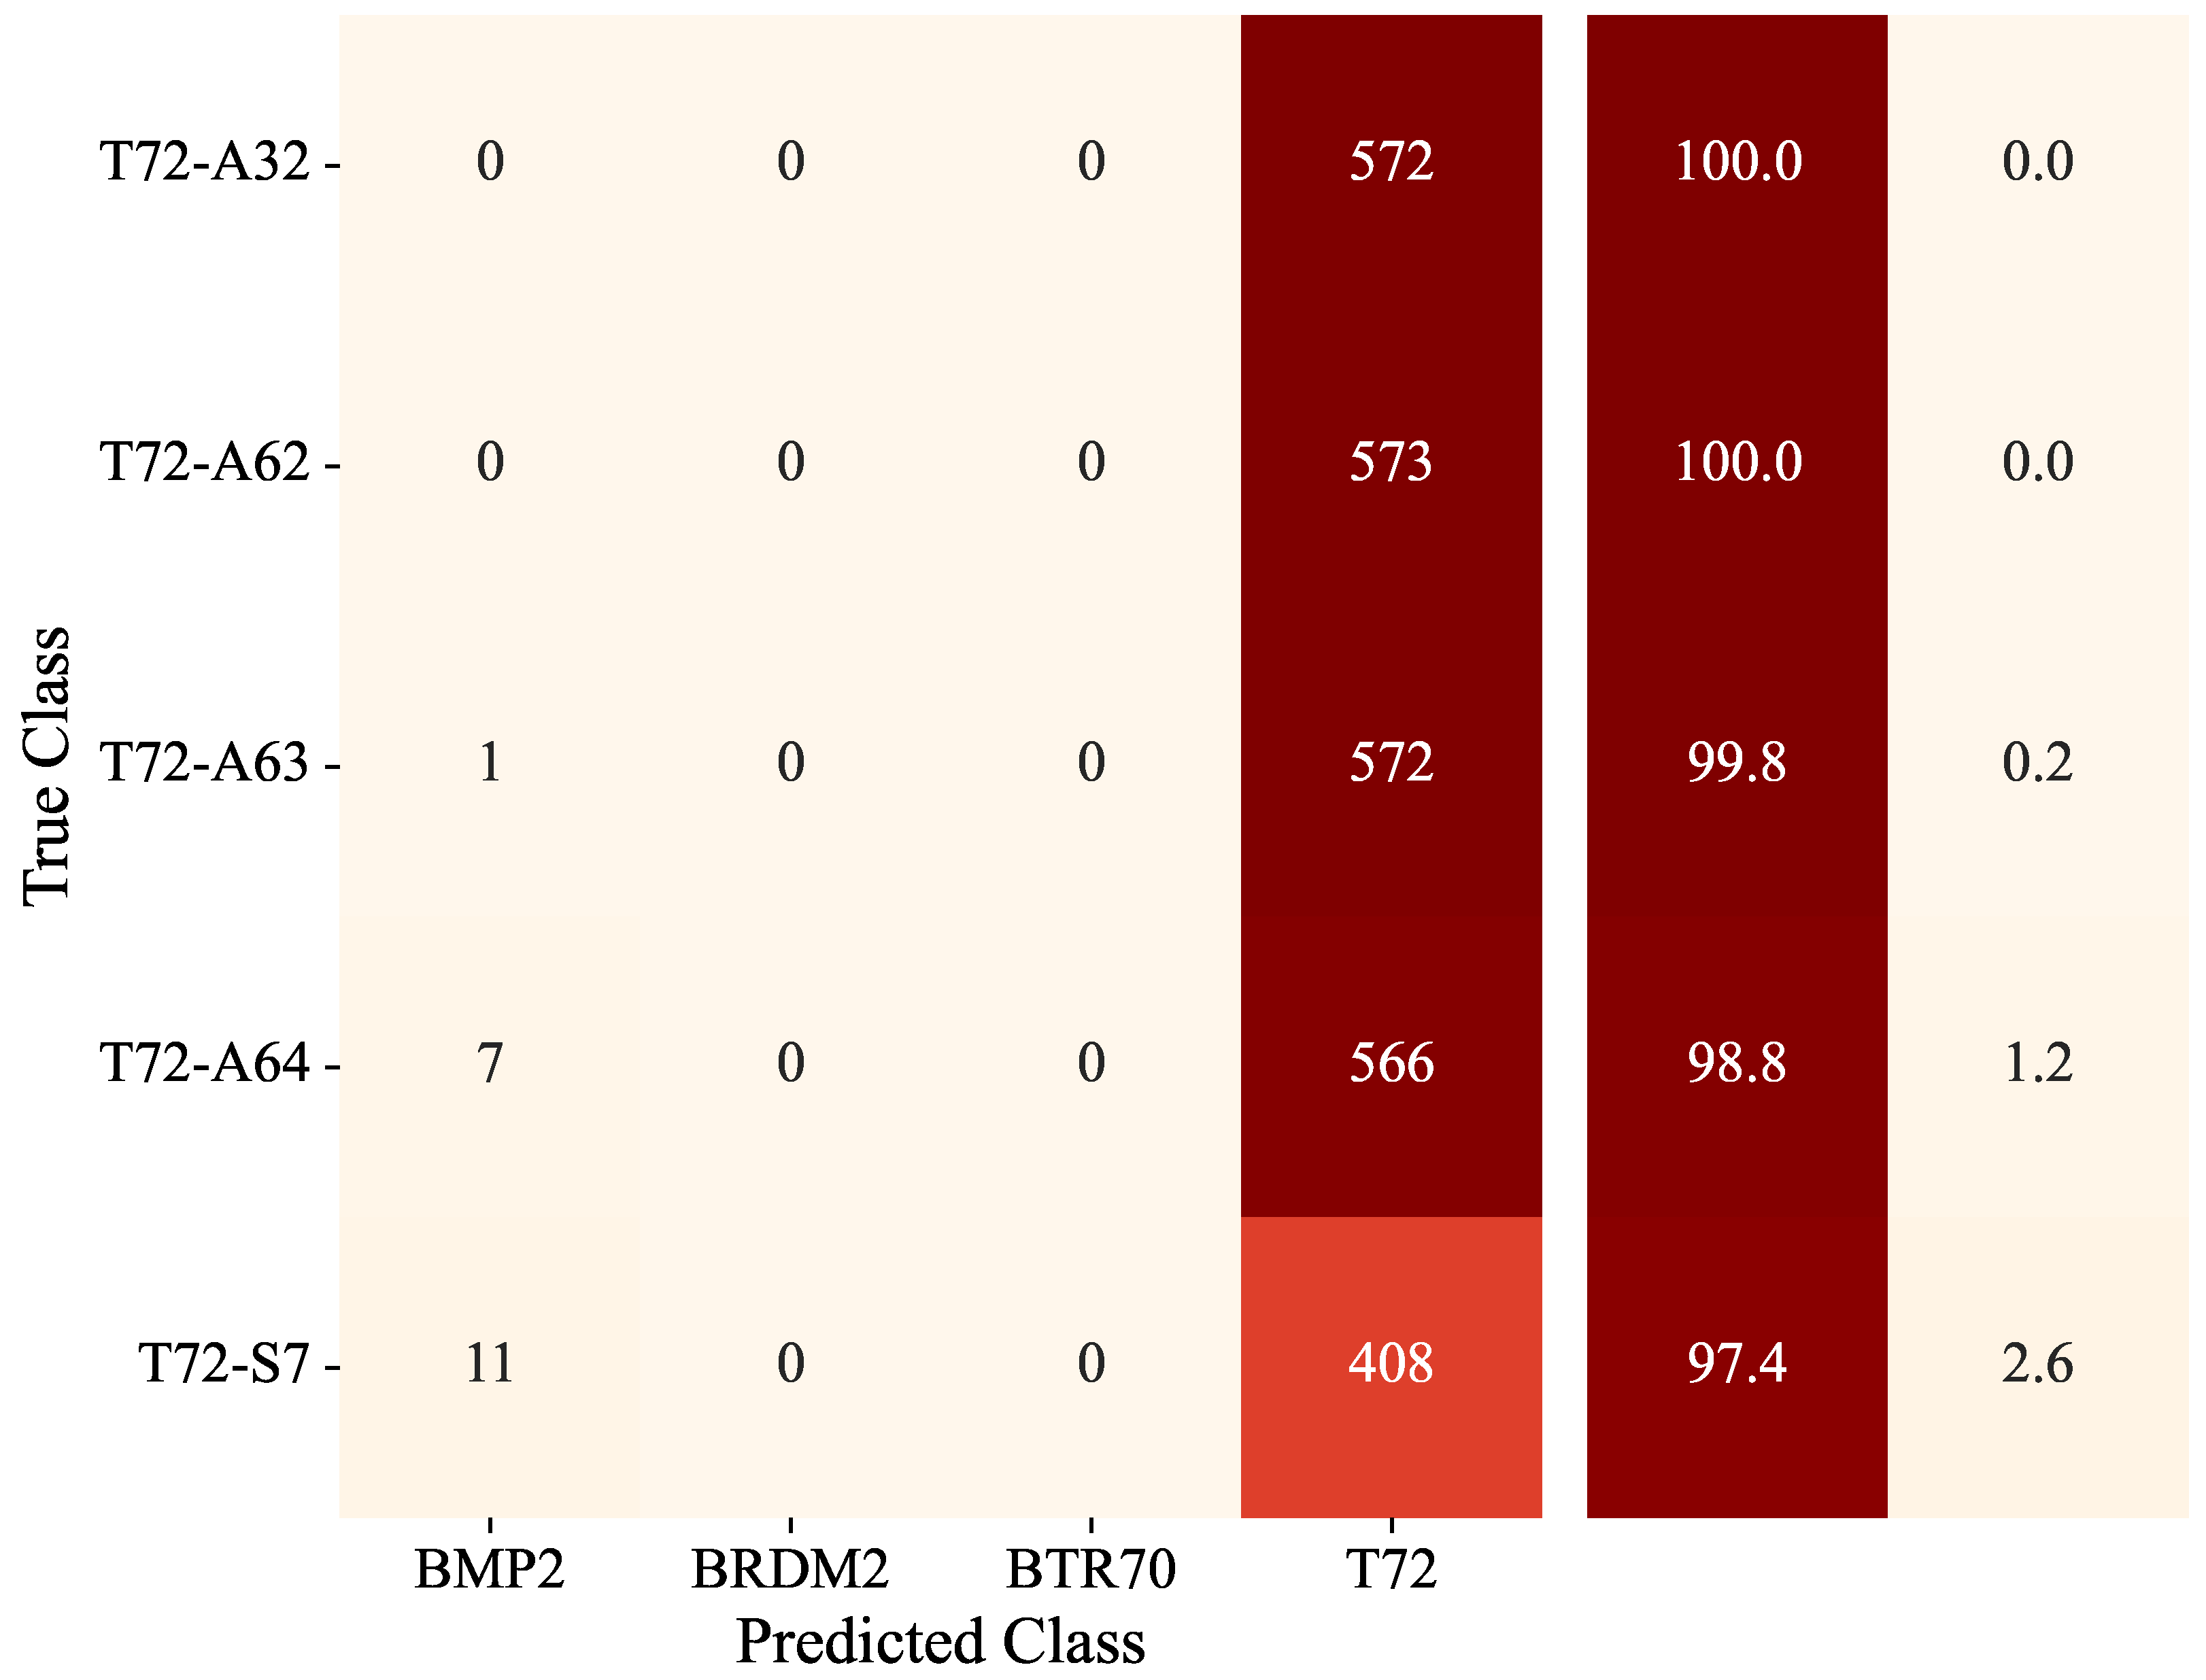
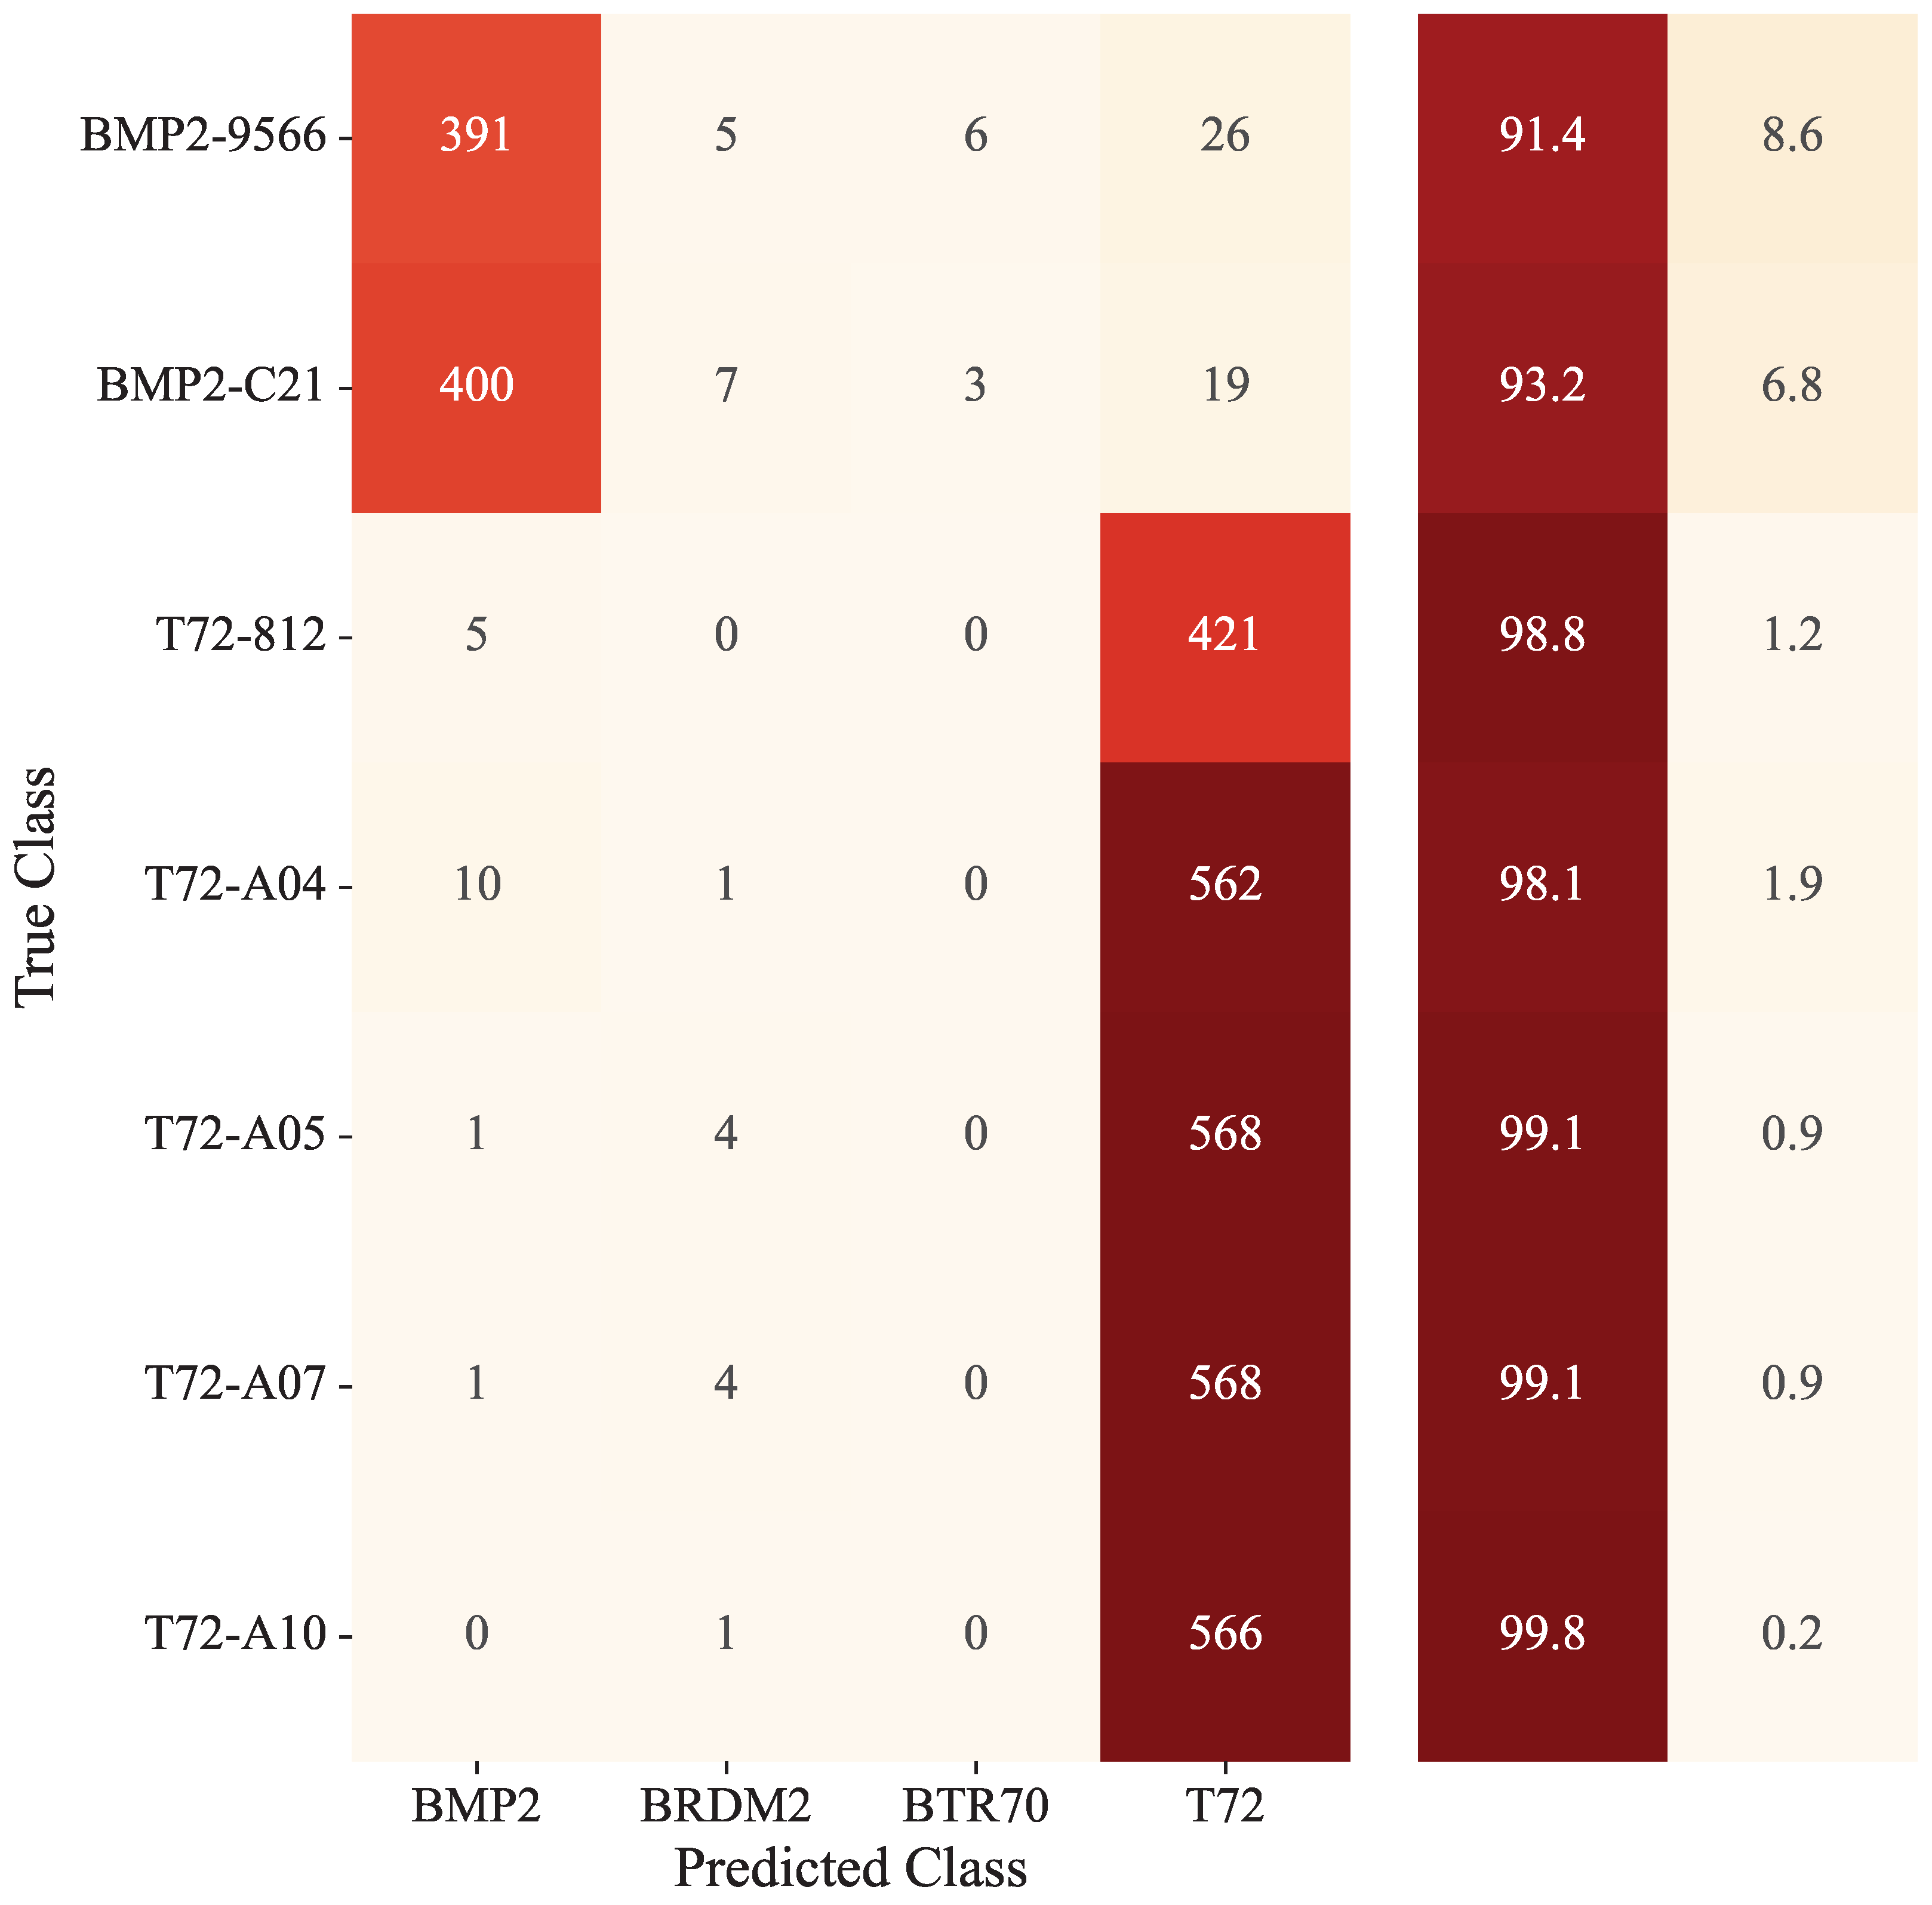
In the EOC experiments, all training SAR images were also augmented through random cropping to increase dataset diversity. Figure 7, Figure 8 and Figure 9 illustrate the classification performance of MDFA-AconvNet under the EOC-1, EOC-2-CV, and EOC-2-VV scenarios, respectively, presented as confusion matrices. Despite the presence of significant target variations, including changes in elevation angle, structural configuration, and version differences, the proposed MDFA-AconvNet consistently achieved high classification accuracy across all EOC conditions. Notably, the model attained 100% accuracy on the BRDM2 variant in the EOC-1 setting, as well as on the T-72 variants A32 and A62 under EOC-2-CV.
To comprehensively assess the robustness of MDFA-AconvNet under extended conditions, we conducted comparisons with other state-of-the-art classification methods. The results are summarized in Table 6, Table 7 and Table 8 for EOC-1, EOC-2-CV, and EOC-2-VV, respectively. The proposed method achieved average classification accuracies of 96.7% on EOC-1, 99.2% on EOC-2-CV, and 97.07% on EOC-2-VV. These findings clearly demonstrate the superior adaptability and robustness of MDFA-AconvNet in handling variations in target pose, structure, and version, highlighting its potential for real-world SAR-based automatic target recognition applications.

4.4. Noise Robustness Evaluation

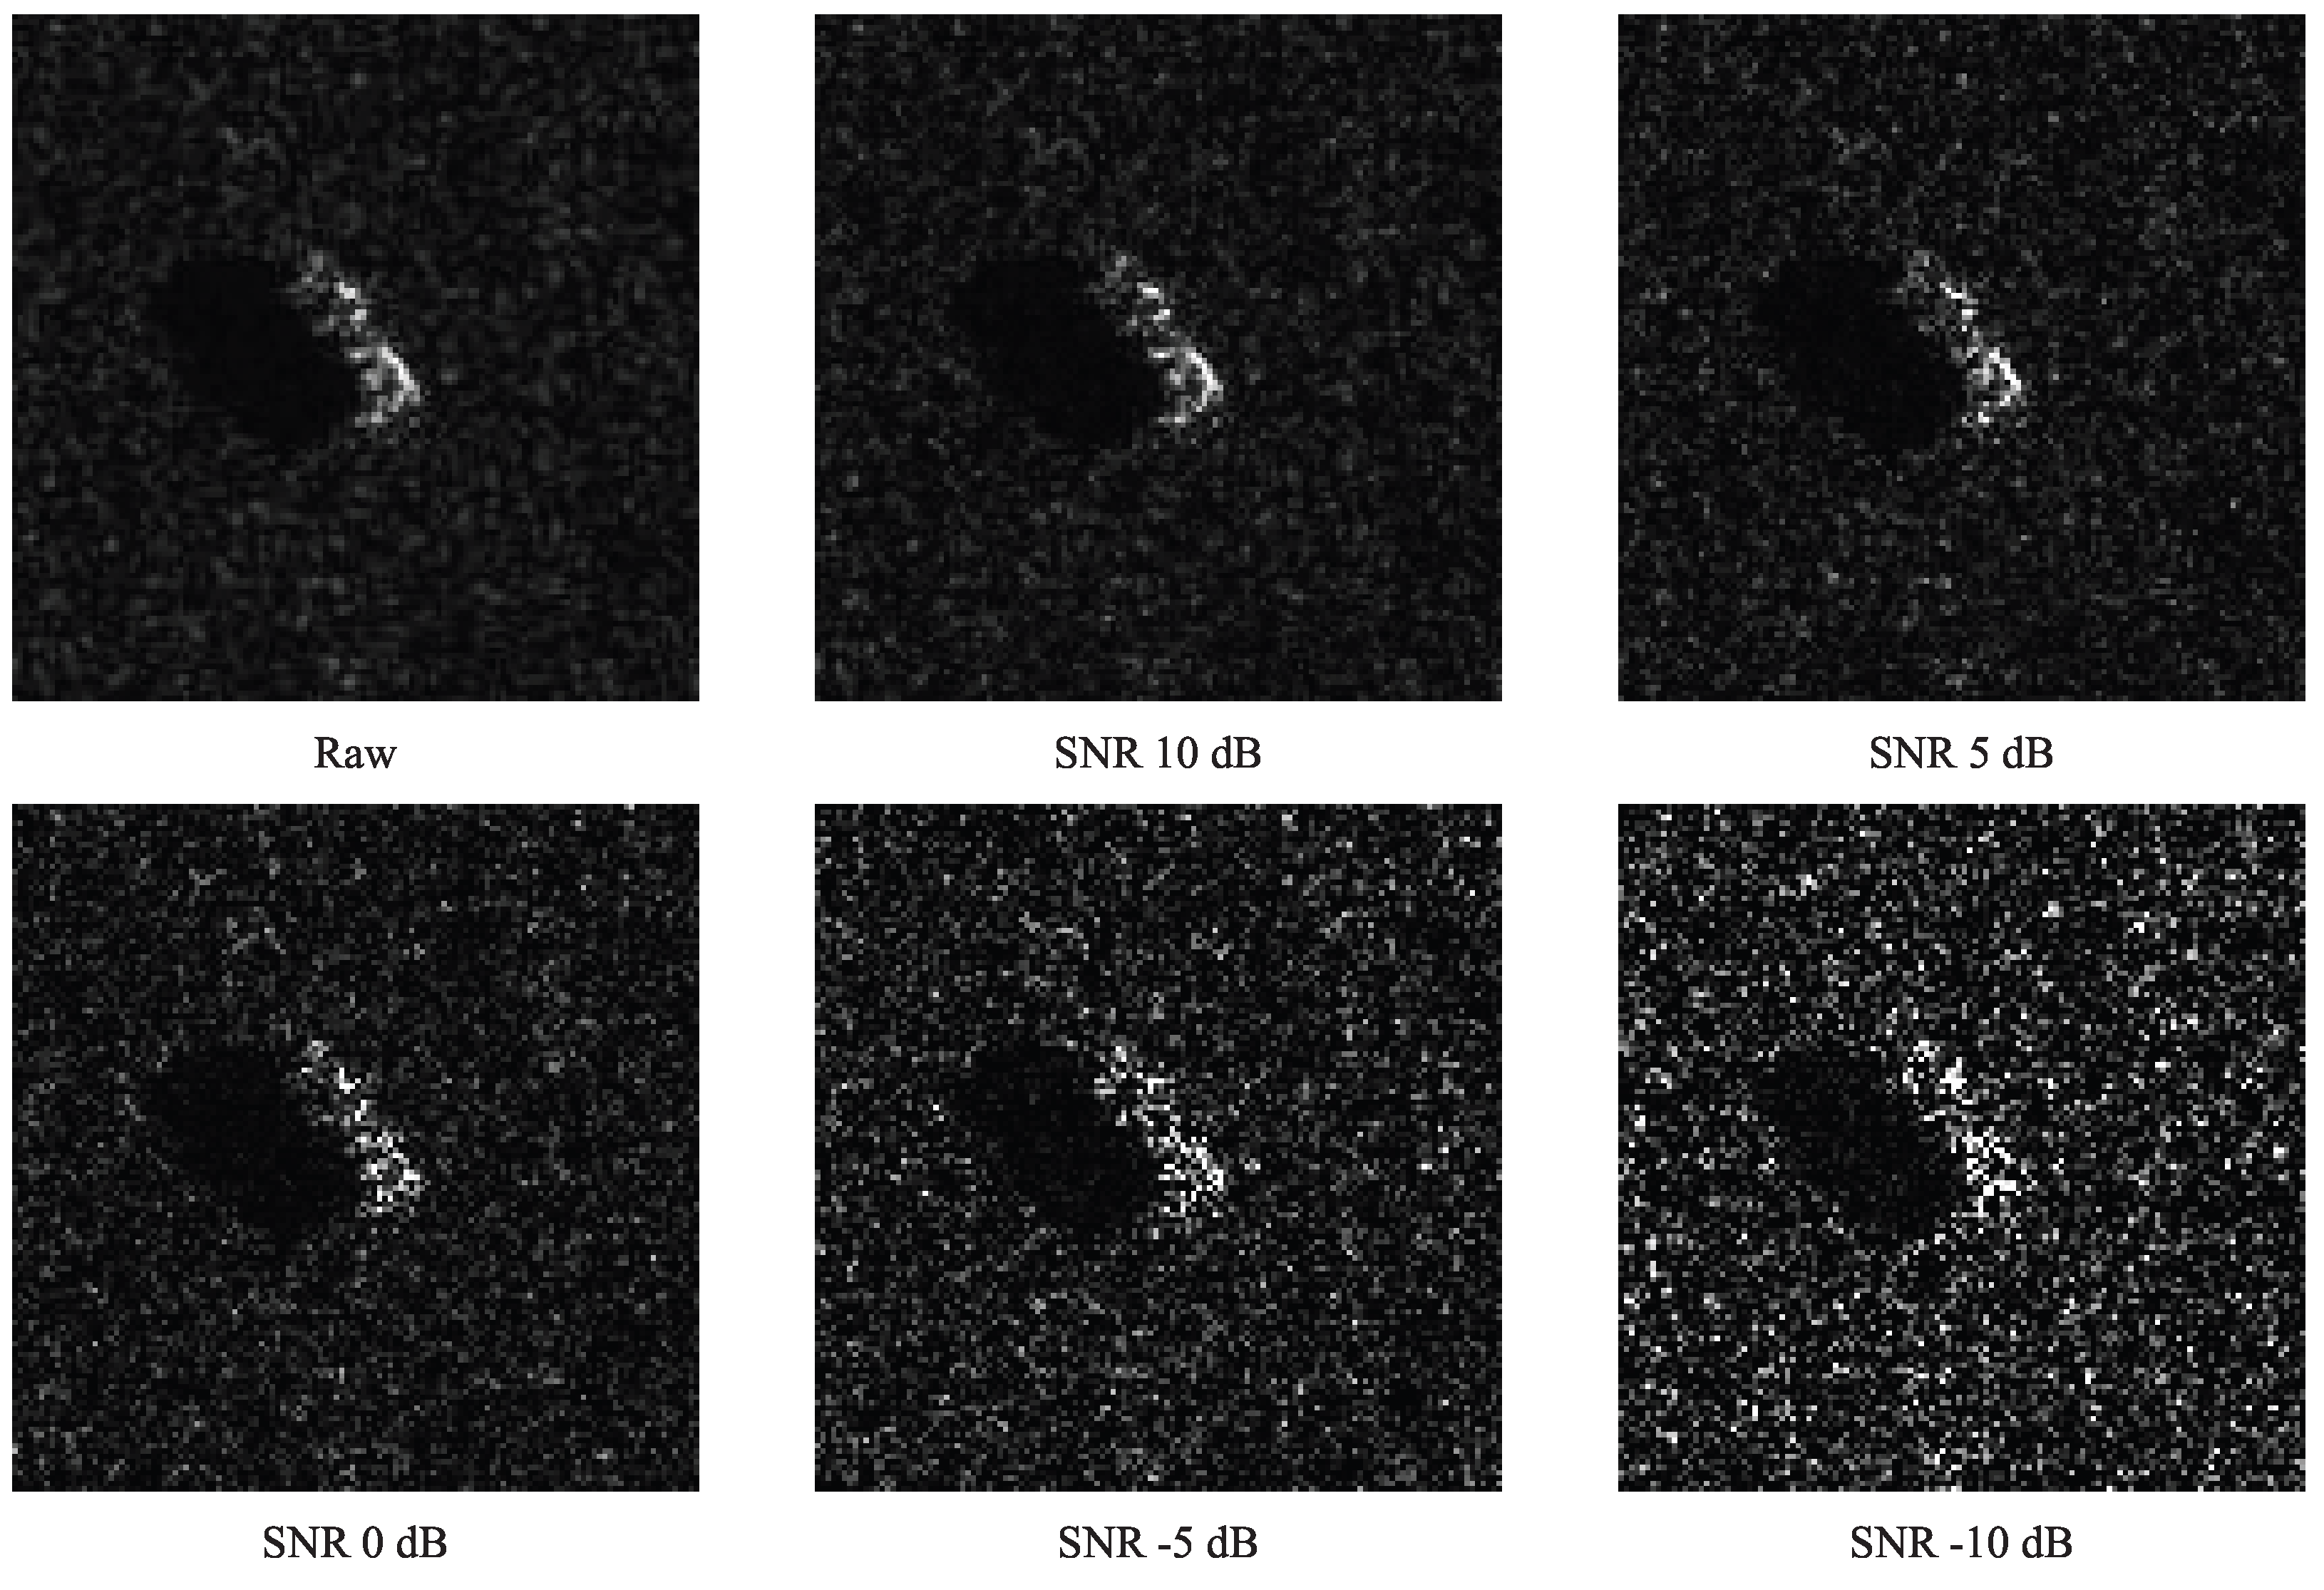
SAR image acquisition is inherently susceptible to noise interference from both environmental factors and radar system characteristics. Consequently, robust SAR target classification models must demonstrate resilience against noise corruption. In this experiment, we evaluate the noise robustness of the proposed method by contaminating the test samples from all ten target categories under SOC conditions with varying levels of additive Gaussian noise. Following the noise model described in [43], we assume the original SAR images to be noise-free and calculate the noise intensity relative to the signal energy of the pristine images. Figure 10 illustrates representative MSTAR images corrupted with different levels of Gaussian noise.
To assess the performance degradation under noise corruption, we evaluate all models using the noise-contaminated test samples and plot the classification accuracy curves as a function of signal-to-noise ratio (SNR), as shown in Figure 11. The proposed MDFA-AconvNet exhibits graceful performance degradation as the SNR decreases, maintaining classification accuracy above 90% when the SNR exceeds 0 dB. Notably, MDFA-AconvNet achieves the highest average classification accuracy across all SNR levels compared to baseline methods, demonstrating superior noise robustness. This enhanced resilience can be attributed to the multi-scale feature extraction and attention mechanisms, which effectively distinguish target features from noise-induced artifacts.

4.5. Occlusion Robustness Evaluation

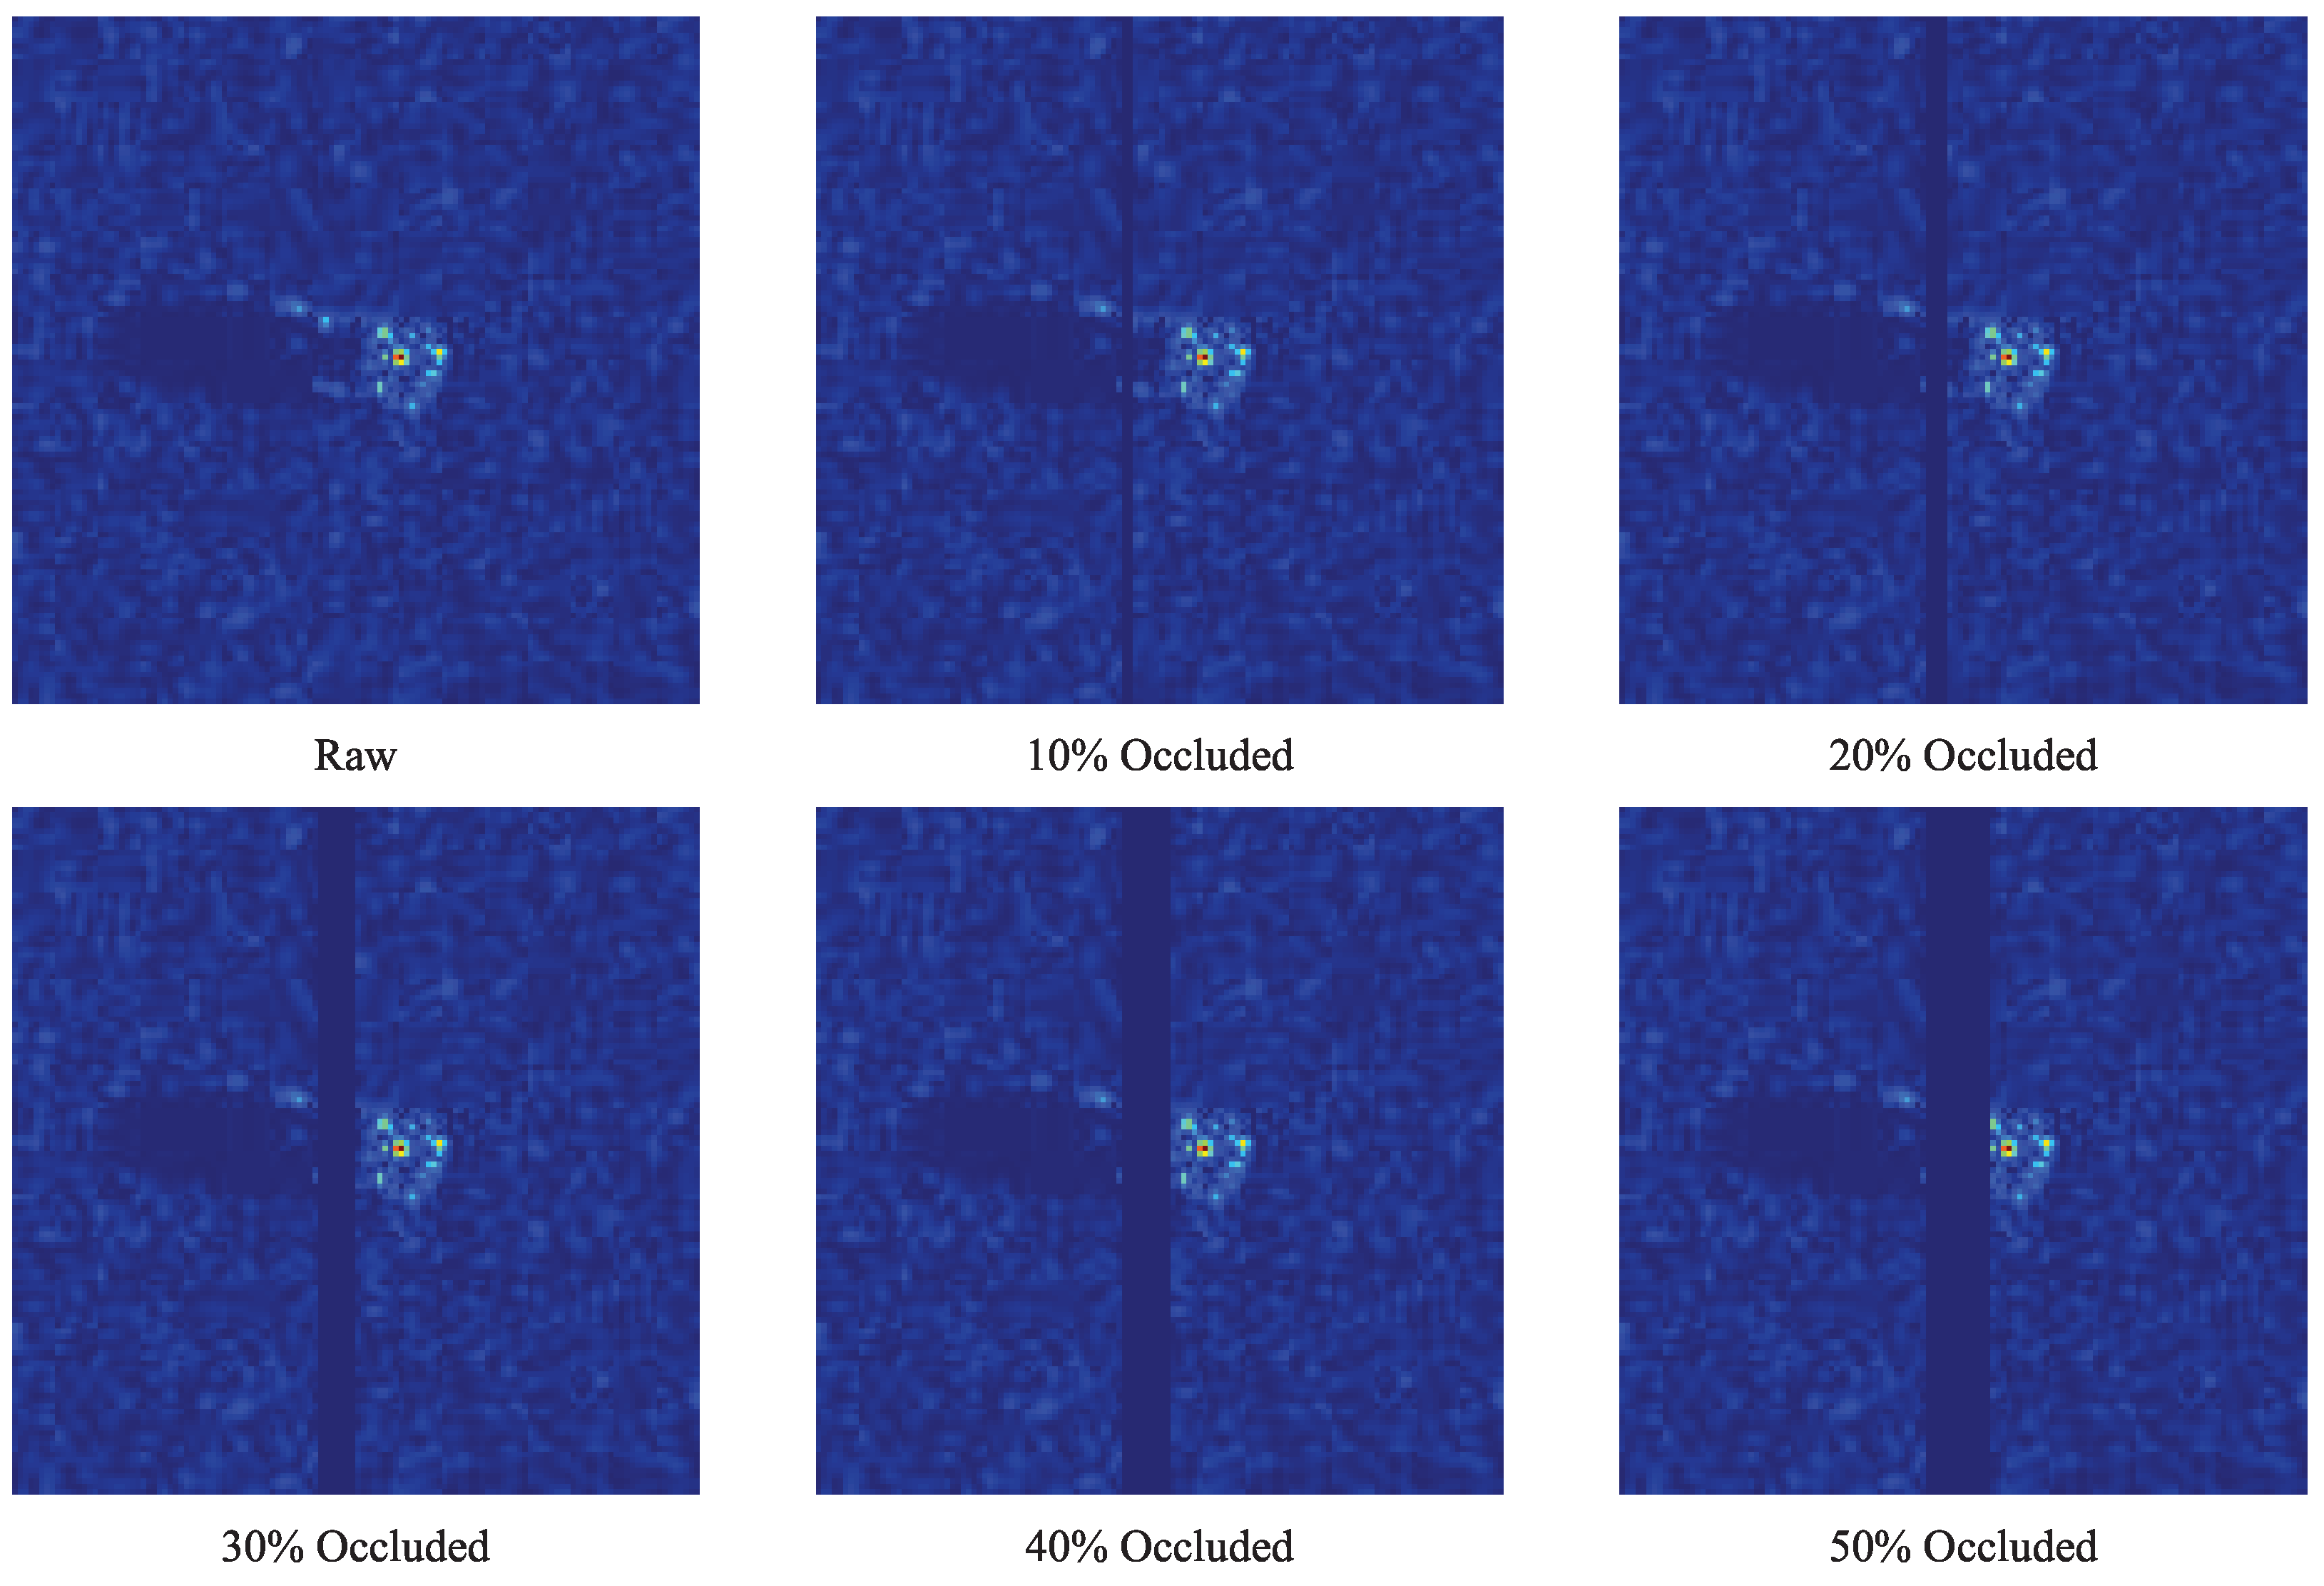
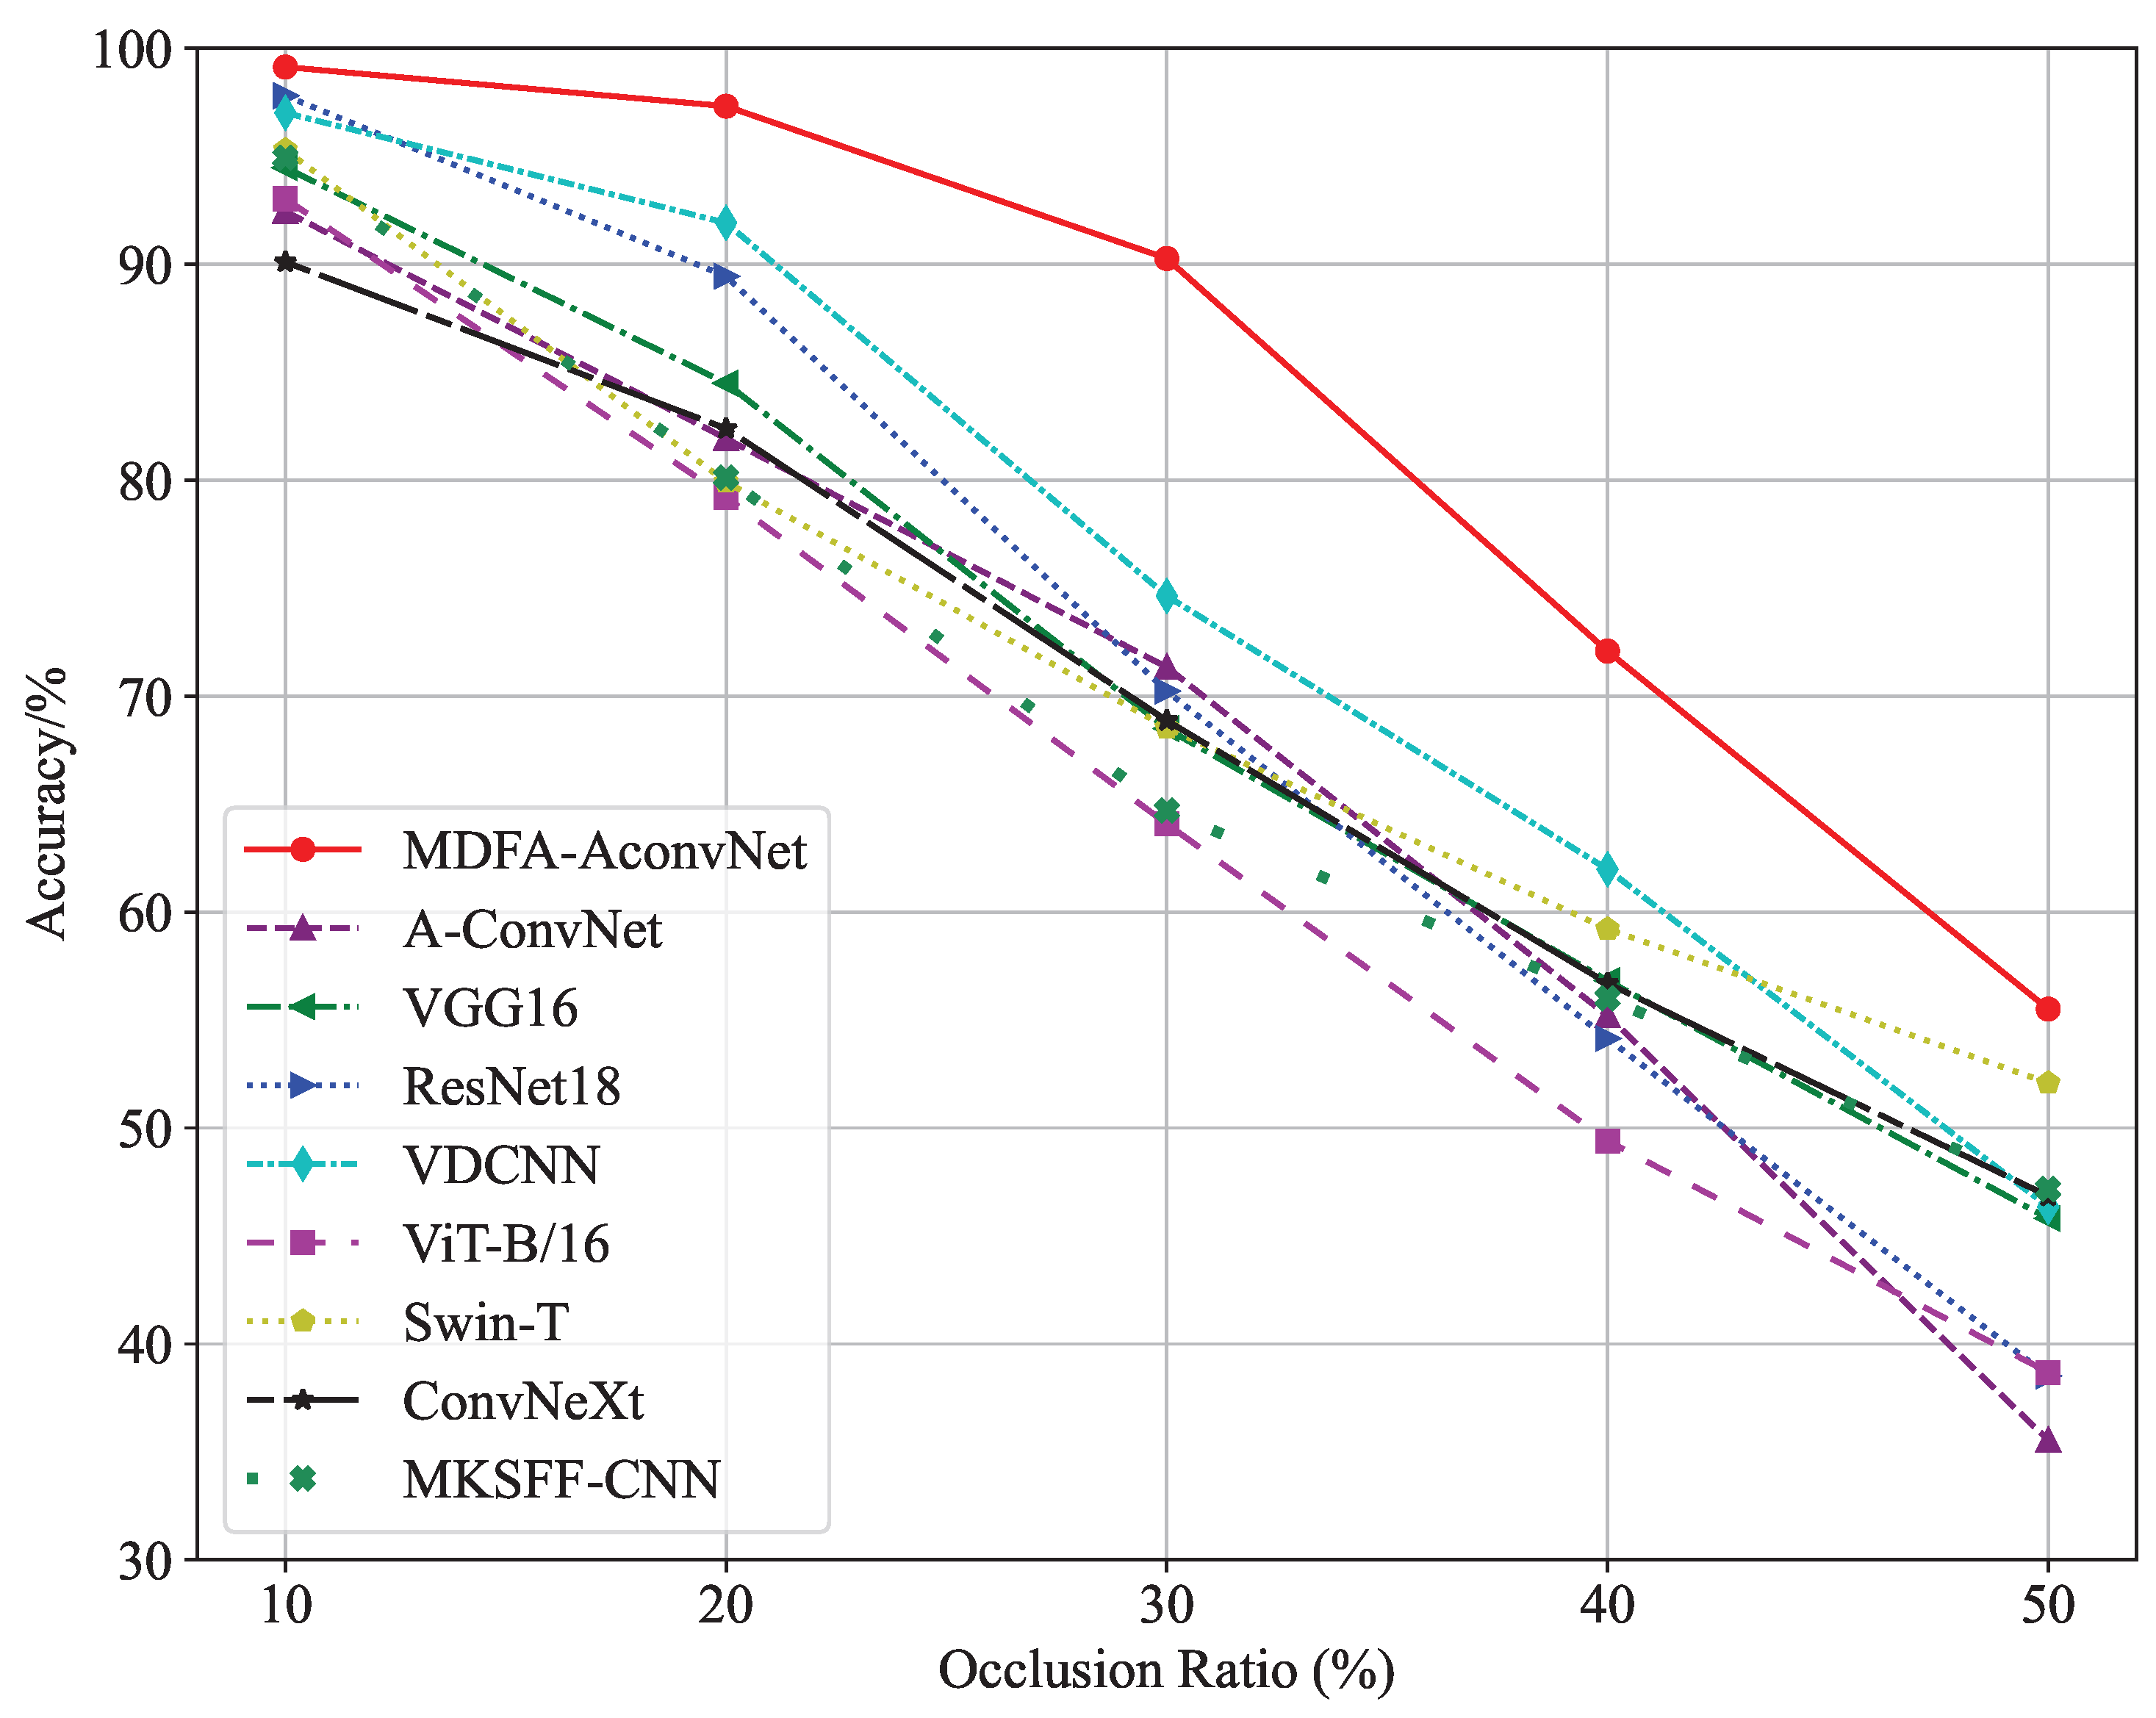
In real-world scenarios, ground vehicle targets may be partially occluded by obstacles such as trees and buildings. This occlusion effect causes the acquired SAR images to capture only partial scattering characteristics of the target, thereby increasing the difficulty of accurate classification. To evaluate the robustness of the proposed model under occlusion conditions, we simulate test images with varying occlusion ratios following the SAR target occlusion model described in [44]. For each test image, we first employ the threshold segmentation method from [45] combined with morphological closing operations to isolate the target region from the background. Subsequently, following the protocol in [44], occlusion is randomly applied from one of eight directions (left, top, right, bottom, and four diagonal directions). For a given occlusion ratio ranging from 10% to 50%, a portion of the target bounding box is erased by setting the corresponding pixel values to zero, simulating the effect of complete obstruction by foreground objects. Figure 12 illustrates examples of original images and their occluded counterparts at various ratios (10–50%) randomly selected from the validation set.
The occlusion simulation experiments are conducted on the SOC test dataset. For each occlusion ratio (10%, 20%, 30%, 40%, 50%), we generate occluded test sets with randomly selected occlusion directions. The performance of each model is evaluated using the percentage of correct classification (PCC) metric. Figure 13 presents the classification accuracy curves under different occlusion ratios. The results demonstrate that the proposed MDFA-AconvNet consistently achieves the highest average recognition accuracy across all occlusion levels, validating its effectiveness against partial target occlusion. Notably, the model maintains robust performance (exceeding 90% accuracy) under mild occlusion conditions (≤30%), which can be attributed to the multi-scale attention mechanism in the MDFA module that emphasizes discriminative features resilient to partial information loss. However, the performance degrades more substantially when the occlusion ratio exceeds 30%, indicating increased sensitivity to severe occlusion. This observation suggests that while the proposed approach demonstrates superior robustness compared to baseline methods, extreme occlusion scenarios remain challenging for current SAR target recognition systems.

4.6. Statistical Analysis

To rigorously evaluate the statistical significance of performance improvements achieved by the proposed MDFA-AconvNet over the baseline A-ConvNet, we conducted comprehensive paired t-tests across all target categories. Both models were trained and tested independently 10 times using different random seeds to account for variability in model initialization and training dynamics. This repeated evaluation strategy provides robust statistical evidence for the superiority of our proposed method. Table 9 presents the detailed statistical comparison results for each of the ten target classes in the MSTAR dataset. The accuracy values are reported as mean ± standard deviation across the 10 independent runs, providing insights into both the average performance and stability of each model. The t-statistic and corresponding p-values from paired t-tests quantify the statistical significance of performance differences.
The statistical analysis reveals compelling evidence for the superiority of MDFA-AconvNet. Most notably, all ten target categories demonstrate statistically significant improvements (p < 0.05), with the majority showing extremely strong significance (p < 0.001). This unanimous statistical significance across all categories is particularly remarkable, as it indicates that the proposed multiscale dilated fusion attention mechanism provides consistent and reliable performance enhancements regardless of target type.

4.7. Explainability Analysis Based on Grad-CAM and SHAP

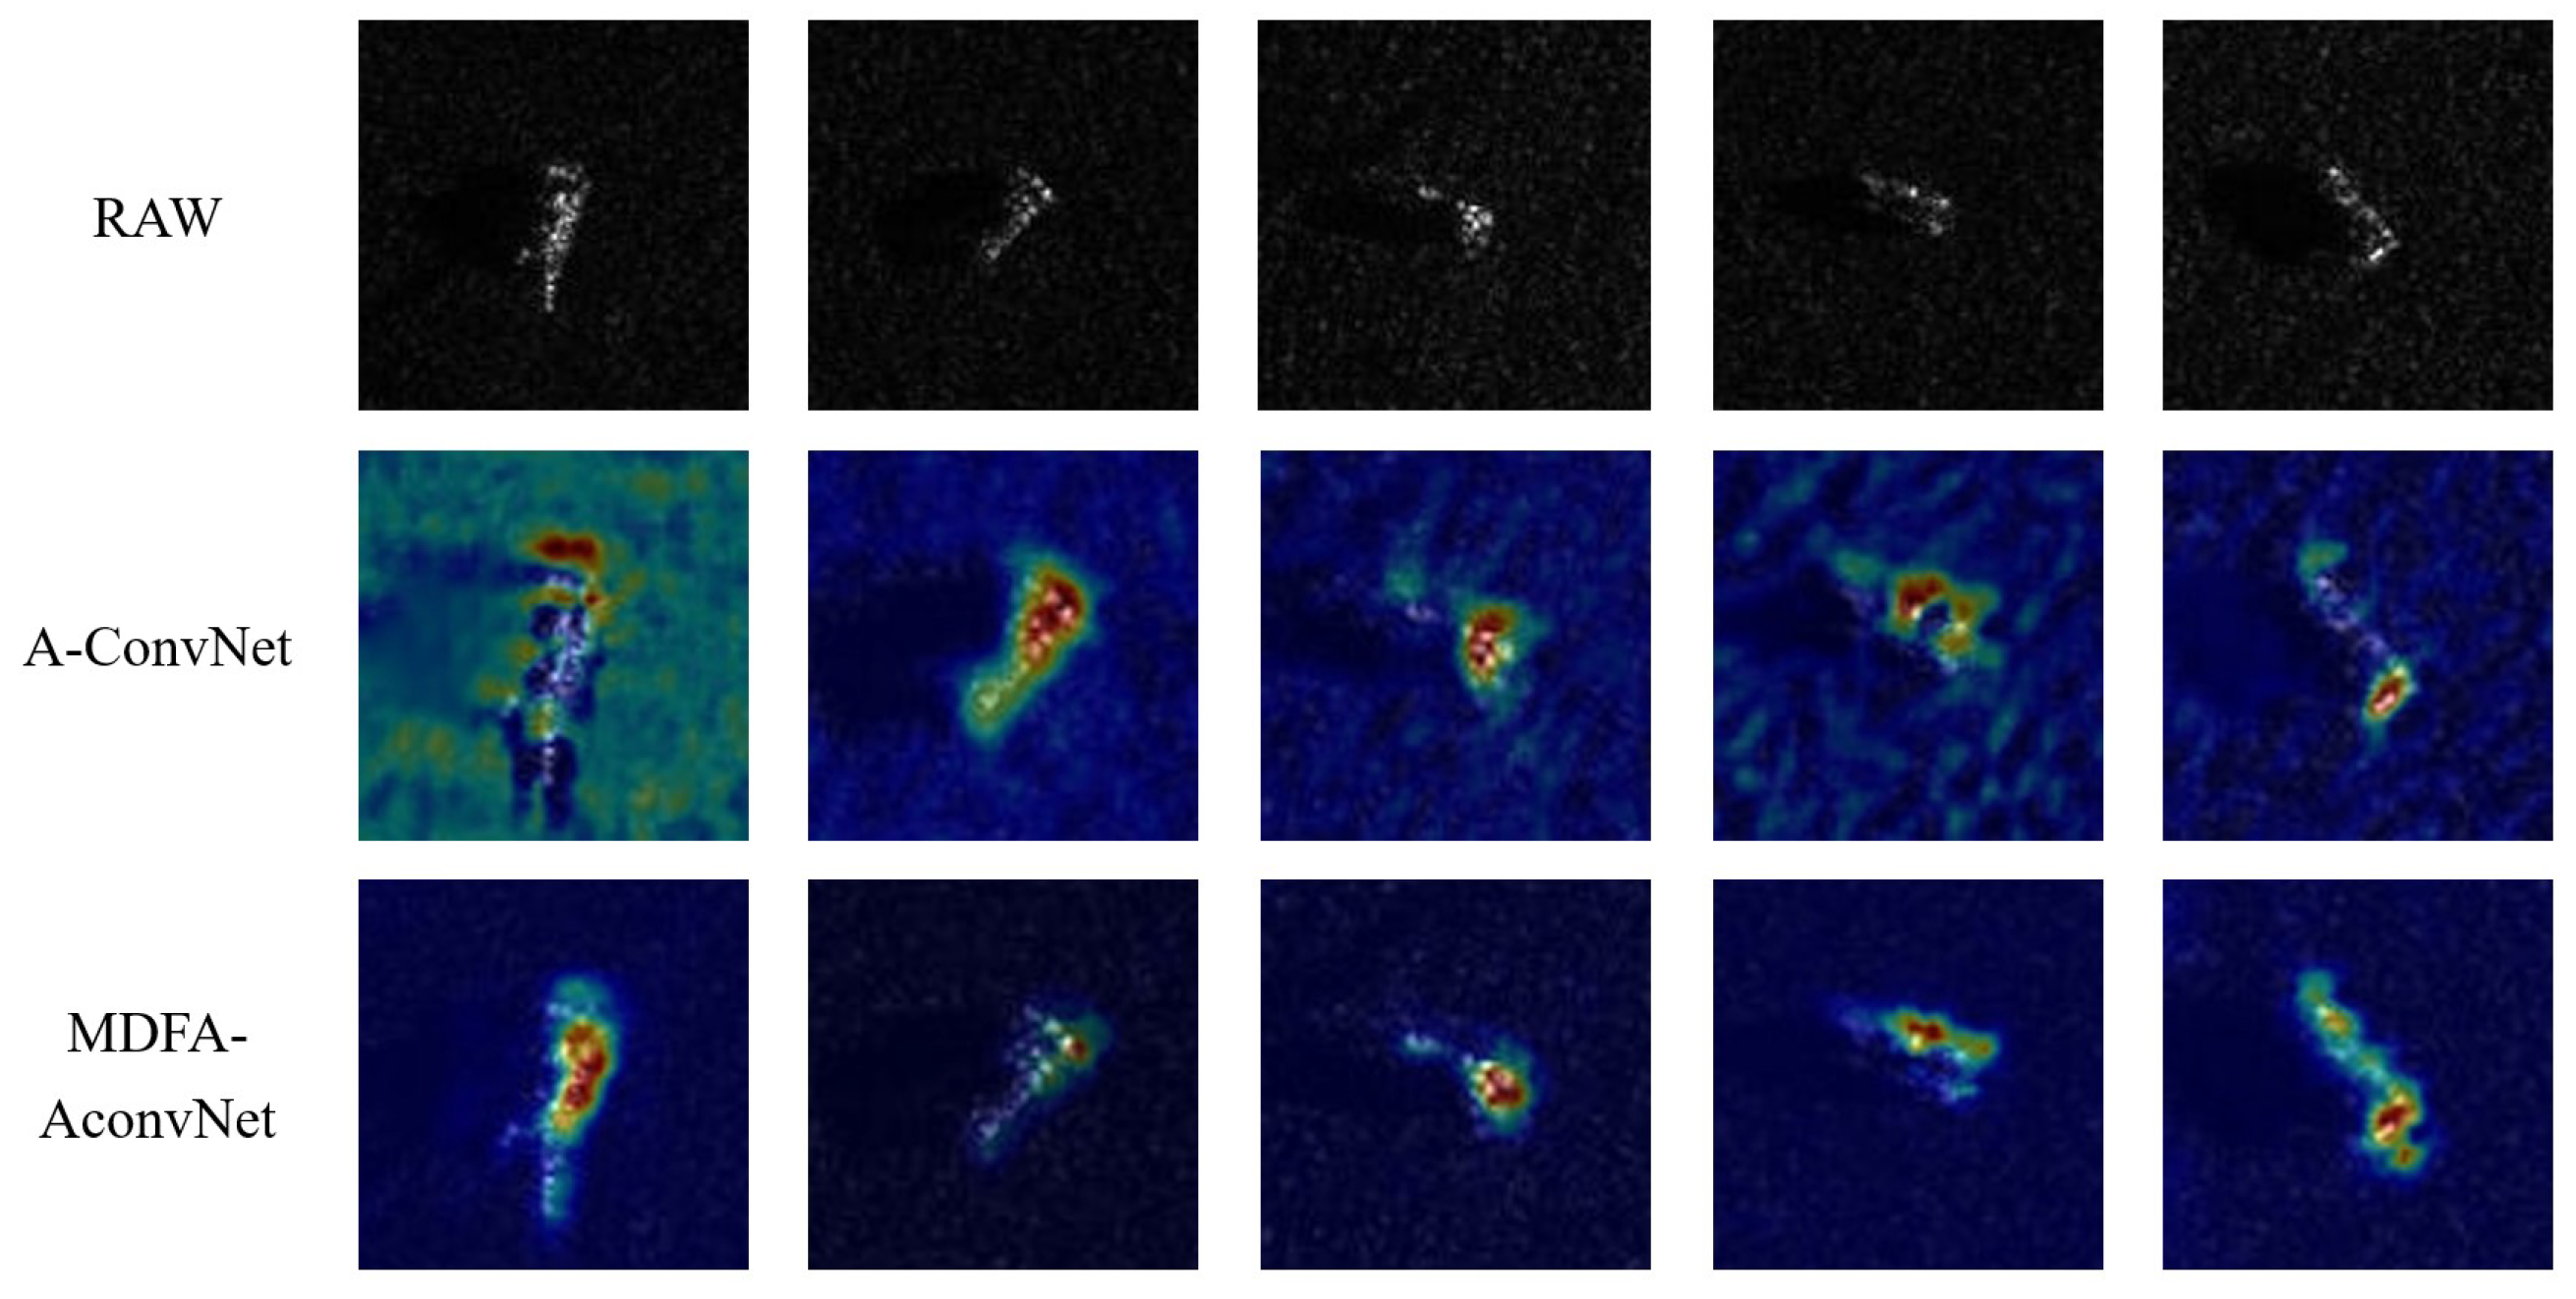
To evaluate whether the MDFA module enhances the model’s ability to extract discriminative features from SAR imagery, we conduct a visual analysis using Grad-CAM heatmaps generated from samples in the SOC dataset. Grad-CAM (Gradient-weighted Class Activation Mapping) is a widely used gradient-based method that highlights important spatial regions in convolutional layers with respect to specific class predictions [46]. As shown in Figure 14, brighter areas in the heatmap indicate regions that contribute most significantly to the classification outcome, while darker regions have minimal influence. Comparison results show that MDFA-AconvNet—benefiting from dilated convolutions and attention mechanisms—exhibits a stronger focus on target-specific features. This leads to better suppression of background clutter and greater emphasis on local structural characteristics, especially near the target’s scattering center. Such localization provides a physically interpretable rationale for the model’s improved accuracy and generalization performance.
We further examine model interpretability using SHAP (SHapley Additive exPlanations), a unified framework for interpreting machine learning predictions based on cooperative game theory. SHAP was introduced by Lundberg and Lee in 2017 [47] to quantify the contribution of each input feature to the model’s output using Shapley values. In this framework, each input feature is treated as a participant in a game, and the model’s prediction is interpreted as the total “payout.” The Shapley value quantifies the marginal contribution of each feature to this prediction. For image-based tasks, features are typically defined as pixel regions or superpixels. SHAP estimates each region’s importance by systematically masking or perturbing it and observing the effect on the model’s output. The resulting heatmaps highlight positive contributions in red (indicating key regions supporting the prediction) and negative contributions in blue (typically background or non-target regions).
The Shapley value for a feature i is defined as:
φ i = S N i S ! N S 1 ! N ! f S i f S
where N is the complete set of features, S is a subset excluding feature i, and f ( S ) is the model output when only features in S are used.
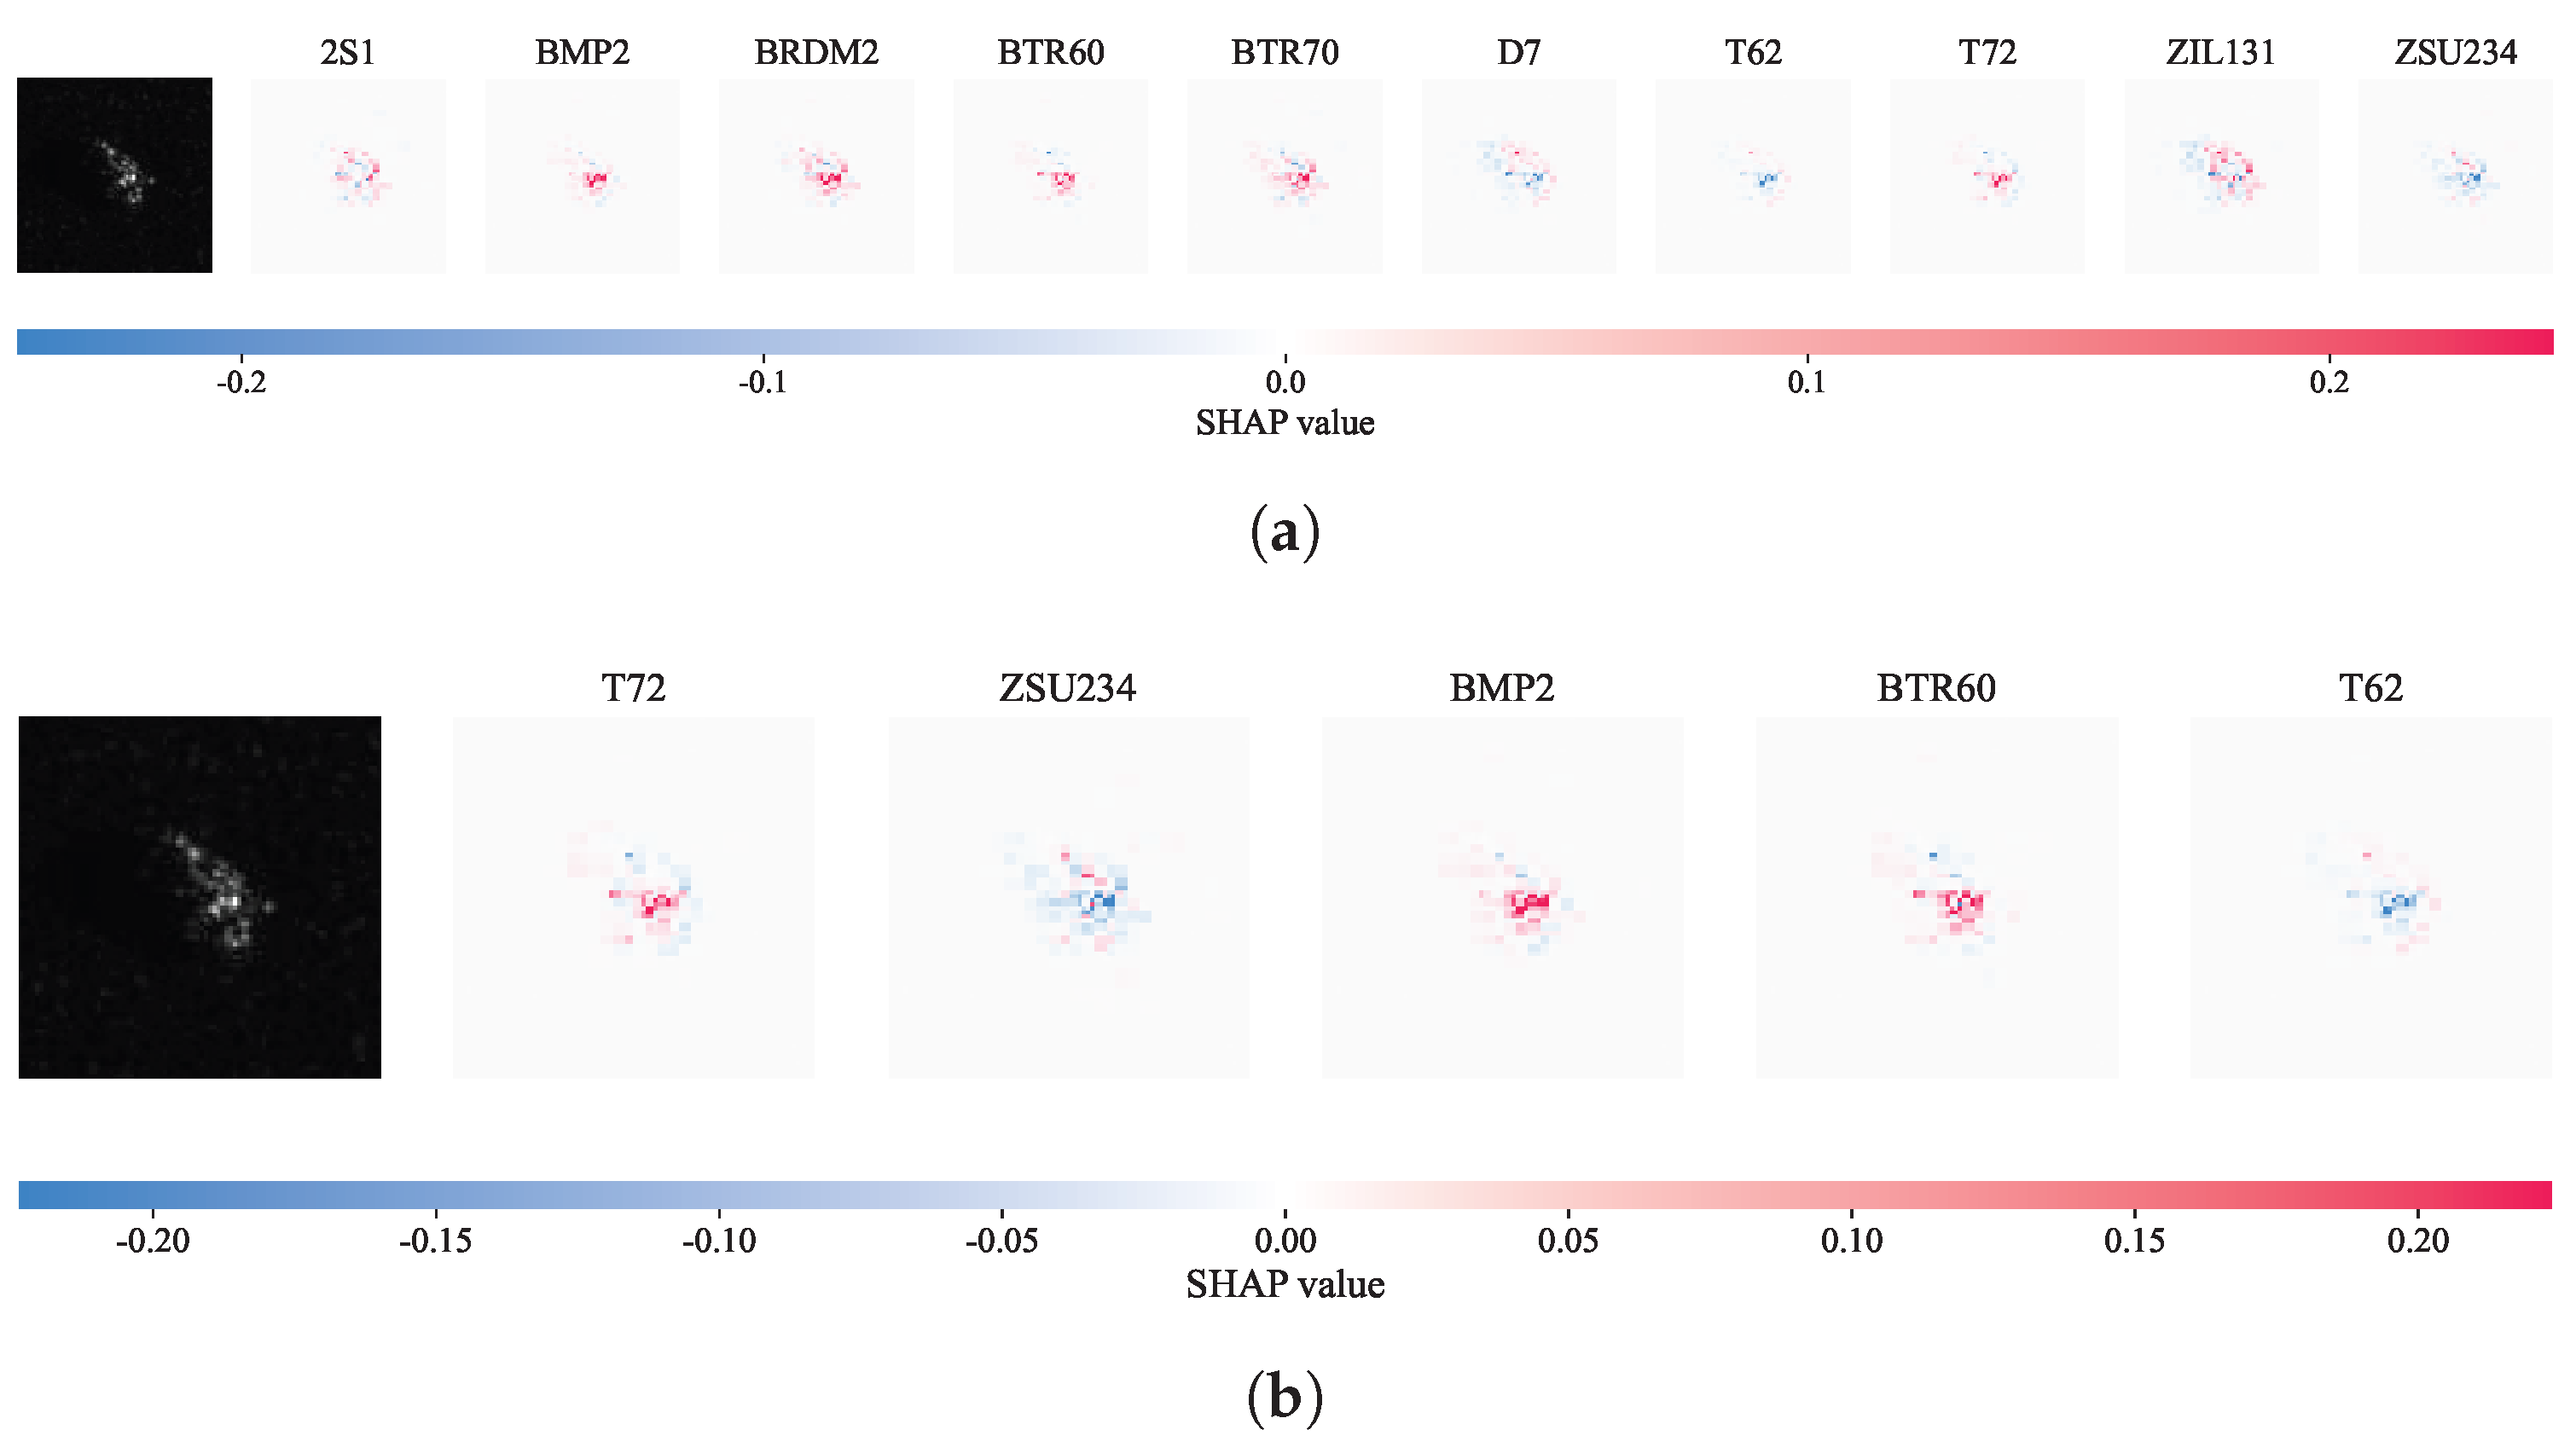
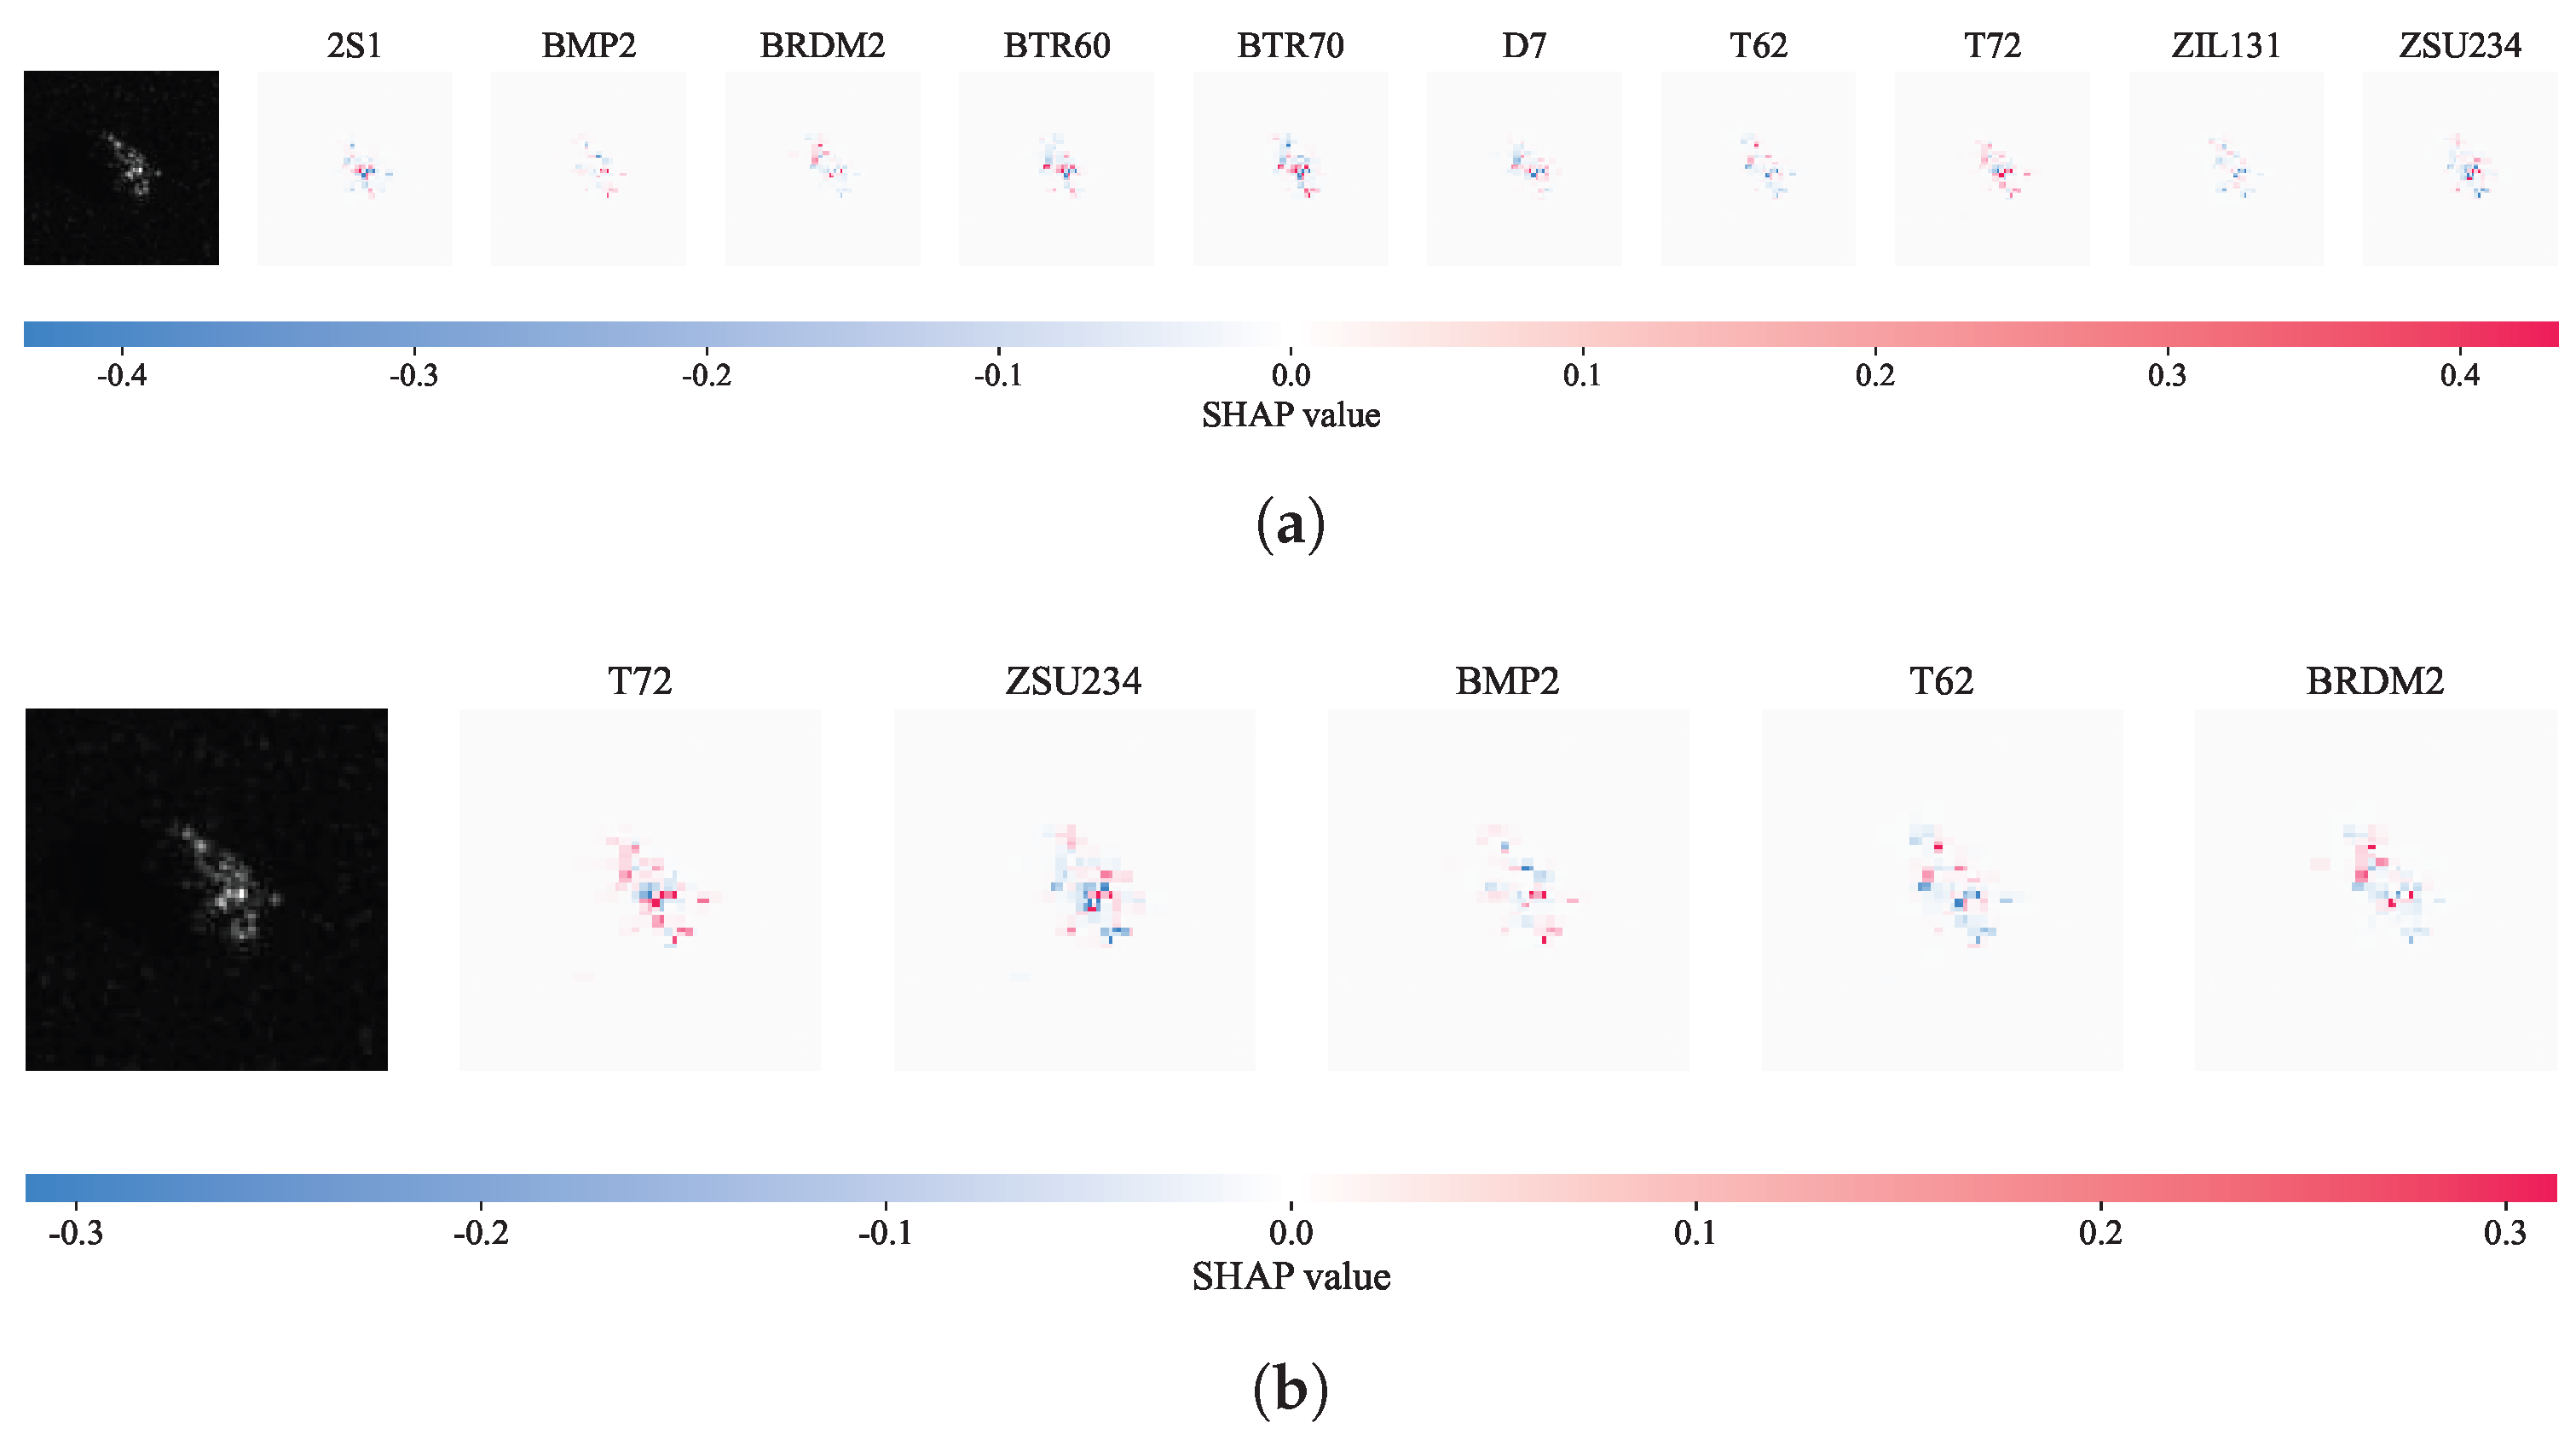
Figure 15 and Figure 16 present SHAP-based visual interpretations for A-ConvNet and MDFA-AconvNet, respectively, using a SAR image of the T-72 target randomly selected from the test set. Figure 15a and Figure 16a show the full-class Shapley heatmaps for all ten classes, while Figure 15b and Figure 16b display the heatmaps for the top-5 predicted categories. The visual comparisons reveal that MDFA-AconvNet produces more precise and consistent attributions. It accurately focuses on the target’s scattering center while simultaneously capturing global structural features. In contrast, although A-ConvNet can also localize the scattering region, it shows lower class discrimination and less attention to global context. These results further support the conclusion that the MDFA module enhances interpretability and strengthens the model’s capacity to identify salient SAR target characteristics.

4.8. Classification Accuracy Evaluation Under Small-Size Training Datasets

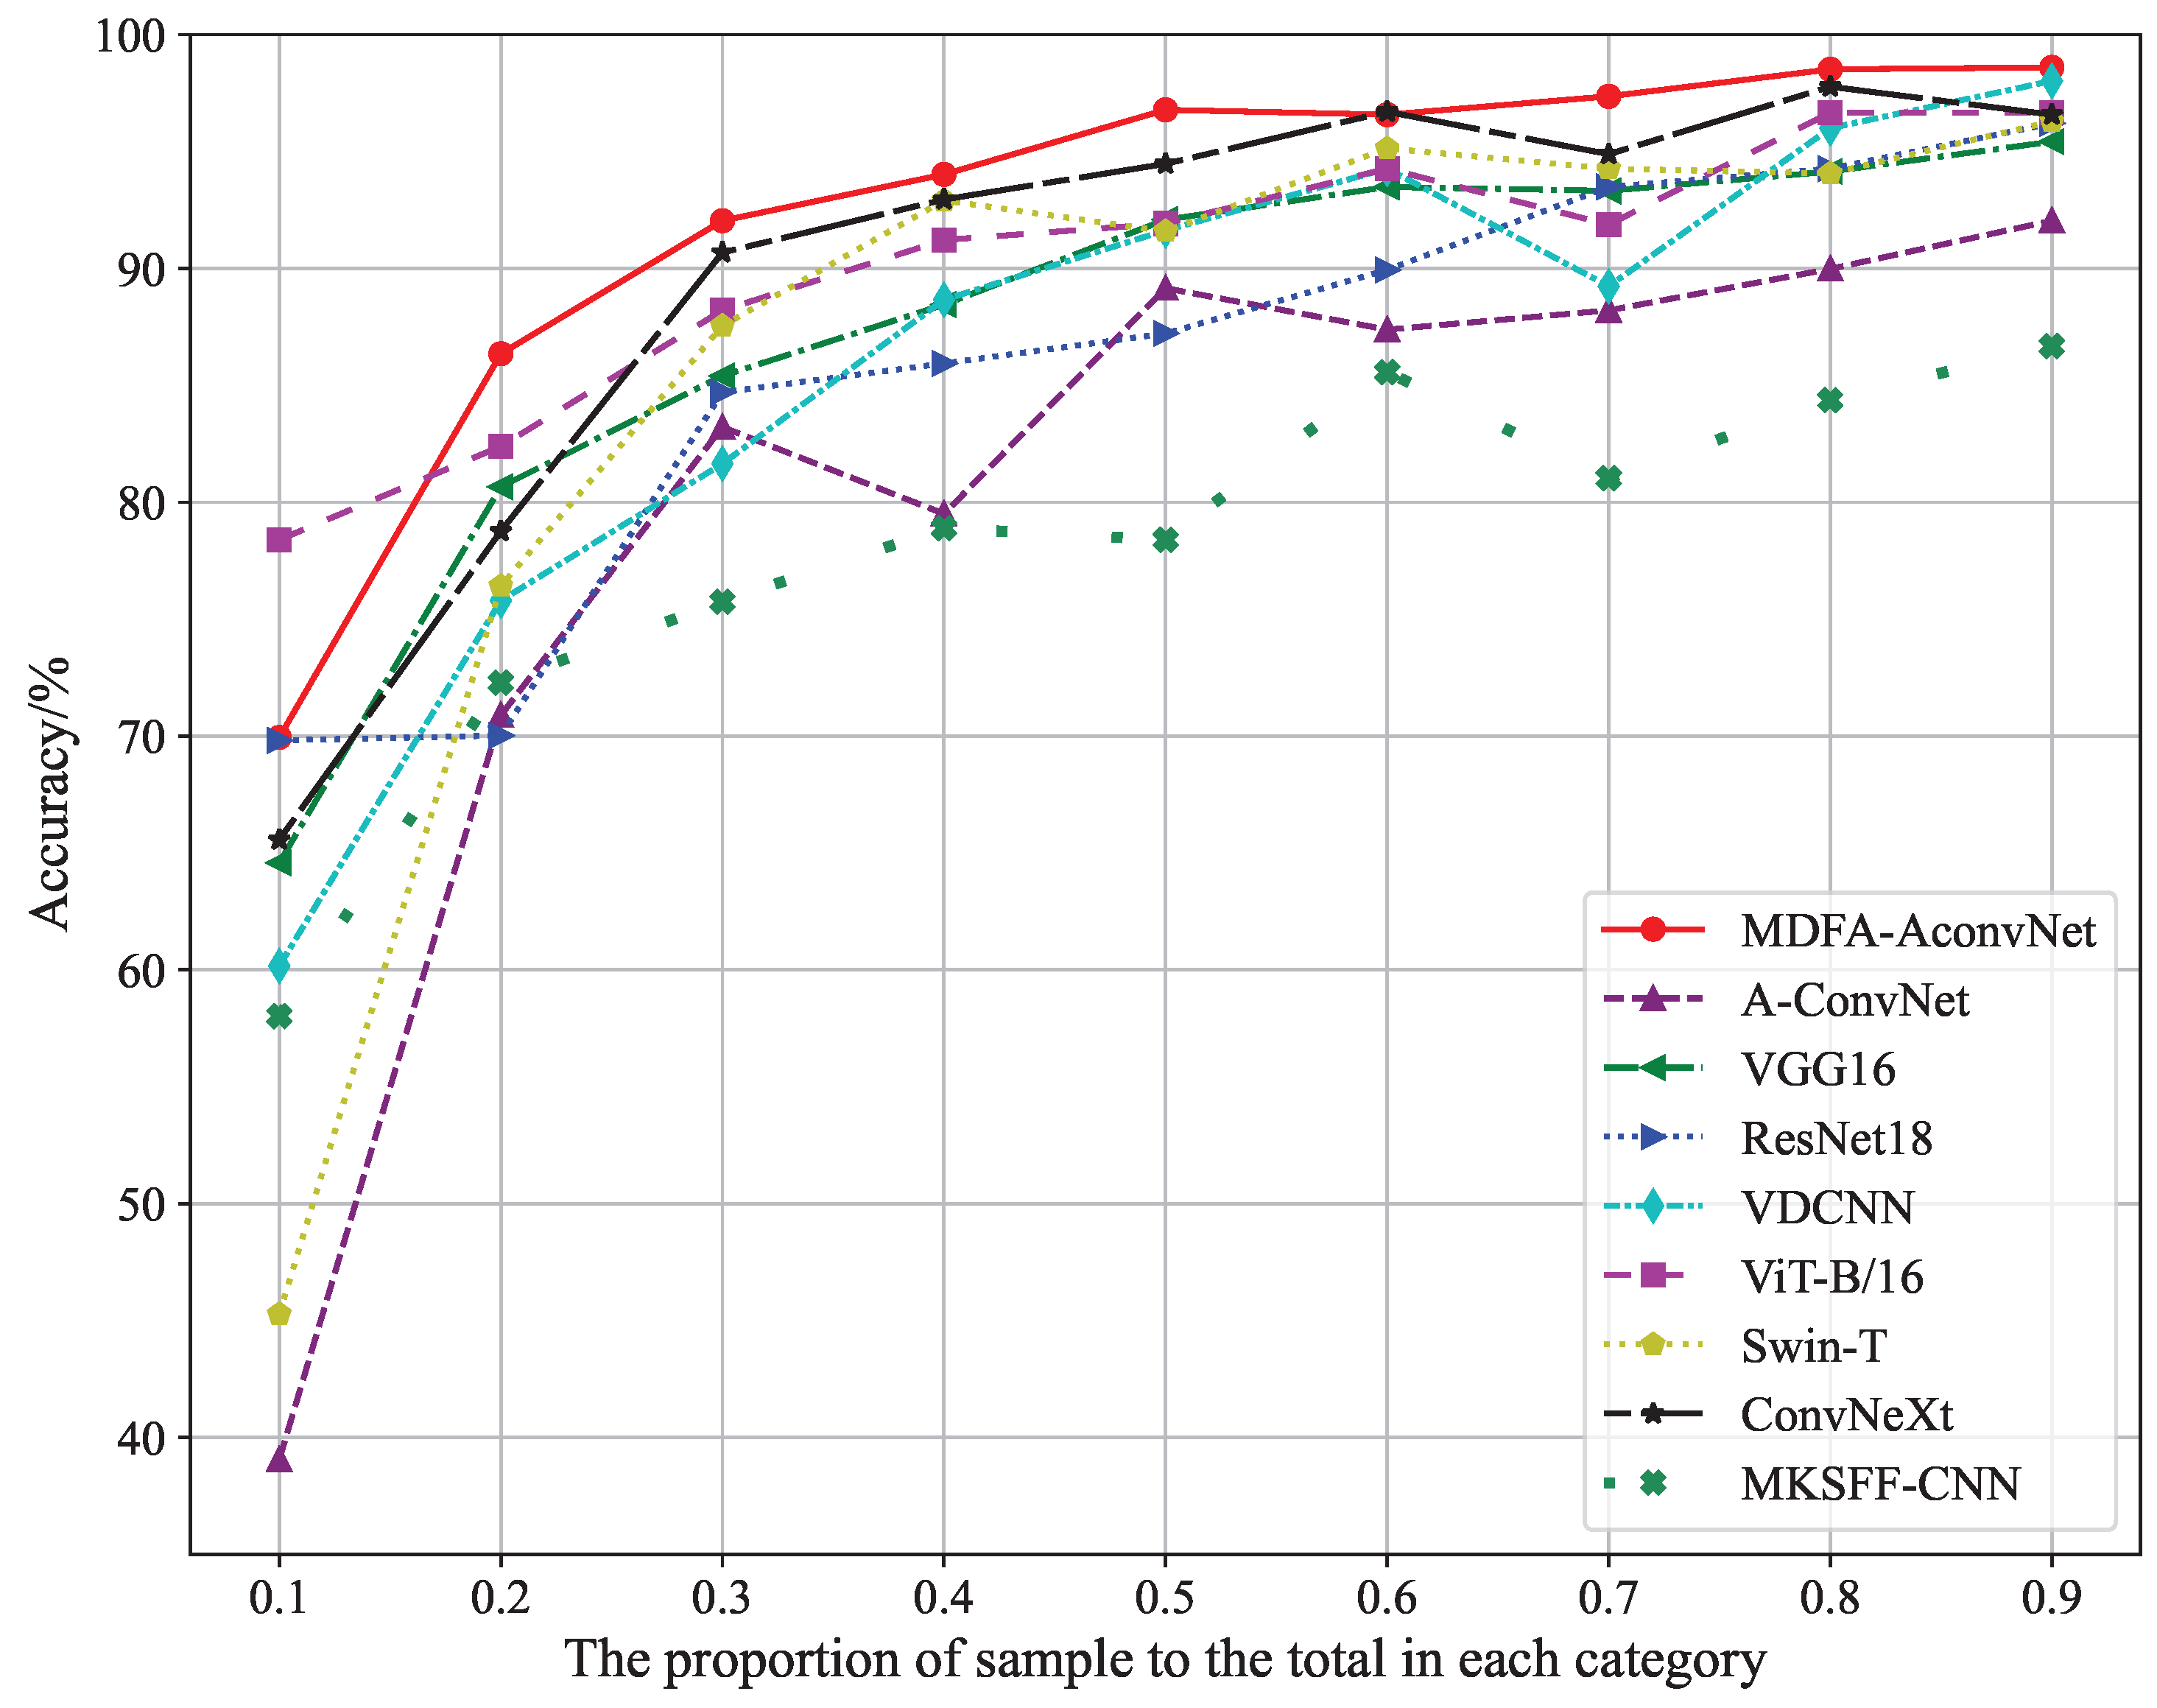
Evaluating performance under small-sample conditions is a common and effective approach for assessing the robustness of SAR target classification algorithms. To examine the adaptability of the proposed MDFA-AconvNet in such scenarios, we conducted a series of comparative experiments using a reduced version of the SOC dataset. Figure 17 illustrates the classification accuracies achieved by different algorithms across varying training set sizes.
The results demonstrate that MDFA-AconvNet consistently maintains high classification accuracy, even when trained on a severely limited number of samples. This robustness can be largely attributed to its compact and efficient network backbone, which enables effective learning with fewer parameters and reduces the risk of overfitting in low-data regimes. In addition, the integrated multiscale dilated attention mechanism significantly enhances the model’s ability to extract and emphasize discriminative target features, further contributing to its strong performance. Overall, MDFA-AconvNet exhibits excellent robustness and generalization capability under small-sample conditions, underscoring its practical value and broad applicability for real-world SAR image classification tasks.

4.9. Model Size and Computational Efficiency Evaluation

Computational efficiency is an important criterion for evaluating classification methods, particularly in resource-constrained or real-time applications. All experiments were conducted on a consistent hardware platform equipped with an Intel Core i7-12800HX processor (2.00 GHz), 32 GB of RAM, and an Nvidia GeForce RTX 3080 GPU with 16 GB of memory. Table 10 summarizes each model’s number of parameters, model size, and inference time per batch (64 SAR images).
Among all the models compared, MDFA-AconvNet exhibits one of the smallest model sizes and lowest parameter counts. This is primarily due to its streamlined architecture and shallow depth. In contrast, models such as VGG16, ResNet, ConvNeXt, MKSFF-CNN, and the transformer-based ViT employ deeper and more complex structures, resulting in significantly larger parameter counts. Swin-T, which uses a lightweight transformer variant, has fewer parameters than ViT but still remains more complex than MDFA-AconvNet. MKSFF-CNN performs multiscale feature fusion at each layer and forwards these into a fully connected layer, leading to a substantial increase in parameters. Compared to VDCNN, MDFA-AconvNet introduces attention mechanisms to suppress redundant information and relies on a fully convolutional backbone, substantially reducing parameter overhead. Regarding inference time, MDFA-AconvNet outperforms deeper architectures such as VGG16 and ResNet by achieving faster prediction with fewer layers. A-ConvNet, which also employs a fully convolutional design but lacks attention mechanisms, achieves slightly lower parameter counts and marginally faster inference than MDFA-AconvNet. Overall, MDFA-AconvNet offers a compelling trade-off between architectural simplicity, computational efficiency, and classification performance. It demonstrates that a lightweight and well-designed model can achieve high accuracy with significantly lower resource demands, making it well-suited for practical SAR image classification applications.

4.10. Ablation Experiment

To further assess the contributions of individual components within the MDFA-AconvNet architecture, we performed an ablation experiment using the SOC dataset. Specifically, we examined the impact of three key modules: multiscale dilated convolution, channel attention, and spatial attention. By enabling different combinations of these modules, we evaluated how each contributes to overall classification performance. The results are summarized in Table 11.
When none of the modules are included, the baseline model achieves a classification accuracy of 92.23%. Adding each module individually improves the accuracy to 95.75% (multiscale dilated convolution), 96.00% (channel attention), and 95.13% (spatial attention), with an average improvement of approximately 3.4 percentage points. When combining any two modules, the classification accuracy increases further to 97.62%, 97.28%, and 97.03%, corresponding to an average improvement of around 5.1 percentage points over the baseline. Finally, when all three modules are integrated, the model achieves its highest accuracy of 99.38%, demonstrating the complementary benefits of these architectural components. These results clearly validate the effectiveness of incorporating multiscale dilated convolution, channel attention, and spatial attention in improving the precision of SAR image target classification.
The synergy can be explained by their complementary roles in SAR target recognition: channel attention acts as a “what” detector, identifying discriminative spectral signatures that distinguish different vehicle types (e.g., unique radar cross-section patterns), while spatial attention serves as a “where” detector, localizing key structural features and scattering centers. In SAR imagery, this complementarity is particularly crucial because similar vehicles may have overlapping spatial layouts but different material compositions (requiring channel discrimination), while different configurations may share similar spectral signatures but distinct spatial arrangements (requiring spatial discrimination). The max-pooling fusion preserves the strongest activations from both pathways, ensuring that neither spectral nor spatial discriminability is compromised. This interpretation is further supported by our Grad-CAM visualizations (Figure 14), which show that MDFA-AconvNet achieves more precise localization of both scattering centers (spatial) and target-specific patterns (channel) compared to the baseline.

5. Conclusions

This study presents a novel network architecture—MDFA-AconvNet for Synthetic Aperture Radar (SAR) image target classification. The proposed model combines multiscale dilated convolution with a dual-attention mechanism (channel and spatial), enabling the extraction of rich multiscale contextual information while dynamically focusing on target-relevant features. This design effectively suppresses background clutter and mitigates information redundancy. In addition, the use of a fully convolutional architecture significantly reduces the number of trainable parameters and computational complexity, alleviating overfitting risks associated with limited training data. Furthermore, a parallel attention fusion strategy is introduced, which adaptively selects the maximum response between the two attention outputs, allowing the network to highlight the most salient features emphasized by either attention path.
Extensive experiments on the MSTAR dataset confirm the model’s effectiveness. MDFA-AconvNet achieves a classification accuracy of 99.38% under Standard Operating Conditions (SOCs) and 96.7%, 99.2%, and 97.07% under the EOC-1, EOC-2-CV, and EOC-2-VV scenarios, respectively. The model demonstrates superior generalization capabilities compared to conventional methods, particularly in extended conditions involving target configuration and version variants. In addition, interpretability analyses using Grad-CAM and SHAP further validate the model’s precision in extracting key scattering centers and global structural features of targets. Overall, the proposed MDFA-AconvNet model contributes to both performance and interpretability improvements in SAR target classification. These findings offer meaningful insights for advancing SAR-based Automatic Target Recognition (ATR) systems, with potential applications in remote sensing, defense, and surveillance domains.
Nevertheless, while our experiments demonstrate strong performance on X-band HH-polarized MSTAR data, it should be noted that the model’s generalization to other SAR modalities requires further investigation. Different frequency bands (e.g., C-band and L-band) exhibit distinct scattering characteristics due to varying wavelengths and penetration depths, which may affect feature extraction. Additionally, polarimetric SAR data contains richer multi-channel information that could benefit from architectural adaptations. The current model is optimized for single-channel amplitude SAR images, and extending it to complex-valued or multi-polarization data would require modifications to the input processing layers and potentially the attention mechanisms to handle multi-dimensional features effectively. Future work should explore domain adaptation techniques to enhance cross-modal generalization.

Author Contributions

Conceptualization, J.W. and J.L.; methodology, J.W. and J.L.; software, J.W. and Q.J.; validation, J.W., X.Y. and S.D.; formal analysis, J.W. and Q.J.; investigation, J.W.; resources, X.Y.; data curation, J.W. and S.D.; writing—original draft preparation, J.W.; writing—review and editing, P.Z. and X.B.; visualization, J.W. and P.Z.; supervision, P.Z.; project administration, J.W.; funding acquisition, J.L. All authors have read and agreed to the published version of the manuscript.

Funding

This research was funded by Science and Technology Foundation of State Key Laboratory (grant number 61422062306) and Military Pre-Research Project (grant number KYGYJKQT0025017).

Institutional Review Board Statement

Not applicable.

Informed Consent Statement

Not applicable.

Data Availability Statement

The dataset can be accessed publicly at https://pan.baidu.com/s/1f_ARiGIfHjk2LFtPYl2jbA?pwd=8q87#list/path=%2F, (accessed on 16 November 2025).

Conflicts of Interest

The authors declare no conflicts of interest.

References

  1. Moreira, A.; Prats-Iraola, P.; Younis, M.; Krieger, G.; Hajnsek, I.; Papathanassiou, K.P. A tutorial on synthetic aperture radar. IEEE Geosci. Remote Sens. Mag. 2013, 1, 6–43. [Google Scholar] [CrossRef]
  2. Chen, J.; Xing, M.; Yu, H.; Liang, B.; Peng, J.; Sun, G.C. Motion compensation/autofocus in airborne synthetic aperture radar: A review. IEEE Geosci. Remote Sens. Mag. 2021, 10, 185–206. [Google Scholar] [CrossRef]
  3. Patel, V.M.; Easley, G.R.; Healy, D.M.; Chellappa, R. Compressed synthetic aperture radar. IEEE J. Sel. Top. Signal Process. 2010, 4, 244–254. [Google Scholar] [CrossRef]
  4. Tao, Q.C. Simulation for SAR Feature Image of Planar Structures. Adv. Mater. Res. 2014, 1042, 145–149. [Google Scholar] [CrossRef]
  5. Dudgeon, D.E.; Lacoss, R.T. An Overview ofAutomatic Target Recognition. Linc. Lab. J. 1993, 6, 3–10. [Google Scholar]
  6. Novak, L.M.; Owirka, G.J.; Brower, W.S.; Weaver, A.L. The automatic target-recognition system in SAIP. Linc. Lab. J. 1997, 10, 187–202. [Google Scholar]
  7. Ikeuchi, K.; Wheeler, M.D.; Yamazaki, T.; Shakunaga, T. Model-based SAR ATR system. In Proceedings of the Algorithms for Synthetic Aperture Radar Imagery III; SPIE: Bellingham, WA, USA, 1996; Volume 2757, pp. 376–387. [Google Scholar]
  8. Wang, J.; Zheng, T.; Lei, P.; Bai, X. Ground target classification in noisy SAR images using convolutional neural networks. IEEE J. Sel. Top. Appl. Earth Obs. Remote Sens. 2018, 11, 4180–4192. [Google Scholar] [CrossRef]
  9. Chen, S.; Wang, H.; Xu, F.; Jin, Y.Q. Target classification using the deep convolutional networks for SAR images. IEEE Trans. Geosci. Remote Sens. 2016, 54, 4806–4817. [Google Scholar] [CrossRef]
  10. Ding, J.; Chen, B.; Liu, H.; Huang, M. Convolutional neural network with data augmentation for SAR target recognition. IEEE Geosci. Remote Sens. Lett. 2016, 13, 364–368. [Google Scholar] [CrossRef]
  11. Deng, S.; Du, L.; Li, C.; Ding, J.; Liu, H. SAR automatic target recognition based on Euclidean distance restricted autoencoder. IEEE J. Sel. Top. Appl. Earth Obs. Remote Sens. 2017, 10, 3323–3333. [Google Scholar] [CrossRef]
  12. Xu, F.; Wang, H.; Jin, Y. Deep Learning as Applied in SAR Target Recognition and Terrain Classification. J. Radars 2017, 6, 13. [Google Scholar]
  13. Zhou, F.; Wang, L.; Bai, X.; Hui, Y. SAR ATR of ground vehicles based on LM-BN-CNN. IEEE Trans. Geosci. Remote Sens. 2018, 56, 7282–7293. [Google Scholar] [CrossRef]
  14. Wang, L.; Bai, X.; Zhou, F. SAR ATR of ground vehicles based on ESENet. Remote Sens. 2019, 11, 1316. [Google Scholar] [CrossRef]
  15. Zhang, M.; An, J.; Yang, L.D.; Wu, L.; Lu, X.Q. Convolutional neural network with attention mechanism for SAR automatic target recognition. IEEE Geosci. Remote Sens. Lett. 2020, 19, 4004205. [Google Scholar]
  16. Zhang, Y.; Guo, X.; Ren, H.; Li, L. Multi-view classification with semi-supervised learning for SAR target recognition. Signal Process. 2021, 183, 108030. [Google Scholar] [CrossRef]
  17. Wang, D.; Song, Y.; Huang, J.; An, D.; Chen, L. SAR target classification based on multiscale attention super-class network. IEEE J. Sel. Top. Appl. Earth Obs. Remote Sens. 2022, 15, 9004–9019. [Google Scholar] [CrossRef]
  18. Gao, Y.; Wu, Z.; Ren, M.; Wu, C. Improved YOLOv4 based on attention mechanism for ship detection in SAR images. IEEE Access 2022, 10, 23785–23797. [Google Scholar] [CrossRef]
  19. Hubel, D.H.; Wiesel, T.N. Receptive fields, binocular interaction and functional architecture in the cat’s visual cortex. J. Physiol. 1962, 160, 106. [Google Scholar] [CrossRef] [PubMed]
  20. Simonyan, K.; Zisserman, A. Very deep convolutional networks for large-scale image recognition. arXiv 2014, arXiv:1409.1556. [Google Scholar]
  21. He, K.; Zhang, X.; Ren, S.; Sun, J. Deep residual learning for image recognition. In Proceedings of the IEEE Conference on Computer Vision and Pattern Recognition, Las Vegas, NV, USA, 27–30 June 2016; pp. 770–778. [Google Scholar]
  22. Szegedy, C.; Liu, W.; Jia, Y.; Sermanet, P.; Reed, S.; Anguelov, D.; Erhan, D.; Vanhoucke, V.; Rabinovich, A. Going deeper with convolutions. In Proceedings of the IEEE Conference on Computer Vision and Pattern Recognition, Boston, MA, USA, 7–12 June 2015; pp. 1–9. [Google Scholar]
  23. Lazebnik, S.; Schmid, C.; Ponce, J. Beyond bags of features: Spatial pyramid matching for recognizing natural scene categories. In Proceedings of the 2006 IEEE Computer Society Conference on Computer Vision and Pattern Recognition (CVPR’06), New York, NY, USA, 17–22 June 2006; IEEE: New York, NY, USA, 2006; Volume 2, pp. 2169–2178. [Google Scholar]
  24. He, K.; Zhang, X.; Ren, S.; Sun, J. Spatial pyramid pooling in deep convolutional networks for visual recognition. IEEE Trans. Pattern Anal. Mach. Intell. 2015, 37, 1904–1916. [Google Scholar] [CrossRef]
  25. Guan, S.; Hsu, K.T.; Eyassu, M.; Chitnis, P.V. Dense dilated UNet: Deep learning for 3D photoacoustic tomography image reconstruction. arXiv 2021, arXiv:2104.03130. [Google Scholar] [CrossRef]
  26. Dosovitskiy, A.; Beyer, L.; Kolesnikov, A.; Weissenborn, D.; Zhai, X.; Unterthiner, T.; Dehghani, M.; Minderer, M.; Heigold, G.; Gelly, S.; et al. An image is worth 16×16 words: Transformers for image recognition at scale. arXiv 2020, arXiv:2010.11929. [Google Scholar]
  27. Hu, J.; Shen, L.; Sun, G. Squeeze-and-excitation networks. In Proceedings of the IEEE Conference on Computer Vision and Pattern Recognition, Salt Lake City, UT, USA, 18–23 June 2018; pp. 7132–7141. [Google Scholar]
  28. Wang, Q.; Wu, B.; Zhu, P.; Li, P.; Zuo, W.; Hu, Q. ECA-Net: Efficient channel attention for deep convolutional neural networks. In Proceedings of the IEEE/CVF Conference on Computer Vision and Pattern Recognition, Seattle, WA, USA, 13–19 June 2020; pp. 11534–11542. [Google Scholar]
  29. Cai, Y.; Wang, Z.; Luo, Z.; Yin, B.; Du, A.; Wang, H.; Zhang, X.; Zhou, X.; Zhou, E.; Sun, J. Learning delicate local representations for multi-person pose estimation. In Proceedings of the European Conference on Computer Vision, Glasgow, UK, 23–28 August 2020; Springer: Cham, Switzerland, 2020; pp. 455–472. [Google Scholar]
  30. Jaderberg, M.; Simonyan, K.; Zisserman, A. Spatial transformer networks. Adv. Neural Inf. Process. Syst. 2015, 28, 2017–2025. [Google Scholar]
  31. Liu, J.; Cai, Q.; Zou, F.; Zhu, Y.; Liao, L.; Guo, F. Biga-yolo: A lightweight object detection network based on yolov5 for autonomous driving. Electronics 2023, 12, 2745. [Google Scholar] [CrossRef]
  32. Jiang, P.; Li, Y.; Wang, C.; Zhang, W.; Lu, N. A deep learning based assisted analysis approach for Sjogren’s syndrome pathology images. Sci. Rep. 2024, 14, 24693. [Google Scholar] [CrossRef]
  33. Woo, S.; Park, J.; Lee, J.Y.; Kweon, I.S. Cbam: Convolutional block attention module. In Proceedings of the European Conference on Computer Vision (ECCV), Munich, Germany, 8–14 September 2018; pp. 3–19. [Google Scholar]
  34. Park, J.; Woo, S.; Lee, J.Y.; Kweon, I.S. Bam: Bottleneck attention module. arXiv 2018, arXiv:1807.06514. [Google Scholar] [CrossRef]
  35. Fu, J.; Liu, J.; Tian, H.; Li, Y.; Bao, Y.; Fang, Z.; Lu, H. Dual attention network for scene segmentation. In Proceedings of the IEEE/CVF Conference on Computer Vision and Pattern Recognition, Long Beach, CA, USA, 15–20 June 2019; pp. 3146–3154. [Google Scholar]
  36. Boureau, Y.L.; Ponce, J.; LeCun, Y. A theoretical analysis of feature pooling in visual recognition. In Proceedings of the 27th International Conference on International Conference on Machine Learning, ICML’10, Haifa, Israel, 21–24 June 2010; pp. 111–118. [Google Scholar]
  37. Zhang, Z.; Wang, H.; Xu, F.; Jin, Y.Q. Complex-Valued Convolutional Neural Network and Its Application in Polarimetric SAR Image Classification. IEEE Trans. Geosci. Remote Sens. 2017, 55, 7177–7188. [Google Scholar] [CrossRef]
  38. AFRL. The Air Force Moving and Stationary Target Recognition Database. Available online: https://www.sdms.afrl.af.mil/index.php?collection=mstar (accessed on 16 November 2025).
  39. Pei, J.; Huang, Y.; Huo, W.; Zhang, Y.; Yang, J.; Yeo, T.S. SAR automatic target recognition based on multiview deep learning framework. IEEE Trans. Geosci. Remote Sens. 2017, 56, 2196–2210. [Google Scholar] [CrossRef]
  40. Liu, Z.; Lin, Y.; Cao, Y.; Hu, H.; Wei, Y.; Zhang, Z.; Lin, S.; Guo, B. Swin transformer: Hierarchical vision transformer using shifted windows. In Proceedings of the IEEE/CVF International Conference on Computer Vision, Montreal, BC, Canada, 11–17 October 2021; pp. 10012–10022. [Google Scholar]
  41. Liu, Z.; Mao, H.; Wu, C.Y.; Feichtenhofer, C.; Darrell, T.; Xie, S. A convnet for the 2020s. In Proceedings of the IEEE/CVF Conference on Computer Vision and Pattern Recognition, New Orleans, LA, USA, 18–24 June 2022; pp. 11976–11986. [Google Scholar]
  42. Ai, J.; Mao, Y.; Luo, Q.; Jia, L.; Xing, M. SAR target classification using the multikernel-size feature fusion-based convolutional neural network. IEEE Trans. Geosci. Remote Sens. 2021, 60, 5214313. [Google Scholar] [CrossRef]
  43. Ding, B.; Wen, G.; Zhong, J.; Ma, C.; Yang, X. A Robust Similarity Measure for Attributed Scattering Center Sets with Application to SAR ATR. Neurocomputing 2017, 219, 130–143. [Google Scholar] [CrossRef]
  44. Ding, B.; Wen, G. Exploiting Multi-View SAR Images for Robust Target Recognition. Remote Sens. 2017, 9, 1150. [Google Scholar] [CrossRef]
  45. Sun, Y.; Liu, Z.; Todorovic, S.; Li, J. Adaptive boosting for SAR automatic target recognition. IEEE Trans. Aerosp. Electron. Syst. 2007, 43, 112–125. [Google Scholar] [CrossRef]
  46. Selvaraju, R.R.; Cogswell, M.; Das, A.; Vedantam, R.; Parikh, D.; Batra, D. Grad-cam: Visual explanations from deep networks via gradient-based localization. In Proceedings of the IEEE International Conference on Computer Vision, Venice, Italy, 22–29 October 2017; pp. 618–626. [Google Scholar]
  47. Lundberg, S.M.; Lee, S.I. A unified approach to interpreting model predictions. Adv. Neural Inf. Process. Syst. 2017, 30, 4768–4777. [Google Scholar]
Figure 1. The multi-scale feature maps of SAR targets under convolutional kernels with different dilation rates. The first column shows the original SAR images.
Information 16 01007 g001
Figure 2. Structure of MDFA-AconvNet for SAR target classification. The proposed MDFA-AconvNet is a combination of MDFA module and A-ConvNets. The MDFA module is composed of channel attention mechanism and spatial attention mechanism.
Information 16 01007 g002
Figure 3. Schematic diagram of random cropping from the MSTAR dataset.
Information 16 01007 g003
Figure 4. Optical images and corresponding SAR images of military targets in the MSTAR dataset.
Information 16 01007 g004
Figure 5. Confusion matrix of classification results based on the MDFA-AconvNet under SOC experiment.
Information 16 01007 g005
Figure 6. Relevant indicators (including precision, recall, and F1-score) of different classification methods.
Information 16 01007 g006
Figure 7. Confusion matrix of classification results based on the MDFA-AconvNet under EOC-1 experiment.
Information 16 01007 g007
Figure 8. Confusion matrix of classification results based on the MDFA-AconvNet under EOC-2-CV experiment.
Information 16 01007 g008
Figure 9. Confusion matrix of classification results based on the MDFA-AconvNet under EOC-2-VV experiment.
Information 16 01007 g009
Figure 10. MSTAR images with with different noise levels.
Information 16 01007 g010
Figure 11. Recognition rate at different noise levels.
Information 16 01007 g011
Figure 12. MSTAR images with different occlusion ratios.
Information 16 01007 g012
Figure 13. Recognition rate at different occlusion ratios.
Information 16 01007 g013
Figure 14. Comparison of Grad-CAM Heatmaps.
Information 16 01007 g014
Figure 15. Explaining the SAR data classification process of A-ConvNet using SHAP. (a) Shapley value heatmaps for the 10 categories. (b) Shapley value heatmaps for the top-5 predicted categories.
Information 16 01007 g015
Figure 16. Explaining the SAR data classification process of MDFA-AconvNet using SHAP. (a) Shapley value heatmaps for the 10 categories. (b) Shapley value heatmaps for the top-5 predicted categories.
Information 16 01007 g016
Figure 17. Classification accuracy of different methods under a small sample size in the SOC datasets.
Information 16 01007 g017
Table 1. Number of Training and Test Images for the SOC Experimental Setup.
ClassSerials No.TrainTest
DepressionNo. ImageDepressionNo. Image
BMP2956317°23315°196
BTR70c7117°23315°196
T-7213217°23215°196
BTR60k10yt753217°25615°195
2S1b0117°29915°274
BRDM2E-7117°29815°274
D792v1301517°29915°274
T-62A5117°29915°273
ZIL131E1217°29915°274
ZSU234d0817°29915°274
Table 2. Number of Training and Test Images for the EOC-1 Experimental Setup.
ClassSerials No.TrainTest
DepressionNo. ImageDepressionNo. Image
T-72A6417°29930°196
2S1b0117°29930°274
BRDM2E-7117°29830°274
ZSU234d0817°29930°274
Table 3. Number of Training and Test Images for the EOC-2-CV Experimental Setup.
ClassSerials No.TrainTest
DepressionNo. ImageDepressionNo. Image
BMP2956317°233--
BRDM2E-7117°298--
BTR70c7117°233--
T-7213217°232--
T-72S7--15° 17°419
T-72A32--15° 17°572
T-72A62--15° 17°573
T-72A63--15° 17°573
T-72A64--15° 17°573
Table 4. Number of Training and Test Images for the EOC-2-VV Experimental Setup.
ClassSerials No.TrainTest
DepressionNo. ImageDepressionNo. Image
BMP2956317°233--
BRDM2E-7117°298--
BTR70c7117°233--
T-7213217°232--
BMP29566--15° 17°428
BMP2c21--15° 17°429
T-72812--15° 17°426
T-72A04--15° 17°573
T-72A05--15° 17°573
T-72A07--15° 17°573
T-72A10--15° 17°567
Table 5. Classification Accuracy of Various Targets in Different Methods Under the SOC Experiment (%).
Method2S1BMP2BRDM2BTR60BTR70D7T-62T-72ZIL131ZSU234Total
VGG1692.792.895.393.393.994.294.195.99698.294.64
ResNet1894.997.499.395.496.997.497.196.999.698.997.38
A-ConvNet78.592.398.287.792.393.195.294.992.397.892.23
VDCNN98.992.398.593.896.999.398.99997.110097.47
ViT-B/1694.99999.697.910098.910010099.699.698.93
Swin-T98.596.999.393.89897.499.690.899.398.297.18
ConvNeXt98.28197.885.190.396.499.393.996.79693.47
MKSFF-CNN97.484.197.187.292.398.998.999.510098.995.43
MDFA-AconvNet98.910010097.410099.399.69999.610099.38
Note: Values represent best single-run performance.
Table 6. Classification Accuracy of Various Targets in Different Methods Under EOC-1 Experiment (%).
Method2S1BRDM2T-72ZSU234Total
VGG1699.099.779.991.092.40
ResNet1810099.072.287.289.60
A-ConvNet10010081.289.992.78
VDCNN10010097.978.194.00
ViT-B/1610098.680.291.092.45
Swin-T99.799.385.897.695.60
ConvNeXt97.296.284.067.086.10
MKSFF-CNN10099.395.180.993.83
MDFA-AconvNet97.610094.195.196.70
Table 7. Classification Accuracy of Various Targets in Different Methods Under EOC-2-CV Experiment (%).
MethodT-72-A32T-72-A62T-72-A63T-72-A64T-72-S7Total
VGG1696.795.893.592.795.294.78
ResNet1899.397.497.693.598.397.22
A-ConvNet95.394.294.688.794.593.46
VDCNN96.094.994.890.296.294.42
ViT-B/1695.596.397.495.392.695.42
Swin-T98.695.596.092.396.995.86
ConvNeXt96.293.289.588.392.892.00
MKSFF-CNN99.597.498.499.092.697.38
MDFA-AconvNet10010099.898.897.499.20
Table 8. Classification Accuracy of Various Targets in Different Methods Under EOC-2-VV Experiment (%).
MethodBMP2-9566BMP2-c21T-72-812T-72-A04T-72-A05T-72-A07T-72- A10Total
VGG1681.587.696.096.997.297.099.393.64
ResNet1895.193.78993.592.796.589.492.84
A-ConvNet81.884.194.198.399.099.399.893.77
VDCNN91.192.894.687.695.690.998.493.00
ViT-B/1670.881.895.396.096.099.586.689.43
Swin-T95.696.799.897.296.599.790.896.61
ConvNeXt73.879.390.880.385.584.192.183.70
MKSFF-CNN86.981.689.795.197.795.199.192.17
MDFA-AconvNet91.493.298.898.199.199.199.897.07
Table 9. Statistical Comparison of Classification Accuracy Between MDFA-AconvNet And A-ConvNet Across 10 Independent Runs.
ClassMDFA-AconvNet Acc (%)A-ConvNet Acc (%)t-Valuep-Value
2S198.91 ± 0.6391.35 ± 2.709.175<0.0001 ***
BMP298.51 ± 0.9388.26 ± 3.2110.230<0.0001 ***
BRDM299.53 ± 0.4397.12 ± 1.036.7360.0001 ***
BTR6096.46 ± 0.9690.41 ± 2.567.1430.0001 ***
BTR7099.74 ± 0.2696.28 ± 1.516.9370.0001 ***
D799.09 ± 0.2496.82 ± 1.893.7080.0049 **
T6299.56 ± 0.4396.52 ± 0.8211.597<0.0001 ***
T7299.39 ± 0.3894.80 ± 2.644.8810.0009 ***
ZIL13199.42 ± 0.4495.26 ± 2.026.1190.0002 ***
ZSU23499.78 ± 0.4497.96 ± 1.144.0090.0031 **
Note: *** p < 0.001 , ** p < 0.01 .
Table 10. Number of Parameters, Model Size, and Computation Time Spent by Each Method.
MethodNumber of Parameters/ 10 6 Model Size/MBComputation Time per Batch/s
VGG16129.03512.320.0264
ResNet1811.1842.670.0055
A-ConvNet0.301.160.0008
VDCNN4.4216.880.0035
ViT-B/1685.41325.830.4306
Swin-T27.52105.220.0387
ConvNeXt87.91335.340.0720
MKSFF-CNN83.33317.890.0094
MDFA-AconvNet0.311.190.0012
Table 11. Results of the Ablation Experiment.
Multiscale Dilated Conv.Channel Attention MechanismSpatial Attention MechanismAccuracy (%)
YesNoYesNoYesNo
92.23
95.75
96.00
95.13
97.62
97.28
97.03
99.38
Disclaimer/Publisher’s Note: The statements, opinions and data contained in all publications are solely those of the individual author(s) and contributor(s) and not of MDPI and/or the editor(s). MDPI and/or the editor(s) disclaim responsibility for any injury to people or property resulting from any ideas, methods, instructions or products referred to in the content.