Article

Obstacle-Aware Charging Pad Deployment in Large-Scale WRSNs: An Outside-to-Inside Onion-Peeling-like Strategy

1
School of Information Engineering, Xiamen Ocean Vocational College, Xiamen 361100, China
2
Department of Computer Science & Information Engineering, Chung Hua University, Hsinchu 30012, Taiwan
*
Author to whom correspondence should be addressed.
Information 2025, 16(10), 835; https://doi.org/10.3390/info16100835
Submission received: 23 August 2025 / Revised: 22 September 2025 / Accepted: 25 September 2025 / Published: 26 September 2025
(This article belongs to the Special Issue Optimization Algorithms and Their Applications)

Abstract

This paper addresses the critical challenge of deploying a minimum number of wireless charging pads (WCPs) in obstacle-rich, large-scale Wireless Rechargeable Sensor Networks (WRSNs) to sustain drone operations. We assume a single base station, stationary sensors, convex polygonal obstacles that drones must avoid, and that both the base station and WCPs provide unlimited energy. To solve this, we propose the Outside-to-Inside Onion-Peeling (OIOP) strategy, a novel two-stage algorithm that prioritizes the coverage of the most remote sensors first and then refines the deployment by removing redundant pads while strictly adhering to obstacle constraints. Simulation results demonstrate OIOP’s superior efficiency: it reduces the number of required pads by approximately 10.83% ± 1.30% and 12.16% ± 1.59% compared to state-of-the-art methods (SMC and MC) and achieves execution times that are 58.02% ± 2.44% and 72.09% ± 2.88% faster, respectively. The algorithm also exhibits remarkable robustness, showing the smallest performance degradation as obstacle density increases.

Graphical Abstract

1. Introduction

Wireless sensor networks (WSNs) are a cornerstone of the Internet of Things (IoT), with applications spanning healthcare monitoring, warehouse management, disaster warning systems, military intelligence, and industrial operations [1]. A persistent challenge in WSNs is energy supply: the compact size of sensors restricts battery capacity, and replacing batteries to prolong sensor lifetime is often impractical.
Recent progress in wireless charging has made wireless power transfer (WPT) a promising solution. With short-range charging efficiency now exceeding 82% [2], rechargeable WSNs—known as wireless rechargeable sensor networks (WRSNs) [1,3]—have emerged as a viable platform. WRSNs typically rely on multiple wireless chargers, and among deployment strategies, mobile charging has attracted increasing attention. In particular, wireless charger vehicles (WCVs), where chargers are mounted on mobile platforms, have been widely studied as an alternative to static chargers.
Meanwhile, unmanned aerial vehicles (UAVs) have become common in many domains. To overcome UAVs’ own limited battery life, wireless charging methods have been developed [4]. Building on this idea, researchers have proposed wireless charging drones (WCDs) [5,6], which can provide real-time charging services to WRSNs. A further innovation is the wireless charging pad (WCP) [5,7], a new technology designed to support the charging needs of WCDs. By deploying wireless charging pads to provide additional energy replenishment, UAVs thus sustain their operations and effectively complete their assigned tasks. Therefore, a key problem is how to deploy the minimum number of wireless charging pads while preserving at least one feasible flying path from the base station (BS) to each sensor.
When designing optimal algorithms for WCP deployment, it is essential to consider connectivity, coverage, and geometric properties [5,7]. However, previous approaches often adopt greedy algorithms to solve WCP deployment problems [5], which typically address coverage and connectivity as two independent problems. This approach restricts the placement of WCPs, such as deploying them only at sensor locations. Additionally, greedy algorithms tend to be overly conservative, leading to the deployment of excessive WCPs. Furthermore, most previous studies have overlooked a critical issue: avoiding the deployment of WCPs in a way that leaves a small number of sensors located in uncovered fragmented areas, which can result in higher costs. Moreover, previous work does not consider obstacles existing in the deployed area.
To address these issues, this work proposes a novel algorithm for WCP deployment by considering obstacles. The proposed algorithm deploys charging pads layer by layer from the outermost region inward, prioritizing coverage before connectivity. Therefore, for obstacle-aware charging pad deployment, the proposed algorithm is called the Outside-to-Inside Onion-Peeling (OIOP) strategy.
Simulation results suggest that higher obstacle density significantly increases the complexity of pad deployment, particularly in large-scale environments with a high number of sensors. As demonstrated by simulation results, the proposed OIOP method uses fewer pads on average compared to both SMC and MC across all sensor configurations. Specifically, the average pad count for OIOP shows an approximate 10.83% ± 1.30% reduction compared to SMC and a 12.16% ± 1.59% reduction compared to MC. As the number of sensors increases, the relative advantage of OIOP slightly diminishes but remains statistically significant. Execution time results further reinforce the efficiency of the OIOP method. On average, the OIOP method is 58.02% ± 2.44% faster in execution time than SMC and shows a 72.09% ± 2.88% improvement over MC. The introduction of obstacles significantly impacts the performance of all methods, primarily increasing execution time and slightly decreasing pad usage. While all methods experience increased computational cost due to environmental complexity, OIOP exhibits the smallest increase in execution time and the least change in pad usage, indicating greater robustness and stability under obstacle constraints.
The rest of this paper is organized as follows. Section 2 surveys previous related works. Section 3 presents the proposed OIOP for deploying charging pads. Section 4 describes the simulation results with discussions. Finally, Section 5 concludes this work.

2. Related Works

The deployment of wireless charging pads (WCPs) to support drone operations in Wireless Rechargeable Sensor Networks (WRSNs) is the core problem addressed by this study. While extensive research exists on mobile charger scheduling and routing, our focus is specifically on the initial, optimal placement of static charging infrastructure. Therefore, this section foregrounds work directly pertinent to WCP deployment, explicitly linking each study’s limitations to the motivation for our Outside-to-Inside Onion-Peeling (OIOP) strategy.
Foundational work by Zorbas and Douligeris [8] established the complexity of 3D drone positioning for charging, highlighting the inherent difficulty of the deployment problem. Subsequent studies by Lin et al. [9] and Baek et al. [6] explored drone routing and charging in WRSNs, but their models typically assume pre-deployed charging points or unlimited drone range, thus not tackling the core optimization challenge of where to place the pads.
The most directly related line of research focuses on minimizing the number of WCPs. Chen et al. [5] proposed greedy algorithms that treat coverage (ensuring every sensor is within charging range of a pad) and connectivity (ensuring a feasible drone path from the base station to every pad) as two independent, sequential problems. This decoupled approach is inherently suboptimal and leads to an excessive number of pads. Furthermore, their method restricts pad placement to sensor node locations, severely limiting the solution space.
Later, Chen et al. [10] and Cheng et al. [7,11] relaxed this constraint by searching the entire deployment area. Specifically, Chen et al. [10] proposed a novel two-phase scheme called Clustering-with-Double-Constraints and Disks-Shift-Combining (CDC&DSC). Their method first generates an initial solution by clustering sensor nodes based on their geographic locations (using K-means) and deploying a pad at the center of each cluster. However, determining the optimal number of clusters is non-trivial and significantly impacts the solution quality. While Cheng et al. [7] used a computationally expensive quad-tree method, Cheng et al. [11] introduced a sink-outward strategy that improved efficiency. However, both approaches deploy pads from the inside (base station) outward. As noted in [11], this can lead to fragmented coverage in the network’s periphery, ultimately requiring more pads to fill these gaps.
A critical, unaddressed gap in all these deployment strategies [5,6,7,8,9,10,11] is their assumption of an obstacle-free environment. Real-world deployment areas invariably contain obstacles (e.g., buildings, trees, terrain) that drones must navigate around. Ignoring these obstacles results in infeasible flight paths, rendering the theoretical deployment solutions impractical. None of the existing pad deployment algorithms account for such geometric constraints.
While the above works form the direct foundation for our study, it is worth acknowledging the broader context of wireless charging research. Shu et al. [12] and Fu et al. [13] made significant contributions to optimal velocity control and path planning for mobile chargers. Zhao et al. [2], Wang et al. [14], and Xie et al. [15,16] pioneered integrated data collection and charging architectures. Guo et al. [17] addressed electromagnetic interference in multi-vehicle environments. Rong et al. [4] provided a comprehensive review of UAV wireless power transfer technologies. Commercial efforts, such as Wibotic’s PowerPad [18], Skysense’s charging boards [19], and Global Energy Transmission’s systems [20], along with research on autonomous networks by Teng Long et al. [21], demonstrate the practical viability of the technology. However, these works, while valuable, do not address the specific, obstacle-aware, optimal deployment problem that is the focus of this paper.
It is precisely to address the limitations of existing deployment strategies—namely, the inefficiency of greedy/decoupled approaches, the fragmentation issue of inside-out deployment, and the complete lack of obstacle awareness—that we propose the OIOP strategy. Our approach integrates coverage and connectivity considerations, deploys from the outside in to prevent fragmentation, and fundamentally incorporates obstacle avoidance into its core algorithms, ensuring the generated deployment is not only minimal but also operationally feasible in real-world scenarios.

3. Onion-Peeling-like Strategy for Obstacle-Aware Charging Pad Deployment

This section introduces a novel deployment strategy for wireless charging pads (WCPs) in Wireless Rechargeable Sensor Networks (WRSNs), termed the “Onion-Peeling Like Strategy.” This method is designed to optimize the placement of charging pads, particularly in complex environments that include obstacles. The strategy operates in two primary phases: an initial pad deployment phase and a subsequent optimization phase. By deploying pads from the network’s outermost perimeter and progressively moving inward, this approach minimizes the total number of pads required while ensuring efficient and feasible flight paths for unmanned aerial vehicles (UAVs).
The section begins by defining the core optimization problem, outlining the objectives, constraints, and key variables such as energy capacity, flight range, and network connectivity. It then details the Onion-peeling like Max Covering (OLMC) algorithm, which guides the initial pad placement to guarantee full sensor coverage. Following this, the algorithm is re-executed to account for obstacle constraints, adjusting the pad configuration to satisfy connectivity requirements and obstacles restrictions.
Key algorithmic components, including AdjPadPos for local coverage optimization and ConnectPads for enforcing network connectivity, are explained in detail. Performance enhancements, such as spatial bounding and phased obstacle handling, are also presented. Finally, the ReLitePad algorithm is introduced as a post-processing step to remove redundant pads and refine the deployment. The section concludes with a computational complexity analysis and a discussion of practical design considerations for large-scale WRSN deployments under realistic flight constraints.

3.1. Optimization Problem: Ensuring Coverage and Connectivity with Considering Obstacles

In this section, we present an onion-peeling like strategy for the deployment of charging pads with obstacles. The primary objective remains optimizing charging pad placement to support drone-based recharging while minimizing infrastructure costs, now explicitly considering obstacles in the deployment area. These restricted areas significantly impact path planning and pad placement decisions.
Given a WRSN deployed in a two-dimensional area of size × size containing nobs convex polygonal obstacles, with n sensor nodes S positioned at s 1 , x , s 1 , y , s 2 , x , s 2 , y , , s n , x , s n , y , and a base station (BS) located at the center p 0 , x , p 0 , y = s i z e / 2 , s i z e / 2 , the goal is to determine obstacle-aware optimal locations for m charging pads P at positions p 1 , x , p 1 , y , p 2 , x , p 2 , y , , p m , x , p m , y such that the following conditions are met:
(1)
The number of deployed charging pads m is minimized to reduce infrastructure costs.
(2)
Every sensor node is accessible via at least one feasible drone path originating from the BS.
(3)
Every sensor node or pad cannot be deployed in one of given obstacles which are convex polygons in shape.
(4)
Network constraints Dcharge and Dpad are satisfied to ensure full connectivity and coverage with considering obstacles.
Mathematically, the optimization problem can be formulated as follows.
M i n i = 1 m ϕ x , y
ϕ x , y = 1 , if   a   charging   pad   is   placed   at   x , y R   and   0 x , y s i z e 0 , otherwise
Subject to:
p j P { p 0 } c i j 1 , s i S  
p j P { p 0 } e i j 1 ,   p j P { p 0 }  
e i j = 1 , i f   d ( p i , p j ) D p a d 0 , otherwise
c i j = 1 , i f   d ( s i , p j ) D c h a r g e 0 , otherwise
s i S f i = 0
p i P { p 0 } g i = 0  
f i = 1 , i f   s i   is   located   in   one   of   obstacles 0 , otherwise
g i = 1 , i f   p i   is   located   in   one   of   obstacles 0 , otherwise
z i j = 1 , i f   t h e   i n t e r v a l   [ p i ,   p j ]   does   not   intersect   any   obstacle 0 , otherwise
Ω   i s   a   p e r m u t a t i o n   o f   a   s u b s e t   o f   P { p 0 } { p i , p j } ( e i , Ω ( 1 ) × z i , Ω ( 1 ) × k = 1 Ω 1 e Ω ( k ) , Ω ( k + 1 ) × z Ω ( k ) , Ω ( k + 1 ) × e Ω ( Ω ) , j × z Ω ( Ω ) , j ) 1 , p i , p j P { p 0 }
where pi ≠ pj when i ≠ j, and p0 = BS.
Constraints (3) and (6) ensure that every sensor node (SN) is covered by at least one pad. Constraints (4) and (5) control whether each pad is connected to at least one other pad. Constraints (7) and (9) ensure that no sensor node is located within an obstacle. Similarly, Constraints (8) and (10) ensure that no charging pad is deployed within an obstacle.
Constraint (12) ensures that there is at least one available flying path between any two charging pads (including BS), so that the UAV can fly along this path. This is fundamental for maintaining network connectivity. We explain this requirement in a clear, step-by-step manner:
(1)
Obstacle-avoiding Path Existence (Implicit Check): For any two distinct pads pi and pj (where ij), there must exist at least one obstacle-free flight path connecting them. This is not enforced by a separate constraint but is inherently guaranteed by Constraints (11) and (12). If no such path exists due to obstacles, zij in Constraint (11) returns 0, which automatically violates Constraint (12).
(2)
Range Constraint (Explicit Check): The distance of any two consecutive pads pi and pj in the shortest feasible flight path must be less than or equal to Dpad, the UAV’s maximum flight range between recharges. This is formally stated as:
d (pi, pj) ≤ Dpad, ∀i, j where ij.
Here, d(pi, pj) computes the Euclidean distance between pads pi and pj. If d(pi, pj) exceeds Dpad, the corresponding eij becomes zero according to Constraint (5). Consequently, every path that contains such a pair of pads would violate Constraint (12).
In essence, Constraint (12) serves a dual purpose: (1) Implicit Check verifies the existence of at least one obstacle-free flight path connecting every two consecutive pads pi and pj. (2) Explicit Check verifies the existence of at least one flight path and ensures its distance of consecutive pads is within the UAV’s operational range.
This integrated check guarantees that the connectivity graph of the charging pads is not only topologically connected but also physically traversable by the UAV.

3.1.1. Network Architecture

This study investigates a wireless rechargeable sensor network (WRSN) operating in an environment with predefined obstacles. These obstacles are represented as convex polygons Z = {z1, z2, …, zk}, where k = nobs. The network comprises a set of rechargeable sensor nodes S = {s1, s2,…,sn}, distributed across a designated area. Each sensor node collects environmental data and transmits it to a central base station (BS). To maintain uninterrupted network operation, a drone is dispatched from the BS to recharge nodes whose battery levels fall below a critical threshold. The drone’s flight range, however, is constrained by its own energy capacity. To extend its endurance and enable feasible navigation, wireless charging pads P = {p1, p2, …,pm} are strategically deployed throughout the network. Their placement must account for obstacles to ensure that all flight paths remain valid. The system is modeled under the following assumptions:
(1)
The network includes a single BS and one drone.
(2)
All sensor nodes are stationary, identical in function, and equipped with the same battery capacity.
(3)
The BS has complete knowledge of sensor node locations and obstacle boundaries.
(4)
When a node requires recharging, the BS dispatches the drone.
(5)
Both the BS and charging pads are stationary and have unlimited energy supplies.
(6)
All drone flight paths must avoid obstacles.

3.1.2. Drone Energy Consumption Model

The operational capability of a drone within a Wireless Rechargeable Sensor Network (WRSN) is fundamentally governed by its energy budget. This section details a model for the drone’s energy consumption, which is essential for determining the feasible flight range between charging points and the placement of wireless charging pads (WCPs).
The duration required to fully restore the energy of a sensor node, denoted as Esensor, is contingent upon the power transfer rate of the charging system (Ptx) and the efficiency (η) of the wireless power transfer process. Since not all transmitted power is received by the sensor due to losses, the effective charging power is ηPtx. The charging time τcharge is therefore calculated as:
τ c h a r g e = E s e n s o r η P t x  
While the drone is engaged in charging a sensor, it must remain stationary, consuming energy at a rate of Phover. The total energy expenditure during this hovering phase, Ehover, is given by:
E h o v e r = P h o v e r τ c h a r g e = P h o v e r E s e n s o r η P t x
This energy, Ehover, represents a direct operational cost of the charging service. After the charging operation is complete, the residual energy available for flight is the drone’s full battery capacity (Edrone) minus the energy consumed during hovering. This remaining energy dictates the maximum distance the drone can travel to reach the next destination (e.g., another sensor or a charging pad). Given the drone’s flight speed (Vflight) and its power consumption rate during flight (Pflight), this maximum operational range Dcharge is:
D c h a r g e = E d r o n e E h o v e r P f l i g h t V f l i g h t  
In contrast, when the drone is traveling between two WCPs and is not performing a charging task, no energy is expended on hovering. In this scenario, the entire battery capacity Edrone is available for propulsion. The maximum distance the drone can cover between two consecutive pads, Dpad, is therefore:
D p a d = E d r o n e P f l i g h t V f l i g h t
It is important to recognize that Ehover is not a fixed value; it varies dynamically based on network conditions, such as the energy required for each charging session (Ereq) and the network’s charging policy. For the purpose of streamlining the simulation analysis and focusing on the core deployment algorithm, the subsequent simulations assume that the energy consumed during hovering is negligible (Ehover ≈ 0). This simplification allows the drone’s full energy capacity to be used for flight in the model, acknowledging that a more precise analysis would account for the full energy cost defined above.

3.2. Proposed Outside-to-Inside Onion-Peeling Like Strategy

Previous pad-deployment schemes, such as MSC, TNC, and GNC, have often restricted pad placement to sensor locations [5]. This limitation significantly narrows the solution space and overlooks potentially superior positions. While later work by Cheng et al. [7] relaxed this constraint by searching the entire plane using a quad-tree subdivision, this recursive partitioning becomes computationally expensive for large maps.
In contrast, the Sink-outward Max Covering (SMC) algorithm starts from the base station and deploys pads outward [11]. However, as the deployment region expands, gaps can form between previously placed pads, leading to fragmented coverage and forcing the algorithm to add more pads than necessary.
To address these shortcomings, this work introduces an outside-to-inside, onion-peeling strategy. The algorithm begins by placing pads to cover the outermost sensors first. It then “peels” off this covered layer and repeats the process, moving progressively inward. This approach inherently confines the search space by leveraging the shrinking boundary of the uncovered region.
Furthermore, existing methods have not adequately addressed environments with obstacles that a UAV must navigate around. This work explicitly incorporates such obstacles into the deployment. The straight-line Euclidean distance is replaced with the actual flight path distance, calculated using a visibility graph to route the UAV around restricted areas. While this ensures operational feasibility, the routing computations can be intensive. To mitigate this overhead, we introduce two acceleration techniques:
(1)
Limiting the search space for path-planning calculations.
(2)
Phased handling of obstacles, where they are ignored during initial pad placement and are only enforced during the subsequent optimization stage.
The proposed OIOP approach proceeds in two distinct stages:
(1)
Initial pad deployment: OLMC first generates a preliminary layout that guarantees full sensor coverage while ignoring obstacles. This phase focuses solely on minimizing the number of pads based on geometric coverage. During the pad configuration process, OLMC invokes AdjPadPos to perform regional optimization of pad positions, and finally calls ConnectPads to ensure connectedness between the configured pads.
(2)
Obstacle-aware optimization: In the second stage, ReLitePad first removes pads that are placed on obstacles from the configuration and then invokes ReCover to supplement appropriate pads, ensuring that the pad configuration complies with obstacle constraints while maintaining connectedness and coverage. Next, it identifies all closely spaced pads and attempts to remove them before calling ReCover again to search for a better configuration. During ReCover, OLMC is invoked once more to re-optimize the configuration for the remaining uncovered sensors and valid pad locations.
The final layout simultaneously satisfies coverage of all sensors, connectivity from the base station to every pad, and strict adherence to obstacles restrictions.
To provide a clear overview before delving into the component algorithms, the OIOP strategy can be summarized by the following high-level pseudocode (Algorithm 1) and its corresponding workflow (Figure 1).
Algorithm 1: OIOP_Strategy (Outside-to-Inside Onion-Peeling)
Purpose: an onion-peeling like strategy for the deployment of charging pads with considering obstacles.
Input:
             S: Set of sensors.
             BS: Base station.
             OBstacles: cell array of convex polygons (each N × 2) defining obstacles.
Output:
             pads (set): Final set of optimally deployed charging pads.
Process:
  1:      //PHASE 1: INITIAL DEPLOYMENT (Obstacles Ignored for Speed)
          ToCoverS   // All sensors need coverage initially.
  2:      DPads← ∅      // No pads deployed yet
  3:      padsOLMC(ToCover, DPads)   // Deploy pads for full coverage, ignoring
  4:                                                              // obstacles
  5:      //PHASE 2: OBSTACLE-AWARE OPTIMIZATION
  6:      padsReLitePad(pads, S, OBstacles)
  7:             // ReLitePad internally performs:
  8:             //      a. Remove any pads placed on obstacles.
  9:             //      b. Re-deploy pads (using OLMC) to cover any sensors left uncovered.
  10:           //      c. Identify and remove redundant pad groups, re-deploying only if it
                  //          reduces total pad count.
                  //      d. Ensure final pad set is fully connected (using ConnectPads).
return pads
The detailed workings of OLMC, ReLitePad, and its subroutines (AdjPadPos, ConnectPads, ReCover) are described in the following Section 3.3. This top-down approach allows readers to understand the strategic flow before engaging with the tactical details of each component.

3.3. Main Algorithm (OLMC)

The OLMC algorithm, detailed in Algorithm 2, is the cornerstone of this methodology and is invoked twice. In its first call, it generates the initial layout with the ToCover set containing all sensors and the DPads (deployed pads) set being empty. After constraint violators are removed, the remaining valid pads are assigned to DPads, and any newly uncovered sensors are added to the ToCover set for the second invocation of OLMC.
Algorithm 2: OLMC (Onion-peeling Like Max Covering)
Purpose: Deploy charging pads in an outside-in, onion-layer fashion, prioritizing coverage of the outermost sensors first, while ensuring full coverage and connectivity under obstacles constraints.
Input:
             Obstacle (boolean): Whether to consider obstacles.
             ToCover (set): Target sensors that must be covered.
             DPads (set): Pre-deployed charging pads (may be empty).
Output:
             pads (set): Final set of optimally deployed charging pads.
Process:
  1:        Sort all sensors in ToCover in descending order by Euclidean distance from the              base station (BS).
  2:        PadsDPads
  3:        while ToCover is not empty do
  4:            target ← first sensor in ToCover //farthest uncovered sensor
  5:            [pos, NewCovered] ← AdjPadPos(NoFlyZone, ToCover [1]);
  6:            Add a new pad at position pos to pads
  7:            Remove NewCovered sensors from ToCover
  8:        end while
  9:        padsConnectPads(pads); //Ensure connectivity among all pads
  10:      return pads
The overall worst-case complexity of the OLMC algorithm is O(n2 + p3), where n is the number of sensors and p is the number of deployed pads. In practice, since p << n, the complexity is dominated by the O(n2) term.

3.3.1. Flight Distance Calculation in Obstacle-Aware Environments

In an environment with obstacles, the calculation of flight distance is the most affected aspect. The dist algorithm used in this paper, presented as Algorithm 3, computes the shortest obstacle-avoiding flight distance between two points.
First, when the map is obstacle-free or the two query points already enjoy a clear line of sight, only one geometric test is executed. That test intersects the single segment (p1, p2) with every edge of every convex obstacle; with nobs polygons and e edges each, this costs O(k·e) time.
When obstacles do block the straight line, the routine must expand the existing visibility graph. Two extra vertices (p1 and p2) are inserted, and each of them is checked for mutual visibility against the n obstacle vertices already stored in the graph. Each individual visibility test again inspects every edge of every obstacle, summing to O(n·k·e).
Finally, the shortest route is extracted by running Dijkstra’s algorithm [22] on the augmented graph. The graph now contains n + 2 vertices and at most m + O(n) additional edges. With a binary heap, the search takes O((m + n) log n). In the worst-case visibility graph m can approach Θ(n2), yielding O(n2log n), yet in typical sparse environments m remains Θ(n) and the bound collapses to O(n log n). Combining these computations, the overall worst-case running time isT(n, k, e) = O(n·k·e + (m + n) log n),which can be simplified to O(n·k·e + n2 log n) for dense visibility graphs, or O(n·k·e + n log n) for sparse, well-behaved maps. Algorithm 3 is described in detail below.
Algorithm 3: dist (Calculate fly distance between two points)
Purpose: Return the shortest flight distance between two planar points p1 = (x1, y1) and p2 = (x2, y2) that respects every convex obstacle in the map.
Input:
             p1, p2: start and goal coordinates.
             OBstacles: cell array of convex polygons (each N × 2) defining obstacles.
             free_points: cell array of OBstacles vertices that are reachable by the UAV.
             freeG: undirected weighted graph that already links mutually-visible vertices.
Output:
             d; scalar flight distance (Inf if no route exists).
Process:
  1:     if is_collision_free (p1, p2, OBstacles)
  2:           return the Euclidean distance between p1 and p2;
  3:     end
  4:     V ← {p1, p2} ∪ free_points.
  5:     Build an auxiliary graph G identical to freeG, then add p1 and p2 as two new nodes.
  6:     For every vV
  7:         if segment (p1, v) is collision-free, add edge (p1, v) with weight‖vp1‖into G.
  8:         if segment (p2, v) is collision-free, add edge (p2, v) with weight‖vp2‖into G.
          Run Dijkstra’s algorithm on G from node p1 to node p2.
          Let d be the obtained path length; if the search fails, set d ← Inf.
  9:     Return d.
  10:

3.3.2. Pad Position Adjustment

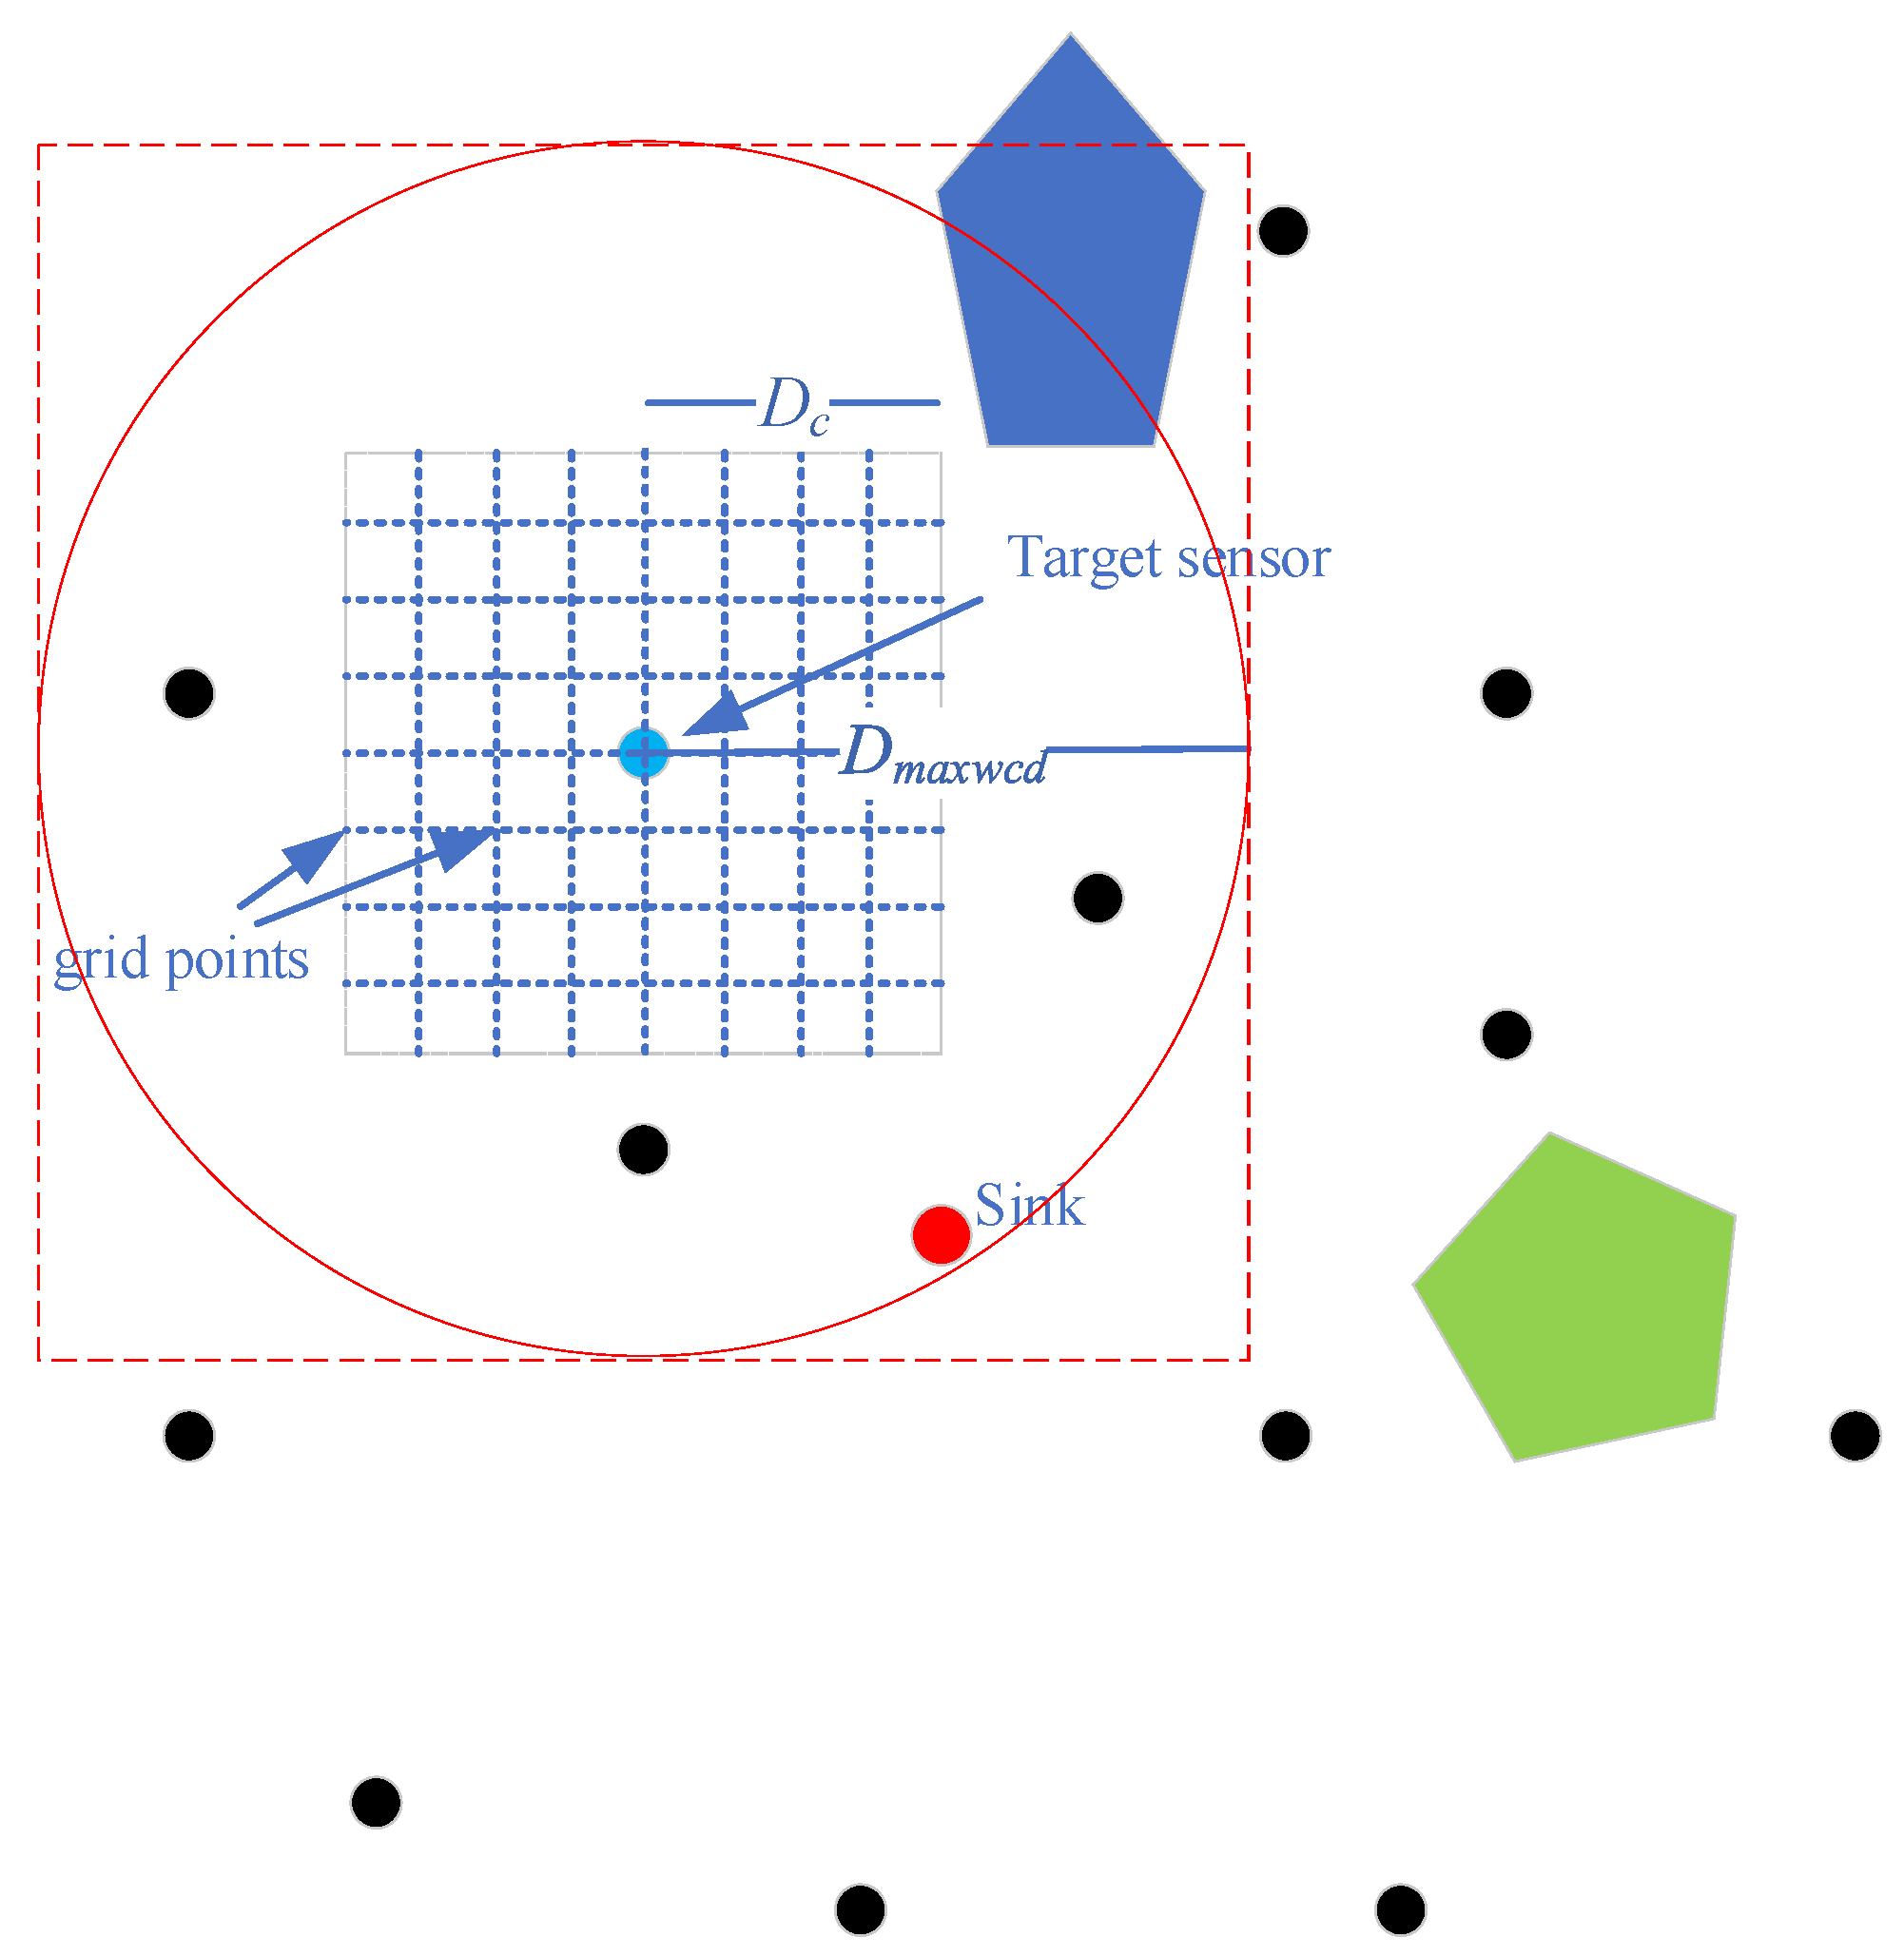
In the OLMC algorithm, the primary computation is the AdjPadPos function (Algorithm 3), which finds the optimal position for a new charging pad. It examines a square search area around a target sensor to find a location that maximizes the coverage of yet-uncovered sensors. As illustrated in Figure 2, the algorithm employs three spatial filtering mechanisms: (1) a circular LimitB region(red) with radius Dpad for preliminary sensor screening, (2) a bounding box (red dashed line) for obstacle pre-selection, and (3) a grid-based search space (gray dots) for precise positioning. This hierarchical filtering ensures only relevant obstacles (blue polygon) and sensors are evaluated. The time complexity of AdjPadPos is O(n).
When obstacles are present, as analyzed in Algorithm 3, both the quantity and geometric configuration (specifically the vertex count of convex polygons) of obstacles directly influence the computational cost of distance measurements. However, since the visibility relationships between vertices of these obstacles remain constant, the corresponding visibility graph can be precomputed once and subsequently reused. As demonstrated in Figure 2, any obstacle that falls completely outside the red circular boundary region can be disregarded without affecting the calculations.
To exploit this observation, AdjPadPos first collects all sensors that lie within twice Dcharge of the target into a working set PB (line 4), thereby limiting the inner loop to PB instead of the entire sensor field and accelerating the coverage count in line 10. Additionally, clipObstacles (line 6) discards irrelevant obstacle fragments, further speeding up the distance checks performed in lines 9 and 10.
To efficiently discard irrelevant no-fly areas, we derive a bounding box that tightly encloses (i) every sensor in PB and (ii) the local-search window used by AdjPadPos. A no-fly polygon is retained for further processing only if at least one of its vertices lies inside this bounding box or if any of its edges intersects the box; otherwise, it is ignored when computing obstacle-avoiding flight distances within AdjPadPos.
The computational complexity of Algorithm 4 (AdjPadPos) reveals an elegant balance between thoroughness and efficiency in its design. At its core, the algorithm employs a systematic grid-based search pattern that carefully navigates the trade-off between precision and performance. The fixed grid resolution serves as a crucial design parameter, establishing a predictable upper bound on the outer loop’s iterations regardless of the network’s scale. This intentional constraint transforms what could be an unbounded search into a manageable, constant-time operation.
Algorithm 4: AdjPadPos (Adjust pad positions)
Purpose: Find the best grid position to place a new charging pad for sensor sid,
                maximizing uncovered-sensor coverage while respecting obstacles and map                 bounds.
Input:
             sid: ID of the target sensor to cover,
             pos: Initial candidate positions (usually the sensor’s locations).
Output:
             bestpos: Optimal pad position [x, y],
             bestNW: List of sensor IDs newly covered by bestpos.
Process:
  1:         cx, cy ← pos;  bestPos ← pos;  bestNW ← ∅
  2:         GWidth ← Dcharge;  step ← 100
  3:         PB ← {k ∈ B | dist(k,sid) ≤ Dpad}  // LimitB
  4:         bbox ← boundingBox(PB ∪ {pos})
  5:         obstacles ← clipObstacles(bbox)
  6:         for i, j in grid(cx±GWidth, step)
  7:                     p ← [cx+i, cy+j]
  8:                     if outside(p) or inObs(p) or dist(p,pos) > Dcharge then continue
  9:                     NW ← {k ∈ PB | dist(p,S[k]) ≤ Dcharge}
  10:                   if |NW| > |bestNW| then bestPos←p; bestNW←NW
  11:       return (bestPos, bestNW)
Within this carefully bounded search space, the algorithm performs its most computationally intensive work during sensor coverage evaluation. Each candidate position undergoes rigorous assessment, with the algorithm meticulously counting how many sensors fall within the effective charging radius. The working set PB, containing potential sensors within twice the Dcharge distance of the target, represents the algorithm’s operational horizon. In worst-case scenarios where the network density is high, this set may encompass nearly all sensors, creating a linear relationship between sensor count and computation time.
Algorithm 5 formalizes this clipping procedure, which inspects every vertex and every edge of each obstacle polygon once. With M obstacles and an average of N vertices per obstacle, the total complexity is O(M·N).
Algorithm 5: clipObs (Remove redundant obstacles)
Purpose: Remove all obstacles that lie completely outside the given bounding box,                  returning only those (or parts of those) that could affect the current local search.
Input:
             bbox: structure {xmin, xmax, ymin, ymax} defining the rectangular region of interest.
Output:
             clippedObs: cell array of convex polygons that intersect or lie inside bbox.
Process:
  1:       clippedObs ← ∅
  2:       foreach polygon P in obstacles
  3:              P ← convex polygon vertices // N × 2 matrix
  4:              if any vertex of P lies inside bbox
  5:                     clippedObs{end+1} ← P
  6:              else if bbox intersects any edge of P
  7:                     clippedObs{end+1} ← P
  8:       return clippedObs
What makes this linear complexity particularly remarkable is how it’s achieved despite the algorithm’s comprehensive functionality. The spatial filtering through LimitB acts as an intelligent gatekeeper, dramatically reducing unnecessary computations by focusing only on relevant areas. Meanwhile, the reuse of precomputed obstacle visibility graphs from Algorithm 3 demonstrates the system’s architectural elegance, avoiding redundant calculations while maintaining accuracy.
The practical implications of this O(n) complexity become evident when examining the algorithm’s performance in large-scale deployments. As shown in the simulation results, this linear scaling allows the system to maintain responsive performance even as network size grows, a critical requirement for real-world WRSN applications where sensor counts can number in the hundreds or thousands. The algorithm’s design exemplifies how careful attention to computational boundaries and intelligent filtering can yield solutions that are both thorough and efficient.

3.3.3. Connectivity Enforcement

Algorithm 6, named ConnectPads, is designed to transform an initially disconnected set of charging pads into a single connected component that is reachable from the base station. At its core, it follows a strategy similar to Prim’s algorithm for constructing a minimum spanning tree: starting from the base station pad, it iteratively identifies the closest pad not yet included in the connected component and attempts to establish a connection between them. The term “closest” refers to the shortest feasible flight path for the drone. Therefore, the length of each candidate edge is computed using either a straight-line Euclidean distance or an obstacle-avoiding path metric, depending on the presence of obstacles in the environment.
Each outer iteration incorporates exactly one new pad into the connected component, so the loop runs at most p times, where p is the total number of charging pads to be connected. During each iteration, the algorithm must identify the globally shortest edge connecting a pad in the connected set to one in the unconnected set. A straightforward implementation evaluates all possible pairs between the two sets, which requires o(p2) primitive operations.
If the computed distance between the selected pads is within the maximum allowed inter-pad distance Dpad, the new pad is added to the connected component without requiring further adjustment of its position. Otherwise, the algorithm attempts to reduce the gap by incrementally relocating one or both endpoint pads in steps of α meters. After each tentative relocation, the algorithm re-evaluates sensor coverage and overall pad connectivity to ensure constraints are still satisfied. These validation steps—potentially repeated for multiple candidate edges—constitute the most computationally intensive part of the algorithm. Their cost scales with both the number of pads p and the number of sensors n, leading to a worst-case time complexity of approximately O(p3) when pn.
Algorithm 6: ConnectPads (Connecting Pads)
Purpose: Ensure all pads form a connected network (spanning tree) from the base station (pad 1). If any two pads exceed the maximum link distance Dpad, insert additional relay pads or move existing pads to bridge the gap while preserving coverage.
Input:
             p: array of pad positions.pos = [x, y].,
Output:
             pads: updated array of connected pads (original + added/relocated).
Process:
  1:       pads ← {p1} // start with base station
  2:       remainp\{p1} // pads to connect
  3:       while remain ≠ ∅
  4:               (i, j) ← argmin p pads , q remain d i s t ( p , q )
  5:               if dist(i, j) ≤ Dpad
  6:                       padspads ∪ {j}; remainremain \ {j}
  7:               else
  8:                       // Try to move i or j closer
  9:                       moved ← moveCloser(i, j, Dpad)
  10:                     if moved
  11:                             continue
  12:                     else
  13:                             // Insert relay pad on straight line
  14:                             relay ← midpoint(i, j, Dpad)
  15:                             padspads ∪ {relay}
  16:                     end
  17:             end
           return pads
In environments without obstacles, distance computations reduce to simple Euclidean calculations, allowing the algorithm to operate close to the theoretical O(p3) bound. However, when obstacles are present, each distance query requires computing the shortest obstacle-avoiding path around nobs convex polygons, each represented by an average of m vertices. This involves dynamically constructing a visibility graph and applying Dijkstra’s algorithm, increasing the cost per distance query to O(nobs mlog(nobs m)). Since these expensive queries are embedded within the O(p2) edge-selection loop and are also invoked during relocation validations, the overall runtime becomes significantly higher, scaling as the product of the obstacle-dependent query cost and the original polynomial complexity in p and n.

3.3.4. Post-Processing: Redundant Pad Removal

After the initial deployment and connection, a post-processing stage called Redundant-pad Removal and Lightweight Re-deployment (ReLitePad), detailed in Algorithm 7, is invoked to eliminate inefficiencies. ReLitePad operates in two phases:
(1)
Redundant-Group Detection: It identifies candidate groups of redundant pads by constructing a graph where an edge exists between any two pads within distance Dpad of each other.
(2)
Selective Removal & OLMC-Based Recovery: For each candidate group, ReLitePad tentatively removes the pads and then runs the ReCover subroutine (Algorithm 8) to re-establish coverage for any affected sensors using the OLMC algorithm. If this results in a layout with fewer pads, the change is accepted.
If the resulting layout P′ satisfies full sensor coverage and inter-pad connectivity while using fewer pads than the original layout P, the change is committed (PP′); otherwise, the tentative removal is discarded. The process repeats until no further reduction is possible.
Let p denote the number of deployed pads and n the number of sensors. Redundant-group enumeration requires O(p2) time to scan all pad pairs and O(p) per group to collect neighbors. Then, ReCover is dominated by O(p × n) to verify coverage for sensors, and O(k2) where kn is the number of uncovered sensors when OLMC is invoked. ConnectPads, invoked after ReCover to restore connectivity, incurs O(p3) in the worst case.
In practice, only a small fraction of pad pairs qualifies as redundant, and kn, so the observed runtime is far below the worst-case bound. When k or p approaches n, the overall complexity becomes O(n2).
Algorithm 7: ReLitePad (Redundant-pad Removal and Lightweight Re-deployment)
Purpose: Redundant-pad Removal and Re-deployment Optimization for Obstacle-Aware                WRSNs.
Global:
             Dcharge: UAV one-hop charging radius.
             Dpad: max inter-pad connection distance.
Obstacles: convex obstacle polygons (empty if ObstacleMode = false).
Input:
             P: {p1, …, pm} is the current charging-pad set (each p = (x, y)).
             S: sensor set (here index 1 is the base-station).
Output:
             P′: subset of P plus possibly new pads such that every sensor sS is within              Dcharge of ≥1 pad, and the induced communication graph (edges ≤ Dpad) is              connected.
Process:
  1:        originNumPad ← |P|
  2:        for each pP do                                // filter invalid pads
  3:                if inObs(p) then
  4:                        PP - {p}
  5:        end for
  6:        if |P| < originNumPad                        // removed some pads located in obstacles
  7:                    P ← ReCover(∅, P)
  8:        repeat
  9:                  changed ← false
  10:                BuildAdjacency(P)                          // conn[i] ← { j|dist(pi, pj) ≤ Dpad }
  11:                RP ← ∅                                        // candidate redundant groups
  12:                for i ← 2 .. |P|–1 do
  13:                        for ji+1 .. |P| do
  14:                                if dist(pi, pj) < Dcharge/2 then
  15:                                     RPRP ∪ { {i, j} ∪ conn[i] ∪ conn[j]}
  16:                foreach set R in RP do
  17:                        P′ ← ReCover(R, P)
  18:                        P′ ← ConnectPads(P′)
  19:                        if |P′| < |P| then
  20:                                PP
  21:                                changed ← true
  22:                                break RP-loop                  // restart scanning with a new layout
  23:      until changed = false
  24:      P′←P
  25:      return P
Algorithm 8: ReCover (Recovering sensors)
Purpose: Re-deploy charging pads after removing redundant or obstacle-overlapping pads while guaranteeing full sensor coverage and preparing for connectivity restoration.
Global:
             S: sensor set (index 1 = BS)
             Dcharge: UAV one-hop charging radius
             Obstacles: convex obstacle polygons.
Input:
             R: indices of pads to remove
             P: original set of pads
Output:
             P′: updated pad set covering every sensor within Dcharge under obstacle constraints.
Process:
  1:        P′ ← ∅                                  // initialize new pad set
  2:        for each pP do                 // filter invalid pads
  3:                if pR then
  4:                        P′ ← P′ ∪ {p}
  5:        end for
  6:        ToCover ← ∅                       // sensors left uncovered
  7:        foreach sS do
  8:                covered ← false
  9:                foreach pPdo
  10:                      if dist(s, p) ≤ Dcharge then
  11:                              covered ← true
  12:                              break
  13:                      end if
  14:              end for
  15:              if s is not covered then
  16:                      ToCoverToCover ∪ {s}
  17:              end if
  18:      end for
  19:      if ToCover ≠ ∅ then         // re-deploy pads for uncovered sensors
  20:              P′ ← OLMC(ToCover, P′)
  21:      end if
  22:      return P
When obstacles are considered, the computational complexity of the ReLitePad algorithm and its subroutines, ReCover and ConnectPads, is primarily influenced by two factors beyond standard geometric and graph-based calculations.
(1)
Obstacle-Aware Distance Queries
Every distance calculation performed using the dist(u, v) function must compute the shortest obstacle-avoiding flight path, rather than a simple straight-line Euclidean distance. This introduces significant computational overhead.
Worst-Case Cost Per Query: For a map with nobs convex obstacles, each having an average of m vertices, the cost of constructing a local visibility graph and running Dijkstra’s algorithm is O(nobs m log(nobs m)) per query.
Total Impact in ReLitePad: The increased query cost affects several components of the algorithm:
Redundant-group detection: Requires up to O(p2) queries, where p is the number of pads.
ConnectPads: Require up to O(p3) queries.
ReCover coverage checks: Need up to O(p × n) queries, where n is the number of sensors.
Consequently, the total overhead introduced by obstacle-aware distance calculations can be expressed as O((p2 + p3 + pn) × nobs m log(nobs m)).
(2)
Bounding-Box & Clipping Optimizations
To mitigate the above overhead, ReLitePad applies two pruning techniques:
clipObstacles: This technique reduces the number of active obstacles (nobs) and vertices (m) for each local search by considering only those polygons that intersect a tightly defined bounding box. This significantly cuts the average-case cost of each query to nearly O(log(nobs) + m).
LimitB: This method further prunes the search space by narrowing it to a circular area with a radius of 2 × Dcharge around each candidate pad. As a result, the effective values of nobs and m become small constants in practice.
These optimizations lead to a more manageable complexity:
Worst-case overall: The overall worst-case complexity is O((p3 + p·n + k2) ⋅nobs m log(nobs m)), where k is the number of uncovered sensors (kn).
Practical large-scale scenario: With the LimitB and clipObstacles optimizations, the complexity in practical, large-scale scenarios is reduced to O((p3 + p·n + k2) log nobs), which is only poly-logarithmic in the number of obstacles.

3.4. Practical Interpretation of Complexity Bounds

The formal worst-case complexity bounds presented in Section 3.3 (e.g., O(n2log n), O(p3)) are mathematically rigorous but may appear overly pessimistic in practice. These bounds assume worst-case scenarios—such as densely packed obstacles or fully connected visibility graphs—that rarely occur in real-world deployments.
In practice, the OIOP strategy performs far more efficiently due to two key design features:
(1)
Spatial Pruning: The LimitB and clipObstacles optimizations restrict computations to small, local neighborhoods. This means variables like the number of obstacles (nₒbs) and obstacle vertices (m) behave as small constants, not scaling factors.
(2)
Favorable Scaling: The number of pads (p) is typically much smaller than the number of sensors (n). For example, with 500 sensors, p rarely exceeds 45—making p3 computationally trivial (~91 k operations).
Empirical Validation: As shown in Section 4.2, these optimizations reduce execution time by over 80% in large-scale scenarios. This confirms that the algorithm’s practical performance is excellent, even if its theoretical bounds are high.
In short, while the formal bounds ensure algorithmic soundness, practitioners can confidently deploy OIOP knowing it is efficient, scalable, and robust—even in obstacle-rich, large-scale WRSNs.

4. Simulation Results

To evaluate the effectiveness of the proposed algorithm, a large-scale WRSN testbed comprising 50 to 500 sensor nodes is employed. The nodes are uniformly and randomly deployed within a rectangular area, with the BS positioned at the center. Simulations are conducted in MATLAB (R2023b) on a machine equipped with an Intel Core i7–13700H CPU and 32 GB of RAM. Each result is averaged over 30 independent runs.
For the test maps, four different sizes are used: small (4096 × 4096), medium (6144 × 6144), large (8192 × 8192), and extra-large (16,384 × 16,384), following the setup in Cheng et al. [11]. Ten distinct node deployments are generated for each map size, resulting in a total of 40 test environments.
To assess the impact of restricted zones, we introduce obstacles into the maps. Each obstacle is generated by randomly selecting a center point (cx, cy) on the map. Five points are then independently and uniformly sampled on the circumference of a circle with a 500 m radius centered at this point. The convex hull of these five random points is computed using Andrew’s monotone chain algorithm [23] to form the final convex polygon representing the obstacle boundary.
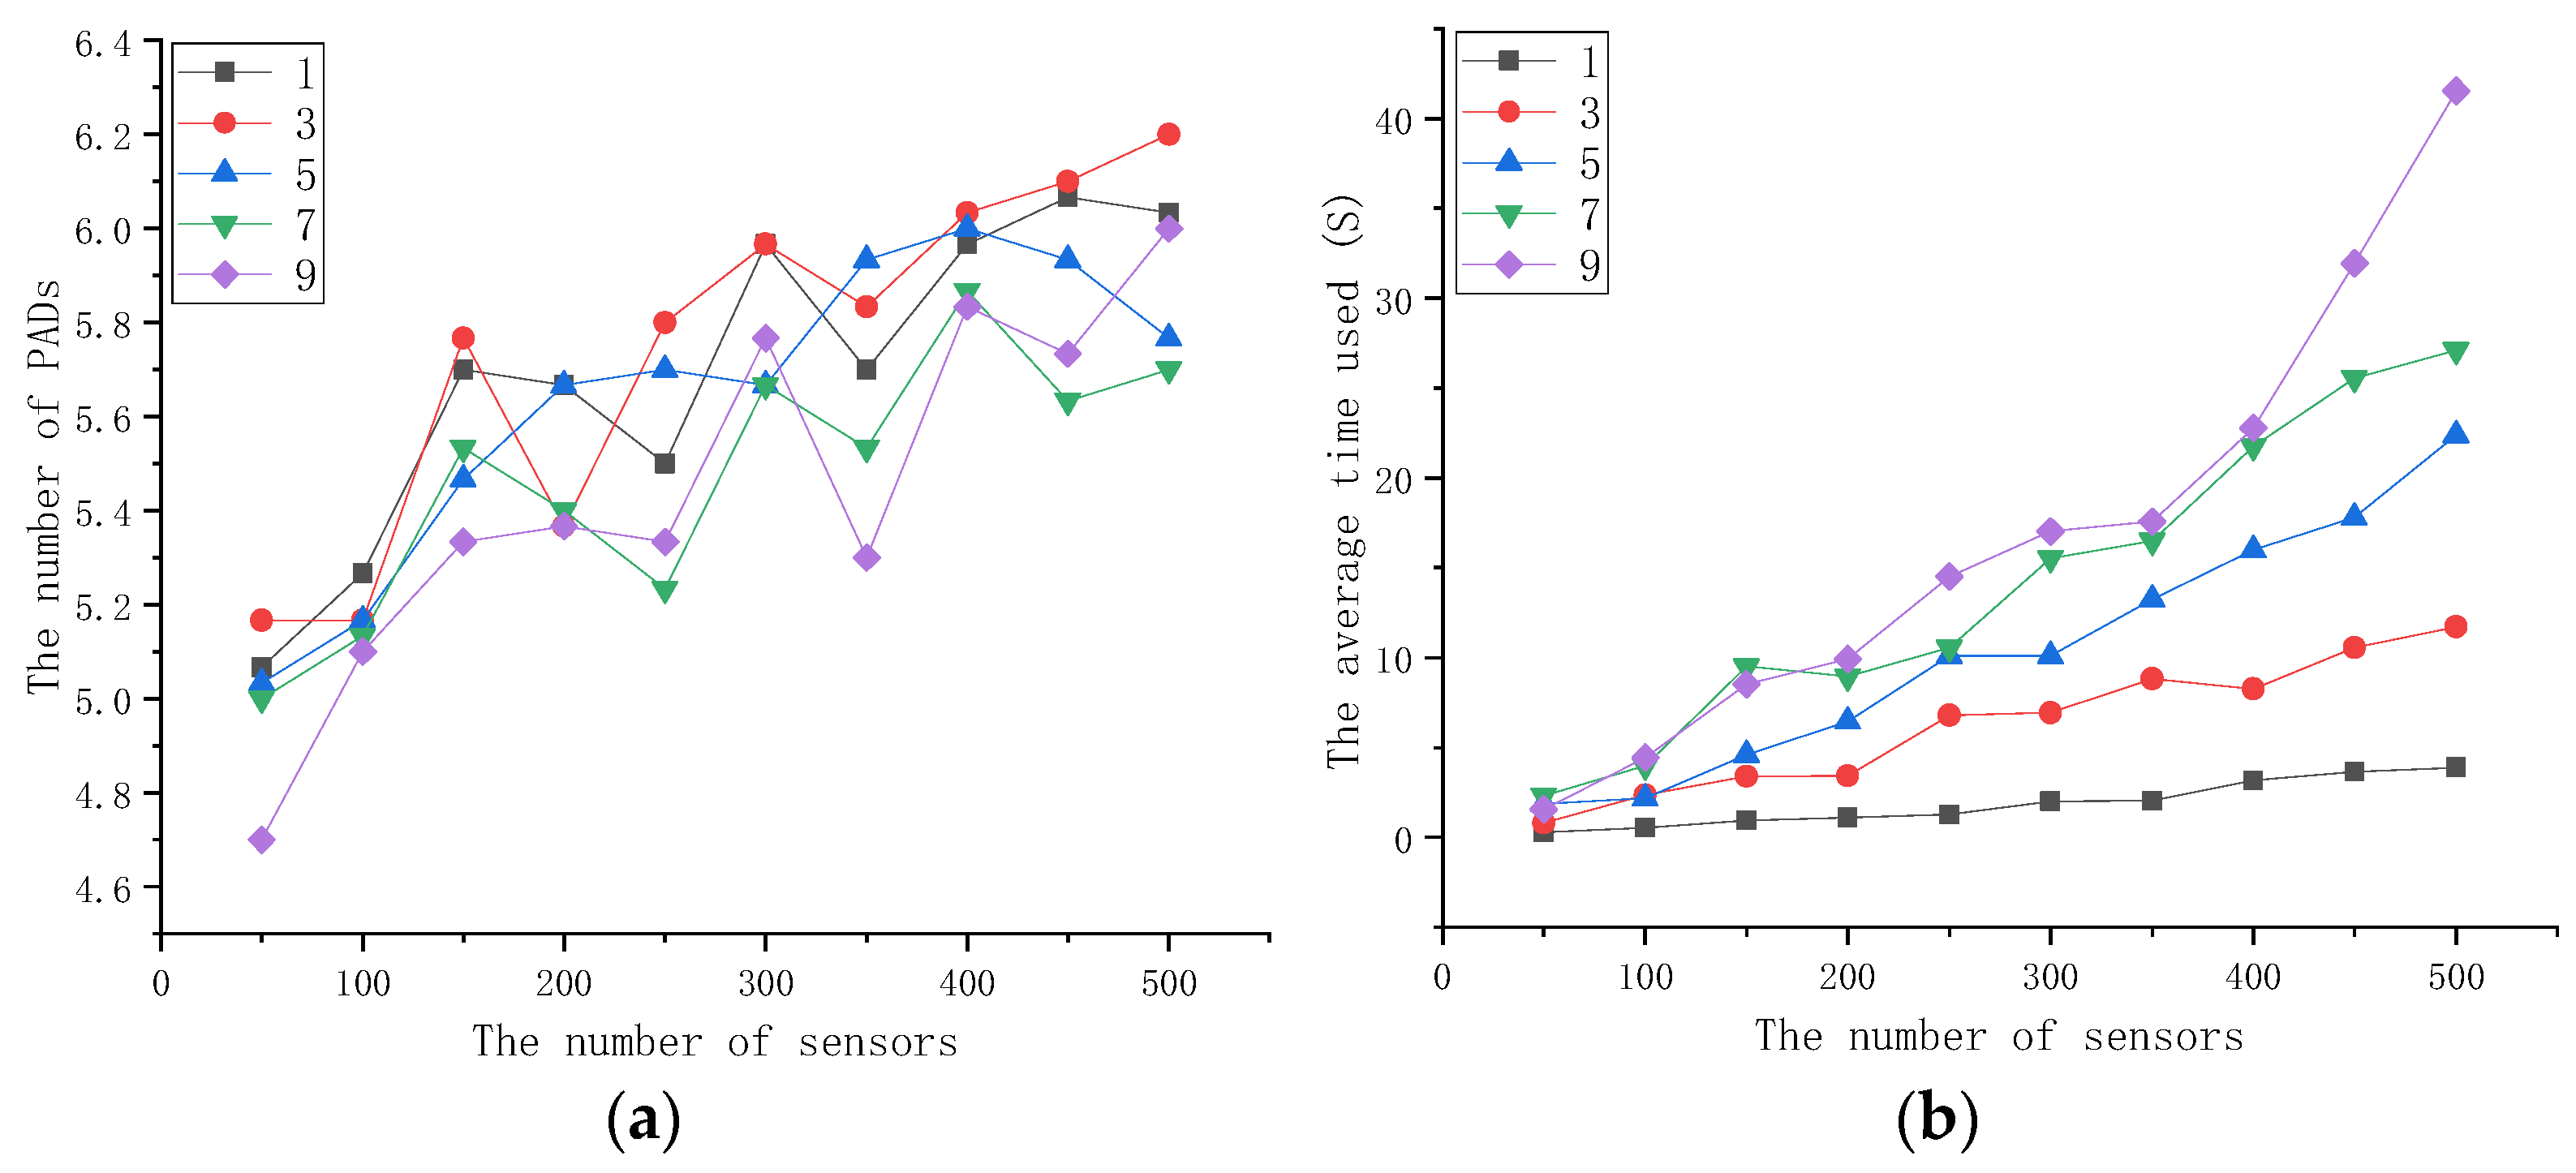
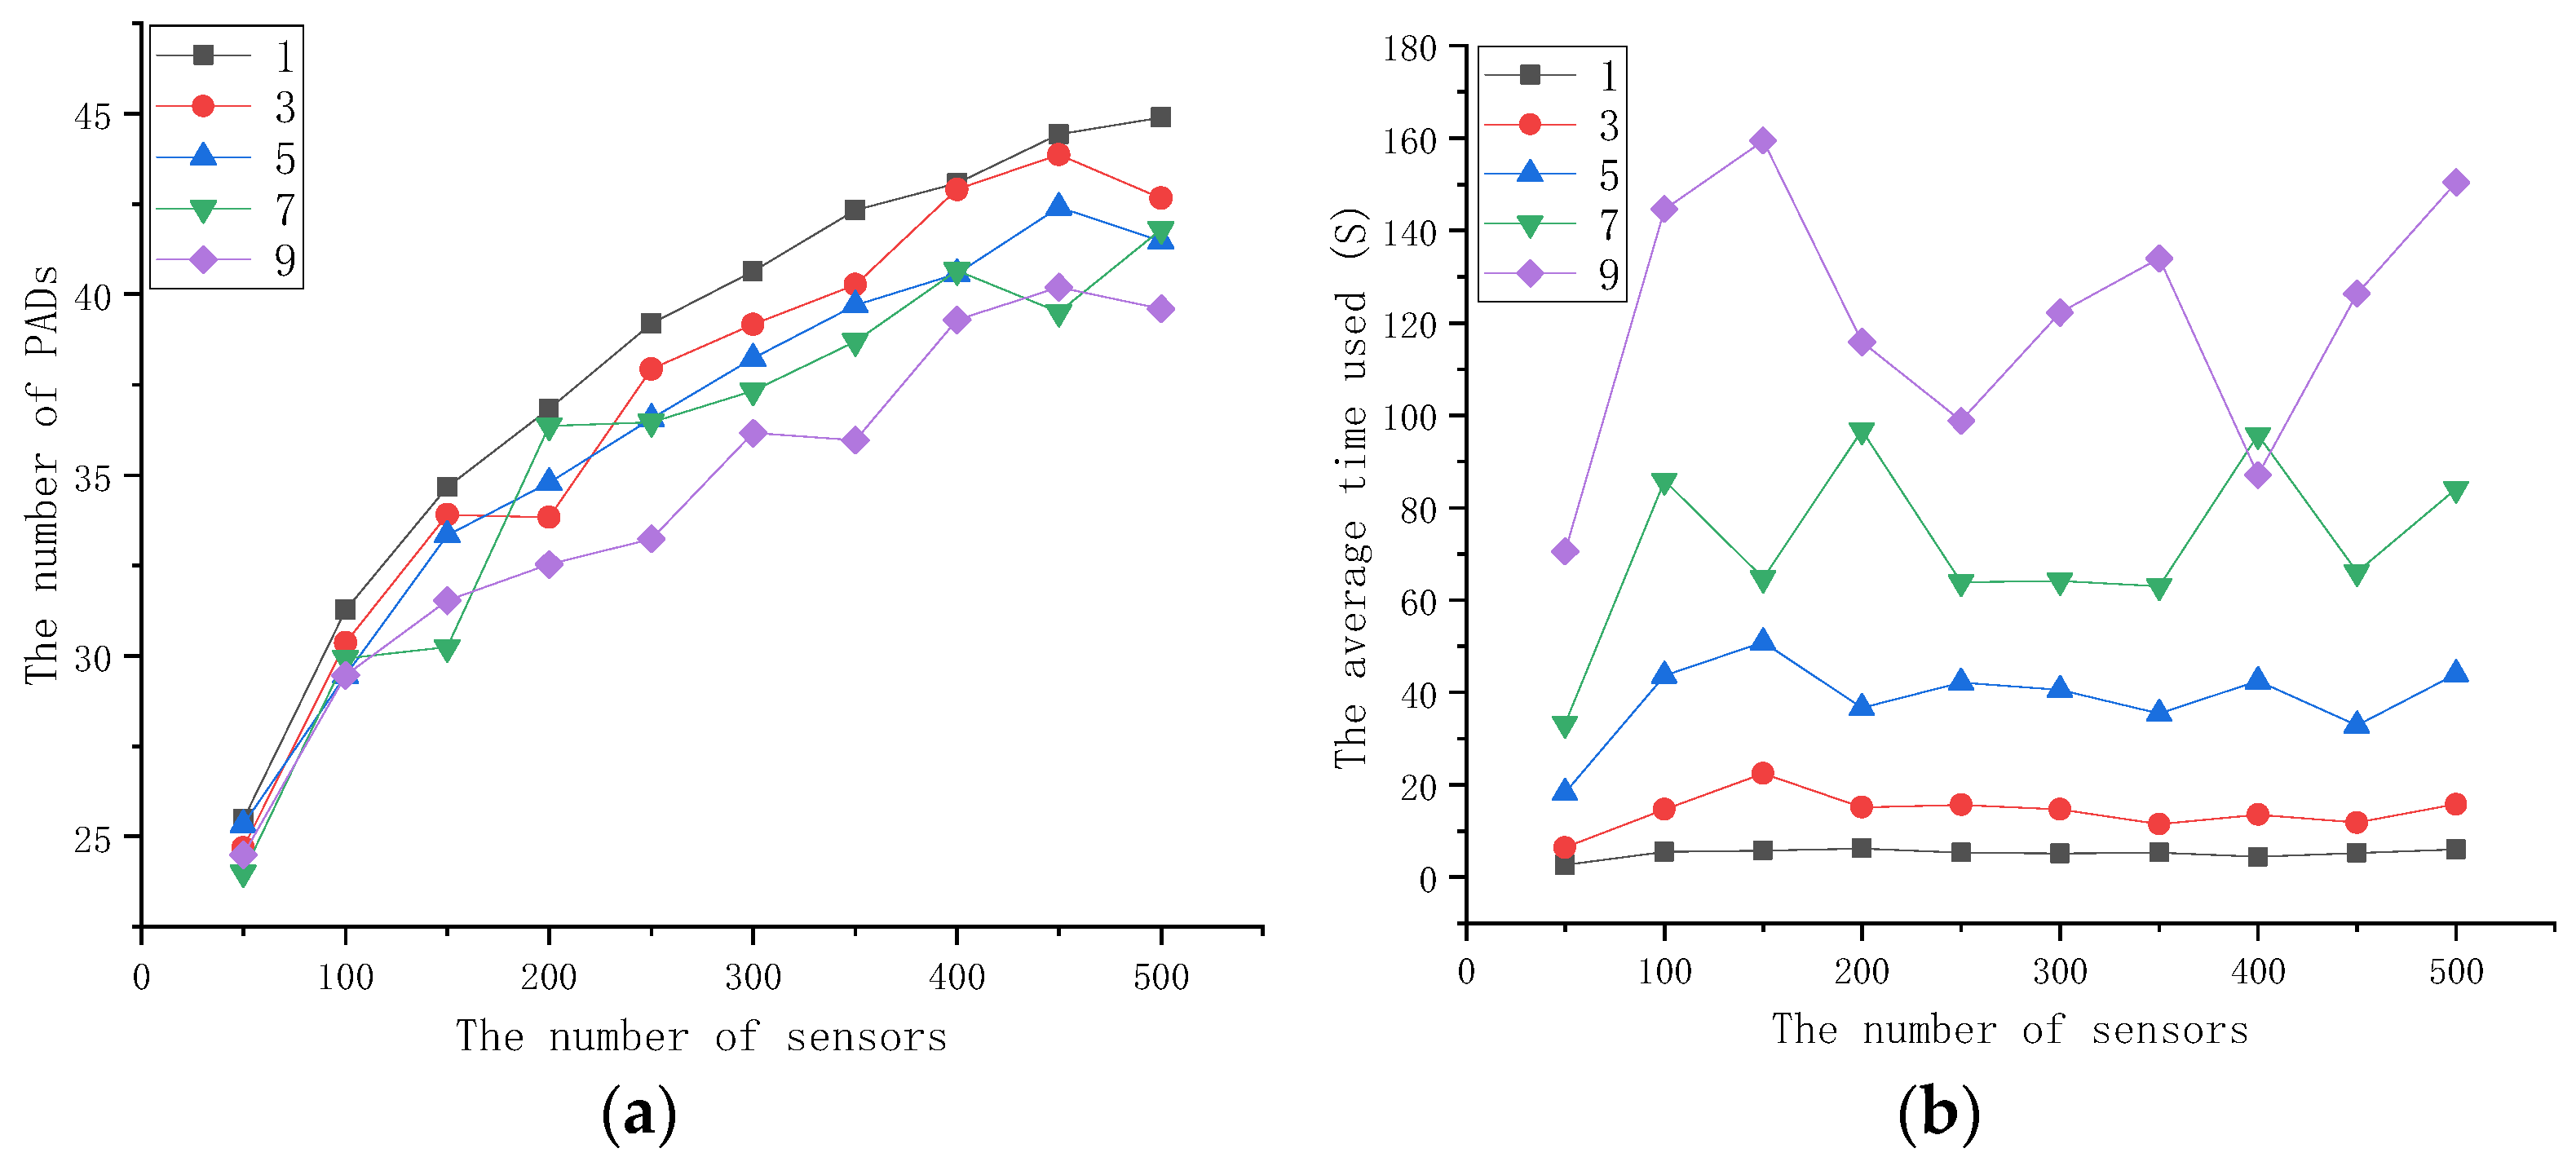
The maps are categorized based on the number of obstacles they contain: 1, 3, 5, 7, or 9. This results in a total of 200 (40 × 5) distinct testing scenarios. However, to conserve space, the simulations presented in Section 4.1 and Section 4.2 focus primarily on the large maps (8192 × 8192) with 9 obstacles, representing complex terrain.
The comparison metrics include the number of deployed pads and the execution time. Parameter values are set according to prior work, as summarized in Table 1. To the best of our knowledge, this is the first study that considers obstacles in pad deployment. Related works [MSC, CDC, QT, SMC] do not account for such restrictions; therefore, except for Section 4.1, no comparisons with other methods are made.

4.1. Performance Comparison of Pad Deployment in Environments with and Without Obstacles

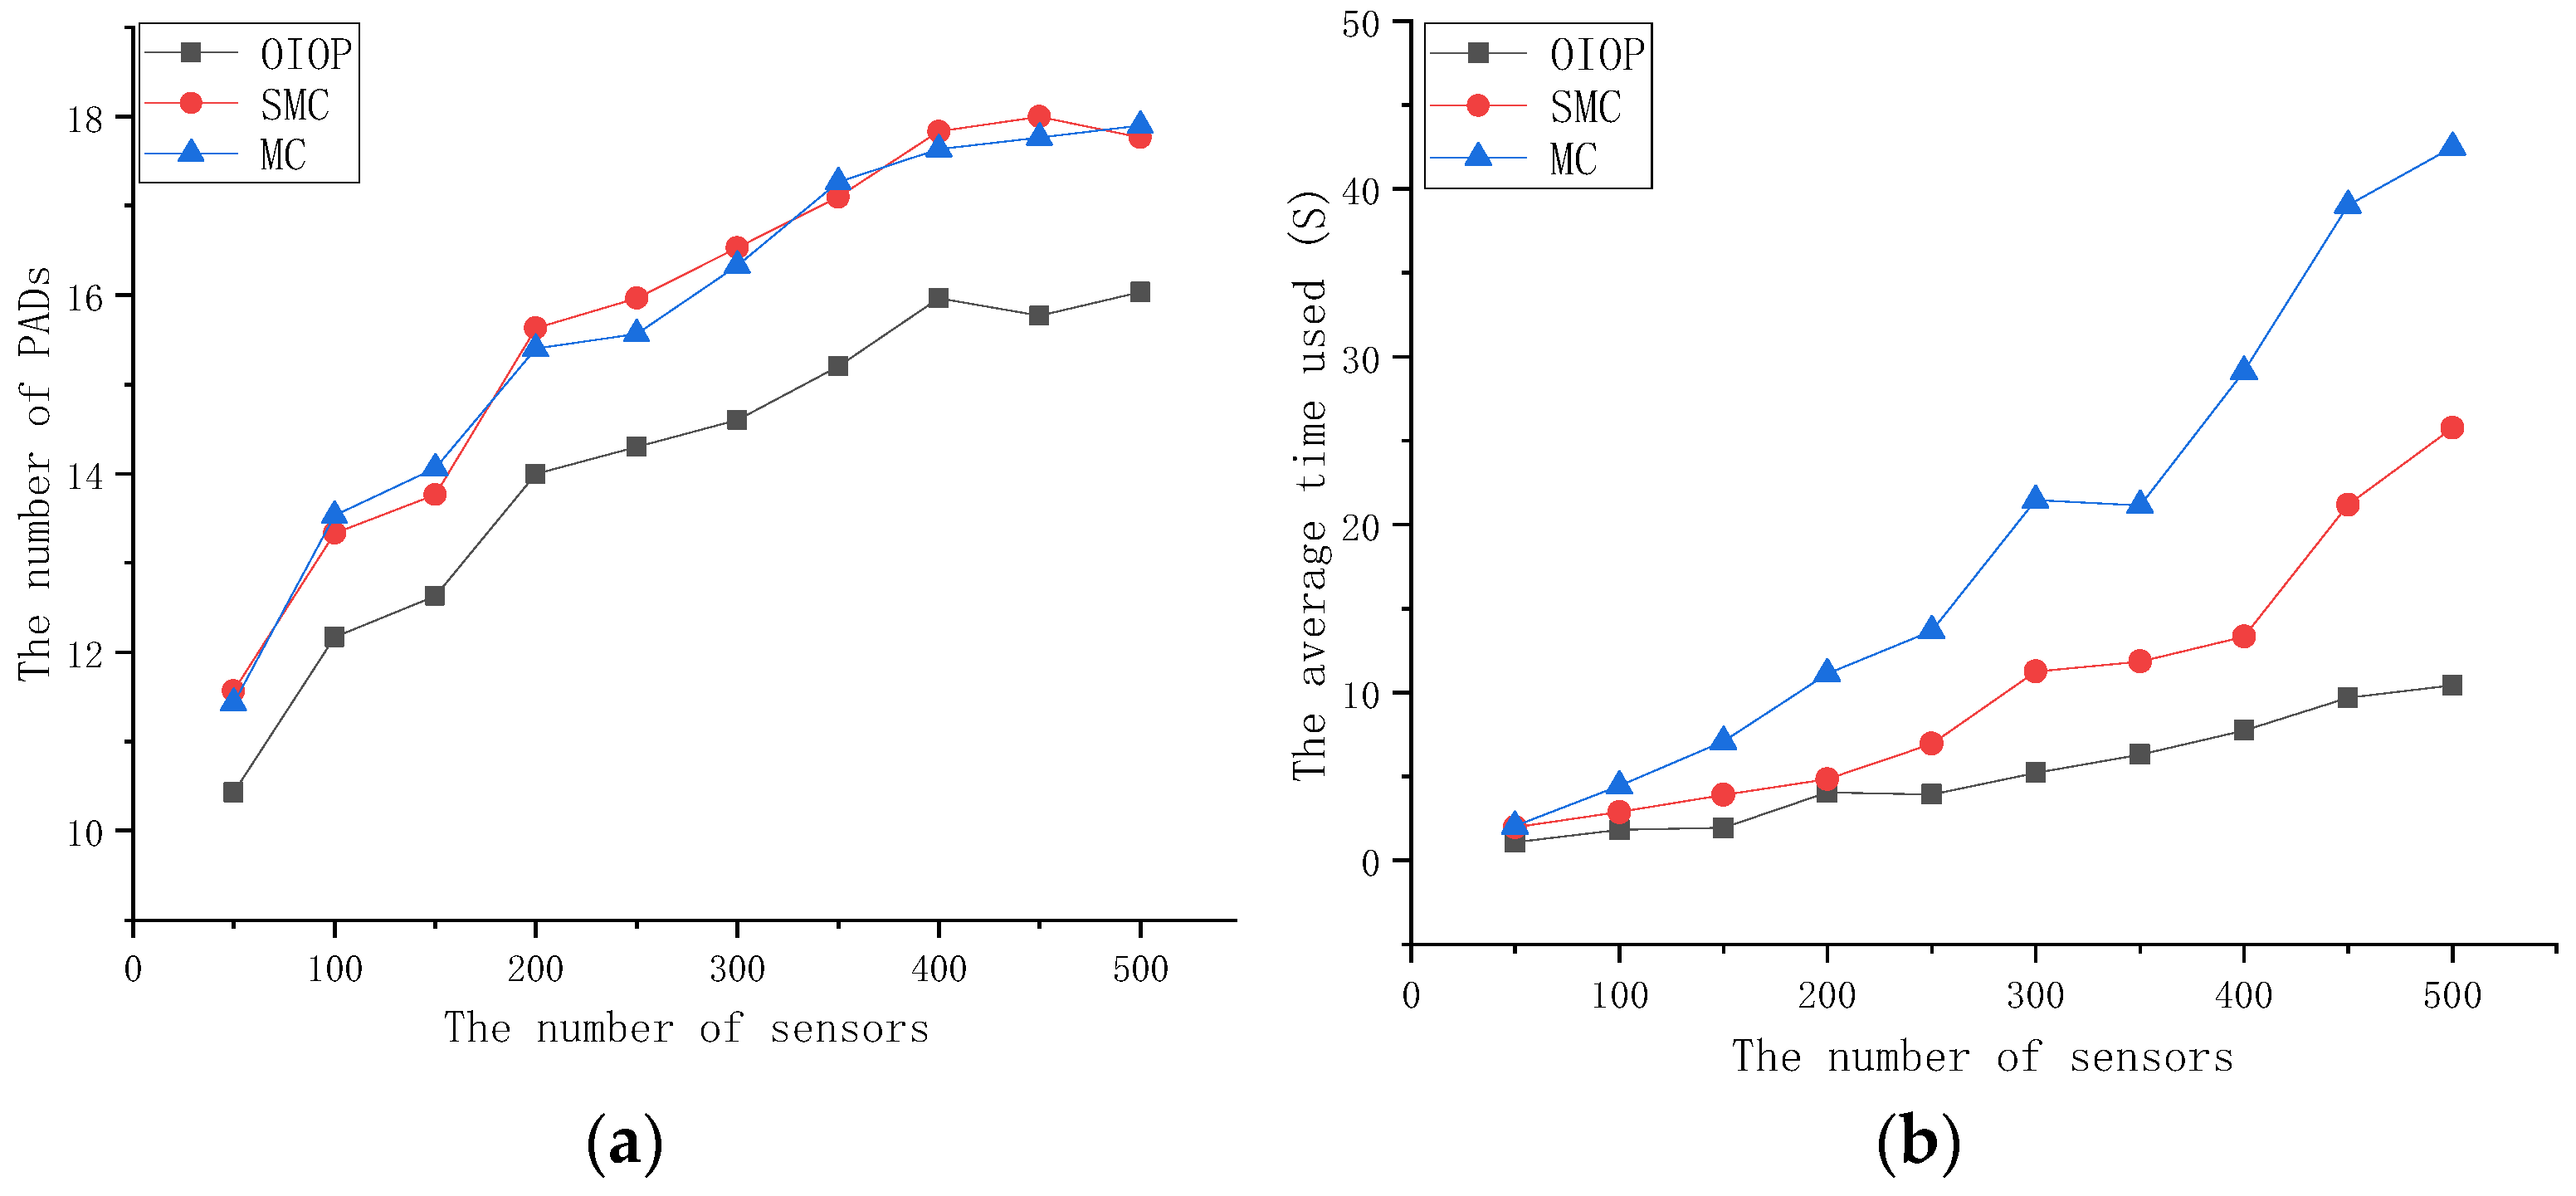
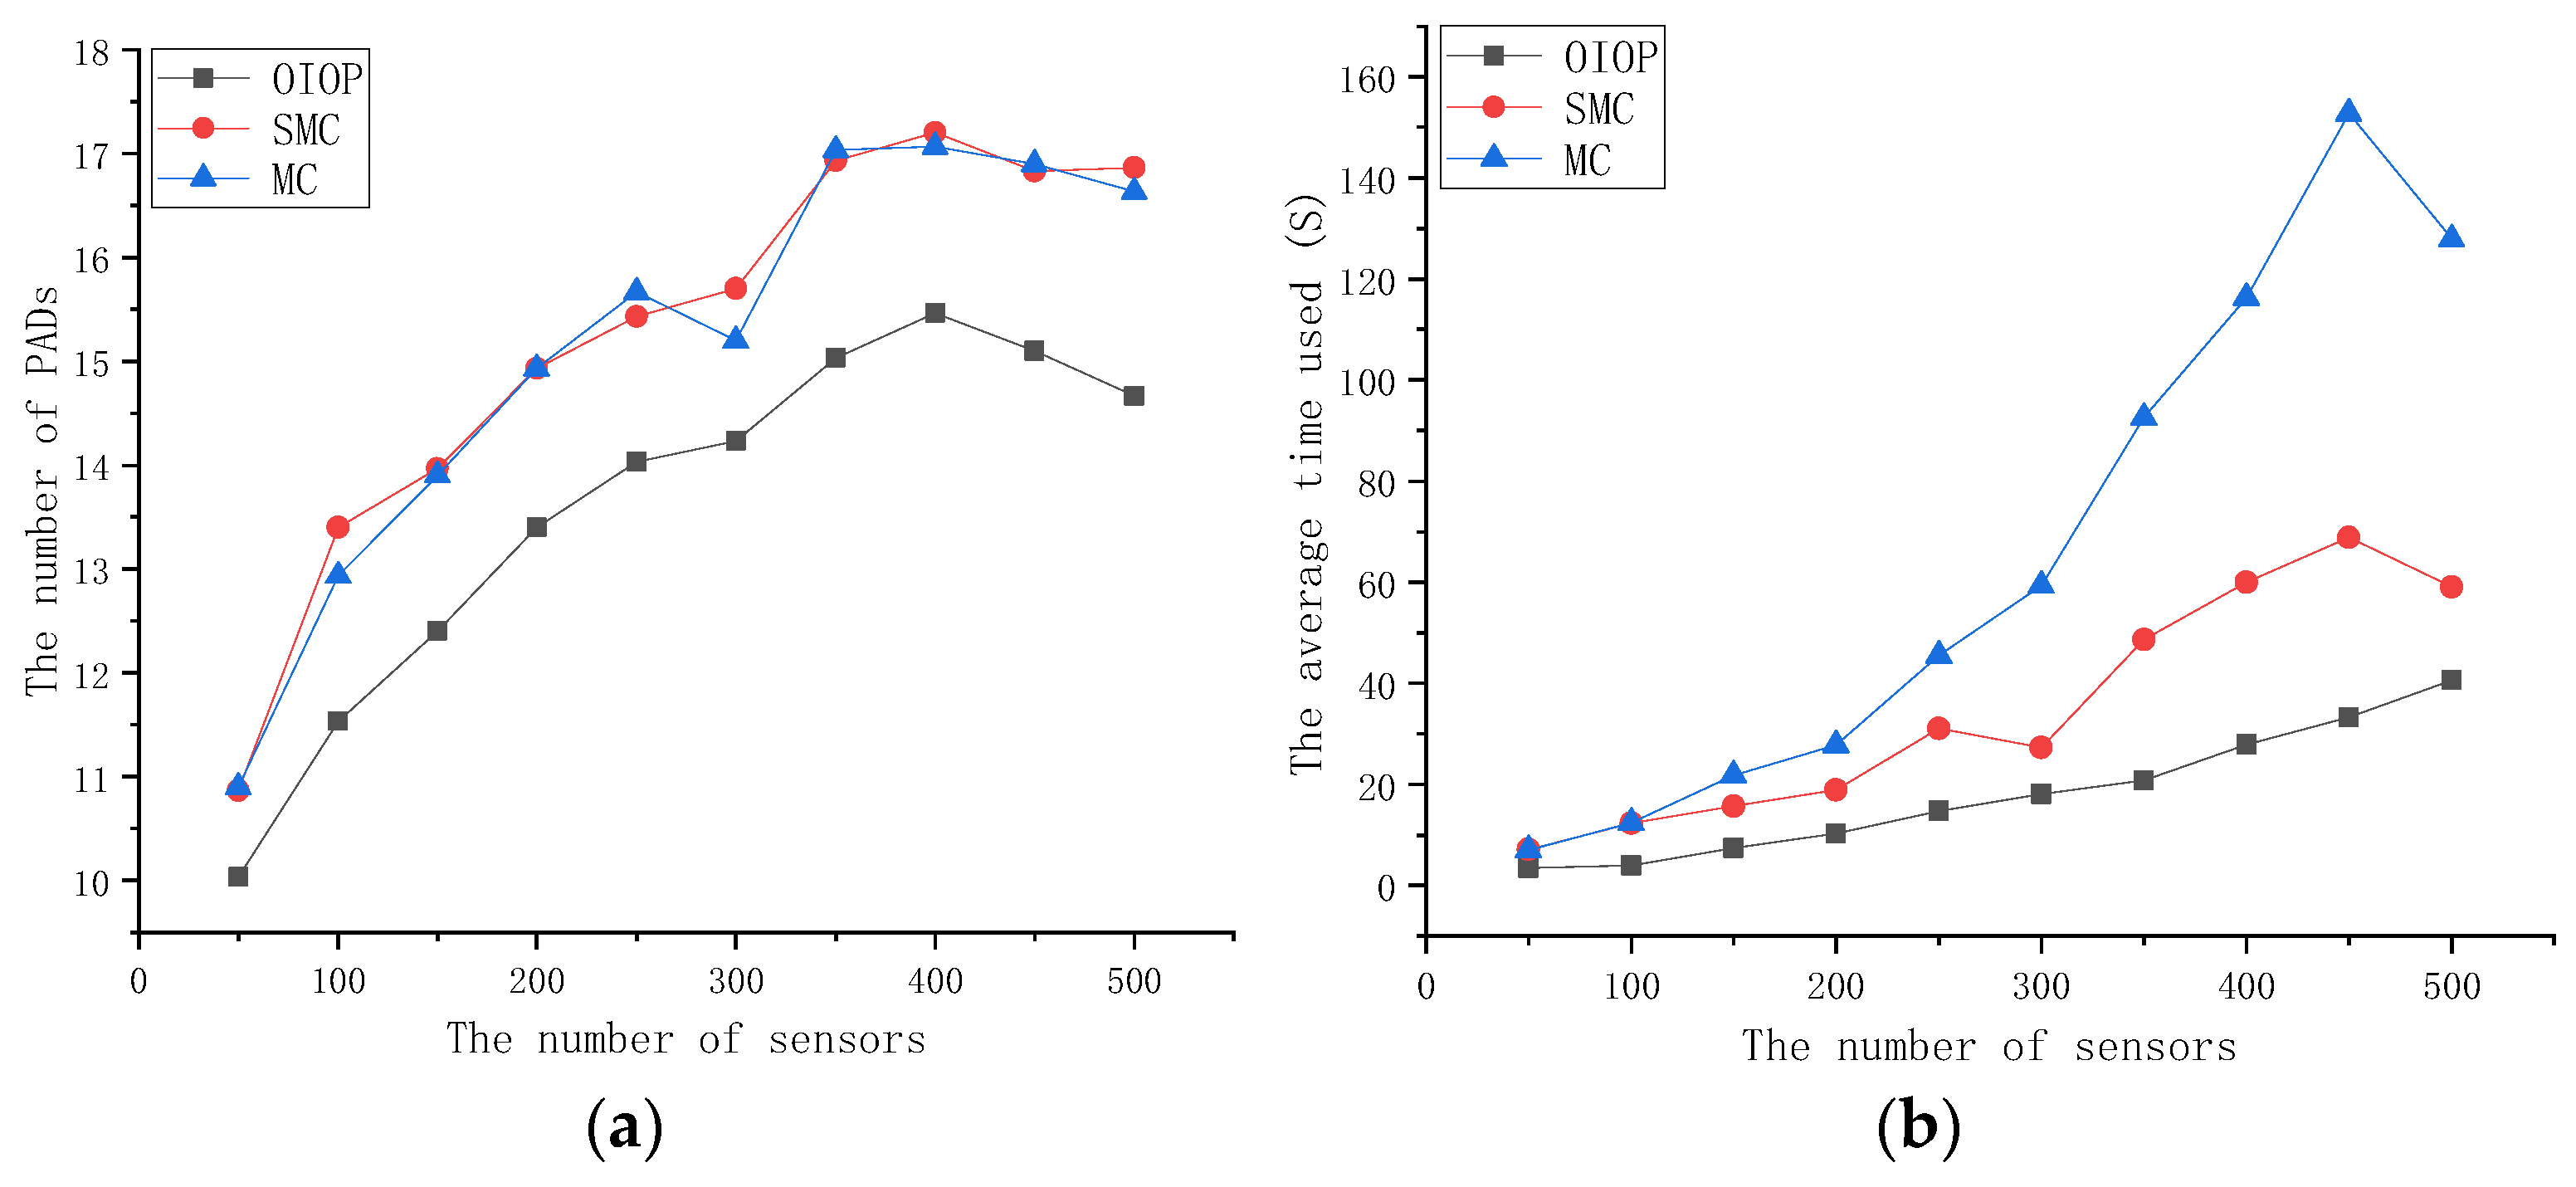
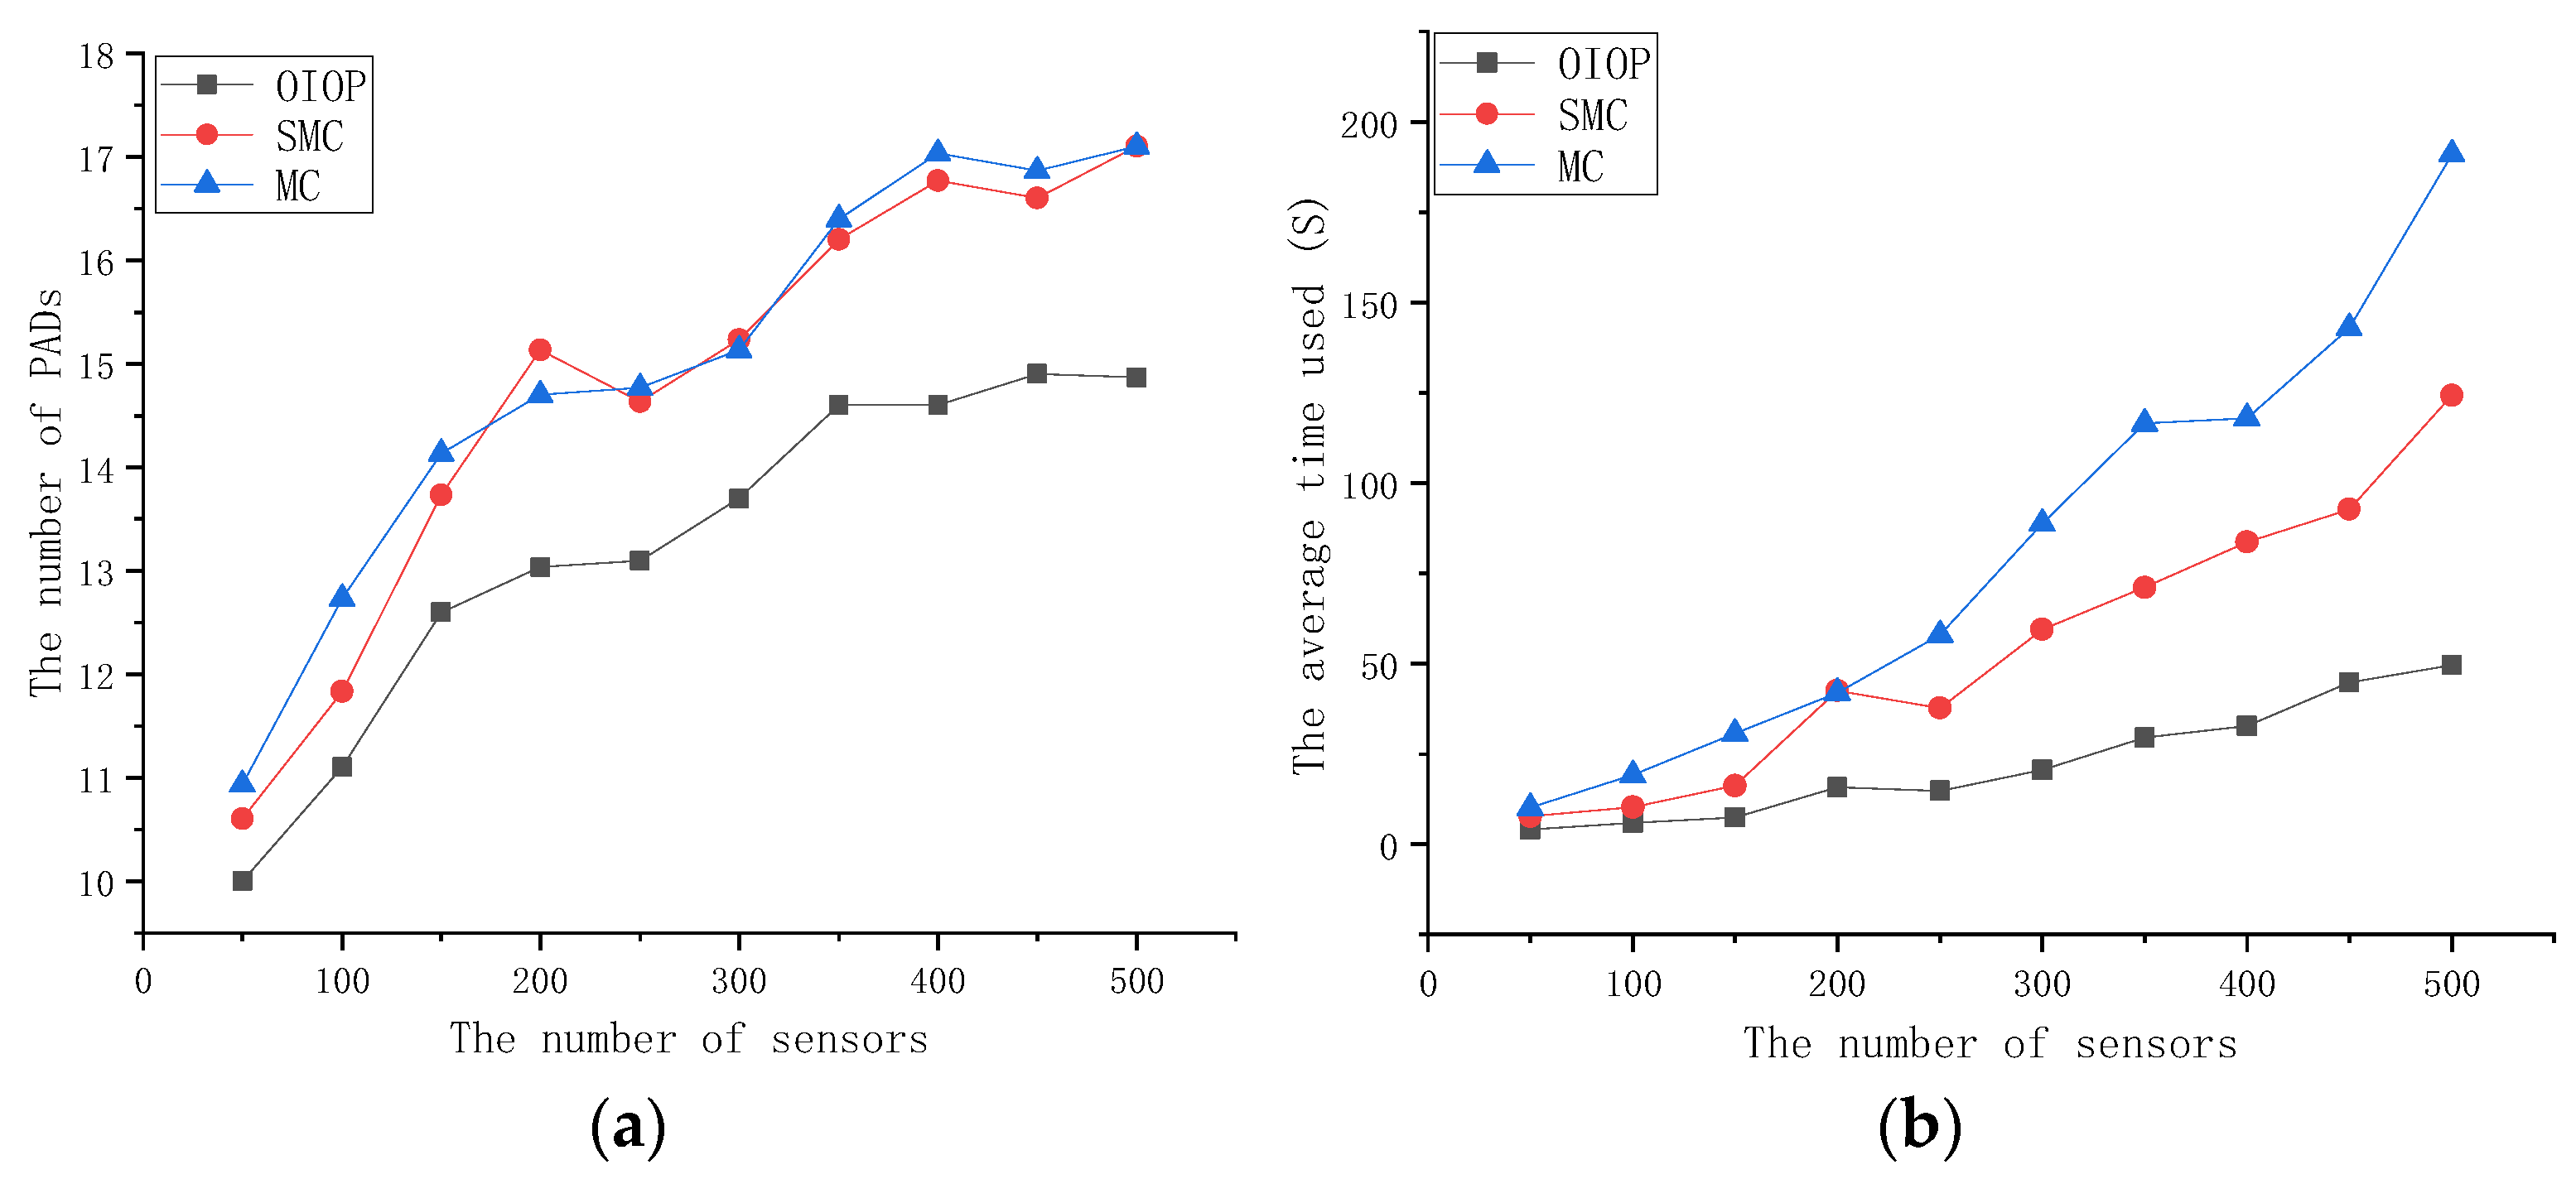
As shown in Figure 3, Figure 4, Figure 5, Figure 6 and Figure 7, the simulation data presents a comparative analysis of three pad deployment methods—OIOP, SMC, and MC—evaluated based on two key performance metrics: the number of pads used and execution time. These metrics are assessed across varying numbers of sensors (ranging from 50 to 500) and under two environmental conditions defined by the presence or absence of obstacles (obstacles). Overall, the OIOP method consistently demonstrates superior performance in both resource efficiency and computational speed.
In terms of pad usage, without obstacles, the OIOP method uses fewer pads on average compared to both SMC and MC across all sensor configurations. Specifically, the average pad count for OIOP is approximately 14.48 ± 1.94, while SMC and MC average around 16.23 ± 2.12 and 16.52 ± 2.38, respectively. This translates to an approximate 10.83% ± 1.30% reduction compared to SMC and a 12.16% ± 1.59% reduction compared to MC. Execution time results further reinforce the efficiency of the OIOP method. On average, it executes in about 1.29 ± 0.82 s, whereas SMC and MC require approximately 3.02 ± 1.88 and 4.81 ± 3.11 s, respectively. This corresponds to a 58.02% ± 2.44% faster execution time over SMC and a 72.09% ± 2.88% improvement over MC.
The introduction of obstacles significantly impacts the performance of all methods, primarily increasing execution time and slightly decreasing pad usage. On average, the presence of nine obstacles causes the execution time to rise by 21.17 ± 14.46 s for OIOP, 51.53 ± 34.91 s for SMC, and 76.89 ± 53.55 s for MC. In terms of pad usage, the average reduction is approximately 1.23 ± 0.48 for OIOP, 1.45 ± 0.46 for SMC, and 1.54 ± 0.55 for MC. While all methods experience increased computational cost due to environmental complexity, OIOP exhibits the smallest increase in execution time, indicating greater robustness and stability under obstacle constraints.
In summary, the OIOP method outperforms both SMC and MC in minimizing pad usage and accelerating execution, particularly in less complex environments with fewer sensors. Its performance degradation under increased environmental complexity is also relatively mild, making it a more reliable and efficient choice for path planning tasks that involve dynamic or constrained spatial conditions.

4.2. Performance Impact of Main Mechanisms of the Proposed Strategy

As described in Section 3.2, this work introduces two key mechanisms: LimitB (restricted search area) and NoObsFirst (phased handling of obstacles) used in the proposed strategy.
The LimitB approach improves computational efficiency during local search by first filtering out sensors that cannot possibly be covered (Algorithm 4). It uses the bounding box of the candidate sensor coverage to exclude irrelevant obstacles from further consideration, thereby reducing unnecessary computations.
The NoObsFirst approach adopts a phased strategy: in the initial pad deployment phase, obstacles are ignored; only in the optimization phase are they considered. The NoObsFirst approach simplifies the initial pad deployment by ignoring obstacles, resulting in faster computation with a minimal increase in the number of pads required.
Figure 8 compares four configurations on an 8192 × 8192 map containing 9 randomly placed obstacles and 50~500 sensors distributed in accessible areas:
(1)
No: the baseline Onion-like pad deployment method without any acceleration techniques,
(2)
LimitB: with LimitB acceleration only,
(3)
NoObsFirst: with the phased obstacle handling only,
(4)
All: combining both LimitB and NoObsFirst.
As shown in Figure 8a, the number of pads used under No and LimitB are identical, as are those under All and NoObsFirst, indicating that LimitB does not affect the final solution quality—it merely filters out unnecessary computations. In contrast, Figure 8b demonstrates that applying LimitB significantly reduces execution time. As the map complexity increases (i.e., with more sensors), the performance gain becomes more pronounced due to the increased number of sensors excluded from local search.
For example, with 50 sensors, using LimitB alone reduces execution time by 43.35 s (from 50.62 s to 7.27 s); with 500 sensors, the reduction reaches 673.9 s (from 836.63 s to 162.73 s). When combined with NoObsFirst, the execution time is further reduced—by 8.46 s (from 12.47 s to 4.01 s) with 50 sensors and by 231.28 s (from 280.80 s to 49.52 s) with 500 sensors.
On the other hand, the NoObsFirst approach simplifies the initial pad deployment by ignoring obstacles, resulting in faster computation. In terms of pad count, this phased strategy leads to a minimal increase in the number of pads required. For instance, with 350 sensors, it requires at most 0.43 additional pads (14.6 vs. 14.17), while saving 386.93 s (from 532.82 s to 145.89 s) in execution time. With 500 sensors, the increase is negligible (14.83 vs. 14.87 pads), yet the time saved reaches 555.83 s (from 836.63 s to 280.80 s).
Furthermore, when LimitB is applied together with NoObsFirst, the execution time can be further reduced by up to 113.21 s (from 162.73 s to 49.52 s) in the 500-sensor scenario.
Therefore, all subsequent simulations incorporate both LimitB and the NoObsFirst strategy to achieve optimal performance in terms of both efficiency and solution quality.

4.3. Effect of the Number of Obstacles on Algorithm Performance

This section presents simulation results evaluating the performance of the OLMC algorithm under varying environmental conditions. The simulations were conducted using maps of different sizes with varying numbers of obstacles and sensors. Two key performance metrics were analyzed: (1) execution time and (2) PAD usage.
Figure 9, Figure 10, Figure 11 and Figure 12 show simulation results obtained for four different map sizes: 4096 × 4096, 6144 × 6144, 8192 × 8192, and 16,384 × 16,384. These results reveal the following observations:
(1)
PAD Usage Is Stable Across Sensor Counts:
As the number of sensors increases, there is no clear linear increase in PAD usage. Instead, PAD usage remains relatively stable within certain ranges:
  • On the 4096 × 4096 map, increasing the number of sensors from 50 to 500 resulted in PAD usage remaining between 5 and 6.
  • On the 16,384 × 16,384 map, increasing the number of sensors from 50 to 500 resulted in PAD usage staying between 24 and 45.
This implies that PAD usage is primarily influenced by the scale of the deployed area rather than the number of sensors.
(2)
Obstacles Slightly Decrease PAD Usage:
Increasing the number of obstacles results in a slight decrease in PAD usage. For example: On the 4096 × 4096 map with 500 sensors: With 1 obstacle, PAD usage was approximately 6.03. With 9 obstacles, PAD usage decreased to 6. On the 16,384 × 16,384 map with 500 sensors: With 1 obstacle, PAD usage was approximately 44.9. With 9 obstacles, PAD usage decreased to 39.6.
This may be because obstacles restrict the available space for pad deployment, leading the algorithm to use PADs more compactly.
(3)
Map Size Significantly Affects Execution Time:
As shown in Figure 9b, for a smaller map size of 4096 × 4096, the execution time ranged from 0.29 to 41.55 s depending on the number of sensors and obstacles. In contrast, for the much larger 16,384 × 16,384 map, the execution time increased significantly, ranging from 2.71 to 159.51 s.
(4)
Number of Sensors Positively Correlates with Execution Time:
For example, as shown in Figure 9b, in the 4096 × 4096 map with 50 sensors, the execution time ranged from 0.29 to 4.44 s. However, when the number of sensors increased to 500, the execution time rose to between 3.88 and 41.55 s. Similarly, in the 16,384 × 16,384 map with 50 sensors, the execution time ranged from 2.70565 to 70.53 s, increasing further to between 6.06 and 150.45 s with 500 sensors. This confirms that the number of sensors has a significant impact on computational cost. It also indicates that computational complexity increases rapidly with larger map dimensions, especially when the number of sensors is high.
(5)
Obstacle Count Increases Execution Time:
An increase in the number of obstacles generally leads to longer execution times. For instance, in the 4096 × 4096 map with 500 sensors: With 1 obstacle, the execution time was 3.88 s. With 9 obstacles, the execution time increased to 41.55 s.
Similarly, for the 16,384 × 16,384 map with 500 sensors and with 1 obstacle, the execution time was 6.06 s. With 9 obstacles, the execution time increased to 150.45 s.
This suggests that higher obstacle density significantly increases the complexity of pad deployment, particularly in large-scale environments with a high number of sensors.

5. Conclusions

This study has presented a novel framework for the efficient deployment and optimization of wireless charging pads in WRSNs, with a specific focus on environments containing obstacles. The proposed OIOP strategy addresses the critical challenges of ensuring full sensor coverage, maintaining a connected charging infrastructure, and strictly adhering to obstacle constraints. The core contribution lies in the two-stage optimization process. The first stage employs an “onion-peeling” strategy to deploy an initial set of pads, prioritizing the coverage of the most remote sensors to minimize the total number of pads required. The second stage, ReLitePad, systematically refines this initial deployment by identifying and removing redundant pad groups.
A key strength of the proposed method is its explicit integration of obstacle-avoidance into the distance and connectivity calculations. By utilizing a visibility graph-based approach, the algorithm accurately computes the shortest feasible flight paths for the drone, ensuring that all operational constraints are met in complex, real-world environments. The complexity analysis demonstrates that while the worst-case theoretical bound is high, practical optimizations such as clipObs and LimitB significantly reduce the computational overhead, making the solution scalable for large-scale networks.
Simulation results validate the effectiveness of the approach. The algorithm consistently produces WCP configurations that use fewer pads compared to baseline methods, while guaranteeing full sensor coverage and a connected network. The simulations also highlight the significant impact of obstacle density on computational time, underscoring the importance of the proposed optimizations.
Future work will focus on extending the model to dynamic environments with mobile sensors and integrating real-time drone scheduling with the pad deployment strategy and validating the approach through Hardware-in-the-Loop (HIL) simulations or small-scale field experiments. Moreover, deploying advanced wireless charging pads represents a substantial challenge. Deploying high-power and high-cost wireless charging pads also makes the optimization problem more complicated. In the future, we also may consider deploying vehicle mounted with a wireless charging pad to support real-time wireless charging services for wireless charging drones.

Author Contributions

Conceptualization, R.-H.C., Y.-Y.H. and C.W.Y.; methodology, Y.-Y.H. and C.W.Y.; software, R.-H.C.; validation, R.-H.C. and C.W.Y.; writing—original draft preparation, C.W.Y. and R.-H.C.; writing—review and editing, C.W.Y. All authors have read and agreed to the published version of the manuscript.

Funding

This research received no external funding.

Institutional Review Board Statement

Not applicable.

Informed Consent Statement

Not applicable.

Data Availability Statement

The original contributions presented in this study are included in the article. Further inquiries can be directed to the corresponding author.

Acknowledgments

The authors would like to thank Chung Hua University for supporting this research.

Conflicts of Interest

The authors declare no conflicts of interest.

Abbreviations

The following abbreviations are used in this manuscript:
BSBase Station
CDC&DSCClustering-with-Double-Constraints and Disks-Shift-Combining
DijkstraDijkstra’s Shortest Path Algorithm
HILHardware-in-the-Loop
IoTInternet of Things
MCMax Covering (baseline algorithm)
MSCMax Sensor Coverage (baseline algorithm)
OIOPOutside-to-Inside Onion-Peeling
OLMCOnion-peeling Like Max Covering
ReLitePadRedundant-pad Removal and Lightweight Re-deployment
SMCSink-outward Max Covering (baseline algorithm)
SNSensor Node
UAVUnmanned Aerial Vehicle
WCDWireless Charging Drone
WCVWireless Charger Vehicle
WPTWireless Power Transfer
WRSNWireless Rechargeable Sensor Network
WSNWireless Sensor Network

References

  1. Akyildiz, I.F.; Su, W.; Sankarasubramaniam, Y.; Cayirci, E. A Survey on Sensor Networks. IEEE Commun. Mag. 2002, 40, 102–114. [Google Scholar] [CrossRef]
  2. Zhao, M.; Li, J.; Yang, Y. A framework of joint mobile energy replenishment and data gathering in wireless rechargeable sensor networks. IEEE Trans. Mob. Comput. 2014, 13, 2689–2705. [Google Scholar] [CrossRef]
  3. Lin, C.; Zhou, J.; Guo, C.; Song, H.; Wu, G.; Obaidat, M.S. TSCA: A Temporal-Spatial Real-Time Charging Scheduling Algorithm for On-Demand Architecture in Wireless Rechargeable Sensor Networks. IEEE Trans. Mob. Comput. 2017, 17, 211–224. [Google Scholar] [CrossRef]
  4. Rong, C.; Duan, X.; Chen, M.; Wang, Q.; Yan, L.; Wang, H.; Xia, C.; He, X.; Zeng, Y.; Liao, Z. Critical Review of Recent Development of Wireless Power Transfer Technology for Unmanned Aerial Vehicles. IEEE Access 2023, 11, 132982–133003. [Google Scholar] [CrossRef]
  5. Chen, J.; Yu, C.W.; Ouyang, W. Efficient Wireless Charging Pad Deployment in Wireless Rechargeable Sensor Networks. IEEE Access 2020, 8, 39056–39077. [Google Scholar] [CrossRef]
  6. Baek, J.; Han, S.I.; Han, Y. Optimal UAV Route in Wireless Charging Sensor Networks. IEEE Internet Things J. 2020, 7, 1327–1335. [Google Scholar] [CrossRef]
  7. Cheng, R.-H.; Yu, C.W.; Zhang, Z.-L. Optimizing Charging Pad Deployment by Applying a Quad-Tree Scheme. Algorithms 2024, 17, 264. [Google Scholar] [CrossRef]
  8. Zorbas, D.; Douligeris, C. Computing drone positions to wirelessly recharge IoT devices. In Proceedings of the IEEE INFOCOM Workshops: Wireless Sensor, Robot and UAV Networks, Honolulu, HI, USA, 16 April 2018; pp. 628–633. [Google Scholar]
  9. Lin, T.-L.; Chang, H.-Y.; Wang, Y.-H. A Novel Unmanned Aerial Vehicle Charging Scheme for Wireless Rechargeable Sensor Networks in an Urban Bus System. Electronics 2022, 11, 1464. [Google Scholar] [CrossRef]
  10. Chen, Y.; Gu, Y.; Li, P.; Lin, F. Minimizing the Number of Wireless Charging PAD for UAV-Based Wireless Rechargeable Sensor Networks. Int. J. Distrib. Sens. Netw. 2021, 17, 15501477211055958. [Google Scholar] [CrossRef]
  11. Cheng, R.-H.; Yu, C.-W. Efficient Charging Pad Deployment in Large-Scale WRSNs: A Sink-Outward Strategy. Electronics 2025, 14, 2159. [Google Scholar] [CrossRef]
  12. Shu, Y.; Yousefi, H.; Cheng, P.; Chen, J.; Gu, Y.; He, T.; Shin, K.G. Near-optimal velocity control for mobile charging in wireless rechargeable sensor networks. IEEE Trans. Mob. Comput. 2015, 15, 1699–1713. [Google Scholar] [CrossRef]
  13. Fu, L.; He, L.; Cheng, P.; Gu, Y.; Pan, J.; Chen, J. ESync: Energy Synchronized Mobile Charging in Rechargeable Wireless Sensor Networks. IEEE Trans. Veh. Technol. 2015, 65, 7415–7431. [Google Scholar] [CrossRef]
  14. Wang, C.; Li, J.; Yang, Y. Low-latency mobile data collection for wireless rechargeable sensor networks. In Proceedings of the IEEE International Conference on Communications (IEEE ICC), London, UK, 8–12 June 2015; pp. 6524–6529. [Google Scholar]
  15. Xie, L.; Shi, Y.; Hou, Y.T.; Lou, A. Wireless poser transfer and applications to sensor networks. IEEE Wirel. Commun. 2013, 20, 140–145. [Google Scholar]
  16. Xie, L.; Shi, Y.; Hou, Y.T.; Lou, W.; Sherali, H.D. On traveling path and related problems for a mobile station in a rechargeable sensor network. In Proceedings of the 14th ACM International Symposium on Mobile Ad Hoc Networking and Computing (Mobihoc), Bangalore, India, 29 July–1 August 2013; pp. 109–118. [Google Scholar]
  17. Guo, P.; Liu, X.; Tang, S.; Cao, J. Concurrently wireless charging sensor networks with efficient scheduling. IEEE Trans. Mob. Comput. 2017, 16, 2450–2463. [Google Scholar] [CrossRef]
  18. Wibotic. PowerPad. Available online: https://www.wibotic.com/products/powerpad/ (accessed on 1 March 2025).
  19. Skysense. Charging Pad Outdoor Specs. Available online: https://www.skycharge.de/drone-charging-pad (accessed on 1 March 2025).
  20. Getcorp. In-Flight Wireless Charging Outdoor Demonstration. Available online: http://getcorp.com/in-flight-wireless-charging-outdoor-demonstration/ (accessed on 1 March 2025).
  21. Long, T.; Ozger, M.; Cetinkaya, O.; Akan, O.B. Energy Neutral Internet of Drones. IEEE Commun. Mag. 2018, 56, 22–28. [Google Scholar] [CrossRef]
  22. Dijkstra, E.W. A note on two problems in connexion with graphs. Numer. Math. 1959, 1, 269–271. [Google Scholar] [CrossRef]
  23. Andrew, A.M. Another efficient algorithm for convex hulls in two dimensions. Inf. Process. Lett. 1979, 9, 216–219. [Google Scholar] [CrossRef]
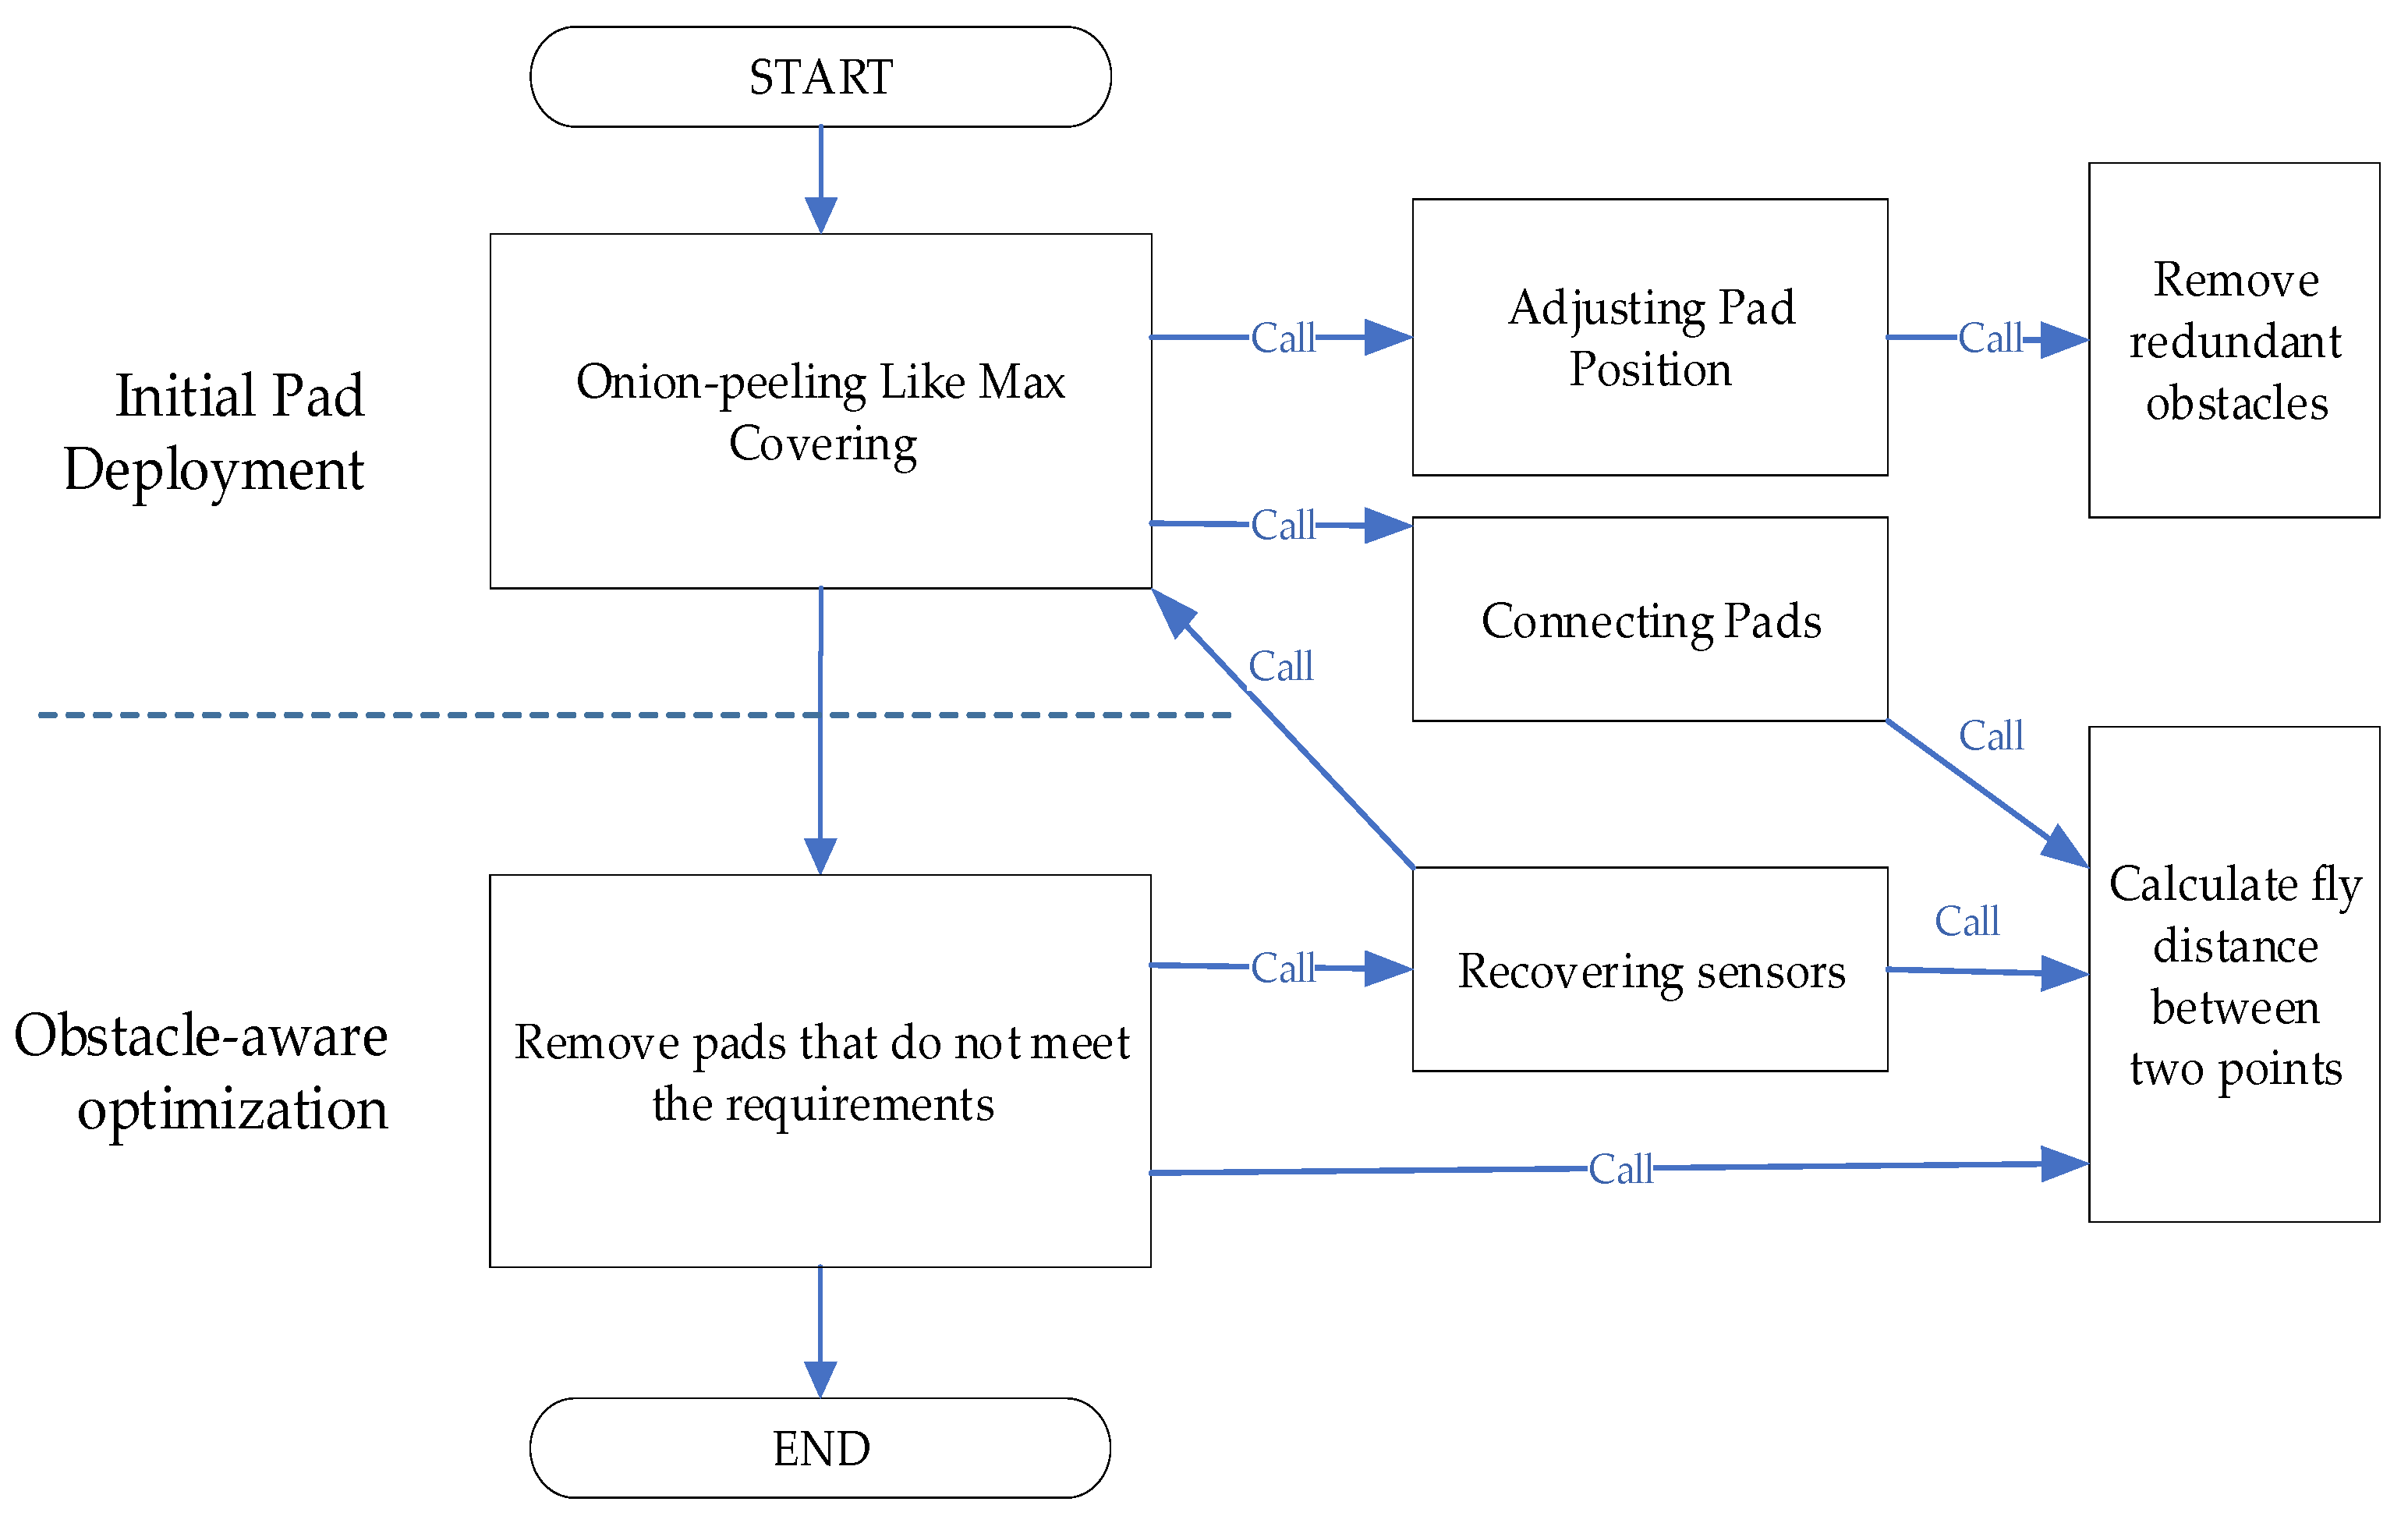
Figure 1. Workflow diagram of the Outside-to-Inside Onion-Peeling (OIOP) charging pad deployment strategy.
Information 16 00835 g001
Figure 2. Conceptual diagram of LimitB and restricted obstacles.
Information 16 00835 g002
Figure 3. Comparison of the impact of different configuration sequences on algorithm performance in terms of (a) the number of pads and (b) the average time used on large-scale maps without obstacles.
Information 16 00835 g003
Figure 4. Comparison of the impact of different configuration sequences on algorithm performance in terms of (a) the number of pads and (b) the average time used on large-scale maps with 3 obstacles.
Information 16 00835 g004
Figure 5. Comparison of the impact of different configuration sequences on algorithm performance in terms of (a) the number of pads and (b) the average time used on large-scale maps with 5 obstacles.
Information 16 00835 g005
Figure 6. Comparison of the impact of different configuration sequences on algorithm performance in terms of (a) the number of pads and (b) the average time used on large-scale maps with 7 obstacles.
Information 16 00835 g006
Figure 7. Comparison of the impact of different configuration sequences on algorithm performance in terms of (a) the number of pads and (b) the average time used on large-scale maps with 9 obstacles.
Information 16 00835 g007
Figure 8. Impact of the proposed strategy’s components on (a) the number of pads and (b) the average time used on large-scale maps with 9 obstacles.
Information 16 00835 g008
Figure 9. Impact of varying the number of obstacles on (a) the number of pads and (b) the average time used for small-scale map.
Information 16 00835 g009
Figure 10. Impact of varying the number of obstacles on (a) the number of pads and (b) the average time used for medium-scale map.
Information 16 00835 g010
Figure 11. Impact of varying the number of obstacles on (a) the number of pads and (b) the average time used for large-scale map.
Information 16 00835 g011
Figure 12. Impact of varying the number of obstacles on (a) the number of pads and (b) the average time used for extreme large-scale map.
Information 16 00835 g012
Table 1. Parameters and values.
ParametersValues
Esensor200 Joules
Edrone1000 Joules
Pflight10 Joules/s
Vflight35 m/s
Disclaimer/Publisher’s Note: The statements, opinions and data contained in all publications are solely those of the individual author(s) and contributor(s) and not of MDPI and/or the editor(s). MDPI and/or the editor(s) disclaim responsibility for any injury to people or property resulting from any ideas, methods, instructions or products referred to in the content.