Article

Enhancing Flight Delay Predictions Using Network Centrality Measures

Department of Computer Science, Georgia Southern University, Statesboro, GA 30458, USA
*
Author to whom correspondence should be addressed.
Information 2024, 15(9), 559; https://doi.org/10.3390/info15090559
Submission received: 31 July 2024 / Revised: 6 September 2024 / Accepted: 9 September 2024 / Published: 10 September 2024
(This article belongs to the Special Issue Best IDEAS: International Database Engineered Applications Symposium)

Abstract

:
Accurately predicting flight delays remains a significant challenge in the aviation industry due to the complexity and interconnectivity of its operations. The traditional prediction methods often rely on meteorological conditions, such as temperature, humidity, and dew point, as well as flight-specific data like departure and arrival times. However, these predictors frequently fail to capture the nuanced dynamics that lead to delays. This paper introduces network centrality measures as novel predictors to enhance the binary classification of flight arrival delays. Additionally, it emphasizes the use of tree-based ensemble models, specifically random forest, gradient boosting, and CatBoost, which are recognized for their superior ability to model complex relationships compared to single classifiers. Empirical testing shows that incorporating centrality measures improves the models’ average performance, with random forest being the most effective, achieving an accuracy rate of 86.2%, surpassing the baseline by 1.7%.

Graphical Abstract

1. Introduction

In the realm of aviation, the efficiency of flight operations significantly hinges on the ability to anticipate and mitigate delays. As the Federal Aviation Administration (FAA) reports, its Air Traffic Organization (ATO) orchestrates the movement of over 45,000 flights daily, servicing 2.9 million passengers across an expansive airspace exceeding 29 million square miles [1]. This volume is projected to swell by 4.9% annually over the next two decades, underscoring a pressing need for robust predictive models that can adeptly forecast flight delays, thereby enabling airlines to optimize scheduling and resource allocation [2]. Despite the proliferation of predictive methodologies ranging from traditional statistical techniques to advanced machine learning algorithms like decision trees (DTs), random forests (RFs), Bayesian networks (BNs), and linear regression (LR), the quest for high-accuracy predictions remains largely unfulfilled. This challenge is compounded by the unpredictable nature of many delay-inducing factors, such as adverse weather conditions, and the computational demands posed by the voluminous and growing datasets of airline operations [3].
In recent years, deep learning methods have shown promise in various prediction tasks due to their ability to model complex non-linear relationships in large datasets [4,5,6]. However, these models often require extensive computational resources and large amounts of data for training, which can limit their applicability in certain scenarios. In contrast, the traditional machine learning techniques, such as support vector machine (SVM), DT, RF, and gradient boosting (GB), offer robust performance while being less resource-intensive and more interpretable [7,8,9]. Given these advantages, this paper introduces a novel approach to predict whether a flight will be delayed or not, leveraging network centrality measures within a binary classification framework.
By constructing a network model wherein airports serve as nodes and flight routes as edges, this study integrates centrality metrics to enhance the predictive capabilities of tree-based ensemble models. These models are renowned for their efficacy in capturing complex non-linear relationships that elude the traditional base classifiers. This integration aims to shed light on how the structural properties of the airport network can influence delay propagation and, by extension, the overall network performance.
The motivation for this research is twofold: Firstly, flight delays are a pervasive issue that undermines operational efficiency and diminishes passenger satisfaction, with a notable 20% of flights in 2023 experiencing delays across the United States alone [10]. Secondly, the existing predictive models often fall short of the accuracy needed for effective planning and resource management, partly due to their reliance on a limited set of predictors that may not fully encapsulate the intricacies of the aviation system [3]. By incorporating network centrality measures into the predictive models, this study aspires to bridge this gap, offering a more comprehensive and nuanced understanding of the factors that contribute to flight delays.
The primary research question addressed in this study is whether the inclusion of network centrality measures can improve the accuracy of flight delay predictions. The innovation of this study lies in the novel integration of network centrality measures into machine learning models for flight delay prediction, which, to the best of our knowledge, has not been explored in the literature. This approach provides new insights and improves the predictive accuracy beyond the traditional methods. Specifically, the study examines how these centrality measures affect the performance of traditional machine learning models, including RF, GB, and CatBoost (CB). It also explores which network centrality measures, such as degree, betweenness, and closeness centrality, contribute most significantly to enhancing the predictive accuracy of these models.
The rest of the paper is organized as follows: It begins with a literature review of the current landscape of flight delay prediction methodologies. The subsequent sections describe the methodology employed in constructing the network model and integrating centrality measures into the ensemble predictive models. The Results section presents a comparative analysis of the model performances, highlighting the enhanced accuracy achieved through the inclusion of centrality measures. Finally, the conclusion reflects on the implications of these findings for airline operations and potential future research directions.

2. Literature Review

Flight delay prediction has been extensively studied due to its critical implications for airline operations and passenger satisfaction. The early approaches primarily relied on traditional statistical models such as linear regression and time series analysis. For instance, Hsiao and Hansen [11] utilized econometric models to assess the impact of morning queuing delays, while Zou et al. [12] explored the relationship between flight delays, capacity investment, and social welfare, underscoring the importance of strategic investments.
The advent of machine learning (ML) technologies introduced more sophisticated methods for delay prediction, capturing complex non-linear relationships in data. Re-bollo and Balakrishnan [13] applied RF algorithms to integrate temporal and spatial delay states, improving the prediction accuracy. Kim et al. [4] leveraged convolutional neural networks (CNNs) with historical flight and weather data, achieving higher accuracy. Choi et al. [8] emphasized the importance of weather data in improving predictions through various ML algorithms, while Nigam et al. [14] showcased the efficiency of cloud-based logistic regression in real-time delay prediction.
Later work has further integrated deep learning models with traditional ML techniques. Yin et al. [15] utilized reinforcement learning for predicting taxi-out times, optimizing airport operations. Pamplona, et al. [16] introduced a supervised neural network incorporating multiple factors, and Yu et al. [5] combined deep belief networks with support vector regression, demonstrating effective delay prediction at Beijing International Airport. Gui et al. [17] and Liu et al. [18] also explored big data analytics, using DT, RF, and GB for large-scale delay prediction.
Network centrality measures have increasingly been recognized for their potential in delay prediction. However, the prior studies primarily utilized these measures for structural analysis rather than as direct input features for prediction models. Cai et al. [6] and Wu et al. [19] applied deep learning models to time-evolving graphs and spatiotemporal data, respectively, focusing on network dynamics without directly integrating centrality measures as predictive features. Li et al. [20] advanced this area by combining CNNs and LSTM networks to capture spatial and temporal dependencies, although they did not use centrality metrics as input variables.
Comparative and cluster-based methodologies have also been explored. Güvercin, Ferhatosmanoglu, and Gedik [21] proposed the Clustered Airport Modeling (CAM) approach using network features and REG-ARIMA models to predict delays. Paramita et al. [22] demonstrated the effectiveness of RF algorithms in a cluster computing environment, while Wei et al. [23] introduced a BiLSTM-Attention network to predict delays across airport clusters.
Finally, studies on the structural properties of air transportation networks have offered key insights into delay prediction. Cheung and Gunes [24] used complex network metrics to reveal small-world characteristics and assess the network’s resiliency to disruptions. Anderson and Revesz [25] developed algorithms for MaxCount and threshold operators on moving objects, applicable in monitoring airplane congestion, a factor in delay prediction.
While significant advancements have been made in flight delay prediction, a notable gap remains in the use of network centrality measures as direct input features in predictive models. Previous studies have largely focused on structural analysis without fully leveraging these measures to improve prediction accuracy. This study addresses that gap by directly integrating network centrality measures into machine learning models, offering a novel approach that enhances the accuracy of flight delay predictions.

3. Preliminaries

3.1. Network Centrality Measures

Network centrality measures are crucial for identifying the most influential nodes within a network, such as airports in an air transportation network. In this study, we focus on three key centrality measures: degree centrality, betweenness centrality, and closeness centrality. Given a network of N nodes, representing airports in this study, the definitions of the three centrality measures are as follows.
Degree Centrality: This centrality measure quantifies the number of direct connections a node has [26]. It is calculated as
C d v = d e g ( v ) N 1 ,
where d e g ( v ) is the degree of node v , that is, the total number of nodes directedly connected to v . High degree centrality indicates that an airport is a major hub with numerous direct flights, making it a critical point for delay propagation.
Betweenness Centrality: This metric reflects the number of times a node acts as a bridge along the shortest path between two other nodes [26]. It is calculated as
C b v = s v t σ s t ( v ) σ s t ,
where σ s t represents the total number of shortest paths from node s to node t , and σ s t ( v ) is the number of those paths that pass through node v . Airports with high betweenness centrality are crucial in the flow of air traffic and are more likely to influence delays across the network.
Closeness Centrality: This is a measure of the average shortest distance between a node and all other reachable nodes, indicating how close a node is to all other nodes in the network [26,27]. It is calculated as
C c v = r v N 1 r v t d ( v ,   t ) ,
where r v is the total number of nodes v can reach, and d ( v ,   t ) is the shortest distance between nodes v and t . Airports with high closeness centrality can quickly disseminate delays throughout the network, affecting overall network performance.

3.2. Machine Learning Models

The machine learning methods employed in this study include RF, GB, and CB. These models were selected for their ability to handle complex non-linear relationships and large datasets typical of air transportation networks.
Random Forest (RF): This ensemble learning method constructs multiple decision trees during training and combines their outputs, either by taking the mode for classification tasks or the mean for regression tasks [28]. By using multiple trees, RF effectively reduces overfitting and enhances the model’s generalization, making it robust for various predictive tasks.
Gradient Boosting (GB): An iterative ensemble technique that builds models sequentially, where each new model corrects errors made by the previous ones [29,30]. GB is particularly effective in handling high-dimensional data and capturing complex interactions between features, making it a powerful tool for improving predictive accuracy.
CatBoost (CB): A high-performing variant of GB, which is specifically designed to handle categorical data with minimal preprocessing [31]. It addresses overfitting through ordered boosting, which prevents information leakage by using a permutation of the training data, making it particularly effective for datasets with categorical features.

4. Data and Methodology

4.1. Data Collection and Preparation

The data used in this research were obtained from the US Bureau of Transportation Statistics (BTS) TranStats database [32], which is publicly available. The dataset we used in this study is from the database named “Airline On-Time Performance Data”, which contains detailed records of on-time arrivals and departures for non-stop domestic flights. For this study, the initial dataset included 7,107,203 flights connecting 370 airports from July 2022 to June 2023.
Data preprocessing involved handling missing data by excluding records with null or missing values to maintain dataset integrity. The final dataset comprised 6,955,805 flights. Key features selected for the analysis included flight information such as ORIGIN_AIRPORT_ID, DEST_AIRPORT_ID, DEP_TIME, and ARR_TIME and delay information like DEP_DELAY and ARR_DELAY, along with DISTANCE as an operational factor. Among all the features, ORIGIN_AIRPORT_ID and DEST_AIRPORT_ID were converted to categorical features for model training. Table 1 displays the key attributes of the dataset after data preprocessing.

4.2. Methodology

This study focuses on integrating network centrality measures into machine learning models to improve the accuracy of flight delay predictions. The methodology encompasses constructing the airport network, calculating centrality measures, and applying machine learning models for prediction.

4.2.1. Airport Network Construction and Centrality Integration

A directed graph representing the airport network was constructed to compute the network centrality measures. Airports were represented as vertices, with flights between them forming the edges, and edge weights were determined by the distances between airports. This graph enabled the calculation of degree centrality, betweenness centrality, and closeness centrality, as defined by Equations (1)–(3).
Figure 1 presents the top 20 airports ranked by their degree, betweenness, and closeness centrality scores, highlighting their structural importance within the US air transportation network. DFW (Dallas/Fort Worth), DEN (Denver), and ATL (Atlanta) top the list for degree centrality, indicating their extensive connectivity as major hubs. For betweenness centrality, DFW, DEN, and ORD (Chicago O’Hare) rank highest, reflecting their critical roles as key transfer points in air traffic flow. Closeness centrality is also led by DFW, DEN, and ORD, demonstrating their central positions within the network. These centrality measures align with the real-world functions of these airports, confirming their effectiveness in understanding network dynamics and predicting flight delays.
The centrality values were incorporated into the flight dataset as additional features corresponding to the origin and destination airports of each flight. Since each airport has its own computed degree, betweenness, and closeness centrality scores, six additional features were added to the dataset: three for the origin airport and three for the destination airport. Table 2 displays the key attributes of the updated dataset.

4.2.2. Machine Learning Model Training

This study implements three machine learning models, specifically RF, GB, and CB, to predict flight delays. These models were selected for their ability to effectively manage complex relationships within large datasets.
The target variable for prediction was arrival delay, which originally comprised both positive values (indicating delays) and negative or zero values (indicating on-time or early arrivals). To facilitate binary classification, these values were transformed into categorical variables: delays exceeding 15 min were coded as 1, while delays within 15 min, on-time, or early arrivals were coded as 0.
For model training, two distinct datasets were prepared. The first dataset included only baseline features, such as origin and destination airports, scheduled departure time, and departure delay. The second dataset extended the baseline features by incorporating network centrality measures to evaluate their additional predictive value. Departure delay is included in both datasets to assess whether centrality measures provide better predictions of delay propagation within the network, even when traditional features like departure delay are used. Both datasets were split into training and testing sets using an 80/20 ratio, ensuring a robust evaluation of the models’ performance.

5. Results

This section presents the evaluation of the three machine learning models applied, emphasizing the impact of integrating network centrality measures into the prediction framework. The analysis covers feature importance assessments and model performance comparisons.

5.1. Permutation Feature Importance

Permutation feature importance (PFI) was employed to evaluate the contribution of each feature to the predictive performance of the models. The importance is determined by measuring the decline in model performance when the values of a particular feature are randomly shuffled, which disrupts its relationship with the target variable.
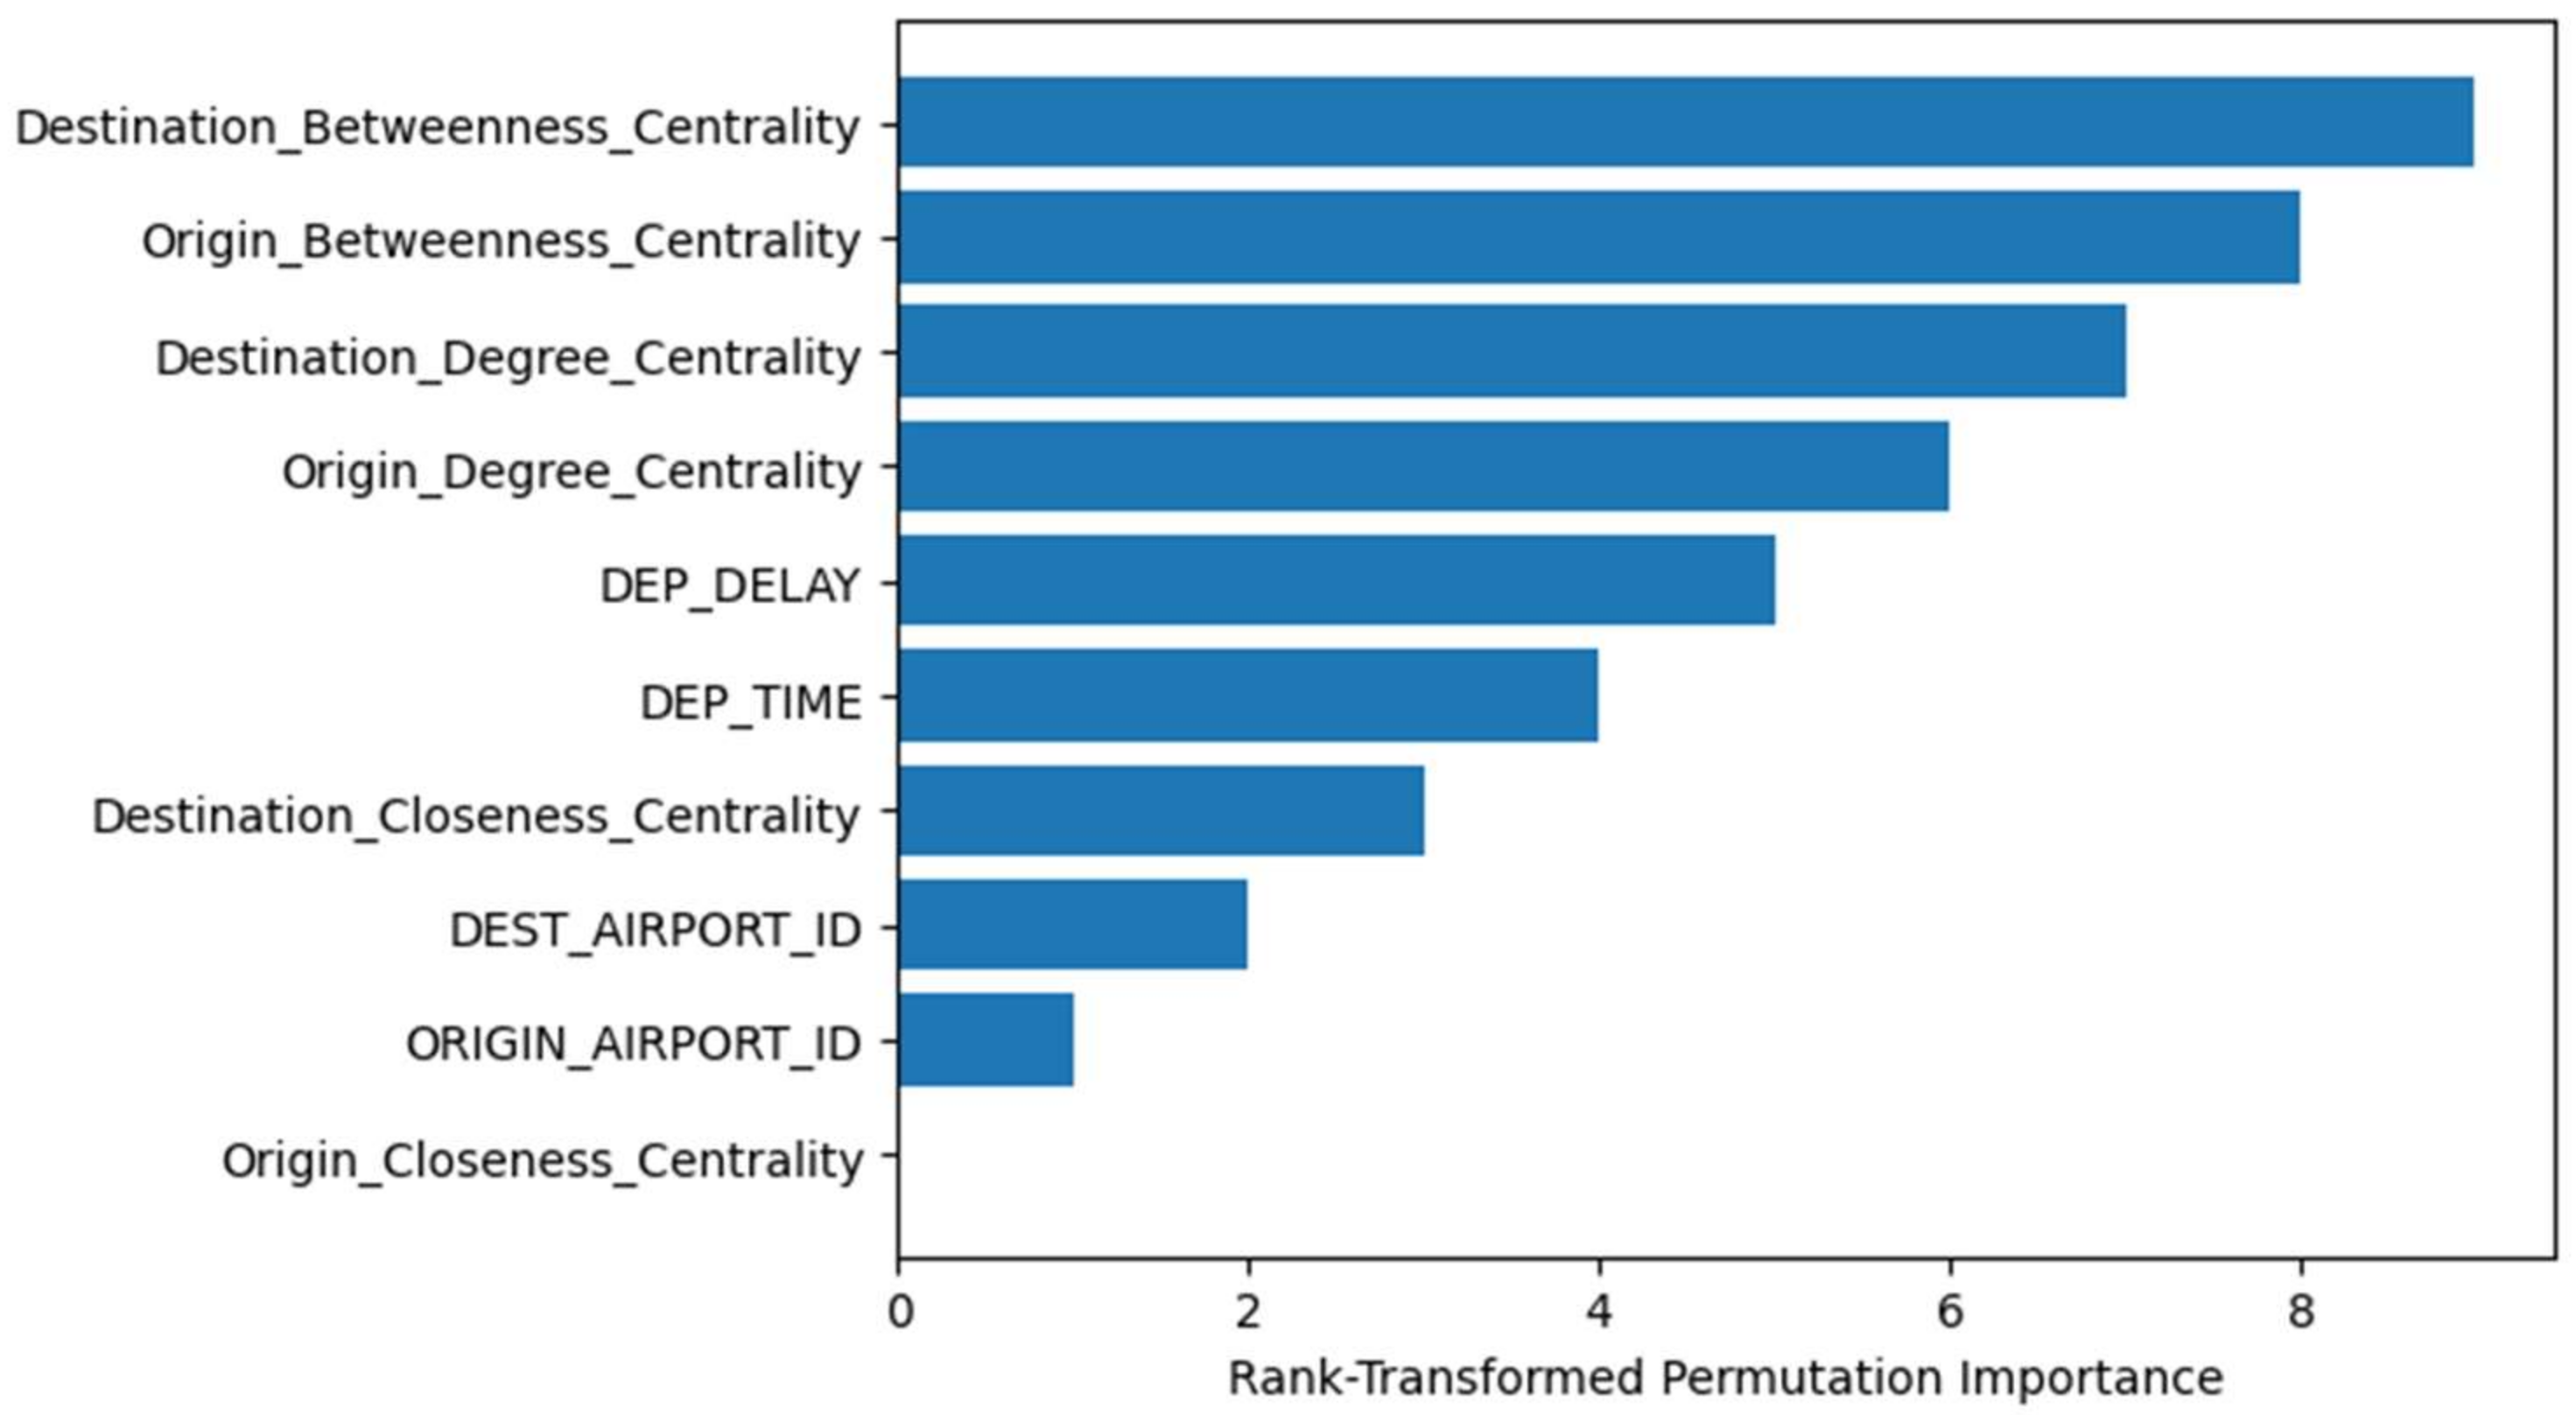
Figure 2 shows the PFI for the RF model. It ranks destination and origin betweenness centrality as the most important features, followed by degree centrality for both origin and destination airports. These centrality measures outperformed DEP_DELAY, highlighting the value of network-based features.
Figure 3 shows the PFI for the GB model. It ranks ORIGIN_AIRPORT_ID as the top feature, with destination betweenness centrality also showing high importance. While traditional features like airport IDs and DEP_TIME are dominant, centrality measures still play a significant role.
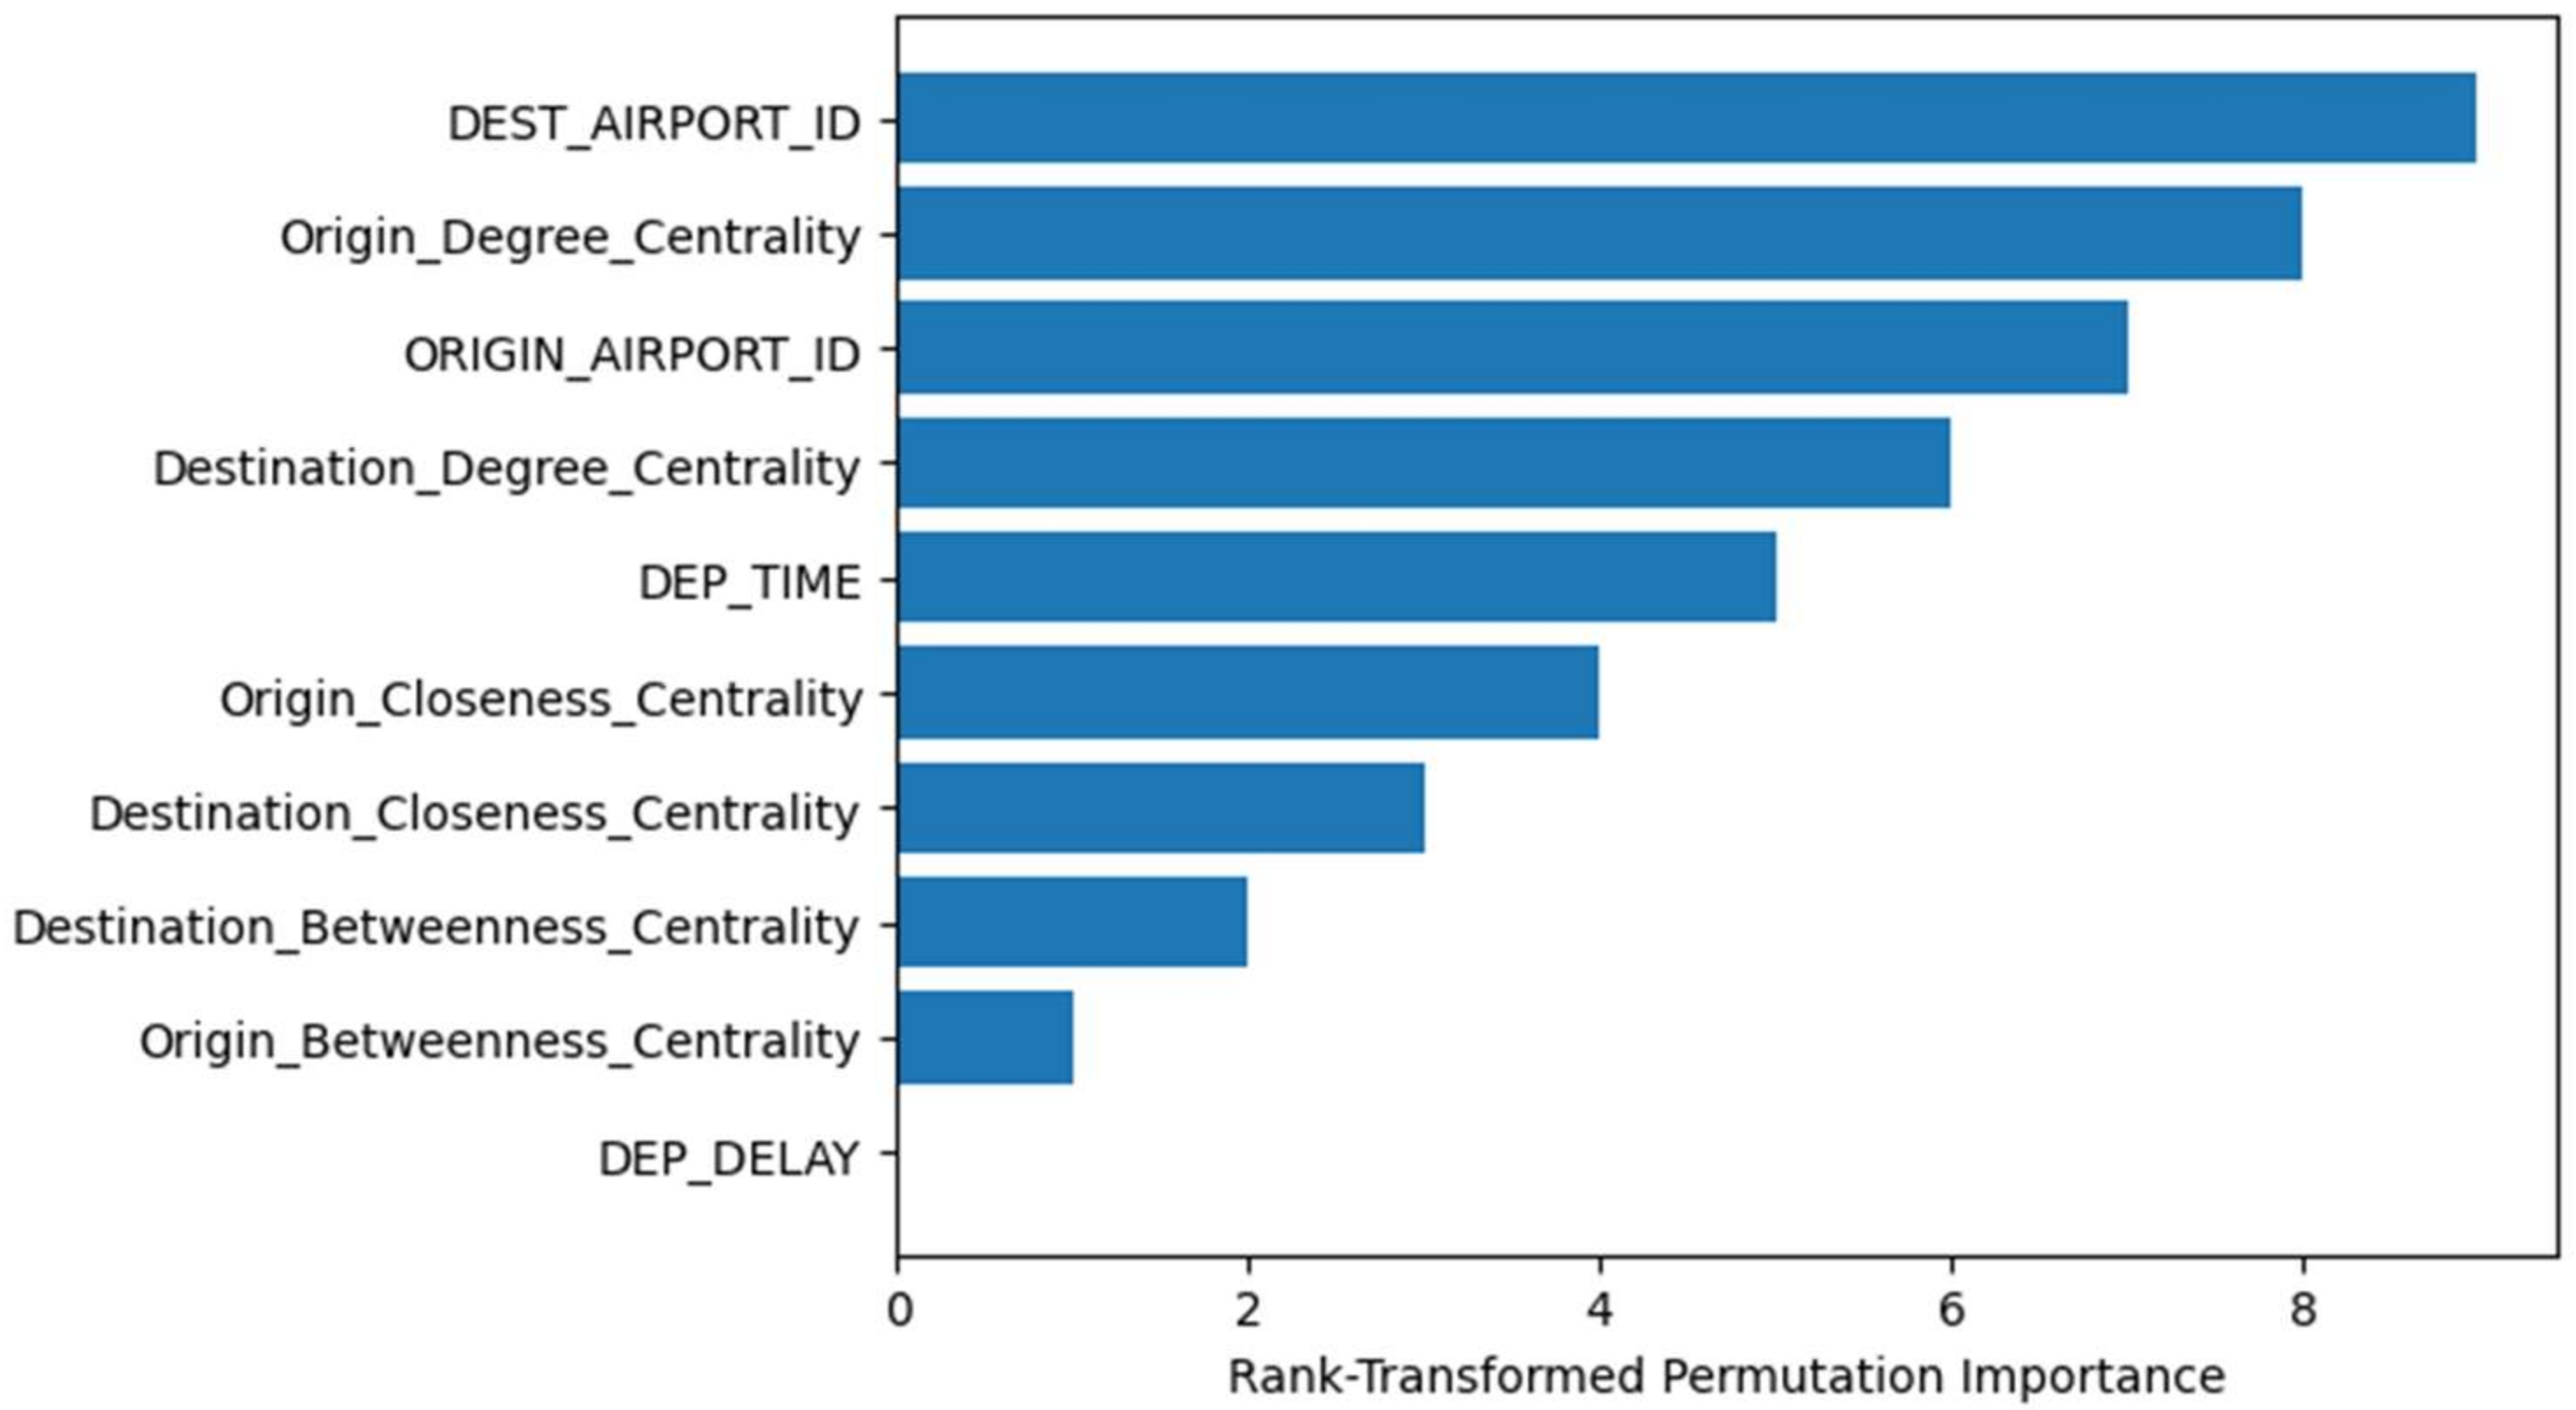
Figure 4 shows the PFI for the CB model. It ranks DEST_AIRPORT_ID and origin degree centrality as the most critical features, with centrality measures consistently proving influential. DEP_DELAY is less impactful, further emphasizing the importance of network centrality in predictions.
Although DEP_DELAY might seem like an obvious predictor, since a delayed departure often leads to a delayed arrival, it remains in our feature set for the following reasons. Not all delayed departures result in delayed arrivals; factors like air traffic control, weather, and efficient operations can mitigate delays. While DEP_DELAY captures immediate operational delays, centrality measures offer a broader understanding of how the network structure influences delays. Including DEP_DELAY allows us to assess whether centrality metrics provide unique predictive insights beyond simple delay variables. This comparison helps to determine if centrality measures can more effectively predict the delay propagation within the network, even when traditional features like DEP_DELAY are considered.
Across all the models, the network centrality measures, particularly betweenness and degree centrality, are consistently ranked among the top features, indicating their critical role in improving flight delay prediction. These results highlight the importance of integrating network structure insights into machine learning models for more accurate predictions.

5.2. Comparison with Baseline Models

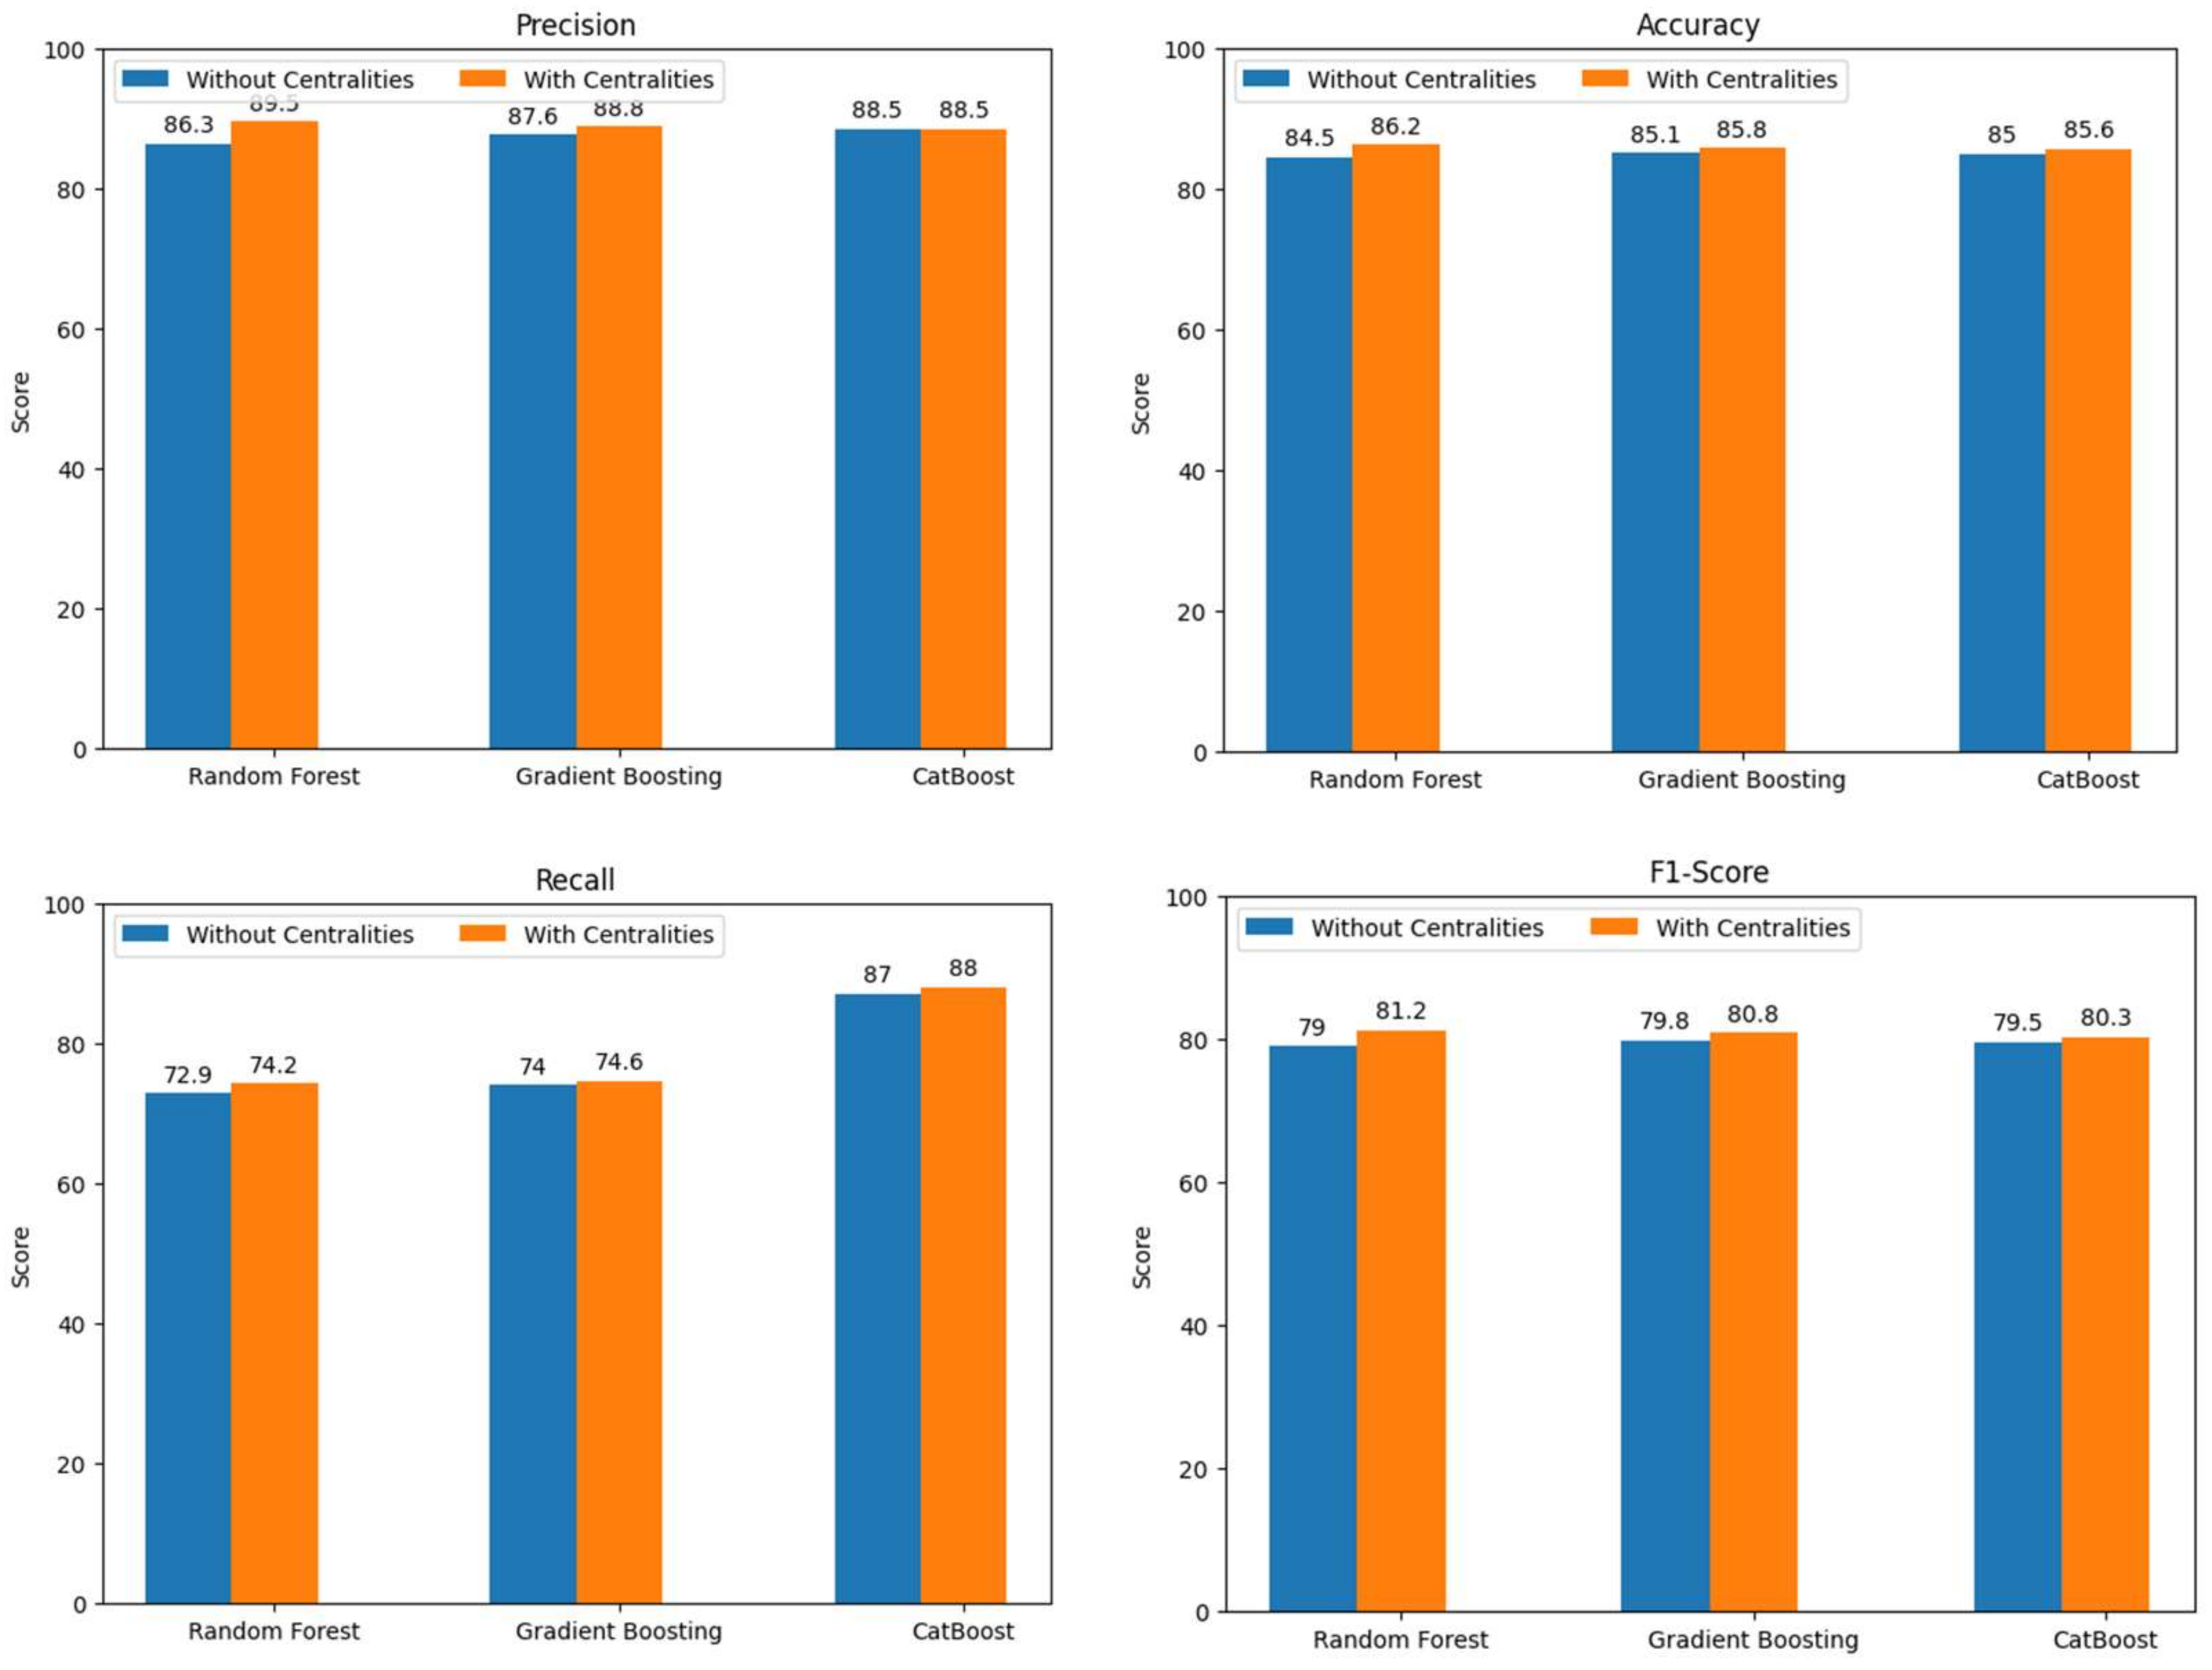
The comparison between those models trained with and without network centrality measures reveals notable improvements in performance across all the metrics: accuracy, precision, recall, and F1-score, as shown in Figure 5.
Accuracy measures the proportion of correctly predicted instances out of the total predictions. As shown in the figure, the inclusion of centrality measures increases the accuracy for all the models: RF improves from 84.5% to 86.2%, GB from 85.1% to 85.8%, and CB from 85% to 85.6%.
Precision indicates the proportion of true positive predictions among all the positive predictions. Precision also improves with the addition of centrality features: RF’s precision increases from 86.3% to 86.9%, GB from 87.6% to 88.8%, and CB maintains a high precision with a slight improvement from 88.5% to 88.5%.
Recall (also known as sensitivity) measures the proportion of actual positive instances correctly identified by the model. The figure shows an increase in recall for all the models: RF from 72.9% to 74.2%, GB from 74% to 74.6%, and CB from 87% to 88%.
F1-score is the harmonic mean of precision and recall, providing a balance between the two metrics. The F1-scores reflect an overall improvement, with RF rising from 79 to 81.2, GB from 79.8 to 80.8, and CB from 79.5 to 80.3.
The results clearly demonstrate that incorporating network centrality measures into the models enhances their predictive performance. This improvement is evident across all the evaluated metrics, confirming that the integration of network structure insights contributes to more accurate and reliable flight delay predictions.

6. Discussion

The results from the permutation feature importance analyses indicate that network centrality measures significantly enhance the performance of flight delay prediction models. These measures, particularly betweenness and degree centrality, consistently ranked among the most important features across all the models. This finding underscores the relevance of network structure in understanding and predicting delays within the complex air transportation system.
While traditional features such as scheduled departure and arrival time, departure delay, and airport IDs remain crucial, the inclusion of centrality measures adds a valuable layer of predictive insight. This suggests that the structural properties of the airport network, including the connectivity and centrality of the airports within the network, play a critical role in the propagation of delays.
Previous studies have also applied RF or GB for flight delay prediction with varying degrees of success. For example, Choi et al. [8] implemented DT, RF, AdaBoost, and k-Nearest-Neighbors, achieving the highest accuracy of 83.4% with RF using data from BTS. Our model, also using RF on BTS data, achieved a higher accuracy of 86.2%. Another study [17] applied RF for large-scale delay prediction, achieving a 90.2% accuracy in binary classification. However, this study used a completely different dataset from China, which was created with a proprietary big data platform and included weather information. Similarly, Liu et al. [18], using the same big data platform, applied GB and obtained an accuracy of 87.72%. In comparison, our accuracies of 86.2% with RF and 85.8% with GB are slightly lower, but this difference can be attributed to the use of different data sources.
Despite the promising results, there are limitations to this study. The current model does not predict the duration of delays, which is crucial for practical applications. Future research should explore the use of alternative predictors, including real-time data, and consider the impact of other factors such as weather conditions.
Finally, while the results are encouraging, further validation on different datasets and with more complex models, such as deep learning models, is necessary.

7. Conclusions

This study integrated network centrality measures into machine learning models to enhance the accuracy of flight delay predictions. The models, including RF, GB, and CB, showed improved performance with the inclusion of the centrality measures. The accuracy increased from an average of 84.5% to 86.2% for RF, 85.1% to 85.8% for GB, and 85.0% to 85.6% for CB. The precision, recall, and F1-scores also improved, highlighting the value of the centrality features. The importance of these measures, especially betweenness and degree centrality, was confirmed through feature importance analysis.
The innovation of this study lies in the novel integration of network centrality measures into machine learning models for flight delay prediction, which, to the best of our knowledge, has not been explored in the literature. This approach provides new insights and improves the predictive accuracy beyond the traditional methods.
However, the study’s limitations, including the focus on binary classification and the use of departure delay as a predictor, suggest several directions for future research. The future work should explore predicting the duration of delays, considering additional features like weather conditions, incorporating real-time data, and comparing the results with those of published studies using the same datasets. Expanding the methodology to include other ensemble learning methods and applying it to different transportation networks could further enhance the prediction accuracy and robustness.
In conclusion, while this study makes significant strides in improving flight delay predictions, ongoing research and refinement are necessary to fully realize the potential of network centrality measures in this domain.

Author Contributions

Methodology, Y.X.; Formal analysis, J.A.; Resources, J.A.; Writing – original draft, J.A.; Writing – review & editing, Y.X., L.L. and K.W. All authors have read and agreed to the published version of the manuscript.

Funding

This research received no external funding.

Institutional Review Board Statement

Not applicable.

Informed Consent Statement

Not applicable.

Data Availability Statement

The data presented in this study are available on request from the corresponding author.

Conflicts of Interest

The authors declare no conflict of interest.

References

  1. Federal Aviation Administration (FAA). Air Traffic by the Numbers. Available online: https://www.faa.gov/airtraffic/air-traffic-numbers (accessed on 22 August 2024).
  2. Boeing. Boeing Forecasts Demand for Nearly 44,000 New Airplanes Through 2043 as Air Travel Surpasses Pre-Pandemic Levels. Available online: https://investors.boeing.com/investors/news/press-release-details/2024/Boeing-Forecasts-Demand-for-Nearly-44000-New-Airplanes-Through-2043-as-Air-Travel-Surpasses-Pre-Pandemic-Levels/default.aspx (accessed on 22 August 2024).
  3. Dai, M. A hybrid machine learning-based model for predicting flight delay through aviation big data. Sci. Rep. 2024, 14, 4603. [Google Scholar] [CrossRef] [PubMed]
  4. Kim, Y.J.; Choi, S.; Briceno, S.; Mavris, D. A deep learning approach to flight delay prediction. In Proceedings of the 2016 IEEE/AIAA 35th Digital Avionics Systems Conference (DASC), Sacramento, CA, USA, 25–29 September 2016; pp. 1–6. [Google Scholar]
  5. Yu, B.; Guo, Z.; Asian, S.; Wang, H.; Chen, G. Flight delay prediction for commercial air transport: A deep learning approach. Transp. Res. Part E Logist. Transp. Rev. 2019, 125, 203–221. [Google Scholar] [CrossRef]
  6. Cai, K.; Li, Y.; Fang, Y.P.; Zhu, Y. A deep learning approach for flight delay prediction through time-evolving graphs. IEEE Trans. Intell. Transp. Syst. 2021, 23, 11397–11407. [Google Scholar] [CrossRef]
  7. Esmaeilzadeh, E.; Mokhtarimousavi, S. Machine learning approach for flight departure delay prediction and analysis. Transp. Res. Rec. 2020, 2674, 145–159. [Google Scholar] [CrossRef]
  8. Choi, S.; Kim, Y.J.; Briceno, S.; Mavris, D. Prediction of weather-induced airline delays based on machine learning algorithms. In Proceedings of the 2016 IEEE/AIAA 35th Digital Avionics Systems Conference (DASC), Sacramento, CA, USA, 25–29 September 2016; pp. 1–6. [Google Scholar]
  9. Khan, R.; Akbar, S.; Zahed, T.A. Flight delay prediction based on gradient boosting ensemble techniques. In Proceedings of the 2022 16th International Conference on Open Source Systems and Technologies (ICOSST), Lahore, Pakistan, 14–15 December 2022; pp. 1–5. [Google Scholar]
  10. KXAN. Which Airports Had the Most Delays and Cancellations in 2023? Available online: https://www.kxan.com/news/national-news/which-airports-had-the-most-delays-and-cancellations-in-2023/ (accessed on 22 August 2024).
  11. Hsiao, C.Y.; Hansen, M. Econometric analysis of US airline flight delays with time-of-day effects. Transp. Res. Rec. 2006, 1951, 104–112. [Google Scholar] [CrossRef]
  12. Zou, B.; Hansen, M. Flight delays, capacity investment and social welfare under air transport supply-demand equilibrium. Transp. Res. Part A Policy Pract. 2012, 46, 965–980. [Google Scholar] [CrossRef]
  13. Rebollo, J.J.; Balakrishnan, H. Characterization and prediction of air traffic delays. Transp. Res. Part C Emerg. Technol. 2014, 44, 231–241. [Google Scholar] [CrossRef]
  14. Nigam, R.; Govinda, K. Cloud based flight delay prediction using logistic regression. In Proceedings of the 2017 International Conference on Intelligent Sustainable Systems (ICISS), Palladam, India, 7–8 December 2017; pp. 662–667. [Google Scholar]
  15. Yin, J.; Hu, Y.; Ma, Y.; Xu, Y.; Han, K.; Chen, D. Machine learning techniques for taxi-out time prediction with a macroscopic network topology. In Proceedings of the 2018 IEEE/AIAA 37th Digital Avionics Systems Conference (DASC), London, UK, 23–27 September 2018; pp. 1–8. [Google Scholar]
  16. Pamplona, D.A.; Weigang, L.; De Barros, A.G.; Shiguemori, E.H.; Alves, C.J.P. Supervised neural network with multilevel input layers for predicting of air traffic delays. In Proceedings of the 2018 International Joint Conference on Neural Networks (IJCNN), Rio de Janeiro, Brazil, 8–13 July 2018; pp. 1–6. [Google Scholar]
  17. Gui, G.; Liu, F.; Sun, J.; Yang, J.; Zhou, Z.; Zhao, D. Flight delay prediction based on aviation big data and machine learning. IEEE Trans. Veh. Technol. 2019, 69, 140–150. [Google Scholar] [CrossRef]
  18. Liu, F.; Sun, J.; Liu, M.; Yang, J.; Gui, G. Generalized flight delay prediction method using gradient boosting decision tree. In Proceedings of the 2020 IEEE 91st Vehicular Technology Conference (VTC2020-Spring), Antwerp, Belgium, 25–28 May 2020; pp. 1–5. [Google Scholar]
  19. Wu, Y.; Yang, H.; Lin, Y.; Liu, H. Spatiotemporal propagation learning for network-wide flight delay prediction. IEEE Trans. Knowl. Data Eng. 2023, 36, 386–400. [Google Scholar] [CrossRef]
  20. Li, Q.; Guan, X.; Liu, J. A CNN-LSTM framework for flight delay prediction. Expert Syst. Appl. 2023, 227, 120287. [Google Scholar] [CrossRef]
  21. Güvercin, M.; Ferhatosmanoglu, N.; Gedik, B. Forecasting flight delays using clustered models based on airport networks. IEEE Trans. Intell. Transp. Syst. 2020, 22, 3179–3189. [Google Scholar] [CrossRef]
  22. Paramita, C.; Supriyanto, C.; Syarifuddin, L.A.; Rafrastara, F.A. The Use of Cluster Computing and Random Forest Algoritm for Flight Delay Prediction. Int. J. Comput. Sci. Inf. Secur. (IJCSIS) 2022, 20, 19–22. [Google Scholar]
  23. Wei, X.; Li, Y.; Shang, R.; Ruan, C.; Xing, J. Airport Cluster Delay Prediction Based on TS-BiLSTM-Attention. Aerospace 2023, 10, 580. [Google Scholar] [CrossRef]
  24. Cheung, D.P.; Gunes, M.H. A complex network analysis of the United States air transportation. In Proceedings of the 2012 IEEE/ACM International Conference on Advances in Social Networks Analysis and Mining, Istanbul, Turkey, 26–29 August 2012; pp. 699–701. [Google Scholar]
  25. Anderson, S.; Revesz, P. Efficient MaxCount and threshold operators of moving objects. Geoinformatica 2009, 13, 355–396. [Google Scholar] [CrossRef]
  26. Freeman, L.C. Centrality in social networks conceptual clarification. Soc. Netw. 1978, 1, 215–239. [Google Scholar] [CrossRef]
  27. Wasserman, S. Social Network Analysis: Methods and Applications; The Press Syndicate of the University of Cambridge: Cambridge, UK, 1994. [Google Scholar]
  28. Breiman, L. Random forests. Mach. Learn. 2001, 45, 5–32. [Google Scholar] [CrossRef]
  29. Friedman, J.H. Greedy function approximation: A gradient boosting machine. Ann. Stat. 2001, 29, 1189–1232. [Google Scholar] [CrossRef]
  30. Friedman, J.H. Stochastic gradient boosting. Comput. Stat. Data Anal. 2002, 38, 367–378. [Google Scholar] [CrossRef]
  31. Prokhorenkova, L.; Gusev, G.; Vorobev, A.; Dorogush, A.V.; Gulin, A. CatBoost: Unbiased boosting with categorical features. In Proceedings of the 32nd International Conference on Neural Information Processing Systems, Montréal, Canada, 2–8 December 2018; pp. 6639–6649. [Google Scholar]
  32. Bureau of Transportation Statistics (BTS). TranStats Database. Available online: https://www.transtats.bts.gov/ (accessed on 22 August 2024).
Figure 1. Top 20 airports by degree, betweenness, and closeness centrality scores.
Information 15 00559 g001
Figure 2. Permutation feature importance for RF.
Information 15 00559 g002
Figure 3. Permutation feature importance for GB.
Information 15 00559 g003
Figure 4. Permutation feature importance for CB.
Information 15 00559 g004
Figure 5. Performance comparison of RF, GB, and CB models trained with and without network centrality measures, evaluated using accuracy, precision, recall, and F1-score.
Information 15 00559 g005
Table 1. Key attributes of the dataset.
Attribute NameDescriptionType
ORIGIN_AIRPORT_IDOrigin airportCategorical
DEST_AIRPORT_IDDestination airportCategorical
DEP_TIMEScheduled departure timeNumerical
DEP_DELAYFlight delay (in minutes)Numerical
ARR_DELAYArrival delay (in minutes)Numerical
Table 2. Key attributes of the dataset after integrating network centrality measures.
Attribute NameDescriptionType
ORIGIN_AIRPORT_IDOrigin airportCategorical
DEST_AIRPORT_IDDestination airportCategorical
DEP_TIMEScheduled departure timeNumerical
DEP_DELAYFlight delay (in minutes)Numerical
ARR_DELAYArrival delay (in minutes)Numerical
Origin_Degree_CentralityDegree centrality of origin airportNumerical
Dest_Degree_CentralityDegree centrality of destination airportNumerical
Origin_Betweenness_CentralityBetweenness centrality of origin airportNumerical
Dest_Betweenness_CentralityBetweenness centrality of destination airportNumerical
Origin_Closeness_CentralityCloseness centrality of origin airportNumerical
Dest_Closeness_CentralityCloseness centrality of destination airportNumerical
Disclaimer/Publisher’s Note: The statements, opinions and data contained in all publications are solely those of the individual author(s) and contributor(s) and not of MDPI and/or the editor(s). MDPI and/or the editor(s) disclaim responsibility for any injury to people or property resulting from any ideas, methods, instructions or products referred to in the content.