Article

New Test to Detect Clustered Graphical Passwords in Passpoints Based on the Perimeter of the Convex Hull

by
Joaquín Alberto Herrera-Macías
1,
Lisset Suárez-Plasencia
1,
Carlos Miguel Legón-Pérez
1,
Guillermo Sosa-Gómez
2,* and
Omar Rojas
2
1
Instituto de Criptografía, Facultad de Matemática y Computación, Universidad de la Habana, Habana 10400, Cuba
2
Facultad de Ciencias Económicas y Empresariales, Universidad Panamericana, Álvaro del Portillo 49, Zapopan 45010, JAL, Mexico
*
Author to whom correspondence should be addressed.
Information 2024, 15(8), 447; https://doi.org/10.3390/info15080447
Submission received: 4 June 2024 / Revised: 25 July 2024 / Accepted: 27 July 2024 / Published: 30 July 2024

Abstract

:
This research paper presents a new test based on a novel approach for identifying clustered graphical passwords within the Passpoints scenario. Clustered graphical passwords are considered a weakness of graphical authentication systems, introduced by users during the registration phase, and thus it is necessary to have methods for the detection and prevention of such weaknesses. Graphical authentication methods serve as a viable alternative to the conventional alphanumeric password-based authentication method, which is susceptible to known weaknesses arising from user-generated passwords of this nature. The test proposed in this study is based on estimating the distributions of the perimeter of the convex hull, based on the hypothesis that the perimeter of the convex hull of a set of five clustered points is smaller than the one formed by random points. This convex hull is computed based on the points that users select as passwords within an image measuring 1920 × 1080 pixels, using the built-in function convhull in Matlab R2018a relying on the Qhull algorithm. The test was formulated by choosing the optimal distribution that fits the data from a total of 54 distributions, evaluated using the Kolmogorov–Smirnov, Anderson–Darling, and Chi-squared tests, thus achieving the highest reliability. Evaluating the effectiveness of the proposed test involves estimating type I and I I errors, for five levels of significance α { 0.01 , 0.02 , 0.05 , 0.1 , 0.2 } , by simulating datasets of random and clustered graphical passwords with different levels of clustering. In this study, we compare the effectiveness and efficiency of the proposed test with existing tests from the literature that can detect this type of pattern in Passpoints graphical passwords. Our findings indicate that the new test demonstrates a significant improvement in effectiveness compared to previously published tests. Furthermore, the joint application of the two tests also shows improvement. Depending on the significance level determined by the user or system, the enhancement results in a higher detection rate of clustered passwords, ranging from 0.1 % to 8 % compared to the most effective previous methods. This improvement leads to a decrease in the estimated probability of committing a type I I error. In terms of efficiency, the proposed test outperforms several previous tests; however, it falls short of being the most efficient, using computation time measured in seconds as a metric. It can be concluded that the newly developed test demonstrates the highest effectiveness and the second-highest efficiency level compared to the other tests available in the existing literature for the same purpose. The test was designed to be implemented in graphical authentication systems to prevent users from selecting weak graphical passwords, enhance password strength, and improve system security.

1. Introduction

Studies conducted by various researchers [1,2] indicate that using alphanumeric passwords as an authentication method is not advisable due to the vulnerabilities arising from users’ password creation practices. The primary vulnerabilities in the security of this password type stem from users’ improper selection of characters during the registration process and their tendency to reuse passwords across multiple websites. To facilitate memorization, passwords are typically designed to be short, with limited character variation, and frequently incorporate personal information, thereby enhancing the potential for unauthorized access by imposters [3]. The utilization of artificial intelligence in a recent application aimed at compromising alphanumeric passwords serves as additional evidence for implementing alternative authentication methods [4]. As a means of addressing this issue, graphical passwords have emerged as a potential solution. These authentication systems offer a significantly larger password space compared to alphanumeric passwords. The efficiency of this approach relies on the human capacity to recognize and recall patterns in visual representations, as opposed to memorizing lengthy and intricate sequences of characters [5].
The Passpoints system, developed by Wiedenbeck in 2005 [6], is notable for its security and usability compared to other cued-recall type systems [7]. The process involves the user choosing a sequence of five points within an image during the registration phase to serve as their password. During the process of authentication, it is imperative for the user to accurately and precisely repeat the sequence in the correct order, adhering to the specific tolerance set by the system. The system’s weaknesses lie in the quality of the images chosen by the user or system, the presence of predictable patterns in password creation, and the use of discretization mechanisms that decrease the password space and provide valuable information for conducting dictionary attacks.
To enhance the security of Passpoints, it is crucial to incorporate tools during the registration phase that can notify users about the weakness of their graphical passwords. Additionally, implementing a method during the authentication phase to assess the level of authenticity for each user is equally important. Several articles have been published in recent years addressing the topic at hand. For instance, in the work by [8], a probabilistic model of graphical authentication is proposed for the authentication phase. This model enables the practical measurement of the level of authenticity for each user, categorizing them as high, medium, low or shallow. Only users with high or medium authenticity levels are authenticated based on the results obtained. In [9,10], two spatial randomness tests were introduced to identify non-random, clustered and regular graphical passwords in the Passpoints. These tests were developed in response to the limited effectiveness of traditional tests in verifying the complete spatial randomness in this specific scenario [9,11]. Recently, the joint application of the previously mentioned tests has been proposed by [12], making it the most effective alternative currently available as of the time of writing this article. Finally, the proposal of an effective test [13], the only one in the consulted bibliography, has been proven effective in detecting patterns characterized by points that exhibit a linear or near-linear shape, commonly referred to as smooth patterns. These recent contributions have positioned this graphical authentication system as a viable alternative to conventional authentication methods, offering enhanced security and usability.
The convex hull of a set of n points in the plane is a fundamental concept in computational geometry [14,15,16,17], being the convex hull of a set of points the smallest convex polygon that contains all the points of the set [14,17,18,19], whose efficient implementation is an ongoing area of research [20,21,22,23,24] with applications in various fields. However, there is a lack of references to applications related to security issues, such as the one presented in this work. There exist several algorithms for computing the convex hull, whose complexities are of the order O ( n 3 ) , O ( n 2 ) , O ( n log n ) . However, in the specific scenario considered in this study, where the n points are randomly distributed, the complexity can be reduced to a linear function of the n of O ( n ) points.
The primary attributes of the convex hull of a set of points in the plane include its perimeter, area, and the number of vertices. There have been studies on the statistical properties when the number of points tends to infinity [25,26,27]. Additionally, the convex hull of a random walk determined by an ordered set of points can be calculated, and the statistical properties of this convex hull were also investigated [28,29]. Research in this field has primarily concentrated on examining the mean limit values of the functional of the convex hull [27], assuming some properties for the set of n points. Currently, the distribution of the perimeter of the convex hull of a random set of points in the plane remains unknown for a finite and significantly small number of points.
This study presents a novel spatial randomness test that can effectively identify clustered graphical passwords in the Passpoints scenario. In this study, a comparative analysis is conducted to evaluate the effectiveness and efficiency of the proposed test in detecting a specific pattern in the graphical passwords of Passpoints. The comparison is made with other tests found in the existing literature that can identify similar patterns. All the implementations and experiments were conducted using MATLAB R2018a to compare the tests on a PC Laptop equipped with an AMD Athlon Silver 3050U processor, running at 2.30 GHz and with 8 GB. of RAM. The work is organized into five sections: Section 1, Introduction, provides an overview of the study; Section 2 presents the preliminaries, Passpoints, and known tests to detect graphical passwords in the Passpoints scenario; Section 3 presents our contribution, which is a new test designed to detect clustered graphical passwords in Passpoints; Section 4 shows the comparison with the antecedents; and finally, Section 5 presents the conclusions drawn from the study and outlines potential future research directions.

2. Preliminaries

2.1. Passpoints

Using graphical passwords has emerged as a potential solution to address the primary challenge associated with alphanumeric passwords, namely the user’s struggle to remember highly secure passwords. Alphanumeric passwords typically consist of alphabets with up to 90 symbols. The standard length for these passwords, as recommended by the National Institute of Standards and Technology (NIST) [30], is eight characters. This results in a total key space of 90 8 = 4.3 × 10 15 . In the context of Passpoints systems, the key space about the outdated image resolutions of 800 × 480 pixels is V 5 800 × 480 = 8.3 × 10 25 . Since 10 15 < < 10 25 , Passpoints not only outperforms alphanumerics in terms of usability but also in terms of security. Graphical authentication methods can be categorized into three groups: recognition-based techniques, recall-based techniques, and cued-recall-based techniques [31]. The cued-recall type systems distinguish themselves from previous systems due to their unique characteristic of only necessitating users to recall and concentrate on specific locations within an image. This feature aims to alleviate users’ cognitive burden by providing a simplified alternative to memorizing a complex array of characters.
Passpoints are notable within the category of graphical authentication systems of the cued recall-type due to their commendable combination of usability and security. The system’s usability involves the user’s selection of five points within an image to serve as their password during the registration phase. The user can choose the image themselves or have one the system provides. In the authentication process, the user must select the points chosen during the registration phase within a specified neighborhood or tolerance region in the same sequential order. However, despite the security provided by the large password space, not all images are appropriate for use in Passpoints. One vulnerability of this technique is the potential attack on the points most likely to be selected in the image, commonly referred to as hotspots in the literature [32]. The recommendation in [6] is to enhance the security of this technique by selecting an image with hundreds of hotspots that are evenly distributed throughout. Other vulnerabilities arising from user actions, irrespective of the image itself, include the inadvertent selection of specific regions within the image, such as the edges or the center, and the inherent interdependence often observed among the chosen points, such as the password [33,34]. These interdependencies among points are referred to as point patterns [35]. Hackers can exploit the predictability of certain patterns in graphical passwords through various techniques to gain unauthorized access. Therefore, graphical passwords should adhere to a random pattern to maintain security. The strength of a graphical password is compromised when the points are not distributed randomly. Several common non-random patterns have been identified in the study conducted by [36].

2.2. Known Tests to Detect Clustered Graphical Passwords in Passpoints

In this subsection, we present and describe some known tests to detect clustered graphical passwords in Passpoints.
First, we present a test based on the average distance between the points. In [9], an effective spatial randomness test was proposed to detect non-random graphical passwords in Passpoints. Concluding that the mean distances between the five points of a graphical password follow a normal distribution, a two-tailed hypothesis test was constructed to differentiate between the clustered, random, and regular graphical passwords. Their experiments demonstrated the overall effectiveness of the test in detecting non-random graphical passwords, with a particular emphasis on its ability to identify clustered patterns. They further demonstrated that the efficacy of the intervention is independent of the image size chosen by the user or system. Utilizing an image of dimensions 1920 × 1080 pixels as a point of reference, the authors created three distinct databases characterized by varying levels of clustering. In the three levels of clustering examined, the test successfully identified approximately 94 % , 99 % , and 100 % of the passwords analyzed at a significance level α = 0.1 , as recommended by the authors for widespread application.
A test was proposed in [10] based on the average of the perimeters of the Delaunay triangles. This study focuses on identifying non-random graphical passwords composed of five clustered or regularly positioned points. The analysis involves conducting a two-tailed test centered around the mean of the perimeters of the Delaunay triangles. To ensure normality, the perimeters are transformed using the Johnson SB [37] transformation. To effectively implement this test, the authors have underscored the importance of considering the selected image size, as the Johnson SB parameters vary depending on the image sizes. As in the previous test, passwords were simulated for the same clustering levels. A reference image of 1920 × 1080 pixels was used, and it was determined that the effectiveness of the test does not depend on the size of the image selected. For the three levels of clustering, the test yielded detection rates of 87.07 % , 99.66 % , and 100 % , respectively, with a significance level of α = 0.1 . Their results showed that the clustering detection is more accurate than regularity.
A joint application of the previous tests in Passpoints. Both tests were designed to be included in graphical authentication systems with the Passpoints technique to enable the system to check the randomness of a password established by the user during the registration phase. Figure 1, extracted from the work of [12], illustrates the schematic representation of the joint application of both tests during the Passpoints registration phase. The authors’ decision to initially employ the test utilizing the mean distances between points is justified by its greater efficiency and effectiveness. This approach enables the prompt rejection of non-random passwords with high accuracy. Until the time of this publication, this joint test was the one that reported the most significant effectiveness in detecting clustered graphical passwords. Table 1 shows the number of clustered graphical passwords detected using the joint application of both tests for each of the three clustering levels, consisting of 10,000 passwords each.

3. Our Contribution: New Test to Detect Clustered Graphical Passwords in Passpoints

3.1. Our Hypothesis

The clustered graphical passwords in Passpoints can be characterized as those with points concentrated in a smaller image area. Considering the above, the hypothesis proposes using the perimeter of the convex hull delimited by the five points as an indicator of the clustering measure of the points. Figure 1 shows the convex hull determined by three graphical passwords with patterns of clustering (a), randomness (b), and regularity (c), respectively. Figure 2 supports the proposed hypothesis.
Knowing the probability distribution that best fits the perimeter of the convex hull delimited by five randomly distributed points on the image would enable the development of a hypothesis test capable of differentiating between the three alternative patterns with a predetermined significance level, α .

3.2. Estimate of the Probability Distribution of the Perimeter of the Convex Hull

The following experiment was conducted to determine the probability distribution of the perimeter of the convex hull formed by five points uniformly distributed on an image with dimensions of 1920 × 1080 pixels.
Experiment 1: A total of 1000 graphical passwords were randomly distributed over an image with dimensions of 1920 × 1080 pixels were simulated. For each of these passwords, the perimeter of the convex hull they determine was calculated, resulting in a database (DB.1) of 1000 real values that can be analyzed. To assess the goodness of fit of the data to various probability distributions, we utilized the EasyFit v.5.6 software.
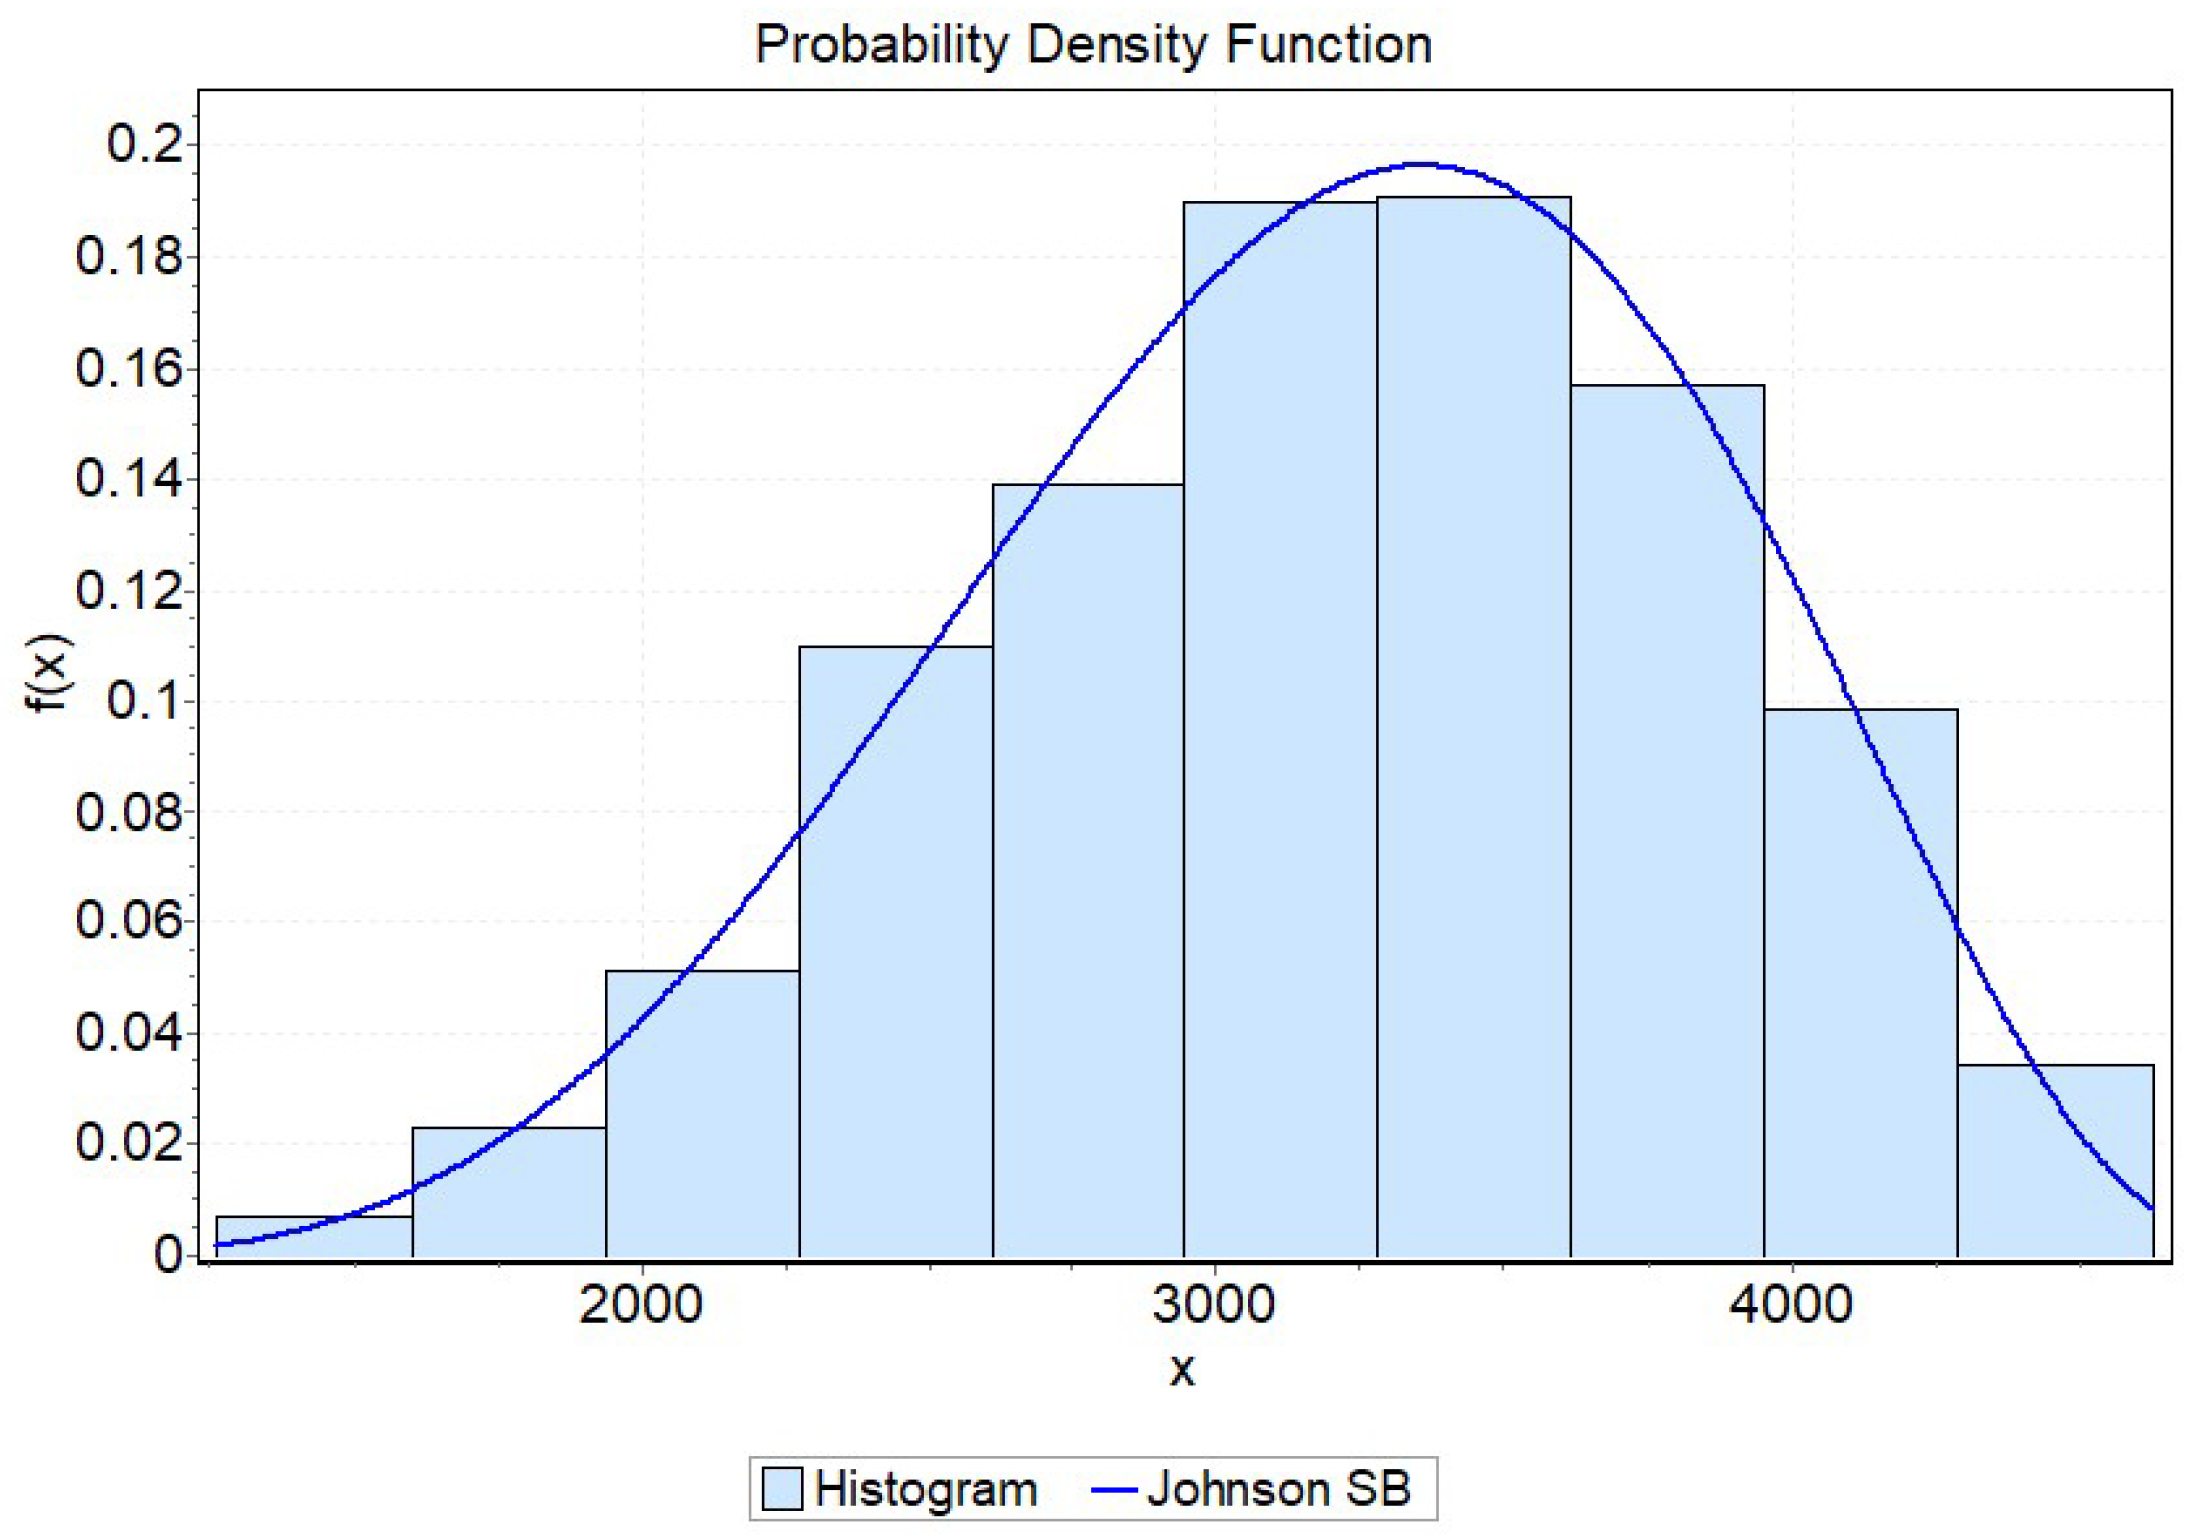
Results of Experiment 1: The data showed an excellent fit to the Johnson SB distribution with parameters γ = 0.65612 , δ = 1.5922 , λ = 4575.1 , ξ = 495.15 . Figure 3 illustrates the fit of the Johnson SB distribution to the data. Three goodness-of-fit tests were used to measure the fit of the data: Anderson–Darling, Kolmogorov–Smirnov, Chi-squared; Table 2 shows the results of these tests.
Knowing these results, it is assumed that the distribution sought is a Johnson SB, whose parameters, estimated using EasyFit v5.6 software, are shown in Table 3.

3.3. Hypothesis Test Based on the Perimeter of the Convex Hull

Once the probability distribution is known as a Johnson SB, the practical application of this criterion is facilitated by considering the desirable characteristic of the Johnson SB distribution, which can be transformed into a standard Normal distribution by applying Equation (1) [37]
P E C N = J S B ( P E C ) = γ + δ × l n [ ( P E C ξ ) / ( λ + ξ P E C ) ] ,
using the parameters of Table 3, it is obtained that P E . C . N N ( 0 , 1 ) , where P E . C . N represents the perimeter of the convex hull after performing the Johnson SB transformation. Using this property, the definition of a clustered graphical password detection test is reduced to applying a mean test for the standard normal distribution P E . C . N .
The proposal consists of a two-tailed test based on the perimeter of the convex hull delimited by the five points of a graphical password. The Johnson SB transforms these points into a standard Normal distribution. To apply this test, the image size that the user selects must be considered, as the estimated parameters for the Johnson SB distribution depend on it.

3.3.1. Definition of the Proposed Test

The null hypothesis
H 0 : E [ P E . C . N ] = 0
is proposed, indicating that the graphical password selected by the user is random if the transformation through the Johnson SB of the perimeter of the convex hull to a standard Normal distribution is equal to 0. As an alternative hypothesis, we have
H 1 : E [ P E . C . N ] 0
if the evidence is less than zero, which indicates clustering; otherwise, it indicates regularity. As a test statistic, the Johnson SB transformation of the perimeter of the convex hull is bounded by the points of a graphical password
Z = J S B ( P P E C ) = γ + δ × l n [ ( P P E C ξ ) / ( λ + ξ P P E C ) ] ,
with the selection of values for the parameters according to the size of the image, with the critical region { z : Z < z α / 2 or Z > z α / 2 } , where α is the significance level previously established by the user or system. In this specific problem, type I error means rejecting random passwords, which can reduce usability; while committing a type I I error means not rejecting non-random passwords, which is a threat to the security of the system.

3.3.2. Evaluation of the Effectiveness of the Proposed Test

According to the definition of the test, obtaining values of E [ P E . C . N ] > 0 would indicate a pattern of regularity. However, the results obtained in this aspect during the experiments are not significant compared to those reported by previous studies. Therefore, it is not necessary to include them in this article. In this section, only the results concerning the detection of clustered patterns are reported, which constitutes the main contribution of this work. The following experiments were conducted to estimate the type I and type I I errors committed by the proposed test.
Experiment 2: To estimate the probabilities of committing a type I error, we simulated 10 , 000 new graphical passwords. The points in these passwords were randomly distributed over the image. These passwords are stored in the database and are labeled as DB.2. The proposed test was applied to each of these passwords, and the number of false positives obtained for each significance level were counted for α { 0.2 , 0.1 , 0.05 , 0.02 , 0.01 } . The results of experiment 2 are summarized in the following Table 4.
In each case, the estimated probability of committing a type I error corresponds to the predetermined theoretical significance levels. Observe that this proper adjustment is only expected if the procedures carried out up to the moment of adjusting to the Johnson SB distribution and its subsequent transformation are correct. Therefore, these values contribute to the validity of the proposed test.
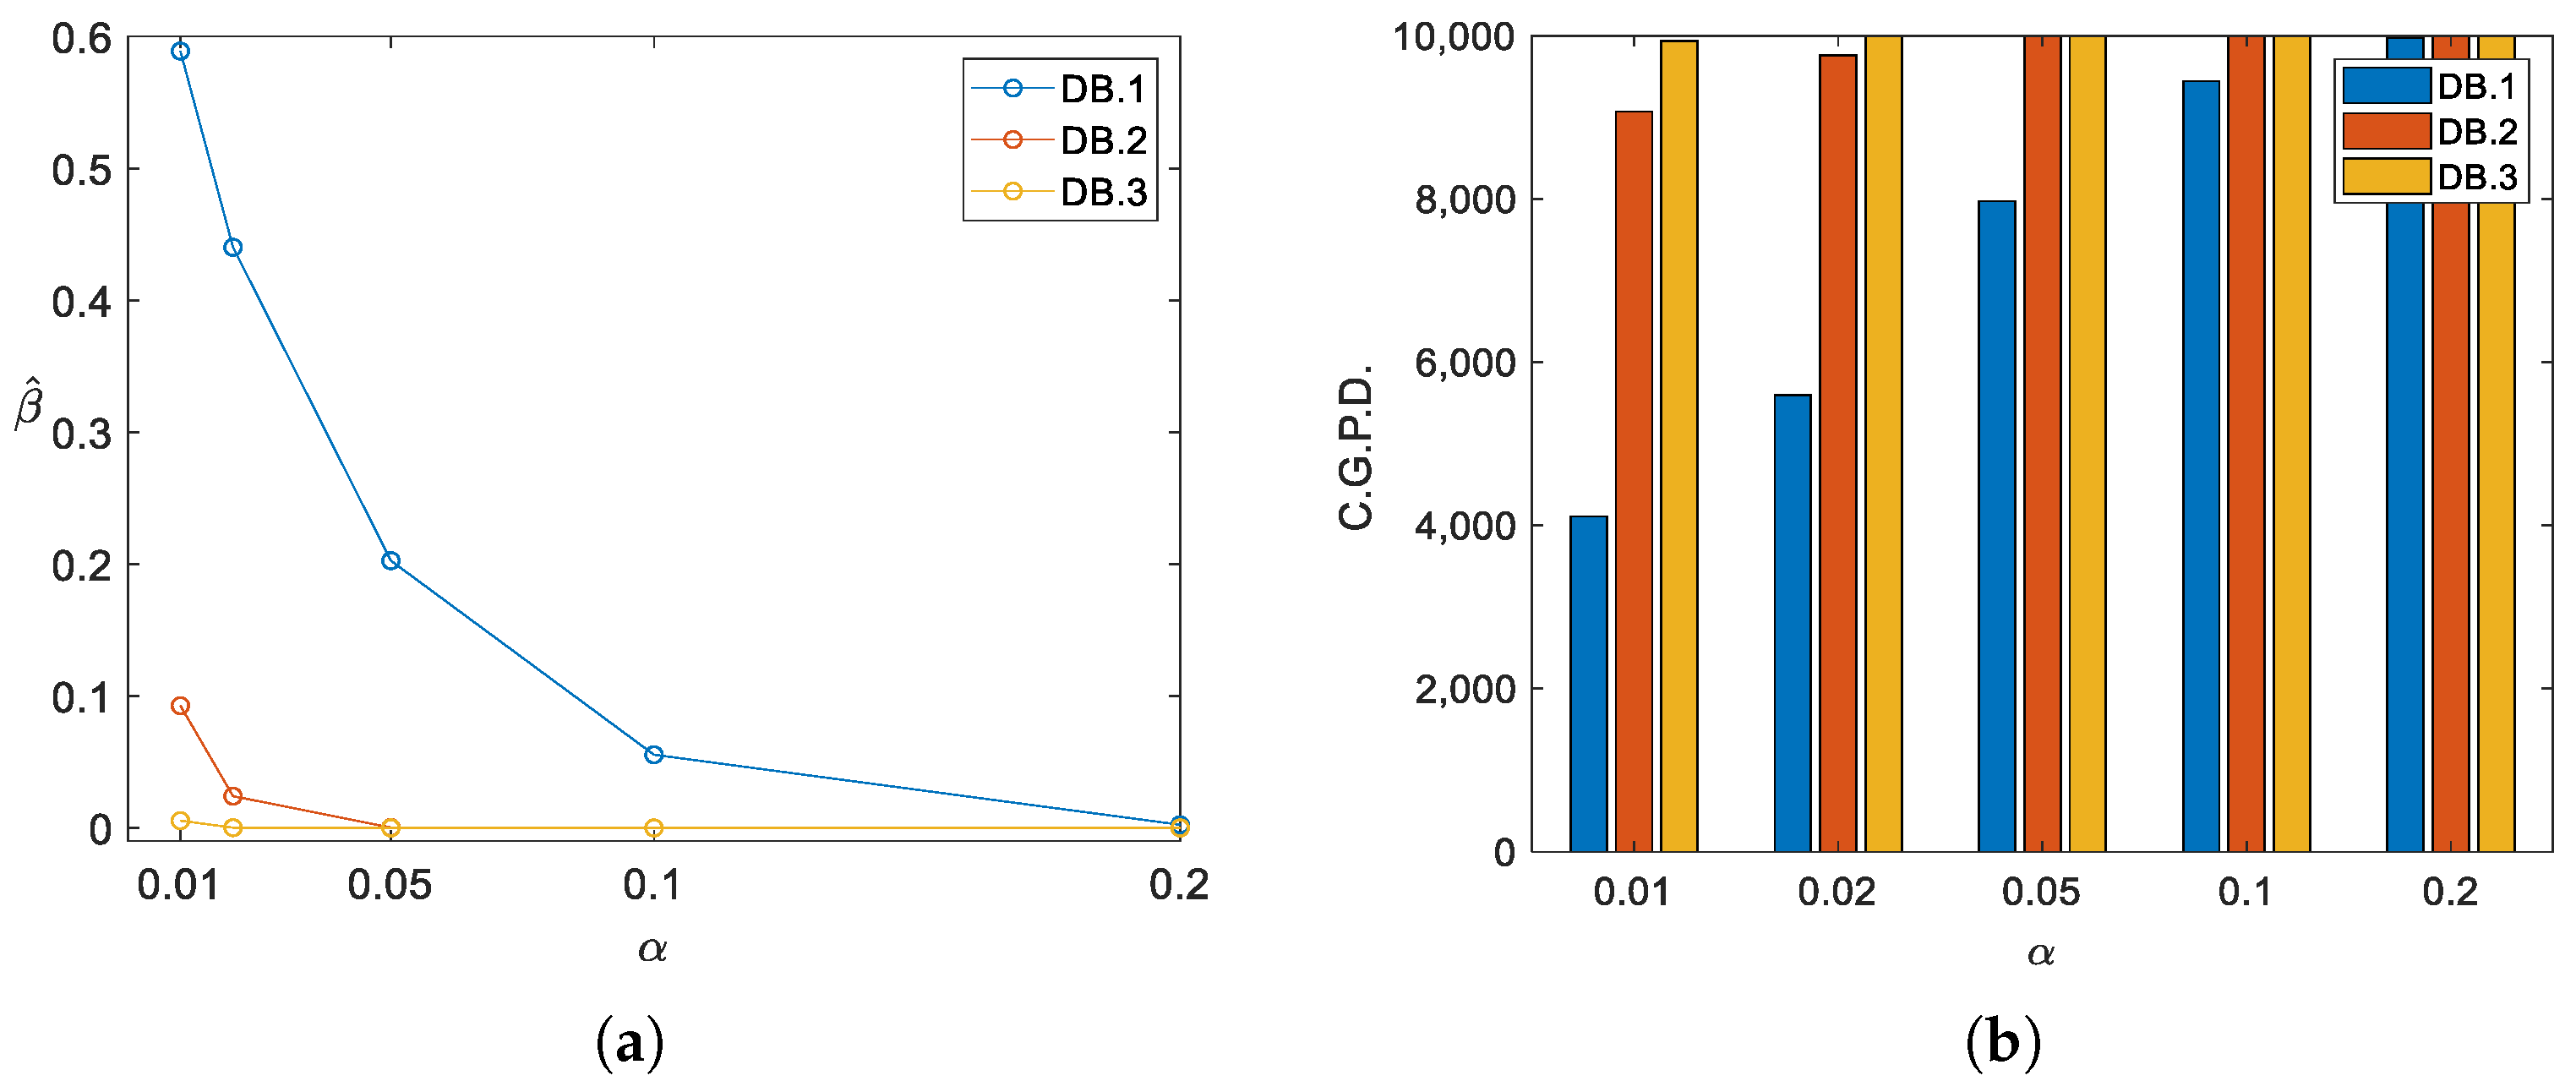
Experiment 3: To evaluate the effectiveness of the proposed test in detecting clustered graphical passwords, a total of 30,000 graphical passwords distributed across three clustering levels were generated. The first clustering level, DB.3.1, comprises 10,000 graphical passwords generated using an aggregation distance of 410 pixels. The second clustering level, DB.3.2, comprises 10,000 graphical passwords generated using an aggregation distance of 335 pixels. The third level, DB.3.3, comprises 10,000 graphical passwords generated using a 290-pixel aggregation distance. The proposed test was applied to each of these passwords, and the number of passwords detected for each clustering level was recorded, obtaining an estimate of the type I I error committed. Table 5 and Figure 4 present the estimation of the probability of committing a type I I error. Figure 4 illustrates the number of clustered passwords detected by the test for each database.
The obtained results provide evidence of the validity and effectiveness of the proposed test. Observe that, while for DB.3.1, the minimum detection value recorded is 41.1 % , for DB.3.2 and DB.3.3, the values exceed 90.7 % and 99.4 % , respectively. This is a clear sign that the test becomes more effective with the increase in the clustering level, which is consistent with the formulated hypothesis. The test is particularly effective for the significance levels α = 0.1 and α = 0.2 , achieving detection rates of over 94.4 % and 99.7 % , respectively, in all cases. These two levels may be suitable for systems or users with high-security requirements. However, due to their high rate of false positives, using α = 0.05 as the standard for more general purposes is recommended. This threshold achieves a detection rate close to 80 % in all cases, with a false positive rate of 1 in 20.
It is important to note that this test is not only valid for 1920 × 1080 pixel images. For all images with the same aspect ratio, 16:9, the distribution of the perimeter of the convex hull of the points would be the same, only its parameters would change. Therefore, this test will not present usability problems with changing resolutions of future images of the same aspect ratio. The test can be implemented without limitations or impediments on any type of device that can be interacted with via a screen, such as mobile phones, tablets, laptops, or desktop computers.

4. Comparison with Other Tests in the Literature

The test proposed in this article was compared to the previous methods in terms of its effectiveness in detecting clustered graphical passwords and its efficiency. For this study, the tests to be compared will be denoted as follows: Test 1, which is based on the average distance between the points [9]; Test 2, which is based on the average of the perimeters of the Delaunay triangle [10]; Test 3, which is the joint application of the previous tests [12]; and Test 4, which is the test proposed in this study. Of the references consulted, the one that has shown the highest effectiveness is test 3. Therefore, it will serve as our benchmark in this regard. Regarding efficiency, the best option is test 1; we will compare our test with it.

4.1. Effectiveness

Since the clustered password databases used in this work were generated following the same algorithm described in [12], it is possible to compare the reported results directly. Table 6 shows the difference in type I I errors of Test 3 compared to the proposed Test 4.
The proposed test reduces the type I I error concerning the most effective antecedents for each of the analyzed significance levels of α . This led to an increase in the percentage of graphical passwords detected, as illustrated in Figure 5, and consequently, in the overall effectiveness of the test.

4.2. Efficiency

To assess the efficiency of the proposed tests, they were implemented in Matlab 2018 software, adhering to the guidelines outlined in their respective original articles. Subsequently, the execution time of 100 graphical passwords was measured. The results are summarized in Table 7. Regarding efficiency, the proposed test outperforms Test 3 in the three times measured but is surpassed by Test 1 in all cases.

5. Conclusions and Future Work

This paper proposes a new test for detecting clustered graphical passwords in Passpoints, extensible to all images with a 16:9 aspect ratio. This test’s novelty is that its estimated type I I error and detection rate are the best reported so far. The execution time of the test was greater in the experiments conducted than in the previous best results. However, this difference is insignificant regarding the test’s usability, as it is imperceptible to the users.
In this work, we proposed the hypothesis that the perimeter of the convex hull determined by the 5 points of a graphical password Passpoints would be an effective test statistic in detecting clustering patterns. This hypothesis is based on intuitive and visual evidence that the perimeter decreases when the points are closest. It was demonstrated using the EasyFit software 5.6 and several goodness-of-fit tests that the proposed test statistic follows a Johnson SB distribution with parameters γ = 0.65612 , δ = 1.5922 , λ = 4575.1 , ξ = 495.15 . The Johnson SB transformation was used to convert the data to a standard normal distribution. A mean test was then conducted to evaluate graphical passwords. The effectiveness experiments considered three levels of clustering, following the guidelines established by the antecedents to enable a direct comparison with them. For the first clustering level, the test was able to detect significance levels α { 0.2 , 0.1 , 0.05 , 0.02 , 0.01 } with percentages greater than 99.7 % , 94.4 % , 79.7 % , 55.9 % , and 41.1 % , respectively. In the second level, the percentages were 100 % , 100 % , 99.9 % , 97.5 % , and 90.7 % , respectively. In the third level, the percentages were 100 % , 100 % , 100 % , 99.9 % , and 99.4 % , respectively. These results allowed us to accept the proposed hypothesis and validate the effectiveness of the proposed test.
In comparison to the antecedents, it can be observed that the effectiveness was superior to that reported by other tests available in the literature for the three clustering levels and the five significance levels. Consequently, this new proposal’s estimated type I I error was also lower than that reported in previous studies, reducing up to about 0.08 in the best cases. The measured execution time of the proposed test ranks it second among the previous tests. However, the differences between these times are indistinguishable in practice. Therefore, its effectiveness is the most important factor to consider when selecting a test. The experiments conducted in this study and the comparisons made with the existing literature suggest that the proposed test is the most effective option for determining clustered graphical passwords in Passpoints. However, depending on their security needs, the significance level selection is left to the user or system. The authors recommend using a standard significance level of α = 0.05 for general purposes. With this level, a detection rate of more than 79.7 % is achieved in each case, with one false positive for every 20 attempts. Increasing the significance level to α = 0.1 or α = 0.2 allows for a reduction in the probability of committing a type I I error and increases the power of the test, reaching approximately 94.45 % and 99.76 % for those levels (Table 5). This would be advantageous for systems with high-security standards, as it would improve the detection of weak passwords. However, it would also increase the risk of obtaining statistically significant erroneous results, raising the probability of committing a type I error. In practice, this translates to a higher rate of false positives: up to 1 in 10 random passwords could be rejected with α = 0.1 and 1 in 5 with α = 0.2 . Thus, while security is improved, usability may be compromised.
The test was designed to be integrated into the graphical authentication systems of the cued-recall type, preventing users from selecting easily guessable graphical passwords with clustered patterns. The test contributes to password strength and enhances the resistance to various security threats, such as automated attacks, targeted password guessing, or dictionary attacks. However, currently, we only have values obtained through simulations and theory. The effectiveness against real attacks should be evaluated in future research.
We are currently developing our implementation of the Passpoints system, which will enable experiments to be conducted using real data and users rather than simulations as previously done in most of the background information about Passpoints. In this implementation, we will incorporate the test proposed in this article and others in the literature capable of detecting various non-random patterns in Passpoints graphical passwords. This will enable us to assess the efficacy of the tests in real-world scenarios. In future work, the hypothesis of complementarity between the newly proposed test and those already existing in the literature is left open. A possible scenario where two or more of the tests complement each other would allow for increased detection values and a reduction in type I I error. Furthermore, future research will assess the feasibility of using the convex hull area to detect regular patterns in Passpoints graphical passwords. This approach is based on the intuitive and geometric concept that the convex hull area of five regular points is greater than that of a set of random points.

Author Contributions

Conceptualization, L.S.-P., C.M.L.-P. and J.A.H.-M.; methodology, L.S.-P., C.M.L.-P., G.S.-G. and O.R.; validation, L.S.-P., C.M.L.-P. and G.S.-G.; formal analysis, L.S.-P., J.A.H.-M., C.M.L.-P., O.R. and G.S.-G.; investigation, L.S.-P., C.M.L.-P., J.A.H.-M., O.R. and G.S.-G.; writing—original draft preparation, L.S.-P., C.M.L.-P., J.A.H.-M., O.R. and G.S.-G.; writing—review and editing, L.S.-P., C.M.L.-P., O.R. and G.S.-G.; visualization, L.S.-P. and J.A.H.-M.; supervision, L.S.-P., C.M.L.-P., J.A.H.-M., O.R. and G.S.-G.; project administration, C.M.L.-P. and O.R. All authors have read and agreed to the published version of the manuscript.

Funding

This research received no external funding.

Institutional Review Board Statement

Not applicable.

Informed Consent Statement

Not applicable.

Data Availability Statement

Data is contained within the article.

Conflicts of Interest

The authors declare no conflicts of interest.

References

  1. David, L.; Wool, A. An explainable online password strength estimator. In Computer Security–ESORICS 2021: 26th European Symposium on Research in Computer Security, Darmstadt, Germany, 4–8 October 2021; Proceedings, Part I 26; Springer International Publishing: Cham, Switwerland, 2021; pp. 285–304. [Google Scholar] [CrossRef]
  2. Awan, K.; Ud Din, I.; Almogren, A.; Kumar, N.; Almogren, A. A Taxonomy of Multimedia-based Graphical User Authentication for Green Internet of Things. ACM Trans. Internet Technol. (TOIT) 2021, 22, 1–28. [Google Scholar] [CrossRef]
  3. Nosenko, A.; Cheng, Y.; Chen, H. Password and Passphrase Guessing with Recurrent Neural Networks. Inf. Syst. Front. 2023, 25, 549–565. [Google Scholar] [CrossRef]
  4. Rando, J.; Perez-Cruz, F.; Hitaj, B. PassGPT: Password Modeling and (Guided) Generation with Large Language Models. In European Symposium on Research in Computer Security; Springer Nature: Cham, Switzerland, 2023. [Google Scholar]
  5. Itti, L.; Koch, C. Computational modelling of visual attention. Nat. Rev. Neurosci. 2001, 2, 194–203. [Google Scholar] [CrossRef] [PubMed]
  6. Wiedenbeck, S.; Waters, J.; Birget, J.; Brodskiy, A.; Memon, N. PassPoints: Design and longitudinal evaluation of a graphical password system. Int. J. -Hum.-Comput. Stud. 2005, 63, 102–127. [Google Scholar] [CrossRef]
  7. Rodriguez Valdés, O.; Legón, C.; Socorro Llanes, R. Seguridad y usabilidad de los esquemas y técnicas de autenticación gráfica. Rev. Cuba. Cienc. Inform. 2018, 12, 13–27. [Google Scholar]
  8. Legón, C.; Socorro, R.; Navarro, P.; Rodríguez, O.; Borrego, E. Nuevo modelo probabilístico en autenticación gráfica. Ing. Electrón. Autom. Y Comun. 2019, 40, 92–104. [Google Scholar]
  9. Herrera-Macías, J.; Legón-Pérez, C.; Suárez-Plasencia, L.; Piñeiro-Díaz, L.; Rojas, O.; Sosa-Gómez, G. Test for detection of weak graphic passwords in passpoint based on the mean distance between points. Symmetry 2021, 13, 777. [Google Scholar] [CrossRef]
  10. Suárez-Plasencia, L.; Legón-Pérez, C.; Herrera-Macías, J.; Socorro-Llanes, R.; Rojas, O.; Sosa-Gómez, G. Weak PassPoint Passwords Detected by the Perimeter of Delaunay Triangles. Secur. Commun. Netw. 2022, 2022, 3624587. [Google Scholar] [CrossRef]
  11. Herrera-Macías, J.; Suárez-Plasencia, L.; Legón-Pérez, C.; Piñeiro-Díaz, L.; Rojas, O.; Sosa-Gómez, G. Effectiveness of some tests of spatial randomness in the detection of weak graphical passwords in passpoint. In Proceedings of the International Conference on Computer Science and Health Engineering, Virtual Event, 26 November 2020; pp. 173–183. [Google Scholar]
  12. Macías, J.; Plasencia, L.; Pérez, C.; Gomez, G. Comparación y combinación de dos test efectivos en la detección de contraseñas gráficas no aleatorias en Passpoints. Rev. Cuba. Cienc. Inform. 2023, 17, 78. [Google Scholar]
  13. Suárez-Plasencia, L.; Herrera-Macías, J.; Legón-Pérez, C.; Sosa-Gómez, G.; Rojas, O. Detection of DIAG and LINE Patterns in PassPoints Graphical Passwords Based on the Maximum Angles of Their Delaunay Triangles. Sensors 2022, 22, 1987. [Google Scholar] [CrossRef] [PubMed]
  14. Li, F.; Klette, R. Euclidean Shortest Paths. In Euclidean Shortest Paths: Exact or Approximate Algorithms; Springer: London, UK, 2011; pp. 3–29. [Google Scholar] [CrossRef]
  15. Preparata, F.; Shamos, M. Computational Geometry: An Introduction; Springer Science & Business Media: Berlin/Heidelberg, Germany, 2012. [Google Scholar]
  16. Mark, D.; Otfried, C.; Marc, V.; Mark, O. Computational Geometry Algorithms and Applications; Springer: Berlin/Heidelberg, Germany, 2008. [Google Scholar]
  17. ORourke, J. Computational Geometry in C; Cambridge University Press: Cambridge, MA, USA, 1998. [Google Scholar]
  18. Rockafellar, R. Convex Analysis; Princeton University Press: Princeton, NJ, USA, 1997. [Google Scholar]
  19. de Berg, M.; van Kreveld, M.; Overmars, M.; Schwarzkopf, O. Computational Geometry: Algorithms and Applications, 3rd ed.; Springer: Berlin/Heidelberg, Germany, 2008. [Google Scholar]
  20. Candela, C.; Sepúlveda, L.; Chavarro, J.; Meneses, C.; Sanabria, J.; Arcila, O. Implementación de algoritmos para calcular el Convex Hull. Entre Cienc. Ing. 2022, 16, 27–34. [Google Scholar] [CrossRef]
  21. Gamby, A.; Katajainen, J. A faster convex-hull algorithm via bucketing. In Proceedings of the International Symposium on Experimental Algorithms, Kalamata, Greece, 24–29 June 2019; pp. 473–489. [Google Scholar]
  22. Gamby, A.; Katajainen, J. Convex-hull algorithms: Implementation, testing, and experimentation. Algorithms 2018, 11, 195. [Google Scholar] [CrossRef]
  23. Keith, A.; Ferrada, H.; Navarro, C. Accelerating the Convex Hull Computation with a Parallel GPU Algorithm. In Proceedings of the 2022 41st International Conference of the Chilean Computer Science Society (SCCC ), Santiago, Chile, 21–25 November 2022; pp. 1–7. [Google Scholar]
  24. Tabacman, M. Implementing and Visualizing Algorithms for Computing Convex Hulls in the Plane; University of Minnesota: Minneapolis, MN, USA, 2021. [Google Scholar]
  25. Efron, B. The convex hull of a random set of points. Biometrika 1965, 52, 331–343. [Google Scholar] [CrossRef]
  26. Groeneboom, P. Limit theorems for convex hulls. Probab. Theory Relat. Fields 1988, 79, 327–368. [Google Scholar] [CrossRef]
  27. Khamdamov, I.; Chay, Z.; Sharipova, L. The limit distribution of the perimeter of a convex hull generated by a Poisson point process in a convex polygon. Vestn. Tomsk. Gos. Univ. Mat. Mekhanika 2022, 44–57. [Google Scholar] [CrossRef]
  28. McRedmond, J.; Wade, A. The convex hull of a planar random walk: Perimeter, diameter, and shape. Electron. J. Probab. 2018, 23, 1–24. [Google Scholar] [CrossRef]
  29. McRedmond, J.; Fergal, W. Convex Hulls of Random Walks; Durham University: Durham, UK, 2019. [Google Scholar]
  30. NIST Special Publication 800-63B; Digital Identity Guidelines. Authentication and Lifecycle Management. NIST Special Publication: Gaithersburg, MD, USA, 2017. [CrossRef]
  31. Ray, P. Ray’s scheme: Graphical password-based hybrid authentication system for smart hand-held devices. J. Inf. Eng. Appl. 2012, 2, 1–12. [Google Scholar]
  32. Dirik, A.; Memon, N.; Birget, J. Modeling user choice in the PassPoints graphical password scheme. In Proceedings of the 3rd Symposium on Usable Privacy and Security, Pittsburgh, PA, USA, 18–20 July 2007; pp. 20–28. [Google Scholar]
  33. Van Oorschot, P.; Salehi-Abari, A.; Thorpe, J. Purely automated attacks on passpoints-style graphical passwords. IEEE Trans. Inf. Forensics Secur. 2010, 5, 393–405. [Google Scholar] [CrossRef]
  34. Zhu, B.; Wei, D.; Yang, M.; Yan, J. Security implications of password discretization for click-based graphical passwords. In Proceedings of the 22nd International Conference On World Wide Web, Rio de Janeiro, Brazil, 13–17 May 2013; pp. 1581–1591. [Google Scholar]
  35. Floch, J.; Marcon, E.; Puech, F. Spatial distribution of points. In Handbook of Spatial Analysis: Theory and Application with R; Loonis, V., Bellefon, M.P., Eds.; Eurostat: Paris, France, 2018; pp. 77–111. [Google Scholar]
  36. Chiasson, S.; Forget, A.; Biddle, R.; Oorschot, P. User interface design affects security: Patterns in click-based graphical passwords. Int. J. Inf. Secur. 2009, 8, 387–398. [Google Scholar] [CrossRef]
  37. Pogoda, P.; Ochał, W.; Orzeł, S. Performance of Kernel estimator and Johnson SB function for modeling diameter distribution of black alder (Alnus glutinosa (L.) Gaertn.) stands. Forests 2020, 11, 634. [Google Scholar] [CrossRef]
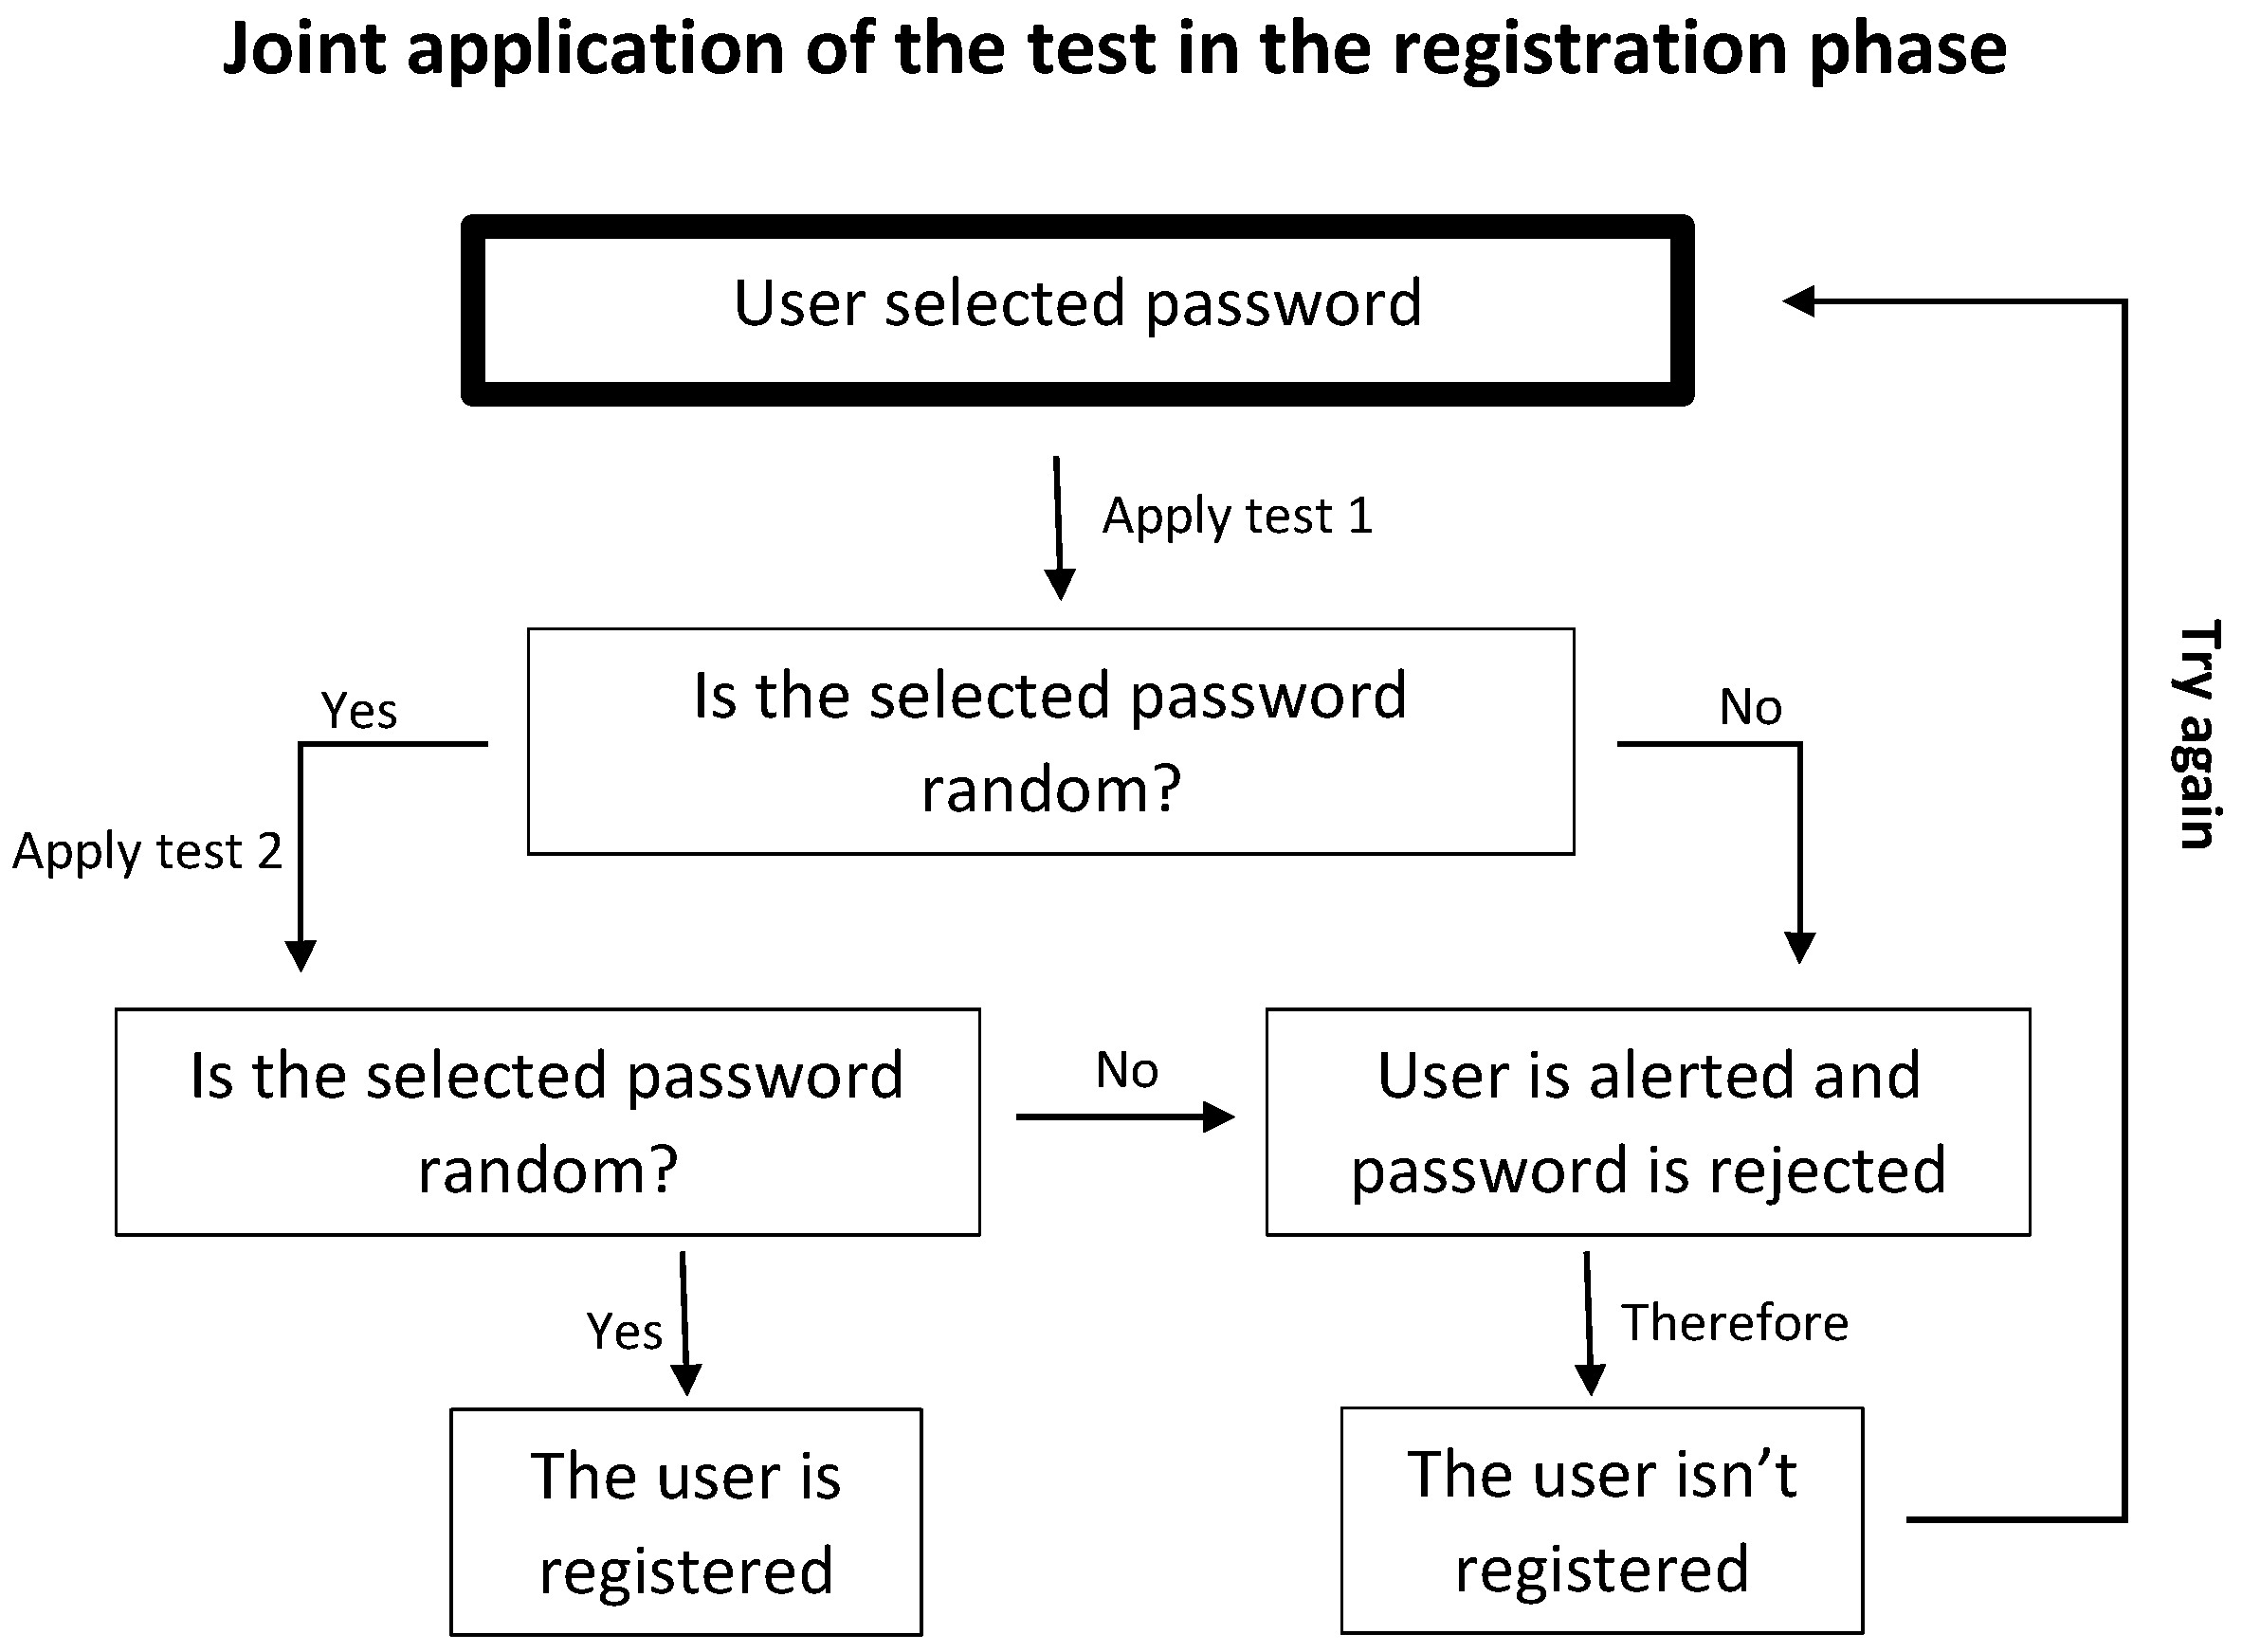
Figure 1. The joint application scheme of the known tests to detect graphical passwords in Passpoints.
Information 15 00447 g001
Figure 2. Convex hull determined by the points of a clustered (a), random (b), and regular (c) password.
Information 15 00447 g002
Figure 3. Histogram of the perimeter database of the convex hull and its fit to a Johnson SB distribution.
Information 15 00447 g003
Figure 4. Estimated probability β ^ of committing a type I I error (a), clustered graphical passwords detected (C.G.P.D.) by the proposed test (b).
Information 15 00447 g004
Figure 5. Number of clustered graphical passwords detected by each of the tests in the databases DB.3.1 (a), DB.3.2 (b), and DB.3.3 (c).
Information 15 00447 g005
Table 1. Number of clustered graphical passwords detected using the joint application of both tests for each of the three clustering levels, consisting of 10,000 passwords each. Taken from [12].
Significance
Level
First Clustering
Level
Second Clustering
Level
Third Clustering
Level
0.2992210,00010,000
0.1935810,00010,000
0.057931998710,000
0.02536595769987
0.01365283009805
Table 2. Results of the goodness-of-fit tests applied to the Johnson SB distribution estimated from the data contained in DB.1, for the significance levels α { 0.02 , 0.01 , 0.05 , 0.1 , 0.2 } .
Goodness-of-Fit TestKolmogorov–SmirnovChi-SquareAnderson–Darling
p-value0.98139Accepted0.79775
Accepted for each α 5/55/55/5
Table 3. Parameters of the Johnson SB distribution ( γ , δ , λ , ξ ) of the perimeter of the convex hull P P E C J S B ( γ , δ , λ , ξ ) .
Image Size γ δ λ ξ
1920 × 1080 0.65612 1.5922 4575.1 495.15
Table 4. Comparison between the probability of committing a type I error by the test ( α ^ ) and the expected theoretical error ( α ).
α (Theoretical) CR . of H 0 α 1 ^  DB.2
0.2 Z < 1.282 or Z > 1.282 0.2029
0.1 Z < 1.645 or Z > 1.645 0.1019
0.05 Z < 1.960 or Z > 1.960 0.0535
0.02 Z < 2.326 or Z > 2.326 0.0234
0.01 Z < 2.575 or Z > 2.575 0.0136
Table 5. Estimated probability ( β ^ ) on DB. 3.1 , DB. 3.2 , and DB. 3.3 of accepting a clustered graphical password as a random password.
Significance
Level
Critical
Region
( β ^ )
DB.3.1
( β ^ )
DB.3.2
( β ^ )
DB.3.3
0.2−1.282 < Z < 1.2820.002400
0.1−1.645 < Z < 1.6450.055500
0.05−1.960 < Z < 1.9600.20260.00030
0.02−2.326 < Z < 2.3260.44020.02410.0002
0.01−2.575 < Z < 2.5750.58890.09270.0055
Table 6. Variation (↓) in the estimated probability of the type I I error ( β ^ ) committed by the test 4 concerning test 3 in the DB. 3.1 , DB. 3.2 , and DB. 3.3 .
Significance
Level
Critical
Region
( β ^ )
DB.3.1
( β ^ )
DB.3.2
( β ^ )
DB.3.3
0.2−1.282 < Z < 1.282↓0.005400
0.1−1.645 < Z < 1.645↓0.008700
0.05−1.960 < Z < 1.960↓0.0043↓0.00100
0.02−2.326 < Z < 2.326↓0.0233↓0.0241↓0.0011
0.01−2.575 < Z < 2.575↓0.0459↓0.0773↓0.0140
Table 7. Execution times (s), taking 100 passwords as a sample.
Minimum TimeAverage TimeMaximum Time
Test 10.0010.0060.084
Test 30.0010.0450.155
Test 40.0170.0330.110
Disclaimer/Publisher’s Note: The statements, opinions and data contained in all publications are solely those of the individual author(s) and contributor(s) and not of MDPI and/or the editor(s). MDPI and/or the editor(s) disclaim responsibility for any injury to people or property resulting from any ideas, methods, instructions or products referred to in the content.