Abstract
This paper investigates the stability and motion of two interactive oscillating agents. Multiple agents can be controlled in a centralized and/or distributed manner to form specific patterns in cooperative tracking, pursuit, and evasion games, as well as environmental exploration. This paper studies the behavior of two oscillating agents due to their interaction. It shows that, through a combination of selecting oscillation centers and interaction gain, a variety of motions, including limit-cycles and stationary behavior, can be realized.
1. Introduction
In a multiple-agent system, a set of agents are controlled to achieve consensus, realize converged flow, or form a specific pattern. To this end, each agent may obtain a command from the control center and observe neighboring agents to adjust its motion. Many different control laws or protocols have been investigated in the past to realize consensus, flocking, or formation control [1,2,3,4]. Often, multiple agents are deployed and controlled in coverage applications such as reconnaissance, surveillance, tracking, search and rescue, prey capture, and exploration. To this end, formation patterns that can be established in a multi-agent system are typically point (rendezvous), line (flocking), circle, or epicycle patterns [5].
An important application of employing multiple agents is conducting circumnavigation tasks. In this application, agents are controlled to encircle a site or target for patrolling, area defense, or collaborative tracking. Different circumnavigation control strategies based on range, bearing, or both were previously developed; see [6,7,8,9,10], among many others. In particular, the circular formation of a group of agents was surveyed in [11]. In [12], the approach of a Hopf oscillator is applied to a group of cyclically connected agents to analyze the behavior of a modified cyclic pursuit protocol. In essence, the agents circle around the site/target at some range and so that the site/target is properly monitored. An agent that manifests an oscillation motion about a point is termed an oscillating agent, and the point is the oscillation center. When multiple oscillating agents coordinate their motions, it can be expected that more complex motions can be realized. The concept of oscillation or a limit-cycle has been adopted in the past for the coordination and control of multiple agents. In [13], an angular rate control strategy is developed to form an evenly distributed circular formation. In [14,15], a circular formation is achieved by using limit-cycle-based techniques. Limit-cycle-based design has also been investigated for collision avoidance in multi-agent systems [16]. The significance of realizing a circular formation or limit-cycle behavior is the ability to achieve dynamic coverage for a protected area. This can be envisioned as the use of a set of mobile robots to patrol a factory or the deployment of a cluster of unmanned aerial vehicles for area surveillance. In such applications, it is also desirable to realize the formation of mobile agents with limited supervisory control. This paper aims to investigate the interaction control of mobile agents to realize complex behavior. More precisely, we consider the use of oscillating agents in the formation of patterns.
This paper aims to investigate the dynamics, stability, and formation pattern of two interactive oscillating agents. This work differs from previous results in considering a case in which the oscillation centers of different agents are not identical. In practice, the control of multiple agents may be achieved in a holistic manner in which the control center issues some feedforward command to provide information about a target or oscillation centers and the agents perform actions by fusing the information from the control center and local measurements with respect to their environment or other agents. The latter is often implemented in distributed feedback control arrangements. This paper assumes that the control center facilitates the delivery of oscillation center information to each agent and that each agent carries out a self-oscillation motion about the oscillation center while taking line-of-sight measurements with respect the other agents for control. The oscillation center itself can be physical, such as a site to be protected or a target to be tracked. It can also be a virtual center synthesized by the control center to achieve some mission requirement. Moreover, the oscillation center can be obtained by processing measurements from the agents through a joint tracking scheme. This paper considers the dynamics of two oscillating agents to succinctly show the roles of two important parameters, interaction gain and the separation of the oscillation centers, on the resulting stability and formation pattern of the agents. The results can serve as a basis for generalization to three or more agents.
The contributions of the paper are as follows:
- The introduction of oscillating agents in the formation and coverage control of a multiple-agent system. This may complement agent models including single-integrator, double-integrator, dynamic, and nonholonomic constrained models.
- For a system that contains two interactive oscillating agents, the roles of two parameters, interaction gain and the separation of the oscillation centers, are thoroughly investigated. The number of equilibrium points, local stability around each equilibrium point, and the formation pattern are explicitly characterized in terms of the two parameters.
- The two agents are shown to be able to be stationary for a static coverage application or subject to limit-cycle motion for a dynamic coverage application. Furthermore, by adjusting the interaction gain from attractive to repulsive, different motion patterns can be fulfilled to serve specific mission needs.
The rest of this paper is organized as follows. In Section 2, the dynamics of interactive oscillating agents are introduced. The equilibrium points of a system that contains two interactive oscillating agents are characterized. In addition, the stability of the equilibrium point is analyzed and related to two parameters: interaction gain and the separation between the oscillation centers. In Section 3, motion patterns are discussed. It is shown that the agents may be stationary or subject to limit-cycle motions by adjusting the two aforementioned. Some simulation results are presented in Section 4 to verify the analysis results. Finally, conclusions are given in Section 5.
2. Stability of Two Interactive Oscillating Agents
This section analyzes the dynamics of a system that comprises two interactive oscillating agents. The stability of the system is then characterized in terms of key parameters including the separation between the oscillation centers and the level of interaction gain. An oscillating agent is noted for its circular motion and range-maintaining property. In the following section, an oscillating agent is assumed to be governed by the following equation of motion:
where is the position of the agent in , is a skew symmetric matrix that characterizes the rotation, is the oscillation center, and is the control input. If the initial condition of is not the same as the oscillation center , then, in the absence of control input, the position of the agent in the steady state is known to be given by
for some . This corresponds to an oscillatory trajectory centering at with radius 1. In practice, an agent that undergoes an oscillatory motion can be used for patrolling, search, and area defense applications. It is noted that the oscillation frequency and radius of the oscillating agent can be adjusted by scaling the matrix as for some and replacing the term in (1) as for some , respectively. In the paper, we consider the agent in (1) and it is pointed out that the results can be generalized to agents with different oscillation frequency and radius. The above oscillating agent model can be used to describe the behavior of a fixed-wing aircraft under coordinated fixed-altitude flight or a wheeled robot under constant turning condition. In other words, the agent is capable of exhibiting a circular motion; the paper aims to investigate the emergent behavior under interaction.
The paper attempts to investigate the dynamics and motions of two oscillating agents when they are coupled in the sense that the control input of an agent is affected by the relative position with respect to another agent. More precisely, suppose that and are the oscillation centers of the two agents at and , respectively. Under the aforementioned control strategy, the motions of the agents are governed by
where k is the interaction or control gain. In this formulation, the motion of the agent is affected by the self-oscillating component and the interaction component, which is characterized as a linear function of the line-of-sight vector. Clearly, if the interaction gain k is zero, then the two agents oscillate about their respective centers independently. As will be discussed in the paper, a change in the interaction gain may result in a change in the number of equilibrium points and stability properties. The agents may then undergo limit-cycle or stationary motions, depending on the selection of the interaction gain. Further, the setting of the oscillation centers may also affects the results. An application scenario of the results is for the control center to dispatch two agents to cover an area. The two agents can interact in an event to autonomously gain dense coverage of certain region or remain at fixed points to meet some surveillance or monitoring requirements.
Let and be the deviated state of the two agents from their respective oscillation centers; then, the dynamic Equations (3a) and (3b) can be expressed in terms of the deviated state vectors as
where is the separation between the two oscillation centers. In the following two sections, the equilibrium points and stability of the system (4a) and (4b) will be analyzed.
2.1. Analysis of Fixed Points
The fixed points of (4a) and (4b) are determined by finding constant and , in the sense that and . This can be equivalently stated as
Equation (5) is independent of the vector and will be used to establish a relationship between and . Further, (6) will be explored to render a characterization of the equilibrium state. Note that and are orthogonal to each other, that is, ; one can thus express as
for some and . From (7), it can be shown that
Substituting the above expressions (7) and (8) into (5) yields
where . Combining the above two equations then results in a constraint on and :
It is claimed that the only solution to (11) is and . In addition, the equilibrium state of the system is reached at
To see this, let be the left-hand side of (11). It is clear that ; that is, and constitute a solution of (11). Let and for some r and in which r is assumed to be non-negative. Some manipulations reveal that the function can be expressed in terms of r and as
Thus, the function is non-negative and the minimal is achieved at . As a result, the only solution to (11) is and . In view of (7), (12) is obtained.
Let and ; then, (6) can be rewritten as
Consequently, the vector is solved from (13) as
By using the orthogonality property between and , one has
Therefore, one can solve from the cubic polynomial Equation (15) and determine the equilibrium state from (14). It is stressed that any admissible solution of (15) is required to be real and non-negative. The number of solutions can indeed be analyzed by examining the intersections between the curve , which corresponds to the left-hand side of (15) and the level for positive l. This curve increases from 0 at and approaches asymptotically when l is sufficiently large. Thus, a non-negative solution can always be found.
Let . There exists three admissible solutions (counting multiplicities) of in (15) if k and satisfy
and
Otherwise, there is only one real and non-negative solution to (15). Indeed, for the cubic function , its critical points which are l such that the slope of the function is zero, i.e., , are given by
Clearly, if the critical points are not real or are negative, then the curve is monotonically increasing for and there exists only one solution. Further, it can be shown that the point which satisfies is the bound on k. In other words, if , the polynomial is monotonically increasing for positive l and there is one intersection at with the level . Moreover, if (16) is satisfied, it is known that the local maximal of occurs at the critical point , while the local minimum occurs at . There will be only one solution if or . On the other hand, the cubic function intersects the level three times if
Substituting and into (18) yields (17).
The number of solutions depends on the selection of the interaction gain k and the distance between the oscillation centers . Figure 1 depicts the diagram of number of equilibrium points as a function of k and . It is found that, for a given , a small change of the interaction gain k may result in a drastic change of the number of equilibrium points. This figure can serve in the bifurcation analysis as a variation of the parameter k or crosses the boundary may lead to a change of the number of equilibrium points and, hence, the behavior of the system. The pivot point in the diagram is at and . At this pivot point, (15) has three identical solutions as the equation can be factorized as .
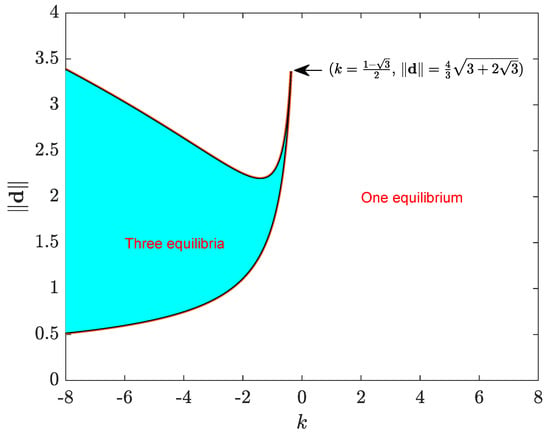
Figure 1.
Number of equilibrium points diagram in terms of k and .
Figure 1 also illustrates that the behavior of the system may differ significantly as the sign of k is changed. In the positive extreme when , the solution is approximately and the corresponding , from (14), becomes . Recall that the equilibrium state of the first agent at is given by , while that of the second agent at is . As a result, if , then the equilibrium states of the two agents approach each other. In contrast, in the negative extreme when , there are three equilibrium points. Through a perturbation analysis, it can be shown that the three solutions can be approximated, respectively, as
Some computations reveal that the corresponding equilibrium points are, respectively,
Note that the first equilibrium point is the same as the equilibrium point when . The remaining two equilibrium points are related in the sense that their sum is and their difference is . The sum does not vary when k is negative and large.
2.2. Stability Analysis
The subsection proceeds to analyze the stability of the system. Around the equilibrium, the perturbed state vectors are defined as
Some manipulations reveal that the dynamic equations in terms of the perturbed state vectors are
where stands for the identity matrix. The local stability can thus be assessed in terms of the linearized model by neglecting the high order terms. From (21a) and (21b), the linearized model is given by
The system matrix is similar to . Thus, the stability is governed by the following two matrices: and .
Theorem 1.
The equilibrium point is stable if k and the corresponding satisfy the following three conditions
- 1.
- 2.
- 3.
Proof.
The sub-matrices of the system dynamics bear the form for some . It can be shown that the characteristic polynomial of is given by where and are components of . As , the characteristic polynomial can be rewritten as . The roots of the characteristic polynomial are then evaluated as . Hence, the eigenvalues of the matrix are given by and those of the matrix are . The system at the equilibrium point is stable if the eigenvalues have negative real parts. As the eigenvalues differ by in their real parts, it can then be deduced that under , the equilibrium is stable if and only if the real part of is negative. On the other hand, if , the stability is assured if and only if the real part of is negative. One can further categorize the situations by examining whether is greater than 1 or whether the eigenvalues are real. Four cases and stability criteria can then be established:
- 1.
- and . Stable if .
- 2.
- and . Stable if .
- 3.
- and . Stable if .
- 4.
- and . Stable if .
A further analysis reveals that the stability condition in case 1 is automatically satisfied. Combining the conditions in cases 2, 3, and 4, the three conditions in the statement of the theorem are obtained. □
Figure 2 depicts the stability region of k and , as stated in Theorem 1. The figure also illustrates the curve on the boundary as discussed. If , then the applicable criterion for the stability assessment is . It is noted that, if and , then the eigenvalues are and . If the interaction gain k is negative, then the equilibrium is stable only when is sufficiently large. Figure 2 also depicts that the pivot point which satisfies and there is one eigenvalue that is located at 0. The two corner points in the figure and are the intersections of the curve with and , respectively. At the cusp , the eigenvalues are 0, 0, , and and the system is marginally stable. Note that the other corner point can never be reached in practice. Indeed, when k is zero, the corresponding for achieving equilibrium is . Apparently, the point is in the unstable region in the figure. It is nevertheless important to note that even though the stability region in the (k,) plane appears to be connected, the fact that the segment with in the stable region cannot be realized implies that the stability region is in fact disconnected. This will further discussed in the following.
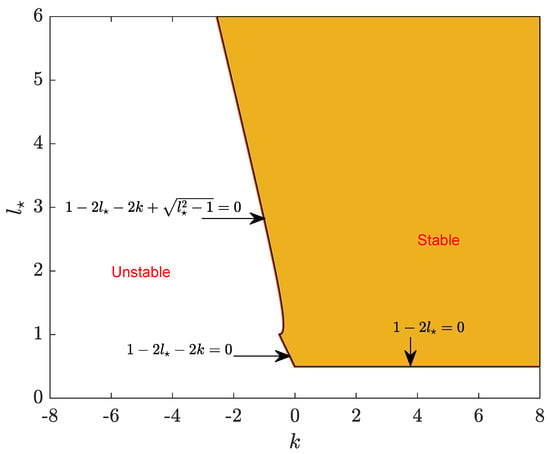
Figure 2.
Stability diagram of k and .
Theorem 1 provides criteria on k and for the assessment of local stability. It is desired to establish bounds in terms of k and for the evaluation of stability. This issue will be addressed by considering attractive interaction in which k is positive and repulsive interaction in which , respectively.
In the attractive interaction scenario, it is known that there exists only one solution of in (15). Further, the stability is assured if . Re-examining (15), it can be deduced that if and only if
The stability criterion thus is restated as the condition on the interaction gain k and the separation between the two oscillation centers .
The situation becomes more subtle under repulsive interaction as there may exist three equilibrium points. The objective is to determine the combination of k and , such that there exists at least one stable equilibrium point. To this end, the approach is to characterize the condition that the real part of is less than zero in terms of k and through (15). Recall that the above stability condition can be cast into two cases depending on whether is greater than 1. Consider the region in the plane which is governed by , , and . This region is indeed the triangle formed by , , and . Substituting the expressions into (15), the following inequality on k and is obtained.
In other words, under repulsive interaction, there exists a stable equilibrium point if (24) is satisfied. A similar manner can be adopted to account for the region governed by , and . It turns out that the bound is
This is one of the bounds in (17) for the existence of three equilibrium points. To see this, note that if (25) is satisfied, there then exists a solution of (15) and . For such an and with , the conditions in Theorem 1 are met and the stability is assured. The above results are summarized in terms the following theorem.
Theorem 2.
Figure 3 depicts the region of the combination of k and , such that there exists at least one equilibrium point that is stable. The stability region is divided into attractive and repulsive interaction sub-regions. The boundary of the attractive sub-region is governed by (23). A point with and is highlighted as this is the minimal separation distance between two oscillation centers under attractive interaction for the equilibrium point to be stable. In other words, if the separation is less than this minimal distance, there does not exist a stable equilibrium point under . Another point that is worth mentioning is the point with and . For any combination of k and , if and , the resulting system has one equilibrium point and this equilibrium point is stable. In contrast, the boundaries of the repulsive sub-region are determined by (24) and (25). This sub-region under is established by checking to be greater than the minimum of and for . These two boundaries intersect at and as marked in the figure. When , the boundary is governed by (24). On the other hand, when , it is (25) that determines the boundary.
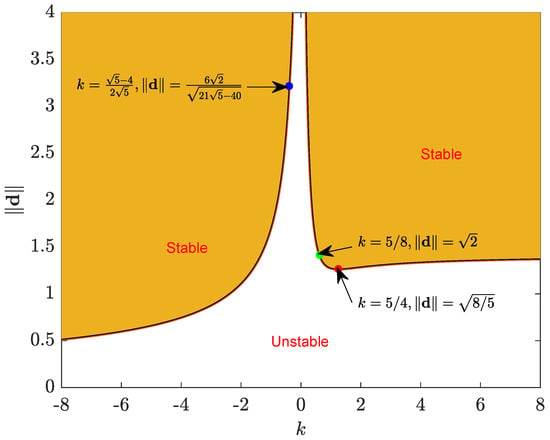
Figure 3.
Stability diagram of k and .
It is observed that some combination of k and results in a system that contains more than one stable equilibrium points. This combination of is located in the intersection of (16), (17), and (24). This region is characterized by three intersection points: , , and . The first intersection point is the pivot point discussed in (16) and (17), the second intersection point is the as mentioned in the previous paragraph, and the last intersection point is the intersection of and . Note that the last intersection point corresponds to the cusp in Figure 2. The region is marked in red in Figure 4 in which the combination of k and results in two stable equilibrium points. As an example, the point results in a system with two stable equilibrium points. The first stable equilibrium point is characterized by , , and the eigenvalues are , , , and . The eigenvalues of the second stable equilibriums point are located at and with and . Therefore, the behavior of the agents may be highly complex if the parameters are selected to be around this region.
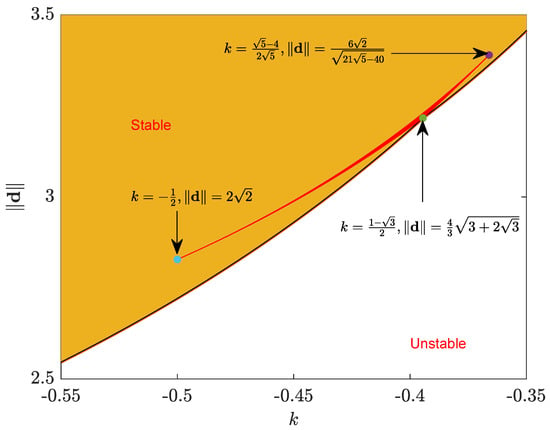
Figure 4.
Stability diagram of k and . The region is red contains two stable equilibrium points.
3. Motion Patterns of Two Interactive Oscillating Agents
In this section, the motion of two interactive oscillating agents will be investigated. From the previous section, it is known that two agents may be stationary or subject to limit-cycle motion depending on the separation of the oscillation centers and interactive gain. In practice, the two agents may be dispatched to an area with assigned oscillation centers from the central controller and the interaction is accomplished in a distributed or autonomous manner. Understanding the behavior or motion pattern will thus be useful in the operation.
3.1. Coincident Oscillation Centers
Under the situation that the two oscillation centers are the same, i.e., or , the admissible solution of (15) is zero and the resulting is the zero vector. From the stability analysis in the previous section, it is known that the system is unstable. Further, the dynamic Equations (21a) and (21b) are simplified as
In terms of polar representation, one can express and , respectively, for some , , , and . Substituting these expressions into (26a) and (26b) results in
Theorem 3.
In the presence of and non-zero initial conditions of and , the two agents undergo in-phase oscillation motions of the same orbit with oscillation frequency 1 and radius 1 in the steady state if the interaction gain k is positive. If the interaction gain k is negative, then the two agents exhibit opposite-phase oscillation motion in the same orbit with oscillation frequency 1 and radius in the steady state.
Proof.
Dividing (27b) and (27d) by and , respectively, and taking the difference lead to
Thus, one can conclude that, in the steady state, the two angles and satisfy
Thus, the two agents undergo in-phase motions when k is positive and opposite-phase motions when k is negative. Furthermore, in the steady state, and, consequently, . This further implies that
In other words, the oscillation frequency is 1. By combining (27a) and (27c), it can be shown that the equilibrium points of the and satisfy the condition in the steady state. If , the equilibrium points are given by and . The former is unstable. Thus, the agents will eventually oscillate with radius 1 if and the initial condition is not zero. On the other hand, if the interaction gain is repulsive, then the equilibrium points are and . Again, the former is unstable and the latter is attractive. As a result, in the case of repulsive interaction, the agents will oscillate in the opposite phase with a frequency of 1 and a radius of in the steady state. □
It is remarked that both the in-phase and the opposite-phase motions are useful in the deployment of agents. In the in-phase situation, the two agents are sufficiently close and orbit around the circle to conduct a patrolling-like mission. The two agents, being sufficiently close, can thus better coordinate in response to any event. As the agents are actually rendezvous in theory, some collision avoidance or reactive control scheme can be imposed to ensure that the agents are sufficiently close and collision free. The use of repulsive interaction may be beneficial in the surveillance applications in which the two agents are located at the opposite side of the circular orbit, enhancing the temporal coverage property. Further, the radius of the circular orbit can be adjusted by tuning the repulsive gain. This implies that the approach can be used in sweep coverage applications such as search and data collection. In this application, the minimal radius is prescribed and the two agents can tune the repulsive interaction gain to increase the radius of their orbits.
3.2. Distinct Oscillation Centers
If the oscillation centers are distinct, the motion of the agents can be stable or unstable. In the former, the agents in the steady state may reside on the fixed points, which has been discussed in the previous section. It is noted that the motion will not become unbounded due to the attraction of the third-order terms in the system. Thus, in the unstable case, the agents are subject to limit-cycle motions. This limit-cycle motions, as analyzed in Figure 3, occur when is small or when is small.
Even though limit-cycle motions are of interest in dynamic coverage, it is remarked that the case when the system is stable or when the agents reside on their respective fixed points may also be of practical use in the static coverage, maintenance, and charging of mobile agents, and so forth. Therefore, one can exploit the criteria developed in the paper to render different motion patterns at different operation phases to fulfill the mission requirements.
In [17], a taxonomy for emergent behavior analysis based on explanation exploration is proposed. The paper investigates the emergent behavior from a theoretic analysis viewpoint and verifies the result through simulations. Thus, determinsitic reproducibility and predictable behavior are expected. Verification results will be discussed in the next section. It is also remarked that the above results on stability and behavior are based on rigorous analyses. It is noted that the stability and motion analysis even for two oscillating agents can be complicated. It is believed that the results should shed light on the use of multiple agents to realize more complex behavior.
4. Illustrative Examples
To further analyze the number and stability of equilibrium points and the formation pattern, four examples are provided in the following. Recall that the behavior of the system depends on the interaction gain and the positions of the oscillation centers. The example illustrates the variation in number of equilibrium points, stability, and motion pattern as k changes for some arrangement of oscillation centers.
4.1. Example 1
The first example considers the case of identical oscillation centers in which . The motions of the two agents when the initial conditions are close to—yet different from—their respective oscillation centers are simulated under different interaction gains k. The results are depicted in Figure 5. The agents eventually converge to the same circular orbit as discussed in Theorem 3. When k is positive, the two agents rendezvous and undergo the same circular motion. On the other hand, when k is negative, the two agents are on the opposite side of the circle. It is also noted that the radius of the orbiting circle is increased to when k is negative. Indeed, the radii of the orbit when and are and , respectively.
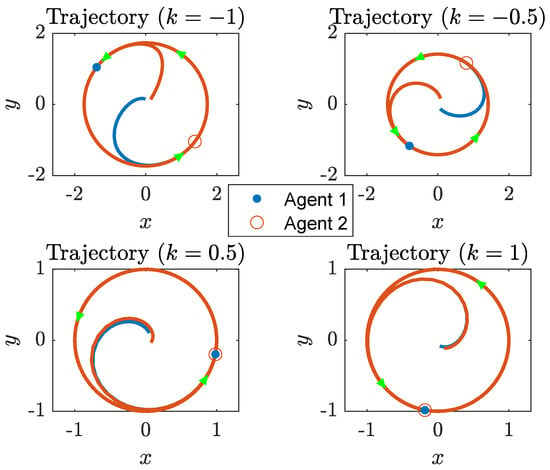
Figure 5.
Motions under identical oscillation centers. The red and blue curves are the trajectories of the agents. Note that a circular motion is formed and a consensus is reached when k is positive.
4.2. Example 2
The second example assumes that and . The oscillation centers are distinct. Yet, their separation is less than , implying that the system is unstable if the interaction is attractive. Figure 6 depicts the solution of (15) as a function of k and the corresponding , respectively. From Figure 1, there exists one equilibrium point if and three equilibrium points if . The value is the intersection of the level with the curve . The curves in the figure are depicted with different colors to reflect the stability property in Theorem 1. As stated in Theorem 2 and Figure 3, the system is unstable when . The results in the figure also verify the approximations in (19) when . The loci of are traceable to the curves of in the figure. For clarity, some representative points are marked with the corresponding value of k. The segment of that is lower than on the left plate corresponds to the loop on the right plate, in which the locus of passes through the origin when k is zero and the locus ends at when k approaches infinity. For the segment on the top on the left plate, the corresponding is the locus on the bottom on the right plate, in which one branch of the is stable. The asymptotes of are as analyzed in (20). When k increases from , the two equilibrium points move to each other, coincide at , and vanish afterward.
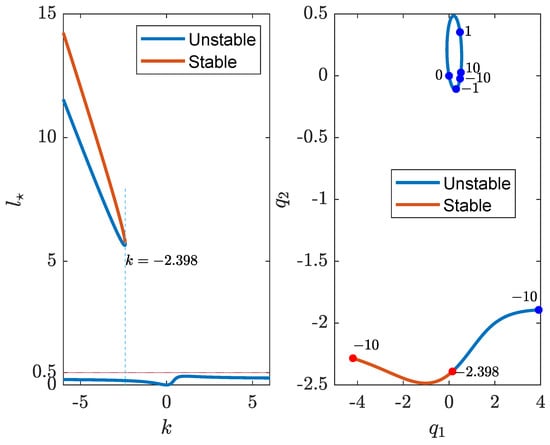
Figure 6.
The solution and as k varies.
Some simulation results of this case are depicted in Figure 7. The two agents become stationary if the interaction gain is less than , as shown in the upper-level, left-most sub-figure. If k is greater than , the two agents undergo limit-cycle motions with different centers of rotation and radius. It is observed that the two agents have different centers of rotation. Yet, their orbits are symmetric to the middle point of the oscillation centers, i.e., . The center of rotation is affected by the selection of the oscillation center and the interaction gain. Again if the interaction gain is negative, the motions appear to be opposite-phase-like. The motions become in-phase like they would if the gain were positive. Figure 8 depicts some distances that are of interest. It is noted that the motions can be roughly divided into three categories. If , the agents become stationary and the separation between the two stationary agents increases if the repulsive gain is increased. If the gain is negative and greater than , the distance between the two agents, the distance between the centers of rotation, and the apparent radius decrease if the gain increase. In the figure, the distance between agents are illustrated in terms of a green region to show the range between the maximal and minimal distances. Further, if k is positive, the aforementioned distances are monotonically decreasing functions of k. In particular, if k is sufficiently large, the two agents and the orbits become very close to each other.
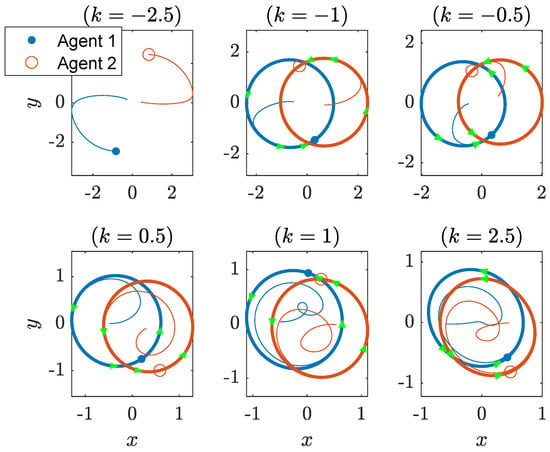
Figure 7.
Motions when .
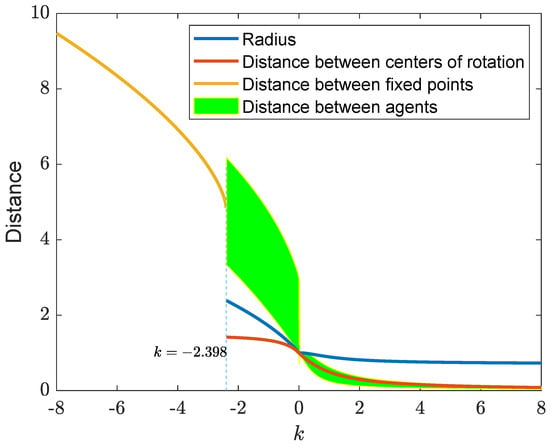
Figure 8.
Distances when in Example 2.
4.3. Example 3
In the third example, it is assumed that and . From Figure 1 and with , the number of equilibrium points may change from 3 to 1, to 3, and then to 1 as k varies from to 8. This is depicted in Figure 9, in which the solutions are plotted as a function of k. The bifurcation points of k are also illustrated in the figure and highlighted in the sub-figure. The number of equilibrium points is changed when k is , , and . Moreover, there exists a stable equilibrium point when or .
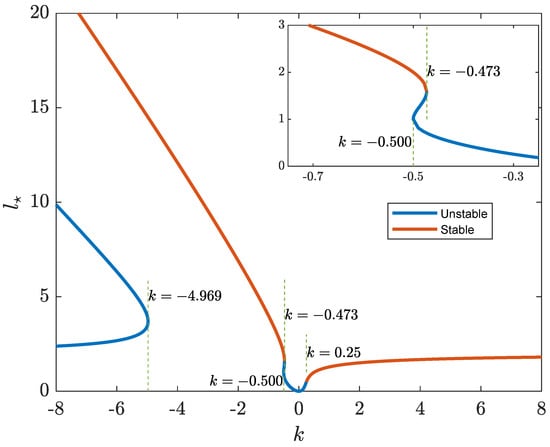
Figure 9.
Change of as a function of k in Example 3.
Figure 10 depicts some trajectory samples for different k. In this example, when k is less than or greater than , there exists a stable fixed point and the agents may become stationary in the steady state. The results are shown in the upper left plate and lower right plate for the cases of strong repulsive and attractive gains, respectively. It is noted that the two agents are stationary in the first and third quadrants, respectively, when k is negative and fix in the second and fourth quadrants, respectively, when k is positive. Furthermore, their positions are symmetric to the middle point of the two oscillation centers. When the gain is reduced, the symmetric pattern and the in-phase/opposite-phase characteristics are also valid, even though the limit-cycle motions are exhibited. Figure 11 depicts some distances of interest in this example. The distances between fixed points are the distances between the two stationary agents when the magnitude of gain is sufficiently large. This distance can be adjusted by changing the interaction gain to fulfill some static coverage requirement. A small repulsive gain yields limit-cycle motion in which the distance between the two agents may vary significantly, which is useful in collaborative tracking or observation tasks. On the other hand, a small attractive gain results in a in-phase limit-cycle motion that is beneficial in search or tracking that demands reinforcement or redundancy as the distance between the two agents do not change drastically.
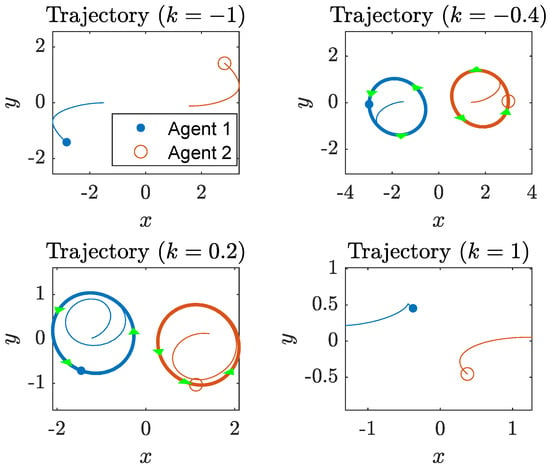
Figure 10.
Trajectories of agents under different interaction gains in Example 3.
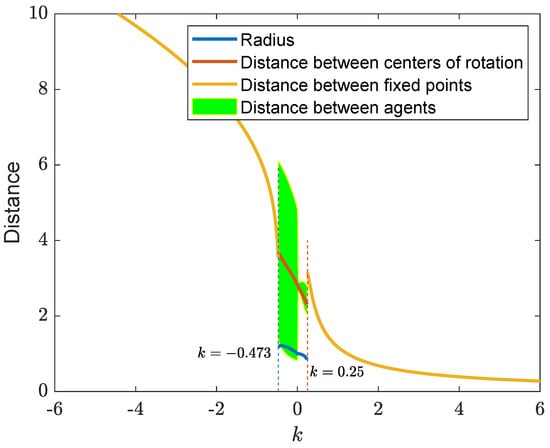
Figure 11.
Distances when in Example 3.
4.4. Example 4
Recall that the system may contain multiple stable equilibrium points if the combination of and k resides in the region that is characterized as the intersection of (16), (17), and (24). An example is , , and . The system under the above parameters contains three fixed points and two of these fixed points are stable. It is interesting to investigate the region of convergence of the stable equilibrium points. Under symmetric initial conditions, some representative trajectories are depicted in Figure 12. For Agent 1, the equilibrium points are , , and , respectively. The first two are stable equilibrium points while the last one is unstable. The unstable equilibrium point is somewhere between the two stable equilibrium points. Different colors of the trajectories are used to illustrate the convergence. For the two stable equilibrium points of Agent 1, the trajectories are in either blue or green. The blue trajectories essentially converge to . The simulation reveals that the region of attraction of the second stable equilibrium point is very restricted and is more oscillating as can be seen from the box in Figure 12. Similar results in terms of the red and purple trajectories are observed for Agent 2 in the figure.
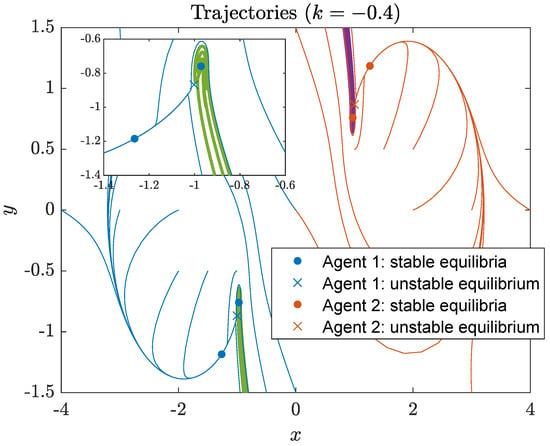
Figure 12.
Trajectories of agents under different initial conditions in Example 4.
5. Conclusions
In the multiple agent systems, each agent is controlled by a combination of centralized and distributed schemes to achieve consensus or form a coordinated formation. In the paper, the two-agent system is considered in which each agent is assumed to be an oscillating agent. In the design, the oscillation center which is assigned from the centralized control system results in a self-oscillating motion. In addition, the distributed local interaction between its neighboring agent affect the motion of the pair of agents. The paper investigates the dynamics and stability of the two-agent system. It is shown that the number of equilibrium points is subject to bifurcation when the interaction gain and/or separation between the two oscillation centers is varied. This situation is more complicated when a repulsive interaction isemployed. The stability criteria of the system are established. The bounds on the interaction gain and separation for limit-cycle motion and fixed-point operation are obtained. The results are verified through simulations. All these data may be beneficial in the operation of oscillating agents. The results shed light on the stability and control of systems with more than two agents, which will be investigated in the future.
Funding
This research was funded by the National Science and Technology Council (NSTC), Taiwan under grant MOST 111-2221-E-006-281-MY2.
Institutional Review Board Statement
Not applicable.
Informed Consent Statement
Not applicable.
Data Availability Statement
The simulation of the behavior of two interacting oscillating agents is achieved by using matlab R2023b. The assessment of the stability in Theorem 1 can be achieved by evaluating the eigenvalues of the matrix in (22). The simulation of the motion is realized by using differential equation solvers. In the paper, the ode45 of matlab is used.
Conflicts of Interest
The author declares no conflicts of interest.
References
- Jadbabaie, A.; Lin, J.; Morse, A.S. Coordination of groups of mobile autonomous agents using nearest neighbor rules. IEEE Trans. Autom. Control 2003, 48, 988–1001. [Google Scholar] [CrossRef]
- Olfati-Saber, R.; Murray, R.M. Consensus problems in networks of agents with switching topology and time-delays. IEEE Trans. Autom. Control 2004, 49, 1520–1533. [Google Scholar] [CrossRef]
- Ren, W.; Beard, R.W. Consensus seeking in multi-agent systems under dynamically changing interaction topologies. IEEE Trans. Autom. Control 2005, 50, 655–660. [Google Scholar] [CrossRef]
- Lin, Z.; Broucke, M.; Francis, B. Local Control Strategies for Groups of Mobile Autonomous Agents. IEEE Trans. Autom. Control 2004, 49, 622–629. [Google Scholar] [CrossRef]
- Juang, J.C. On the Formation Patterns Under Generalized Cyclic Pursuit. IEEE Trans. Autom. Control 2013, 58, 2401–2405. [Google Scholar] [CrossRef]
- Marshall, J.; Broucke, M.; Francis, B. Formation of Vehicles in Cyclic Pursuit. IEEE Trans. Autom. Control 2004, 49, 1963–1974. [Google Scholar] [CrossRef]
- Kim, T.H.; Sugie, T. Cooperative control for target-capturing task based on a cyclic pursuit strategy. Automatica 2007, 43, 1426–1431. [Google Scholar] [CrossRef]
- Shames, I.; Dasgupta, S.; Fidan, B.; Anderson, B.D.O. Circumnavigation using distance measurements under slow drift. IEEE Trans. Autom. Control 2012, 57, 889–903. [Google Scholar] [CrossRef]
- Greiff, M.; Deghat, M.; Sun, Z.; Robertsson, A. Target Localization and Circumnavigation With Integral Action in R2. IEEE Control Syst. Lett. 2022, 6, 1250–1255. [Google Scholar] [CrossRef]
- Zou, Y.; Wang, L.; Meng, Z. Distributed localization and circumnavigation algorithms for a multiagent system with persistent and intermittent bearing measurements. IEEE Trans. Control Syst. Technol. 2021, 29, 2092–2101. [Google Scholar] [CrossRef]
- Litimein, H.; Huang, Z.Y.; Hamza, A. A Survey on Techniques in the Circular Formation of Multi-Agent Systems. Electronics 2021, 10, 2959. [Google Scholar] [CrossRef]
- Ramachandran, K.; Juang, J.C. Application of Oscillator Dynamics for Deviated Pursuit Formations: Preliminary Results. In Proceedings of the 2021 International Automatic Control Conference (CACS), Chiayi, Taiwan, 3–6 November 2021. [Google Scholar]
- Manzoor, S.; Choi, Y. Multi-Agent Coordination Using Limit Cycles in Dynamic Environment. In Proceedings of the International Conference on Control, Automation and Information Sciences, Ansan, Republic of Korea, 27–29 October 2016. [Google Scholar]
- Wang, C.; Xie, G. Limit-Cycle-Based Decoupled Design of Circle Formation Control with Collision Avoidance for Anonymous Agents in a Plane. IEEE Trans. Autom. Control 2017, 62, 6560–6567. [Google Scholar] [CrossRef]
- Wang, C.; Xia, W.; Xie, G. Limit-Cycle-Based Design of Formation Control for Mobile Agents. IEEE Trans. Autom. Control 2020, 65, 3530–3543. [Google Scholar] [CrossRef]
- Bo, P.; Xie, G.; Qu, P. Spherical formation control of mobile target bymulti-agent systems with collision avoidance: A limit-cycle-based design approach. Neurocomputing 2021, 10, 2959. [Google Scholar]
- Gore, R.; Reynolds, P.F. An Exploration-Based Taxonomy for Emergent Behavior Analysis in Simulations. In Proceedings of the 2007 Winter Simulation Conference, Washington, DC, USA, 9–12 December 2007; pp. 1232–1240. [Google Scholar]
Disclaimer/Publisher’s Note: The statements, opinions and data contained in all publications are solely those of the individual author(s) and contributor(s) and not of MDPI and/or the editor(s). MDPI and/or the editor(s) disclaim responsibility for any injury to people or property resulting from any ideas, methods, instructions or products referred to in the content. |
© 2024 by the author. Licensee MDPI, Basel, Switzerland. This article is an open access article distributed under the terms and conditions of the Creative Commons Attribution (CC BY) license (https://creativecommons.org/licenses/by/4.0/).