Article

Enhancing Personalized Recommendations: A Study on the Efficacy of Multi-Task Learning and Feature Integration

1
School of Artificial Intelligence, Zhejiang College of Security Technology, Wenzhou 325016, China
2
School of Intelligent Manufacturing and Electronic Engineering, Wenzhou University of Technology, Wenzhou 325035, China
3
Graduate School, Angeles University Foundation, Angeles City 2009, Philippines
4
Intelligent Information Systems Institute, Wenzhou University, Wenzhou 325035, China
*
Author to whom correspondence should be addressed.
Information 2024, 15(6), 312; https://doi.org/10.3390/info15060312
Submission received: 28 April 2024 / Revised: 22 May 2024 / Accepted: 24 May 2024 / Published: 27 May 2024

Abstract

:
Personalized recommender systems play a crucial role in assisting users in discovering items of interest from vast amounts of information across various domains. However, developing accurate personalized recommender systems remains challenging due to the need to balance model architectures, input feature combinations, and fusion of heterogeneous data sources. This study investigates the impacts of these factors on recommendation performance using the MovieLens and Book Recommendation datasets. Six models, including single-task neural networks, multi-task learning, and baselines, were evaluated with various input feature combinations using Root Mean Squared Error (RMSE) and Mean Absolute Error (MAE). The multi-task learning approach achieved significantly lower RMSE and MAE by effectively leveraging heterogeneous data sources for personalized recommendations through a shared neural network architecture. Furthermore, incorporating user data and content data progressively enhanced performance compared to using only item identifiers. The findings highlight the importance of advanced model architectures and fusing heterogeneous data sources for high-quality recommendations, providing valuable insights for designing effective recommender systems across diverse domains.

1. Introduction

The rapid proliferation of online information has led to an overwhelming abundance of choices, accentuating the critical need for personalized recommender systems to deliver relevant and tailored suggestions to users. These systems play a pivotal role in enhancing user experience and engagement across various domains, including e-commerce, media streaming, and online advertising. However, developing accurate and efficient recommendation models remains a formidable challenge due to the high dimensionality, sparsity, and inherent noise in the data.
Traditional approaches, such as collaborative filtering (CF) and content-based filtering, have exhibited limitations in handling sparse data matrices and the cold-start problem [1,2]. Recent advances in deep learning have catalyzed the development of neural network-based hybrid models that synergistically combine the strengths of CF and content-based approaches [3,4]. These models learn low-dimensional embeddings and fuse them with other features through deep neural networks, enabling them to capture complex patterns and non-linear relationships.
Multi-task learning (MTL) has emerged as a promising direction, improving generalization by leveraging useful information across related tasks [5,6]. By jointly optimizing rating prediction, item preference classification, and auxiliary tasks, MTL models can effectively fuse heterogeneous feedback signals, leading to more accurate and robust recommendations.
Despite these advances, significant research gaps persist in effectively integrating heterogeneous information sources, selecting appropriate architectures, and designing tailored training objectives for recommendation scenarios [7]. Additionally, the high computational complexity and data-hungry nature of deep learning models can impede their large-scale industrial adoption [8].
Addressing these research gaps, this study conducts a comprehensive investigation into the impacts of input feature combinations and model architectures on the performance of personalized recommender systems. Extensive experiments are conducted on the MovieLens [9,10] and Book Recommendation dataset [11], evaluating various feature combinations and models. The study comprehensively evaluates a diverse set of model architectures, encompassing the normal predictor algorithm, the baseline-only method, K-Nearest Neighbors (KNN) based models, Singular Value Decomposition (SVD), single-task neural networks, and the proposed multi-task learning models. Performance is quantified using two well-established metrics: Root Mean Squared Error (RMSE) and Mean Absolute Error (MAE).
The key research questions addressed are as follows:
(1)
How do different model architectures perform in terms of recommendation accuracy, as measured by RMSE and MAE?
(2)
What is the impact of incorporating diverse input feature sets, including user identifiers, item identifiers, and content attributes, on the predictive performance of recommendation models?
(3)
Can multi-task learning improve recommendation quality by jointly optimizing auxiliary tasks beyond rating prediction?
The main contributions of this work are as follows:
(1)
Systematically evaluating the impact of various feature combinations on model performance, providing empirical guidance for feature engineering pipelines in recommender systems.
(2)
Designing a novel multi-task deep learning architecture capable of jointly optimizing rating prediction and item preference classification objectives, effectively fusing heterogeneous feedback signals.
(3)
Conducting large-scale empirical evaluations on the MovieLens dataset and Book Recommendation dataset, demonstrating the effectiveness and superiority of the proposed multi-task learning approach in improving recommendation accuracy.
The significance of this study lies in its potential to advance the field of recommender systems by providing valuable insights into building accurate and efficient models through the integration of multi-task learning and heterogeneous data sources. The findings contribute to guiding researchers and practitioners in designing effective feature engineering pipelines and model architectures, ultimately enhancing the quality of personalized recommendations. By addressing the challenges of effectively leveraging diverse data sources and selecting appropriate architectures, this work paves the way for the development of more robust and scalable recommender systems, thereby facilitating their large-scale industrial adoption.

2. Related Work

This section reviews the recent literature on recommender systems, focusing on collaborative filtering, content-based filtering, hybrid approaches, deep learning-based models, and multi-task learning.
Collaborative filtering (CF) and content-based filtering continue to serve as a foundation for recommender systems [12,13,14,15]. CF methods, such as matrix completion, remain prevalent due to their effectiveness in capturing user–item interactions [16,17]. They suffer, however, from the cold-start problem and data sparsity issues [18,19]. Content-based filtering, on the other hand, is increasingly leveraging advanced techniques for similarity computations based on user profiles and item metadata [20,21,22], which can help overcome some limitations of CF, but is still dependent on the quality and availability of data [23].
The hybrid recommender systems that combine CF and content-based filtering to harness the strengths and mitigate the limitations of both methods have seen increased interest [24,25,26,27]. CF, such as item collaborative filtering (itemCF) and user collaborative filtering (userCF) [28], is effective in modeling user interests, while content-based filtering, like the Deep Attentive Interest Collaborative Filtering (DAICF) model [29], captures rich collaborative signals and user–item interactions. By combining these approaches, hybrid systems can overcome challenges like the cold start issue, data sparsity, and improving recommendation accuracy. The fusion of CF and content-based filtering techniques offers a comprehensive solution to enhance recommendation quality and address the complexities of today’s information overload in various domains [30].
Deep learning-based approaches in recommender systems, particularly Neural Collaborative Filtering (NCF), Convolutional Neural Networks (CNNs), Recurrent Neural Networks (RNNs), and Graph Neural Networks (GNNs), have gained significant traction recently. NCF is evolving with more sophisticated architectures and transfer learning techniques [31,32]. CNNs are increasingly utilized for pattern extraction from diverse data types like text and images. RNNs and their variations are employed to model sequential user behaviors effectively [33]. GNNs are being recognized for their capability to capture intricate high-order interactions within user–item graphs, enhancing recommendation quality [34]. These advancements showcase the continuous development and diversification of deep learning techniques in recommender systems to capture complex user–item interactions and improve recommendation accuracy.
A prominent avenue of investigation revolves around the integration of knowledge graphs into recommender systems to furnish more contextually relevant and personalized recommendations. Extensive studies have delved into the technological intricacies, developmental trajectories, and contributions of knowledge graph-based recommender systems, elucidating their potential to enhance recommendation accuracy and user satisfaction through semantically rich, interconnected data representations [35].
In addition to algorithmic advancements, recent research efforts have focused on optimizing the recommender system interface and user experience. Several works have investigated the impact of factors such as online store aesthetics, visual saliency, and strategic positioning of recommendations on the efficacy of product suggestions [36,37]. Concurrently, modeling purchase intent has garnered significant attention for commercial recommenders, with approaches like fuzzy logic based on user tracking data showing promise in generating highly targeted and contextually appropriate recommendations [38]. Furthermore, the integration of cognitive computing elements into recommender systems has emerged as a novel direction, with studies exploring their potential to more accurately emulate human cognitive processes, thereby enhancing recommendation personalization and user satisfaction [38].
Multi-task learning (MTL) in recommender systems, which involves learning related tasks jointly for performance improvement, is also receiving increased attention [39,40]. Various types of tasks are being explored in this context, including but not limited to rating prediction and auxiliary tasks.
While significant progress has been made in recommender systems, challenges remain in the integration of heterogeneous data sources and in building efficient and interpretable models. It is pertinent to systematically investigate the impact of feature combinations and model architectures on recommendation performance, and propose and evaluate novel multi-task deep learning frameworks. This work aims to address these challenges by systematically investigating the impact of feature combinations and model architectures on recommendation performance, proposing a novel multi-task deep learning framework, and exploring strategies for recommendation systems.

3. Datasets

The MovieLens dataset serves as the data source for this research, comprising multiple files that provide comprehensive information about movie ratings, movie details, and user information. The following sections outline the structure and content of each file within the MovieLens dataset:
  • genome-scores.csv: This file contains the relevance scores between movies and tags. Each row represents a movie tag and its associated relevance score, indicating the degree of relevance between the tag and the movie.
  • genome-tags.csv: This file contains information about movie tags. Each row includes a tag ID and its corresponding tag content.
  • movies.csv: This file contains basic information about movies. Each row corresponds to a movie, including the movie ID, title, and a list of genres it belongs to.
  • ratings.csv: This file contains user rating records for movies. Each row represents a user’s rating for a particular movie, including the user ID, movie ID, rating value, and timestamp.
  • tags.csv: This file contains tags added by users for movies. Each row records a tag added by a user for a specific movie, including the user ID, movie ID, tag content, and timestamp.

3.1. Data Cleaning

Before data analysis and modeling, a series of data cleaning steps were performed to ensure data quality and accuracy. The primary data cleaning steps included the following:
Missing Value Handling: Various strategies were employed to handle missing values, such as deleting rows containing missing values or imputing values based on the significance and impact of the missing values in the respective columns.
Duplicate Removal: Potential duplicate records were detected and removed to avoid adverse effects on the model.

3.2. Label Encoding and Normalization

To convert non-numeric features, such as user IDs and movie IDs, into a format suitable for modeling, label encoding was performed. Label encoding aims to transform categorical variables into numerical representations that can be understood by the model for analysis and modeling purposes. The process involved assigning unique numerical labels to each distinct user ID and movie ID for processing within the model.
To ensure that all features were within a similar numerical range, preventing certain features from exerting undue influence on the model due to larger numerical ranges, feature normalization was applied. First, mean centering was performed by subtracting the mean value of each feature from all samples of that feature.
X centered = X mean X
The original data matrix is denoted as X , where each column represents a feature, and each row represents a sample.
The mean of the feature values is calculated as mean X .
Subsequently, the feature values are mean-centered by subtracting the mean from each feature value. Thereafter, each mean-centered feature value is divided by the standard deviation of the corresponding feature.
X standardized = X centered std X
The standard deviation of each feature is denoted as std X .
These data preprocessing steps ensure the applicability of the MovieLens dataset. Furthermore, the features with similar scales facilitate faster convergence during the training process, thereby providing a reliable foundation for subsequent model development and experimentation [41].

3.3. Data Analysis

The MovieLens dataset includes four features: genres, tagId, userId, and movieId. To gain insights into the dimensionality of the data, the following analysis is conducted.

3.3.1. Correlation Matrix and Heatmap

The correlation matrix is used to measure the strength and direction of the linear relationship between the variables in the dataset [42]. For a dataset containing multiple variables, each element in the correlation matrix represents the correlation coefficient between the corresponding two variables. The correlation coefficient ranges from [−1, 1], where 1 indicates a perfect positive correlation, −1 indicates a perfect negative correlation, and 0 indicates no linear correlation. For two variables X and Y, the Pearson correlation coefficient measures the degree of linear relationship between them, and is calculated using the following formula:
ρ X , Y = Cov X , Y σ X σ Y
where r is the Pearson correlation coefficient between variables X and Y.
Cov X , Y is the covariance between variables X and Y.
σ X and σ Y are the standard deviations of variables X and Y, respectively.
The calculation of the correlation matrix yields the following Table 1:
The correlation matrix presented in the table provides the following insights:
The diagonal elements of the matrix represent the correlation of each feature with itself, which is always 1.0, as a feature is perfectly correlated with itself.
The off-diagonal elements represent the pairwise correlations between the features. The correlation coefficients range from −1 to 1, indicating the strength and direction of the linear relationships between the features.
The correlation between genres and movieId is 0.014273, indicating a negligible linear relationship between these two features.
Overall, the correlation matrix provides a comprehensive overview of the linear dependencies between the features in the MovieLens dataset, which can inform subsequent data analysis and model development.
A heatmap can provide a more intuitive understanding of the relationships between variables in the dataset, as shown in Figure 1. Red indicates a positive correlation, while blue indicates no correlation. It can be observed that there is not a strong correlation among the features (refer to Figure 1). The correlation of a feature (e.g., Genres) with itself is always 1. This is just a reference point and not informative for analysis. Based on the correlation coefficients, there were very weak or almost no linear relationships between the features (TagId, UserId, MovieId) and the genres of movies in the data.

3.3.2. Principal Component Analysis

Principal component analysis (PCA) is a dimensionality reduction technique that aims to transform the original variables into a set of new, uncorrelated variables, known as principal components. These principal components are linear combinations of the original variables, ordered by the variance they explain [43]. Through PCA, the information contained in a dataset can be compressed into fewer principal components while preserving the main patterns of variability within the data [44]. PCA can further elucidate the correlated information encapsulated by the features [45]. The PCA procedure involves the following steps:
(1)
Data Centering
The original data are centered by subtracting the mean of each feature, ensuring the data have a zero mean.
The centered data matrix is:
X centered = X   X ¯
where X is the original data matrix, and X ¯ represents the mean of each feature.
(2)
Covariance Matrix Computation
The covariance matrix ∑ is computed from the centered data matrix X ¯ , capturing the correlations between features.
The covariance matrix is as follows:
C = 1 n 1 X centered T X centered
where n denotes the number of samples.
(3)
Eigendecomposition
The covariance matrix is decomposed into its eigenvectors and eigenvalues via eigendecomposition:
C = V   ·   D   ·   V 1
where V is the matrix of eigenvectors, and D is the diagonal matrix with the eigenvalues along the diagonal.
(4)
Principal Component Selection
The k eigenvectors corresponding to the largest eigenvalues are selected to form the projection matrix.
P k = u 1 , u 2 , , u k
where u i represents the ith eigenvector.
(5)
Dimensionality Reduction
The original data are projected onto the lower-dimensional subspace using the projection matrix.
The reduced-dimensional data matrix is as follows:
X reduced = X centered   ·   P k
In the aforementioned steps, by selecting the eigenvectors with the largest eigenvalues, PCA achieves dimensionality reduction by extracting the directions of maximum variance within the data. The resulting eigenvectors form the new principal components, which are linear combinations of the original features, preserving as much information from the original data as possible.
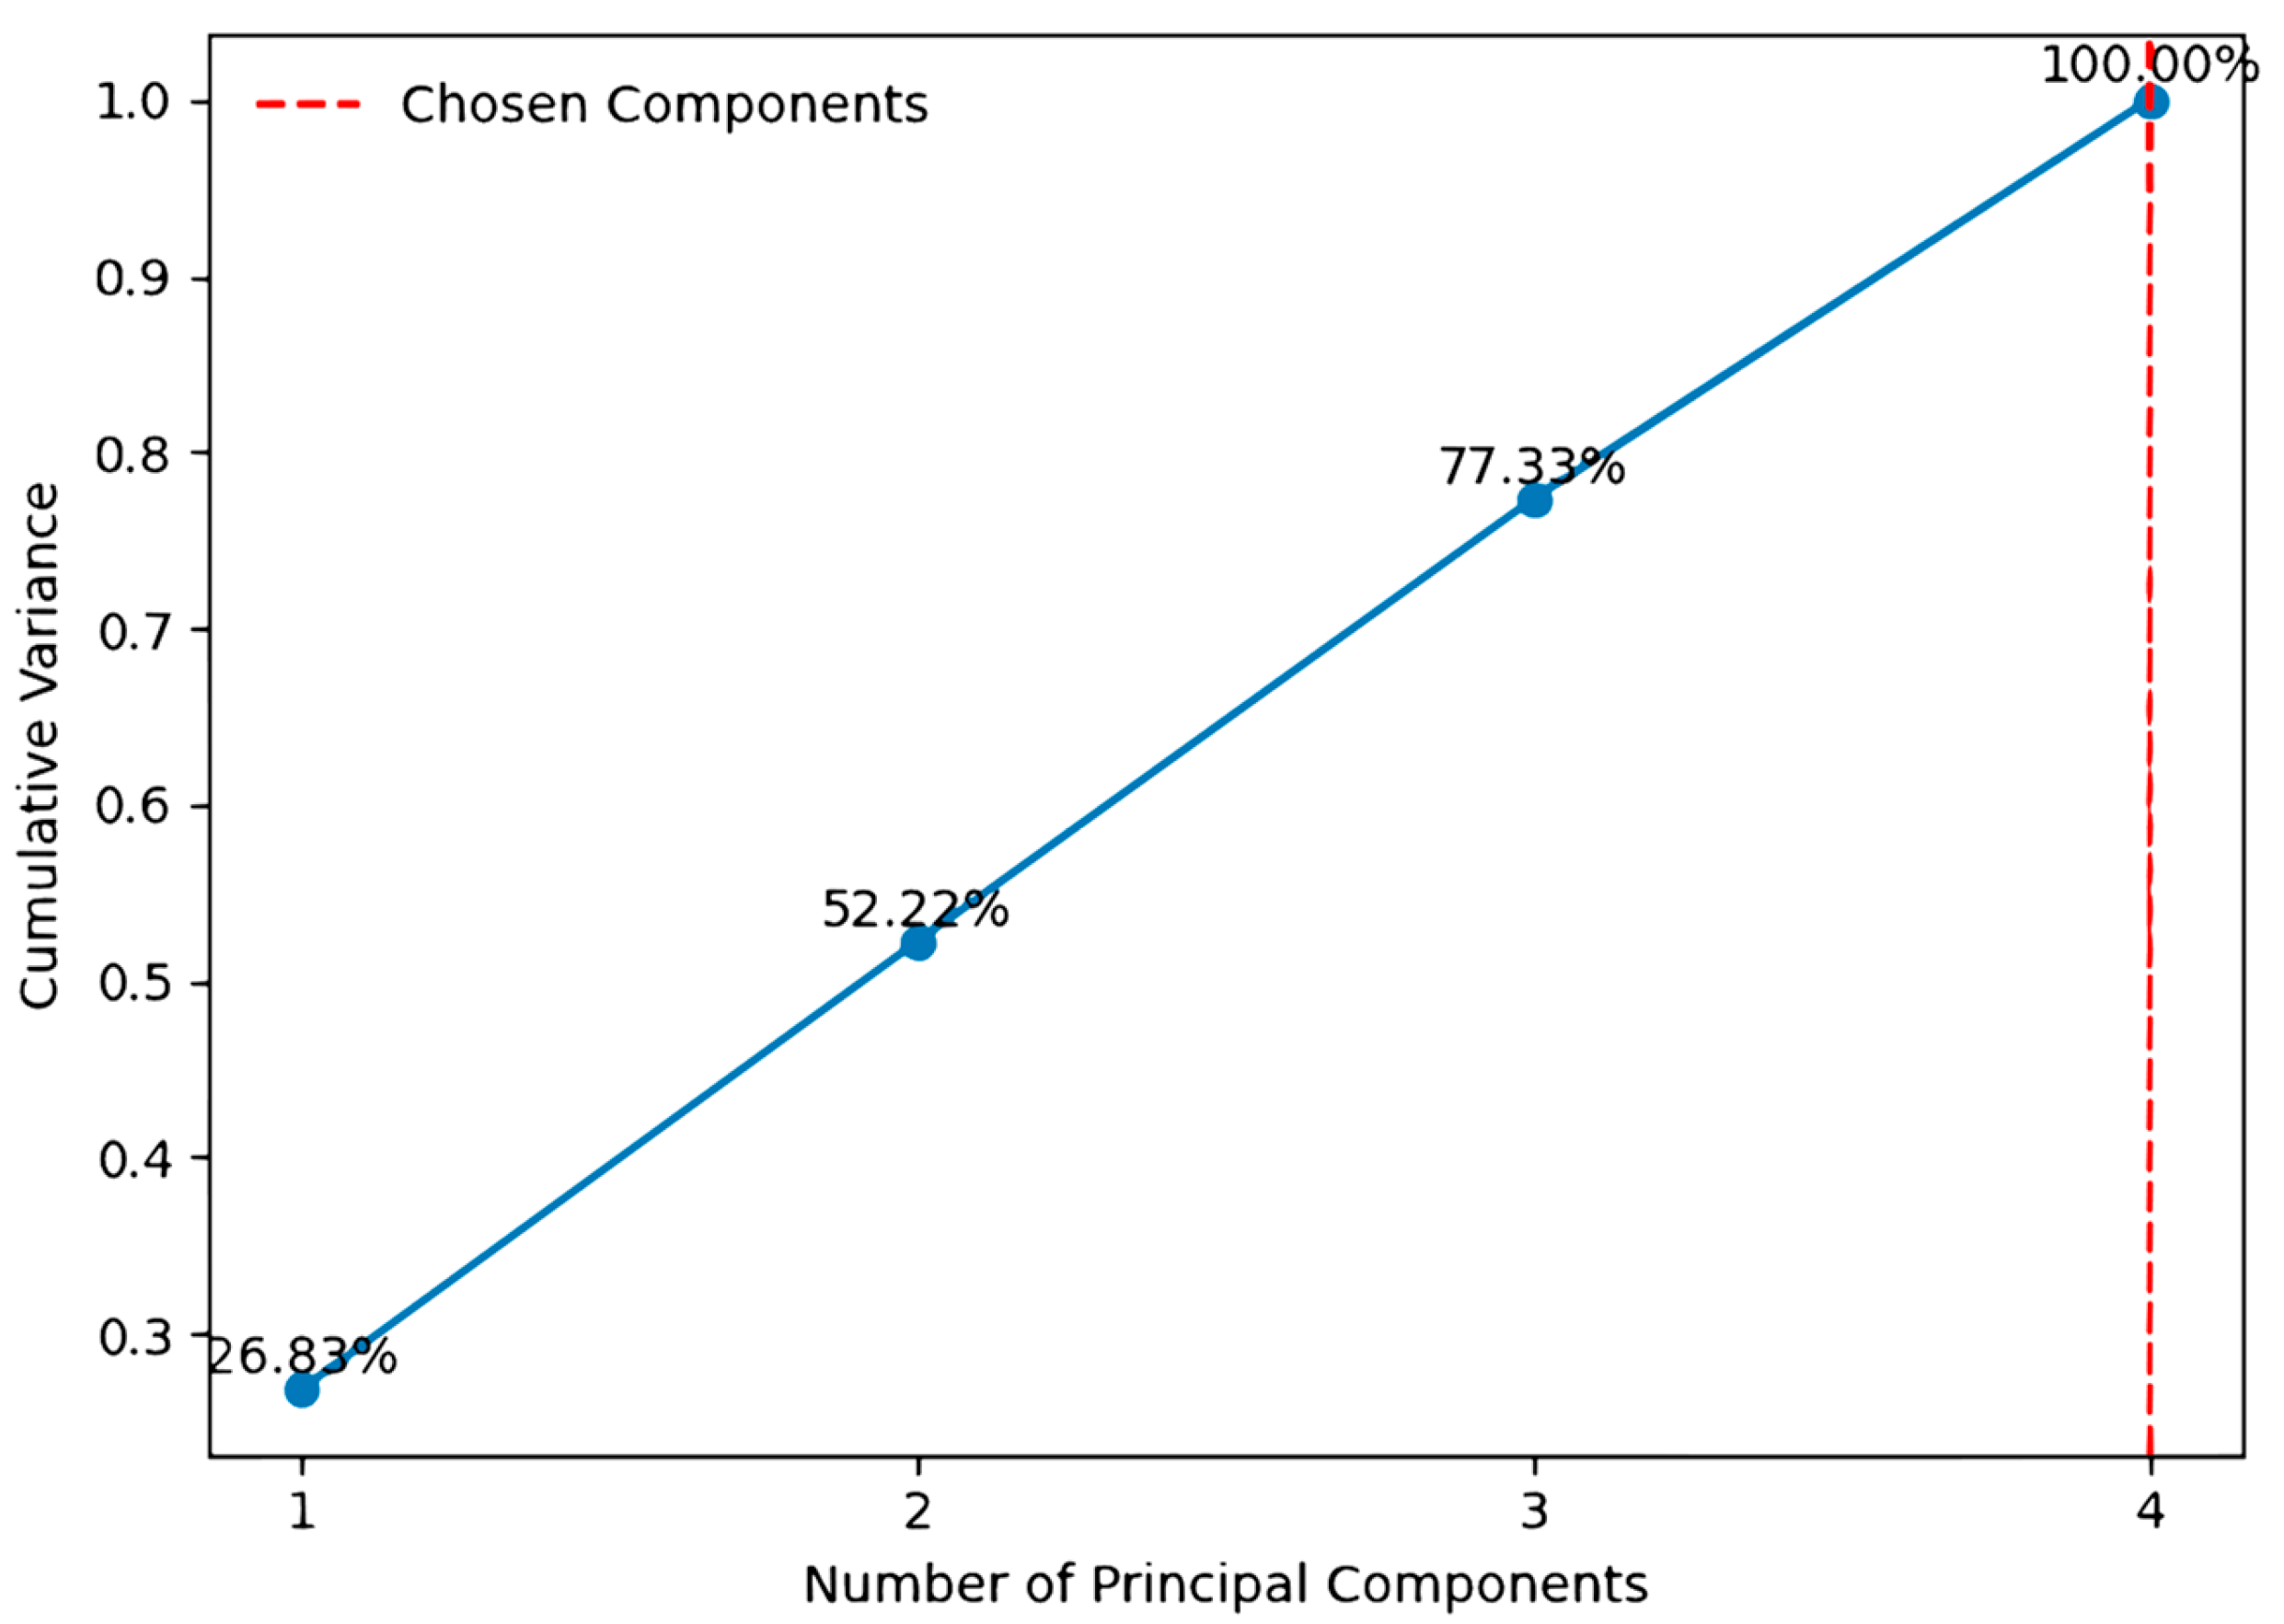
Considering a scenario with four features, the maximum number of principal components is four. The analysis involves examining the cumulative variance explained, eigenvalues, and principal component loadings.
The Cumulative Variance Explained (CVE) in principal component analysis (PCA) refers to the sum of the variance contributions of the first k principal components. It represents the percentage of total variance retained by preserving the first k principal components.
The formula for calculating the Cumulative Variance Explained is as follows:
Cumulative   Variance   Explained = i = 1 k λ i i = 1 n λ j
where:
  • k is the number of retained principal components.
  • λ i is the ith eigenvalue, representing the variance of the ith principal component.
  • n is the total number of principal components (the number of eigenvalues).
Typically, retaining principal components with a high cumulative variance explained ratio allows for preserving as much information from the original data as possible. Figure 2 provides a visual representation of the cumulative variance explained.
The figure reveals that selecting three principal components can retain approximately 77.66% of the total variance present in the original data, while selecting all four principal components allows for preserving the complete information contained within the dataset.
Eigenvalues in principal component analysis (PCA) refer to the eigenvalues associated with the derived principal components [46]. In PCA, the eigendecomposition of the data covariance matrix or correlation matrix yields a set of eigenvalues and their corresponding eigenvectors. These eigenvalues represent the variance along the principal component directions, while the eigenvectors indicate the directions of the respective principal components [47].
In the context of PCA, the magnitude of an eigenvalue determines the amount of variance explained by its corresponding principal component [48]. Principal components associated with larger eigenvalues capture more information, whereas those with smaller eigenvalues contain relatively less information (refer to Figure 3).
Eigenvalues represent the variance along the directions of the principal components. Eigenvalues greater than 1 indicate that the corresponding principal component contains more variance than a single variable. Through analysis, it can be observed that the eigenvalue for the fourth component was the smallest, at 0.91, which was relatively close to 1.
The loadings for each feature in each principal component are shown in the Table 2 below.
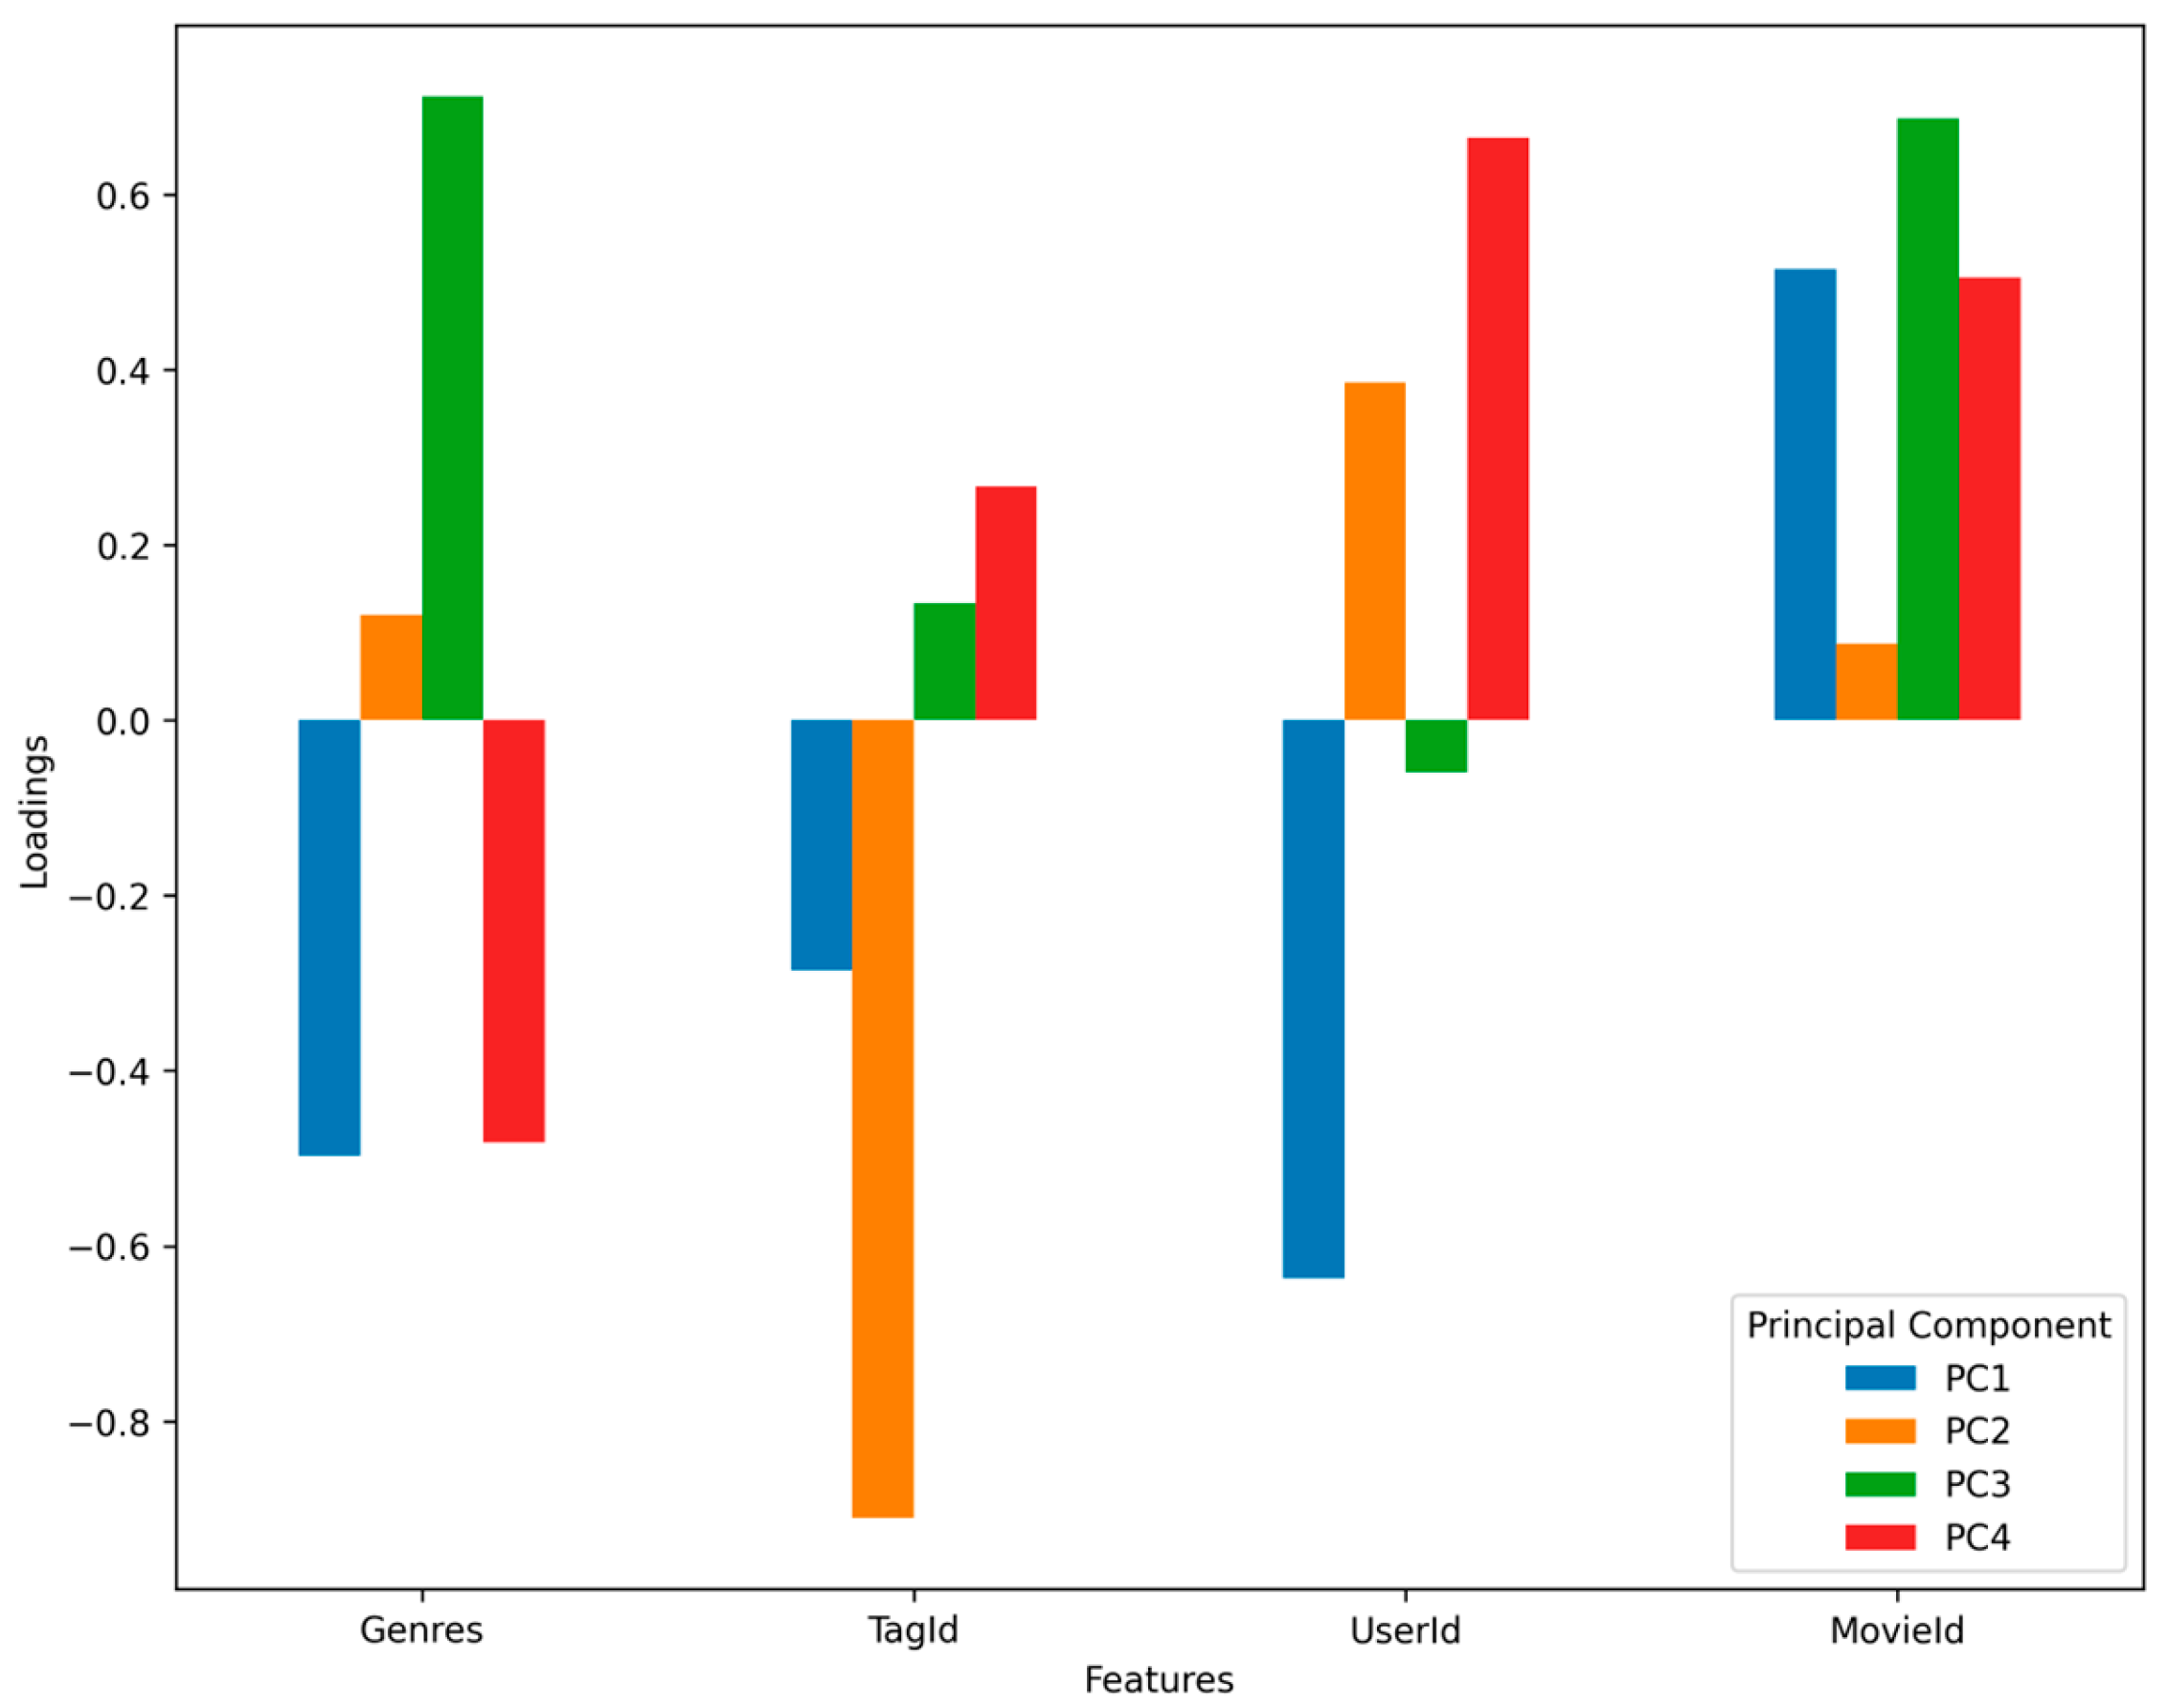
Each row in the table represents a principal component, and the values in the columns indicate the loadings of each feature on that specific principal component. A larger absolute value of the loading signifies a more significant contribution of that feature to the corresponding principal component. The direction of the influence is indicated by positive and negative loadings.
The relative contributions of each feature in the principal components can be visualized in the following graph. It can be seen that the four features have different contributions to different principal components (refer to Figure 4).
Principal component analysis (PCA) is an indispensable preliminary step in the modeling process. Through the analysis of all eigenvalues, the appropriate dimensionality for the model’s input parameters can be determined [49]. PCA helps determine the appropriate dimensionality, reducing the noise and combating the curse of dimensionality. The analysis reveals that the four principal components are sufficient to comprehensively represent the information encapsulated within the data. Notably, each principal component is a linear combination of the original features: genres, tagId, userId, and movieId, which are subsequently utilized as refined inputs in the neural network model.

4. Modeling

The hypothesis underpinning the proposed multi-task learning framework posits that the system is equipped to learn multiple tasks concurrently within a shared latent space, thereby capitalizing on the collective strength of shared feature representations across distinct tasks while also harnessing task-specific signals.
The proposed multi-task Learning Recommendation System is designed to seamlessly blend collaborative and content-based filtering methodologies within a unified neural network architecture. It capitalizes on the rich representations derived from embeddings for users, movies, genres, and tags, aiming to enhance the system’s ability to discern intricate user–item interactions and leverage diverse item features for more accurate and personalized recommendations.
Users (U) and movies (M) are represented as embeddings, denoted as Embed U :   U     R d and Embed M :   M     R d , where d is the embedding size. For a user, the user embedding is   u i = Embed U i , and for a movie j, the movie embedding is m j = Embed m j .
Genres (G) and tags (T) are also incorporated through embeddings.   Embed G : G     R d and   Embed T : T     R d represent the genre and tag embedding functions. For a genre k, the genre embedding is g k =   Embed G k , and for a tag l, the tag embedding is t l =   Embed T l .
The embeddings are flattened to obtain feature vectors, resulting in FlattenUsers( u i ), FlattenMovies( m j ), FlattenGenres( g k ), and FlattenTagId( t l ).
These flattened embeddings are concatenated to form a merged vector:
Merged _ Vector = [ FlattenUsers u i , FlattenMovies m j , FlattenGenres g k , FlattenTagId t l
The merged vector is fed into a dense layer with Rectified Linear Unit (ReLU) activation:
Feature _ Extraction _ Layer = σ Merged _ Vector · W + b
where σ represents the ReLU activation, W is the weight matrix, and b is the bias vector.
The proposed multi-task Learning Recommendation System aims to jointly optimize likability prediction and rating estimation tasks, utilizing a neural network architecture that seamlessly integrates collaborative and content-based filtering components.
The likability prediction task involves determining whether a user will like a movie:
Likability _ Predictor = σ Feature _ Extraction _ Layer · W like + b like
The rating estimation task predicts the user’s explicit rating:
Rating _ Estimator = Feature _ Extraction _ Layer · W rate + b rate
The parameters W , b , W like , b like , W rate and b rate are learned during training through backpropagation and optimization.
The loss function is a metric used to measure the discrepancy between the model’s predictions and the true values. During the training process of a machine learning model, the objective is to minimize the loss function, thereby improving the model’s performance on the prediction task [50,51]. The loss function quantifies the model’s goodness of fit to the data, that is, how well the model fits the true data. By adjusting the model’s parameters to minimize the loss function, the model can better learn the patterns and regularities inherent in the task [52]. In this work, the model employs a multi-task learning framework, necessitating the specification of activation functions and loss functions for two tasks. The model aims to optimize the objectives of user preference prediction and rating prediction simultaneously during training. These tasks are combined through a weighted sum, thereby enhancing the overall recommendation performance. This setup allows the model to comprehensively understand the interactions between users and movies and make accurate recommendations based on these interactions.
The likability prediction task uses the sigmoid function as activation function. The sigmoid function maps any real number to the range (0, 1). Its formula is as follows:
σ x = 1 1 + e x
where x is the input value, and e is the base of the natural logarithm.
The likability prediction task is a binary classification task aimed at predicting whether a user likes a movie or not. The sigmoid function constrains the output range to (0, 1), effectively transforming the input value into a probability value. An output closer to 1 indicates a higher probability of the corresponding event occurring, while an output closer to 0 suggests a lower probability.
Binary Cross-Entropy is used as the loss function:
Likeability   Loss = 1 N i = 1 N y i · log y i ^ + 1 y i · log 1 y i ^ )
where N is the number of samples, y i is the true label, and y i ^ is the model’s predicted value.
Binary Cross-Entropy is suitable for binary classification problems [53]. It compares the predicted probability distribution from the model with the actual label distribution, quantifying the cross-entropy loss for each sample’s binary classification prediction.
The rating estimation task uses the linear activation function as activation function. The linear activation function f(x) = x directly outputs any real value without applying additional nonlinear transformations. This aligns with the requirements of the rating estimation task, where the model directly predicts the user’s rating for a movie.
Mean Squared Error is used as the loss function for the rating estimation task:
Rating   Loss = 1 N i = 1 N y i y i ^ 2
where N is the number of samples, y is the true label, and ŷ is the model’s predicted value.
The Mean Squared Error (MSE) is suitable for regression problems, calculating the mean of the squared differences between the predicted and actual values.
Let h i represent the model’s representation for task i, and y i denote the true label for task i. The loss function for task i can be expressed as L i h i , y i . The overall loss function in multi-task learning can be formulated as a weighted sum of individual task losses:
Total   Loss = i = 1 N λ i L i h i , y i Rating  
where λ i is the weight for task i, and N is the total number of tasks. During joint learning, the gradients from each task’s loss contribute to the shared representation through backpropagation, promoting the shared layers to learn feature representations beneficial for all tasks.
In this work, two loss functions are employed, and the overall loss function can be expressed as follows:
Total   Loss = ω likeability · Likability   Loss + ω rating · Rating   Loss
where ω likeability and ω rating are the weights for the likability prediction and rating estimation tasks, respectively. These weights control the contribution of each task to the overall loss. The setting of these weights can be adjusted based on the relative importance of the tasks.

5. Experiments

In this study, a hybrid recommendation system was designed and implemented, combining the concepts of collaborative filtering and content-based filtering. The MovieLens dataset was utilized, and a series of feature extraction and preprocessing steps were performed. The following are the main steps and results of the experiment.

5.1. Dataset Introduction

The MovieLens dataset was used, which includes multiple files such as movie ratings (ratings.csv), movie information (movies.csv), tag information (tags.csv), genome scores (genome-scores.csv), and genome tags (genome-tags.csv).

5.2. Data Preprocessing

During the data preprocessing stage, the movie information, ratings, tags, and genome data were merged into a comprehensive dataset. A LabelEncoder was employed to encode the movie genres, and categorical encoding was performed on the userID and movieId for use in the embedding layers.

5.3. Model Design

A hybrid recommendation system was designed, combining user-movie collaborative filtering with content-based filtering using genres and tags. The model’s inputs included userID, movieId, genreId, and tagId. Embedding layers were used to map these discrete features into low-dimensional continuous vectors, which were then concatenated using a concatenation layer. On top of the concatenated vector, a fully connected layer was added as a feature extraction layer, followed by separate outputs for two tasks: predicting whether the user likes the movie (Likability Predictor) and estimating the user’s rating for the movie (Rating Estimator), as shown in Algorithm 1.
Algorithm 1 Multi-task Learning Model.
Inputs:
U = u 1 , u 2 , u 3 , u n : User ID
M = m 1 , m 2 , m 3 , m n : Movie ID
T = t 1 , t 2 , t 3 , t n : Tag ID
G = g 1 , g 2 , g 3 , g n : Genres
R = r 1 , r 2 , r 3 , r n : Rates
Iteration times: 50
Outputs: RMSE & MAE
Initialize parameters Θ, learning rate α
1: for t = 1…T do
2: Sample batch of (u, i, t, g, r) from training data
# Compute embedding vectors
3: u_emb = ϕ_u(u; Θ_u) # User embedding
4: i_emb = ϕ_i(i; Θ_i) # Movie embedding
5: g_emb = ϕ_g(g; Θ_g) # Genre embedding
6: t_emb = ϕ_t(t; Θ_t) # Tag embedding
# Concatenate embeddings
7: x = u_emb ⊕ i_emb ⊕ g_emb ⊕ t_emb
# Pass through model
8: h = σ(W_1^Tx + b_1) # Dense layer with activation σ
9: p = σ(W_2^Th + b_2) # Likability prediction (0/1)
10: r_hat = W_3^Th + b_3 # Rating prediction
# Compute losses
11: L_like = −∑ r∗log(p) + (1 − r)∗log(1 − p)  # Binary cross-entropy
12: L_rating = ∑ (r − r_hat)^2        # Mean squared error
13: L = 0.8∗L_like + 0.2∗L_rating        # Weighted loss
# Compute gradients
14: ∇Θ = ∂L/∂Θ
# Update parameters
15: Θ = Θ − α ∗ ∇Θ
# Compute metrics on validation set
16: RMSE_val = sqrt(∑(r_val − r_hat_val)^2/N)
17: MAE_val = ∑|r_val − r_hat_val|/N
End for

Model Compilation and Evaluation Metrics

The Adam optimizer was utilized, and appropriate loss functions and evaluation metrics were specified during model compilation.

5.4. Training and Validation

The dataset was split into training and validation sets, with 80% used for training and 20% for validation. Fifty epochs were set, and a batch size of 64 was used for training.

6. Results and Discussion

6.1. Results of Using MovieLens Dataset

During the training process, the changes in various evaluation metrics were monitored, and the model’s performance was analyzed using visualization tools. For the rating estimator, which uses a regression model, metrics like RMSE and MAE were focused on. By analyzing these metrics, insights into the model’s performance across different tasks were gained.

6.1.1. Loss Function Performance

The loss function for the likability prediction task is given by Equation (15), while the loss function for the rating estimation task is given by Equation (16). The overall loss function was calculated using Equation (18), with the weights ω likeability and ω rating set to 1 by default. The final loss value was 0.0026, where the Likability_Predictor loss was 1.2336 × 10⁻⁴, and the Rating_Estimator loss was 0.0024. All loss functions converged rapidly within 10 training iterations and subsequently stabilized, as shown in Figure 5.

6.1.2. RMSE

Root Mean Square Error (RMSE) is a metric used to evaluate the difference between predicted results and actual observations [54]. It is the square root of the mean squared error. The RMSE calculation formula is as follows:
RMSE = 1 N i = 1 N y i y i ^ 2
where N is the number of test samples, yi is the actual rating, and y i ^ is the rating predicted by the model.
RMSE quantifies the error in the model’s predictions. The smaller the RMSE, the more accurate the model’s predictions. Since it is the square root of the squared error, it imposes a stricter penalty on large errors compared to the mean squared error, thus better reflecting the model’s bias in predictions.
After 50 epochs of training, the RMSE value for the training dataset was 0.0295, and the RMSE value for the validation dataset was 0.0286, as shown in Figure 6. Both the training and validation RMSE values were quite low, suggesting that the model performs well on the datasets.

6.1.3. MAE

Mean Absolute Error (MAE) is a metric used to evaluate the difference between predicted results and actual observations [55]. It is the average absolute error, calculated as follows:
MAE = 1 N i = 1 N y i y i ^
where N is the number of test samples, y i is the actual rating, and y i ^ is the rating predicted by the model.
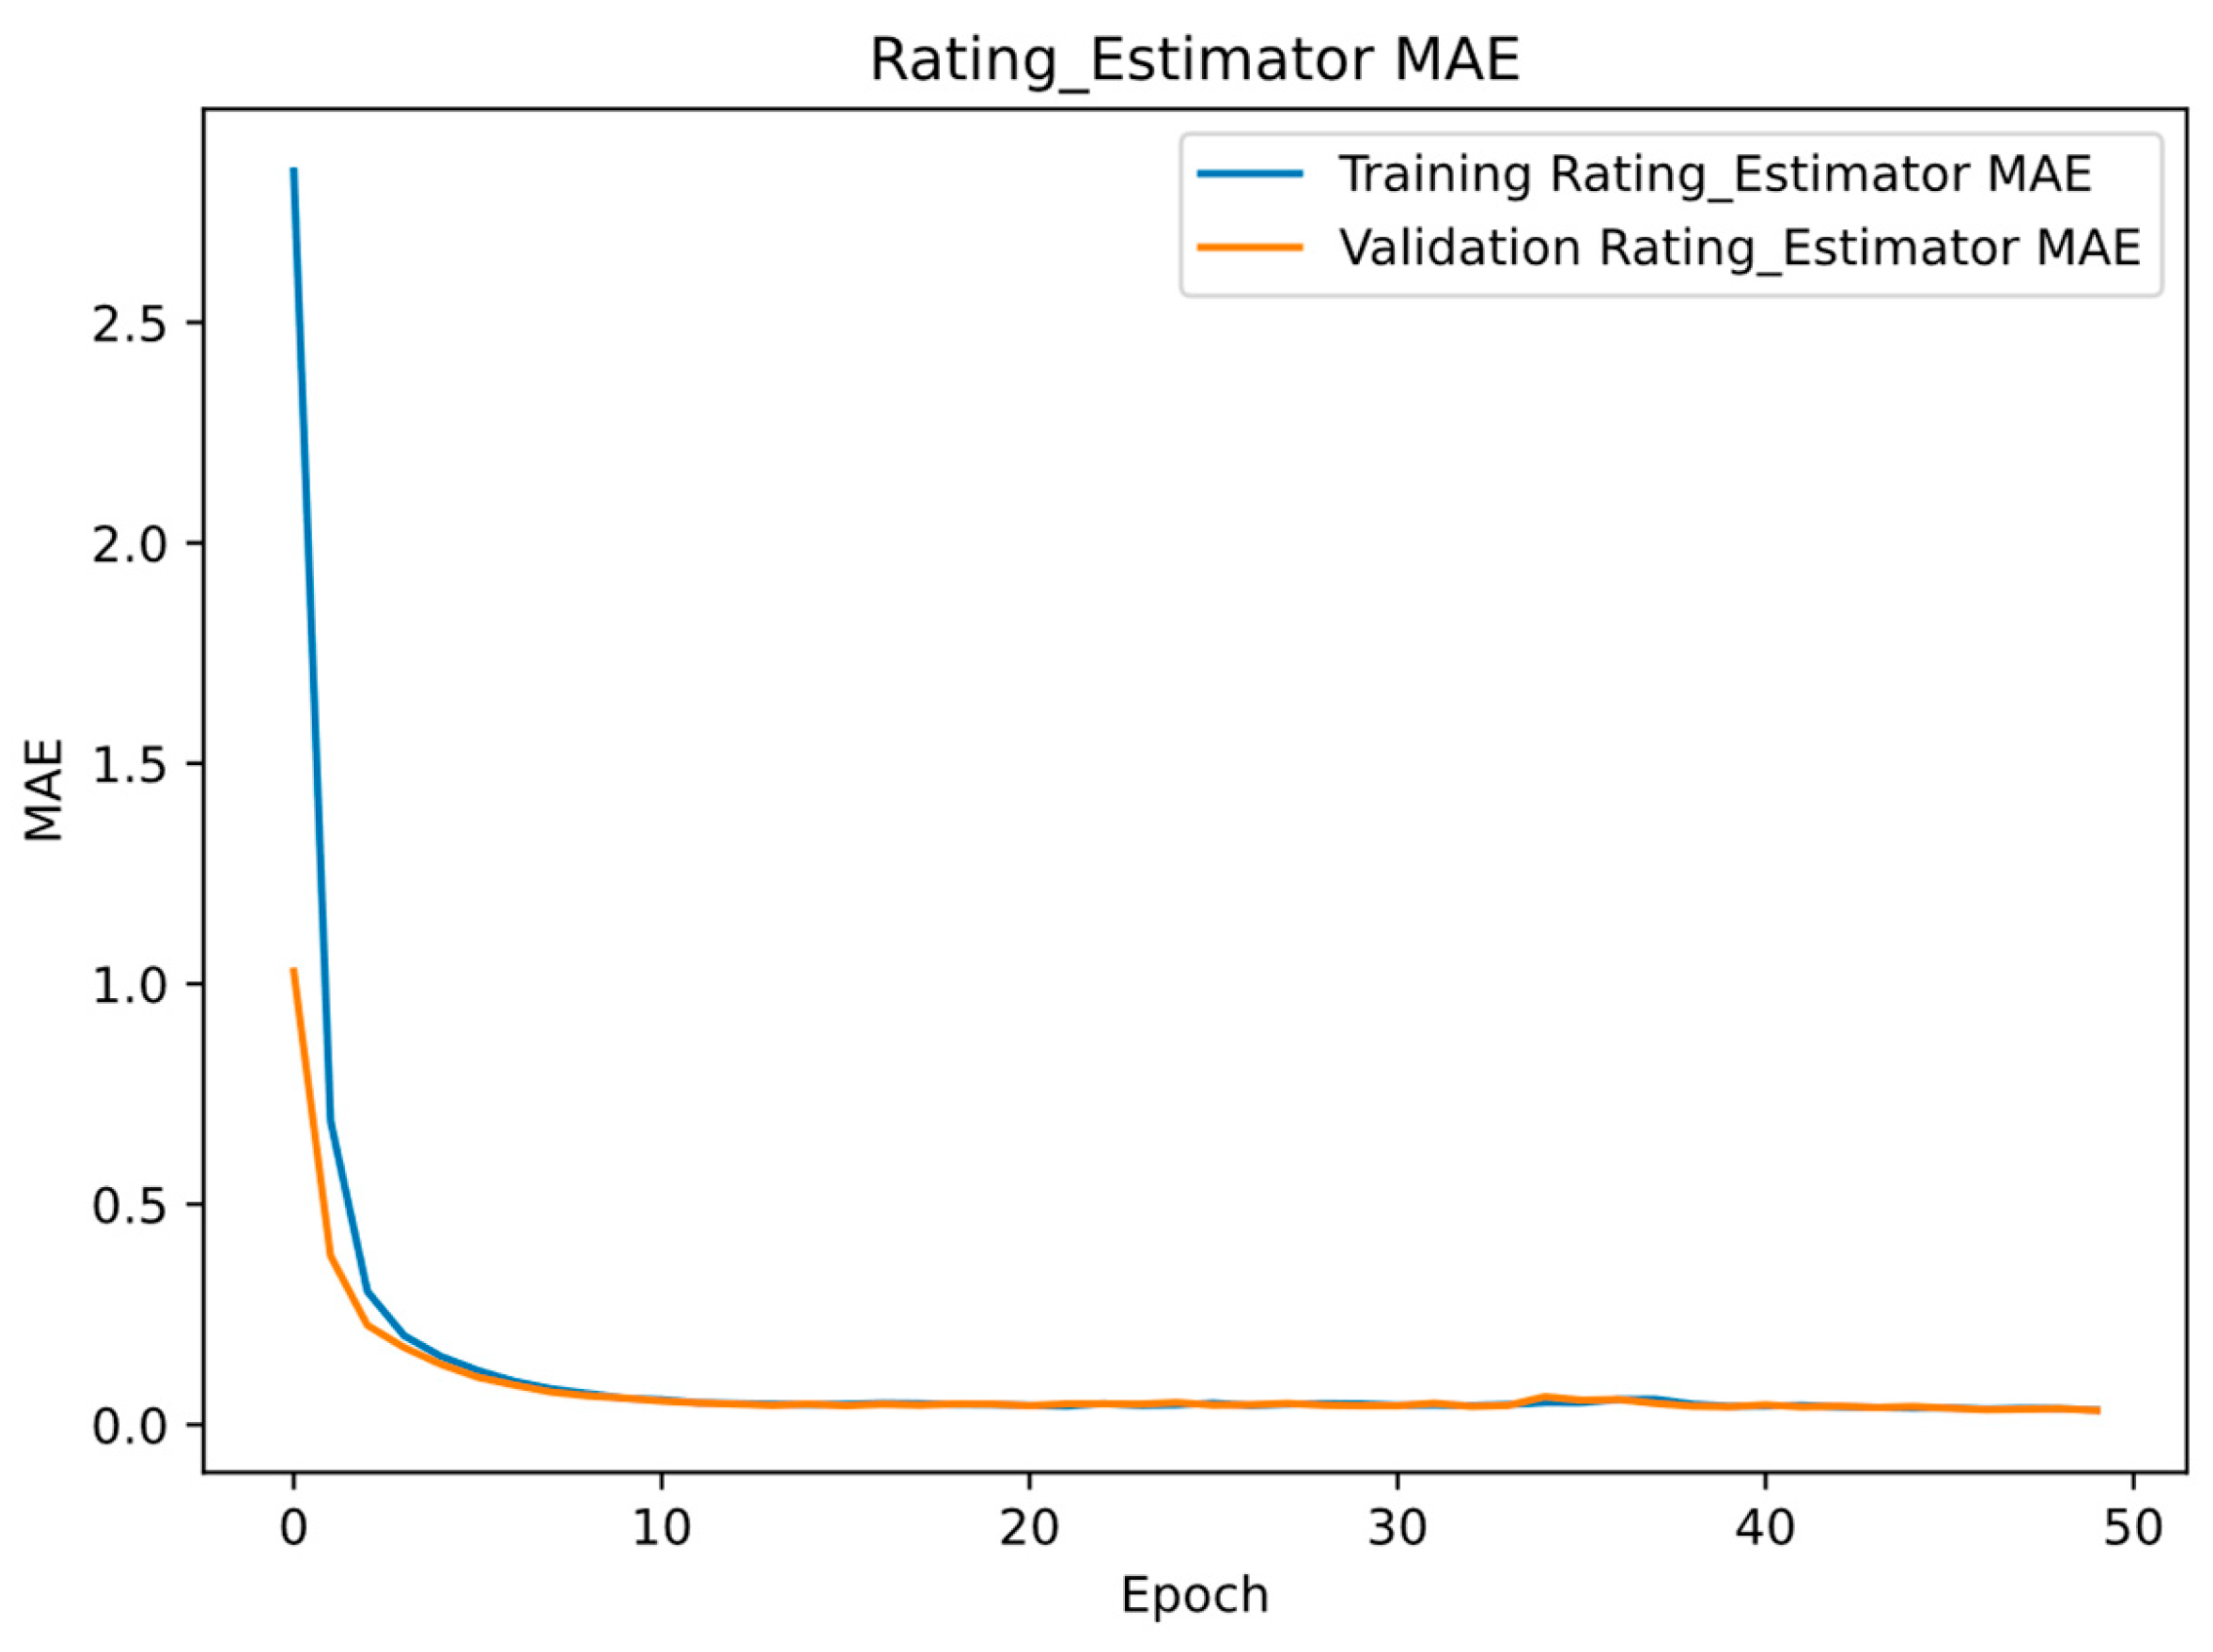
MAE represents the average absolute difference between the predicted and actual values; the smaller the MAE, the more accurate the model’s predictions. MAE is insensitive to outliers because it uses absolute values instead of squared errors. The computation of MAE does not consider the direction of the error, only its magnitude.
After 50 epochs of training, the MAE value for the training dataset was 0.0219, and the MAE value for the validation dataset was 0.0218, as shown in Figure 7. Both the training and validation MAE values were quite low, suggesting that the model performs well on both datasets.

6.1.4. Comparison of Model Metrics for Different Approaches

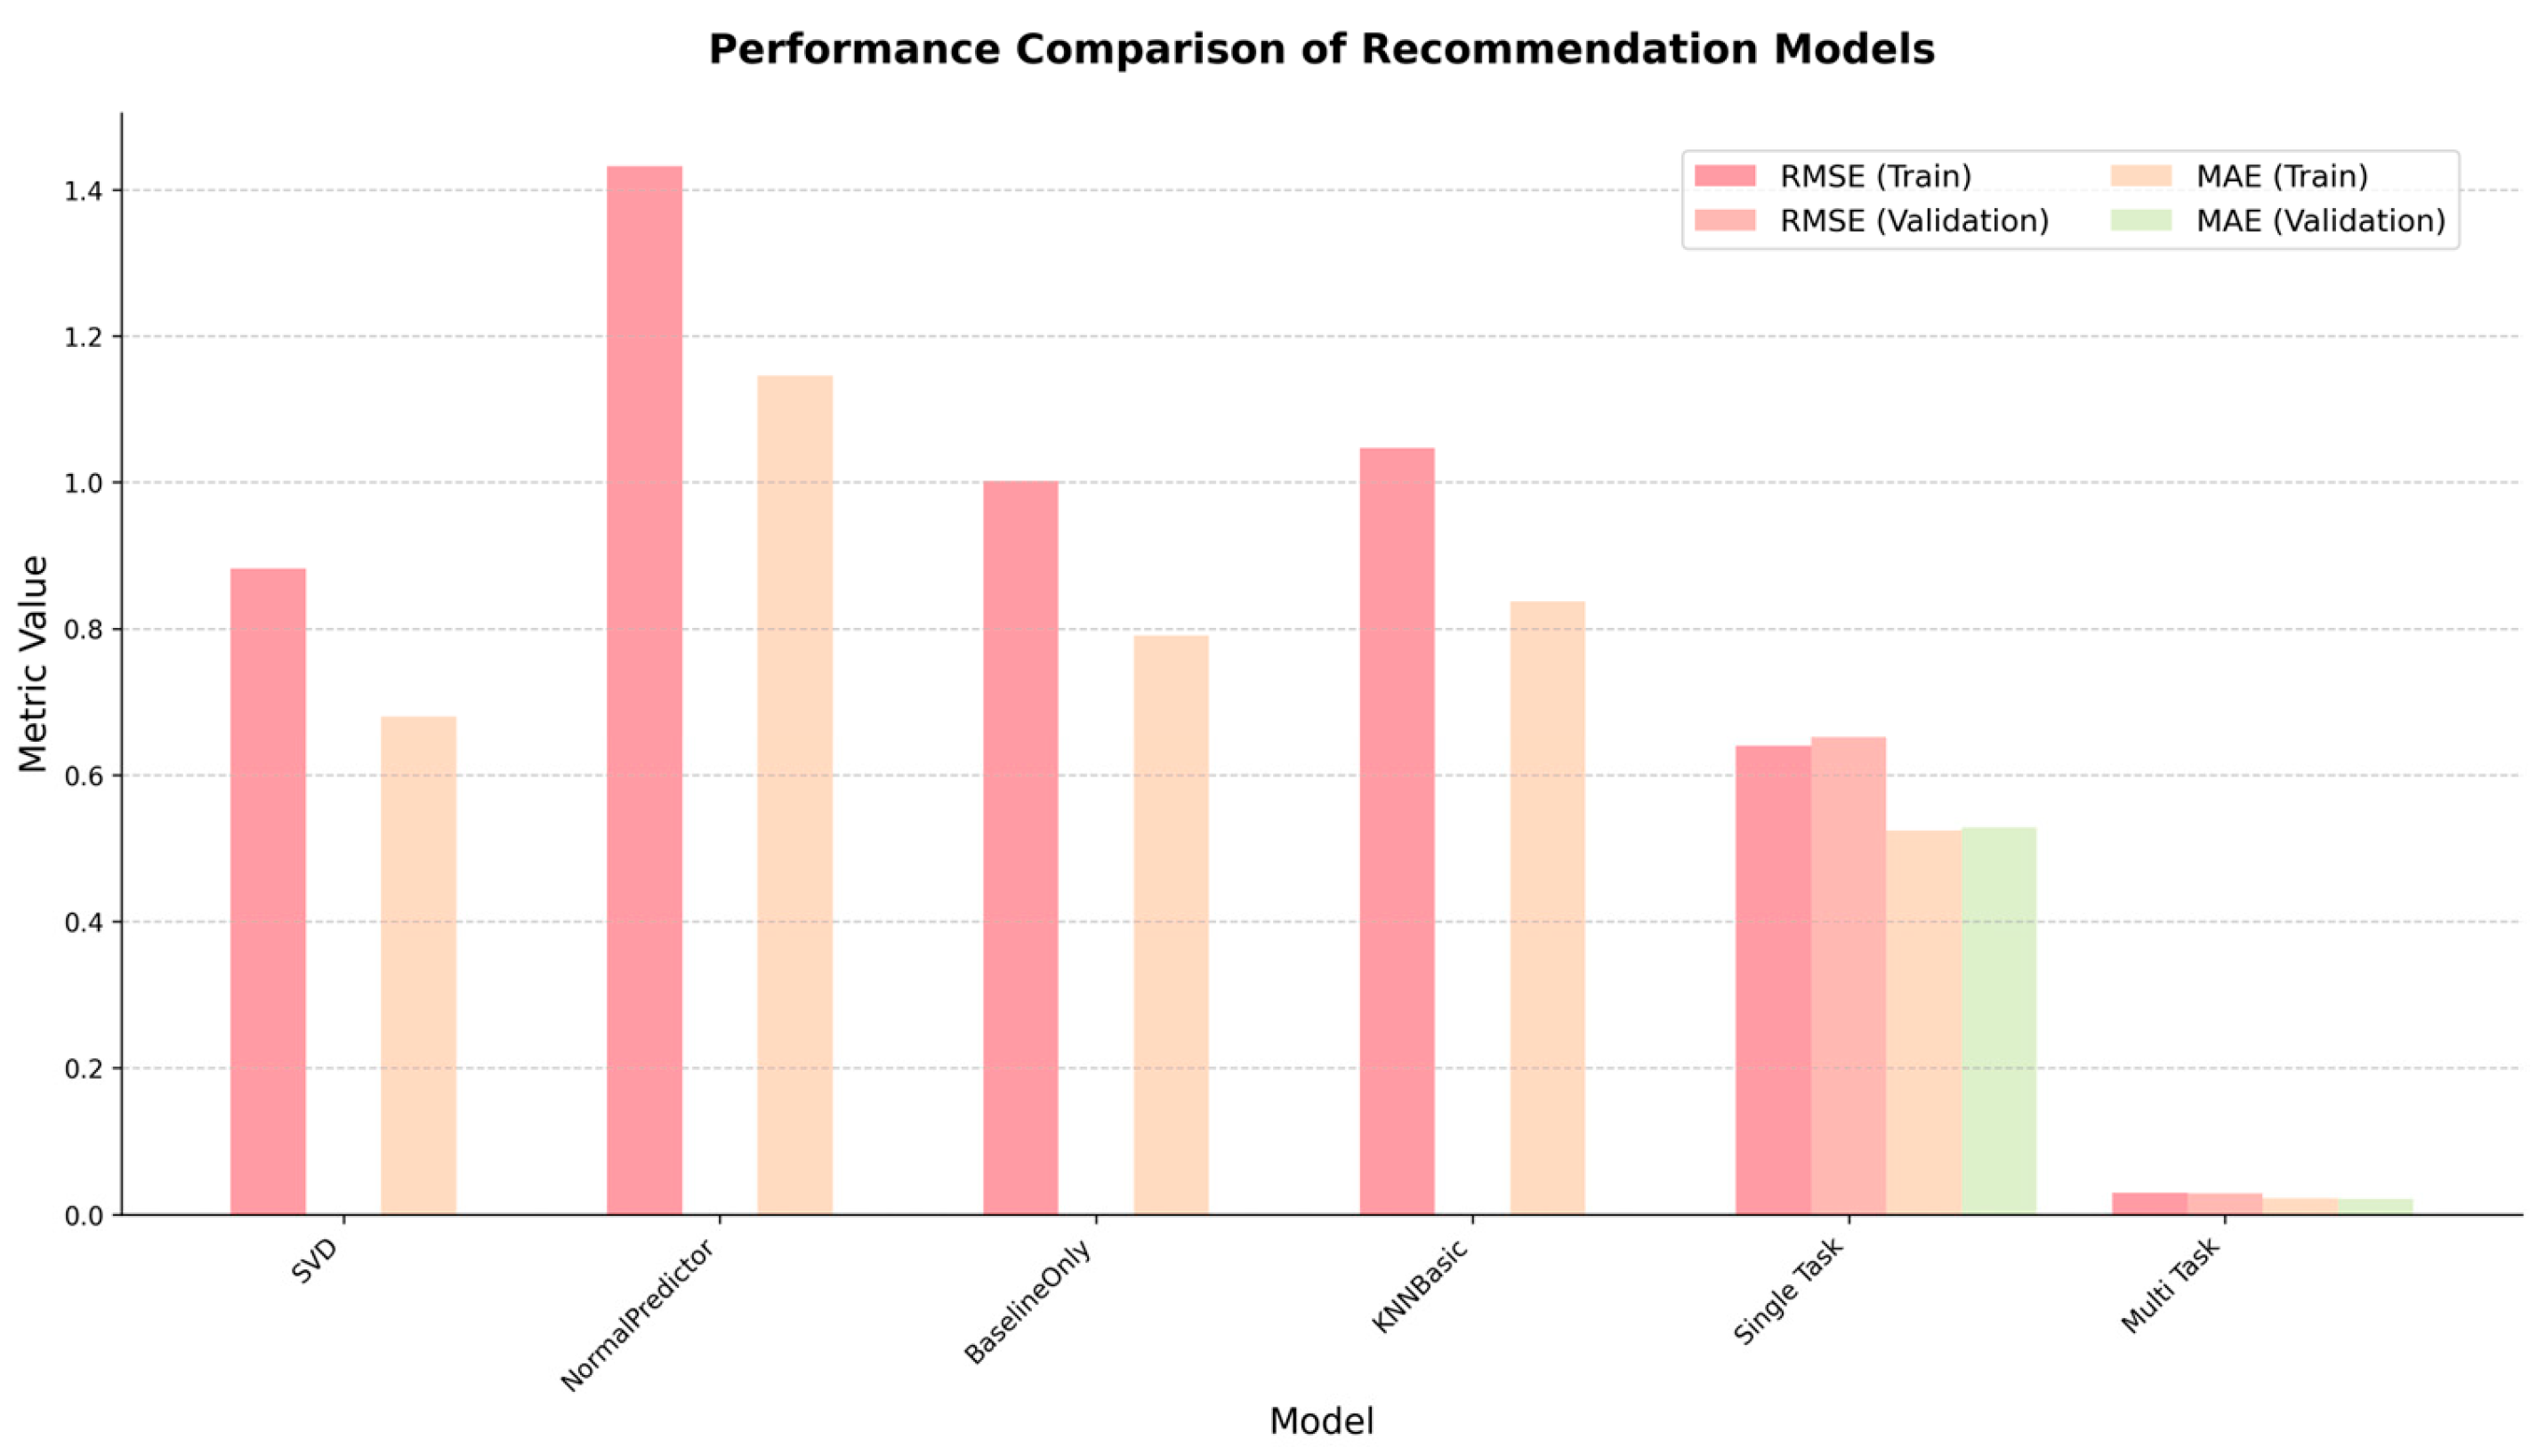
Classical SVD models, which perform matrix factorization to learn latent representations of users and items, are widely used and studied for building effective recommendation systems [56]. SVD and single-task learning models were tested and compared with the multi-task learning approach’s performance, as shown in Table 3.
The SVD model achieved an RMSE of 0.8822 and an MAE of 0.6794 using five-fold cross-validation, indicating an average performance. However, it outperformed the Normal Predictor, Baseline-only Method, and KNNBasic models, which exhibited higher RMSE and MAE values on the training set. The single-task learning model exhibited a noticeable improvement over the SVD model, with an RMSE of 0.6397 and an MAE of 0.5244 on the training set, and an RMSE of 0.6517 and an MAE of 0.5279 on the validation set. The multi-task learning model demonstrated outstanding performance, with an RMSE of 0.0295 and an MAE of 0.0219 on the training set, and an RMSE of 0.0286 and an MAE of 0.0218 on the validation set.
The single-task learning model exhibited a significant improvement over the SVD model, indicating that utilizing neural networks to learn nonlinear feature interactions is effective in enhancing recommendation accuracy, as shown in Figure 8.
The multi-task learning model’s performance far surpassed that of the single-task, SVD models and other models, validating the advantage of multi-task learning. By simultaneously learning the rating prediction and preference prediction tasks, the model was able to learn more generalized and robust representations, significantly improving recommendation accuracy.
The multi-task model’s performance was consistent across the training and validation sets, suggesting strong generalization capabilities and resistance to overfitting the training data.

6.1.5. Comparison of Model Performance with Different Data Features

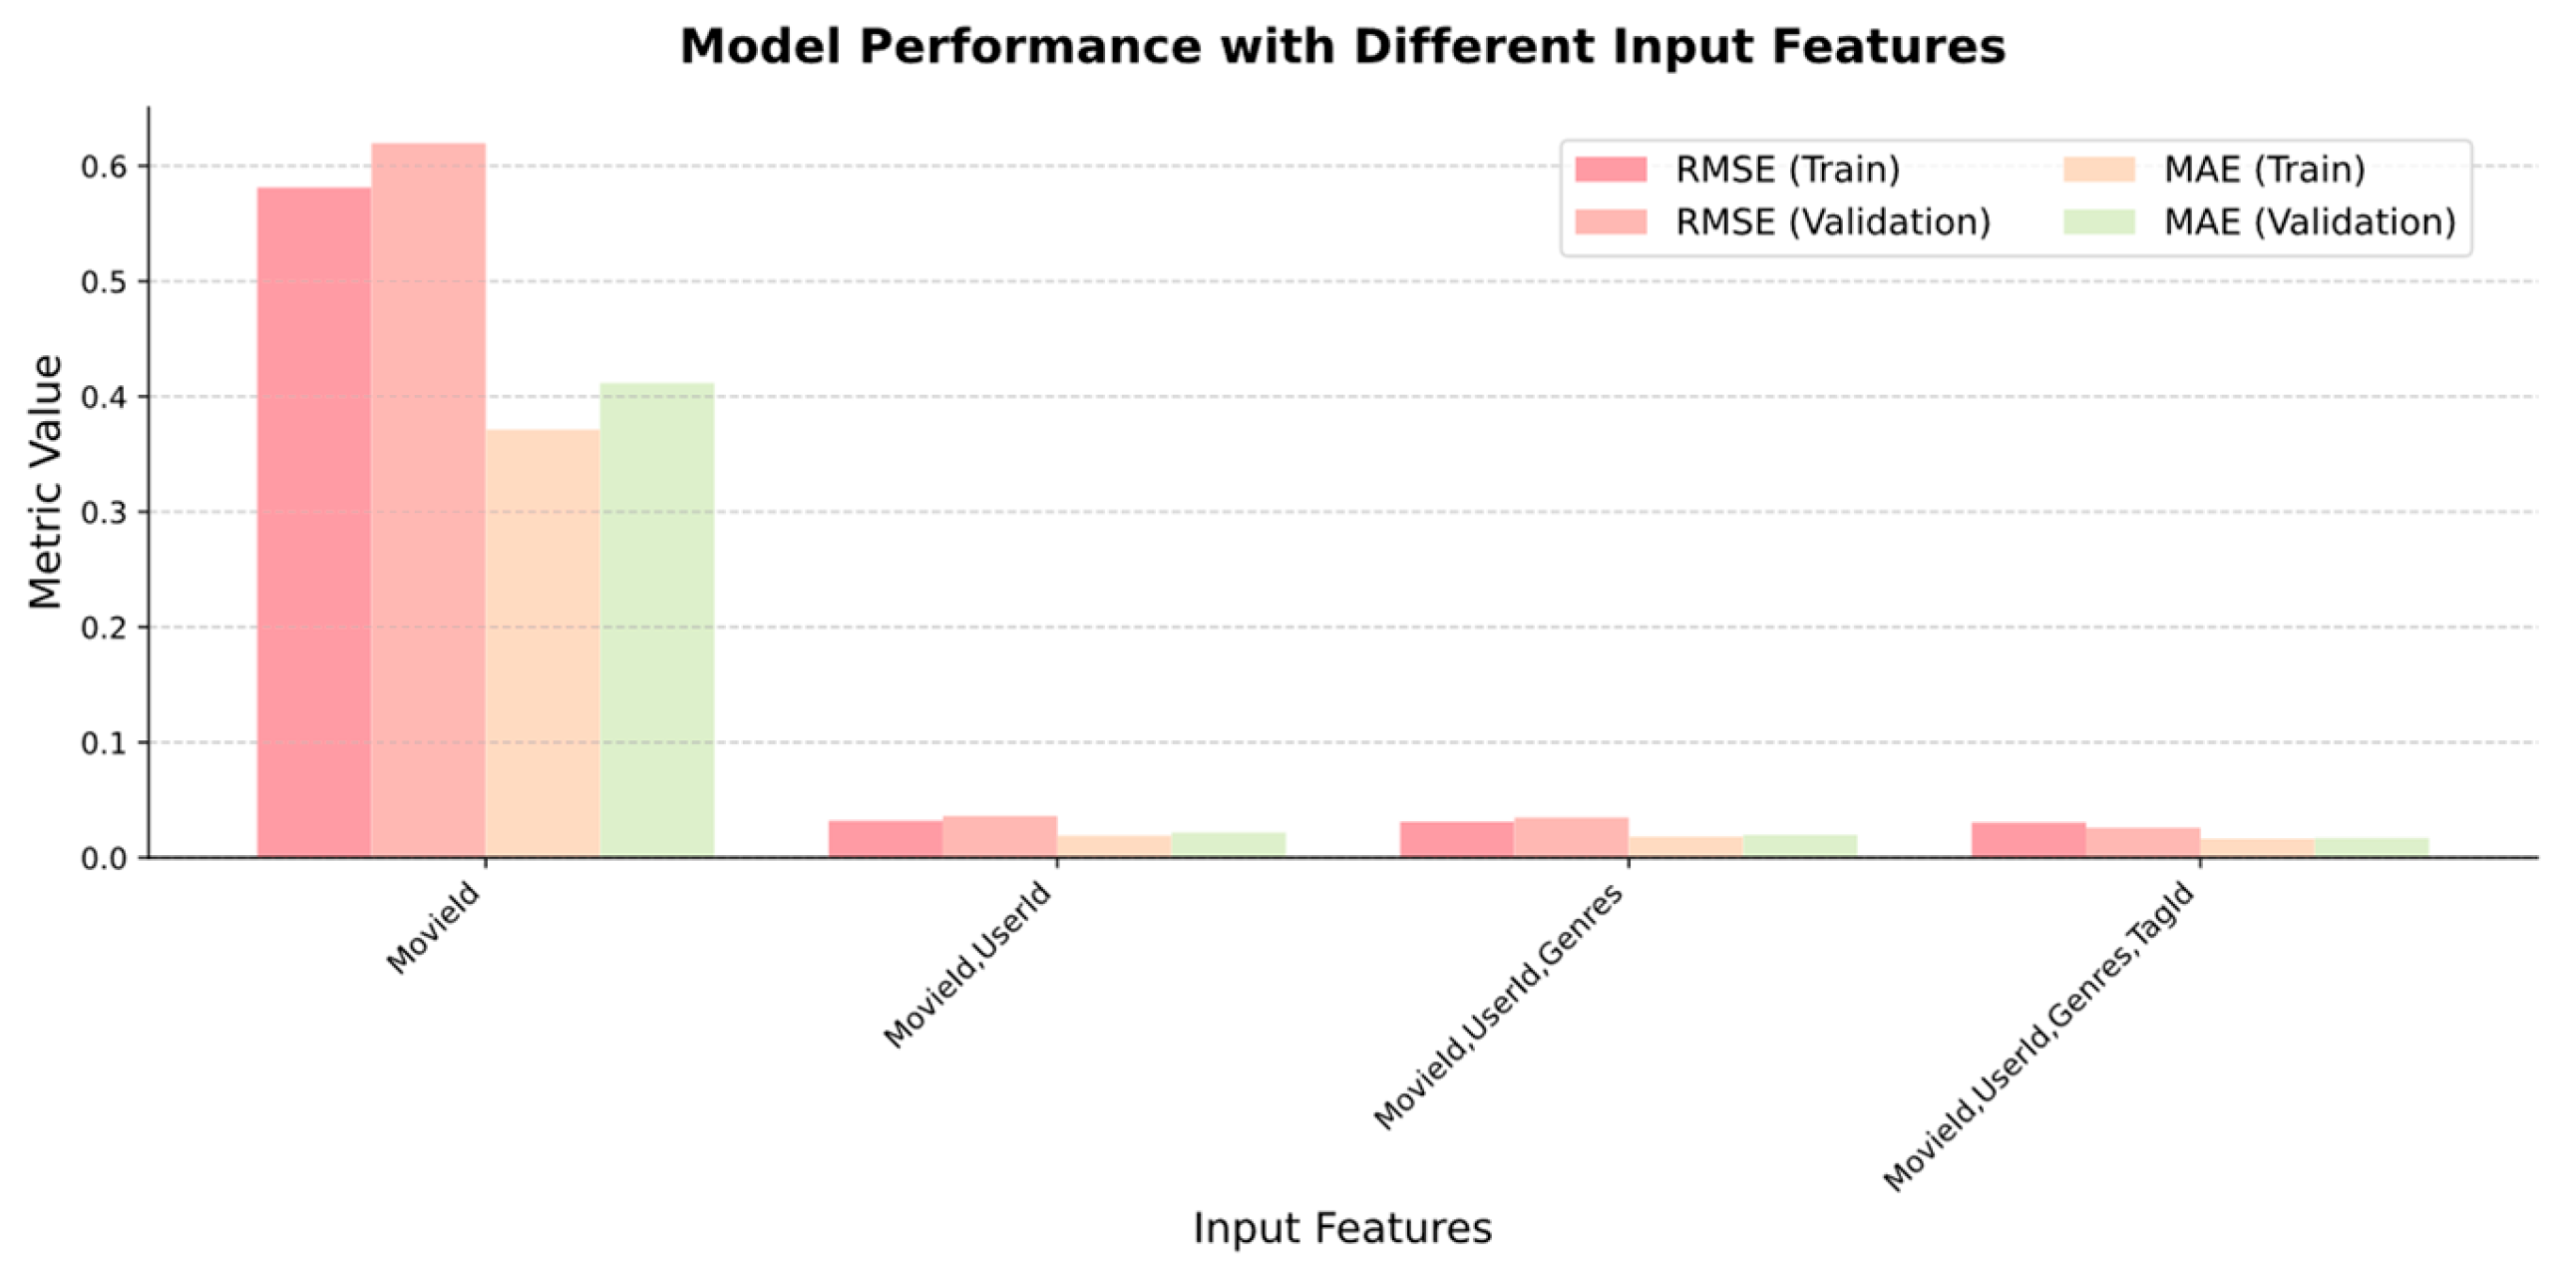
The performance metrics for different combinations of data features used in the recommendation model were compared. The features included MovieId, UserId, Genres, and TagId, as listed in Table 4.
When MovieId was used as the sole input feature, the model’s performance remained poor, similarly to previous results, indicating that using only movie ID information is insufficient for effectively capturing user preferences and movie features.
After incorporating UserId as an input feature, the model’s performance significantly improved, especially on the training set, with the RMSE decreasing from 0.5812 to 0.0320 and the MAE decreasing from 0.3713 to 0.0191. This further confirms the importance of user ID information in encoding user preference patterns.
Further adding Genres as an input feature did not result in a noticeable improvement in the model’s performance on the training set (RMSE of 0.0312, MAE of 0.0183), but its performance on the validation set was enhanced (RMSE of 0.0349, MAE of 0.0198), suggesting that incorporating movie genre information is somewhat helpful in improving the model’s generalization ability.
Finally, with the addition of TagId as an input feature, the model’s RMSE on the training set slightly decreased (0.0305), but the MAE further decreased to 0.0164, reaching the optimal level across all scenarios. On the validation set, both the RMSE (0.0259) and MAE (0.0171) achieved the best performance. This indicates that adding tag information can further enrich the model’s representational capacity, better capturing user preferences and movie features, thereby improving recommendation accuracy and generalization, as shown in Figure 9.

6.2. Results of Using Book Recommendation Dataset

To further validate the generalization capability of the models, their performance was evaluated on the Book Recommendation Dataset. This dataset presents a different domain and challenges compared to the previous experiments, allowing an assessment of the models’ ability to adapt to new scenarios effectively.

6.2.1. Comparison of Model Metrics for Different Approaches

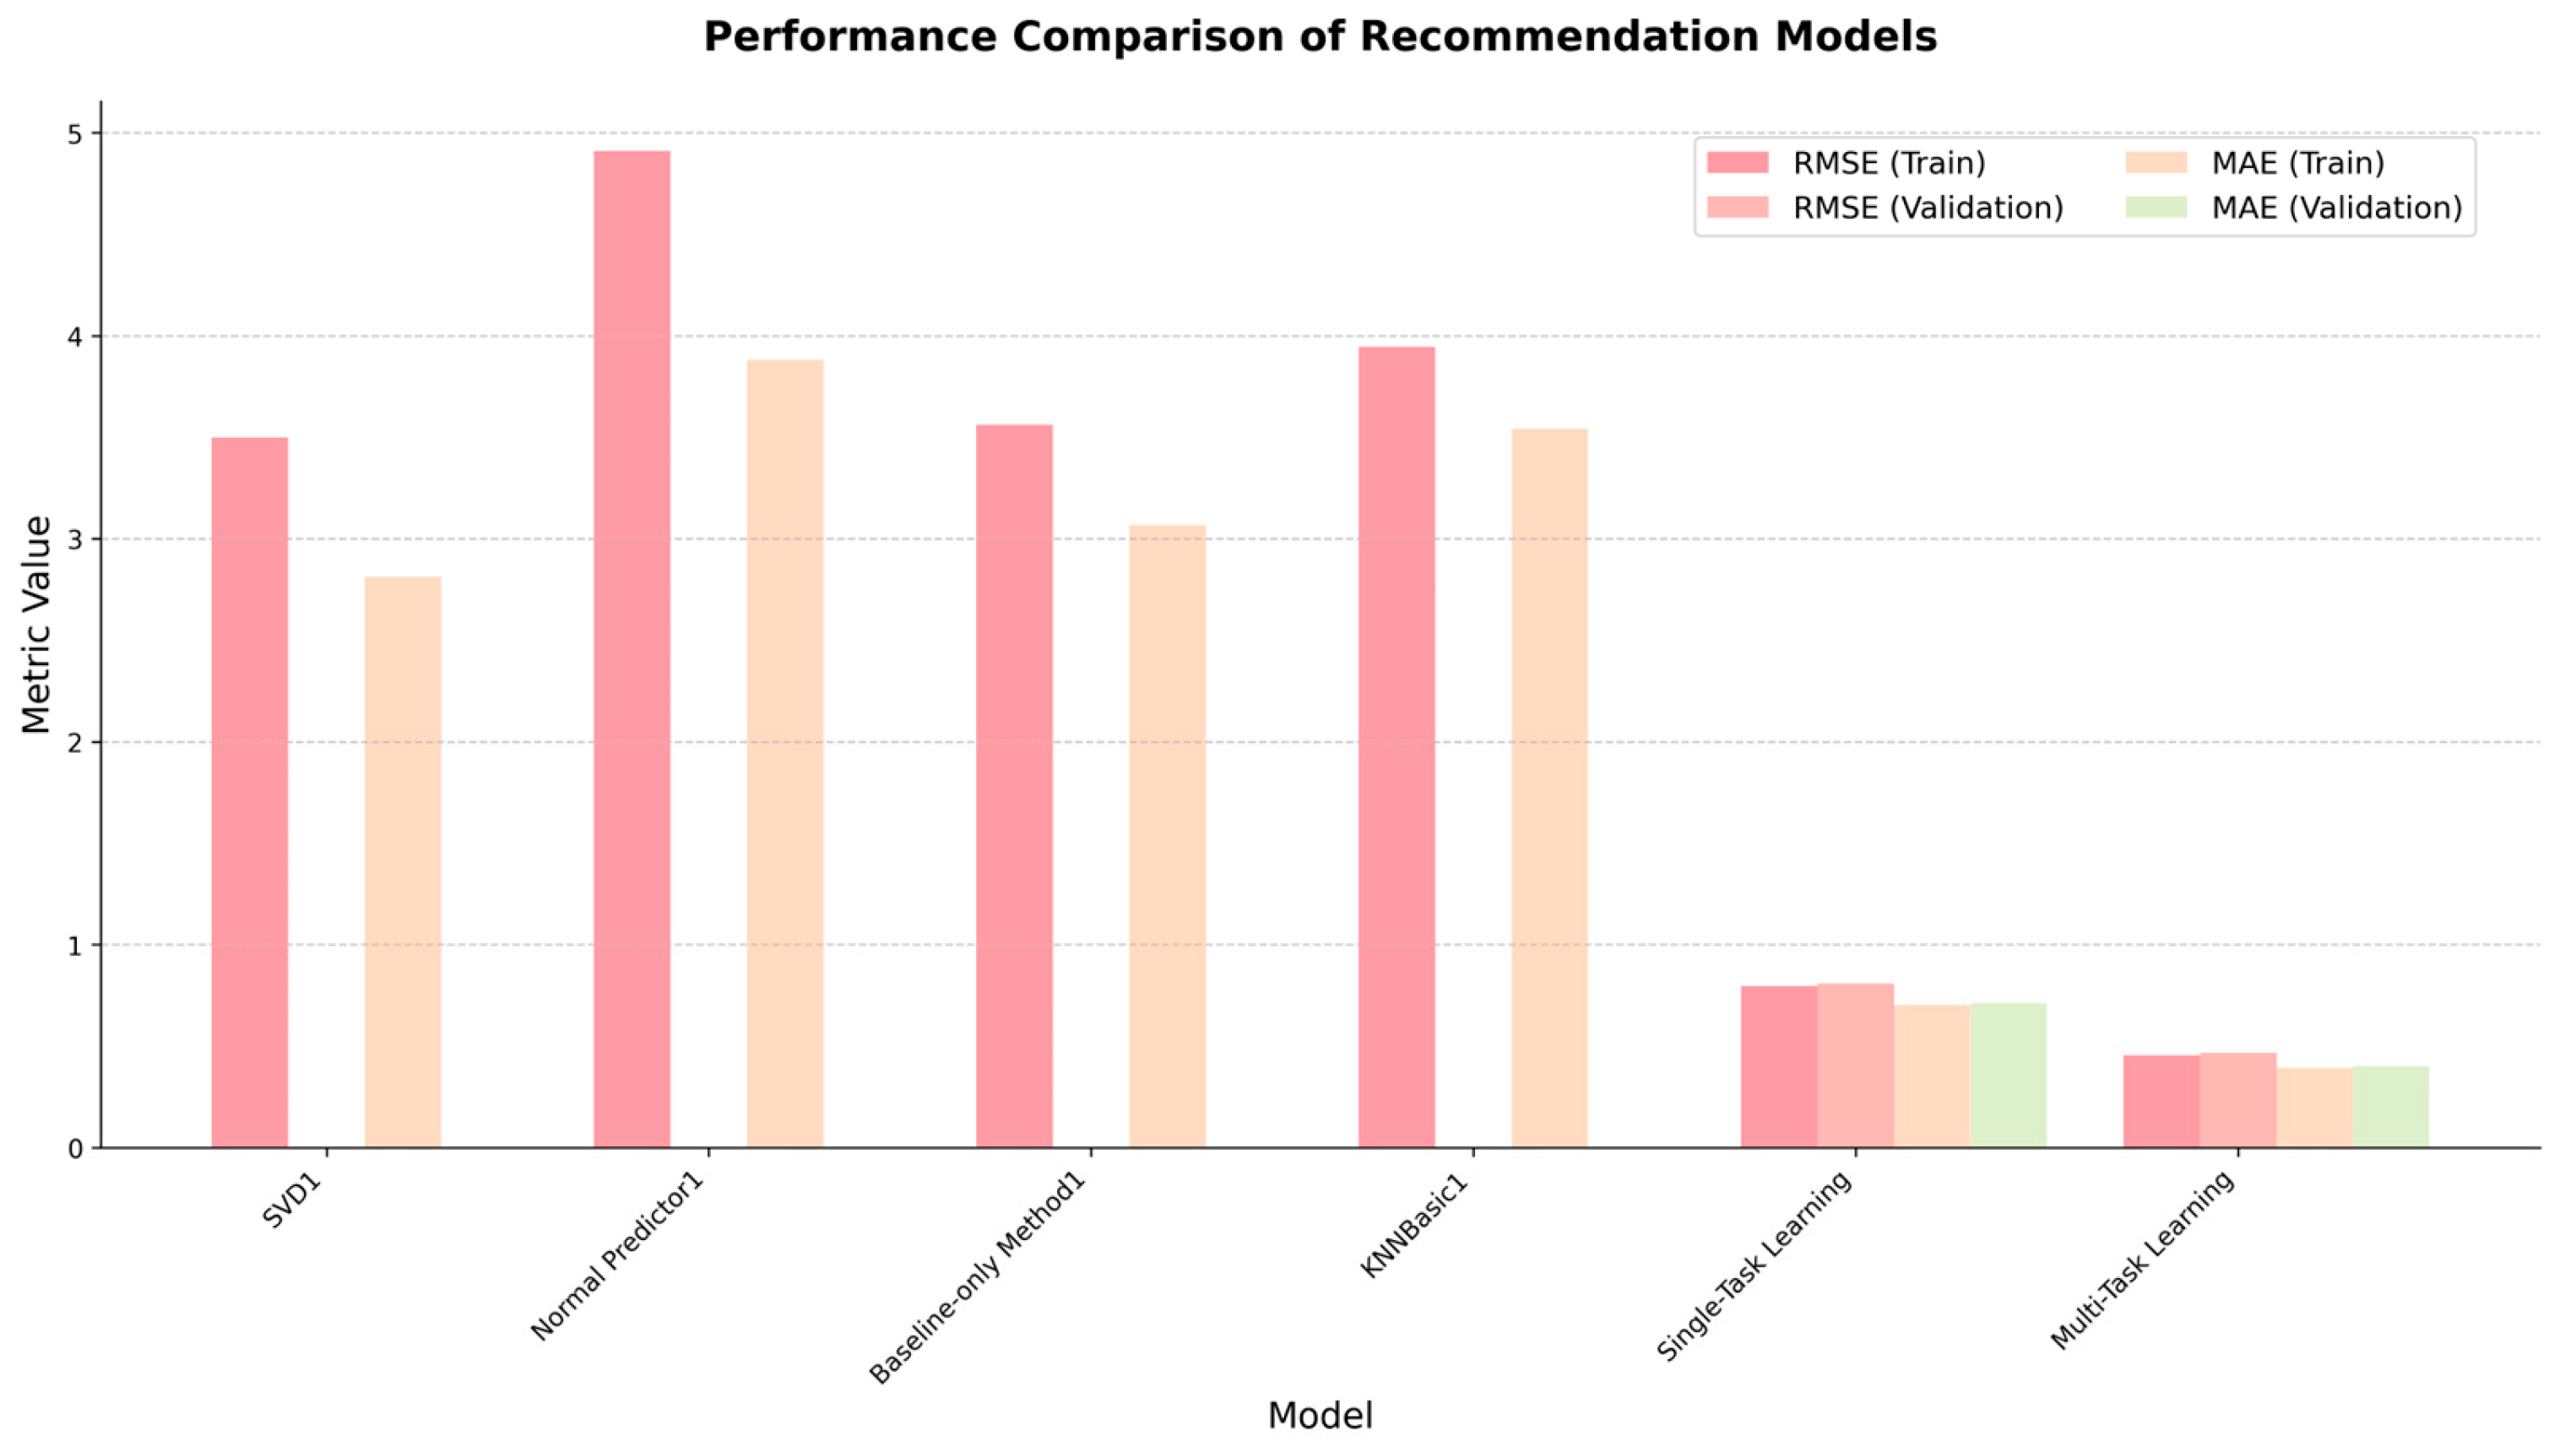
The results on the Book Recommendation Dataset are presented in Table 5. Among the baseline models, the SVD model demonstrated the best performance, achieving an RMSE of 3.5 and an MAE of 2.8148 on the training set. The Normal Predictor, Baseline-only Method, and KNNBasic models exhibited higher RMSE and MAE values, indicating their relative limitations in generalizing to this new domain.
Figure 10 illustrates the same results graphically. Notably, the multi-task learning model outperformed all other models, including the single-task learning model, achieving the lowest RMSE of 0.4563 and MAE of 0.3911 on the training set, and an RMSE of 0.4676 and an MAE of 0.4015 on the validation set. These results demonstrate the multi-task learning model’s superior generalization capability and ability to adapt to diverse domains effectively.

6.2.2. Comparison of Model Performance with Different Data Features

A comparison of model performance with different data features was conducted on the Book Recommendation Dataset.
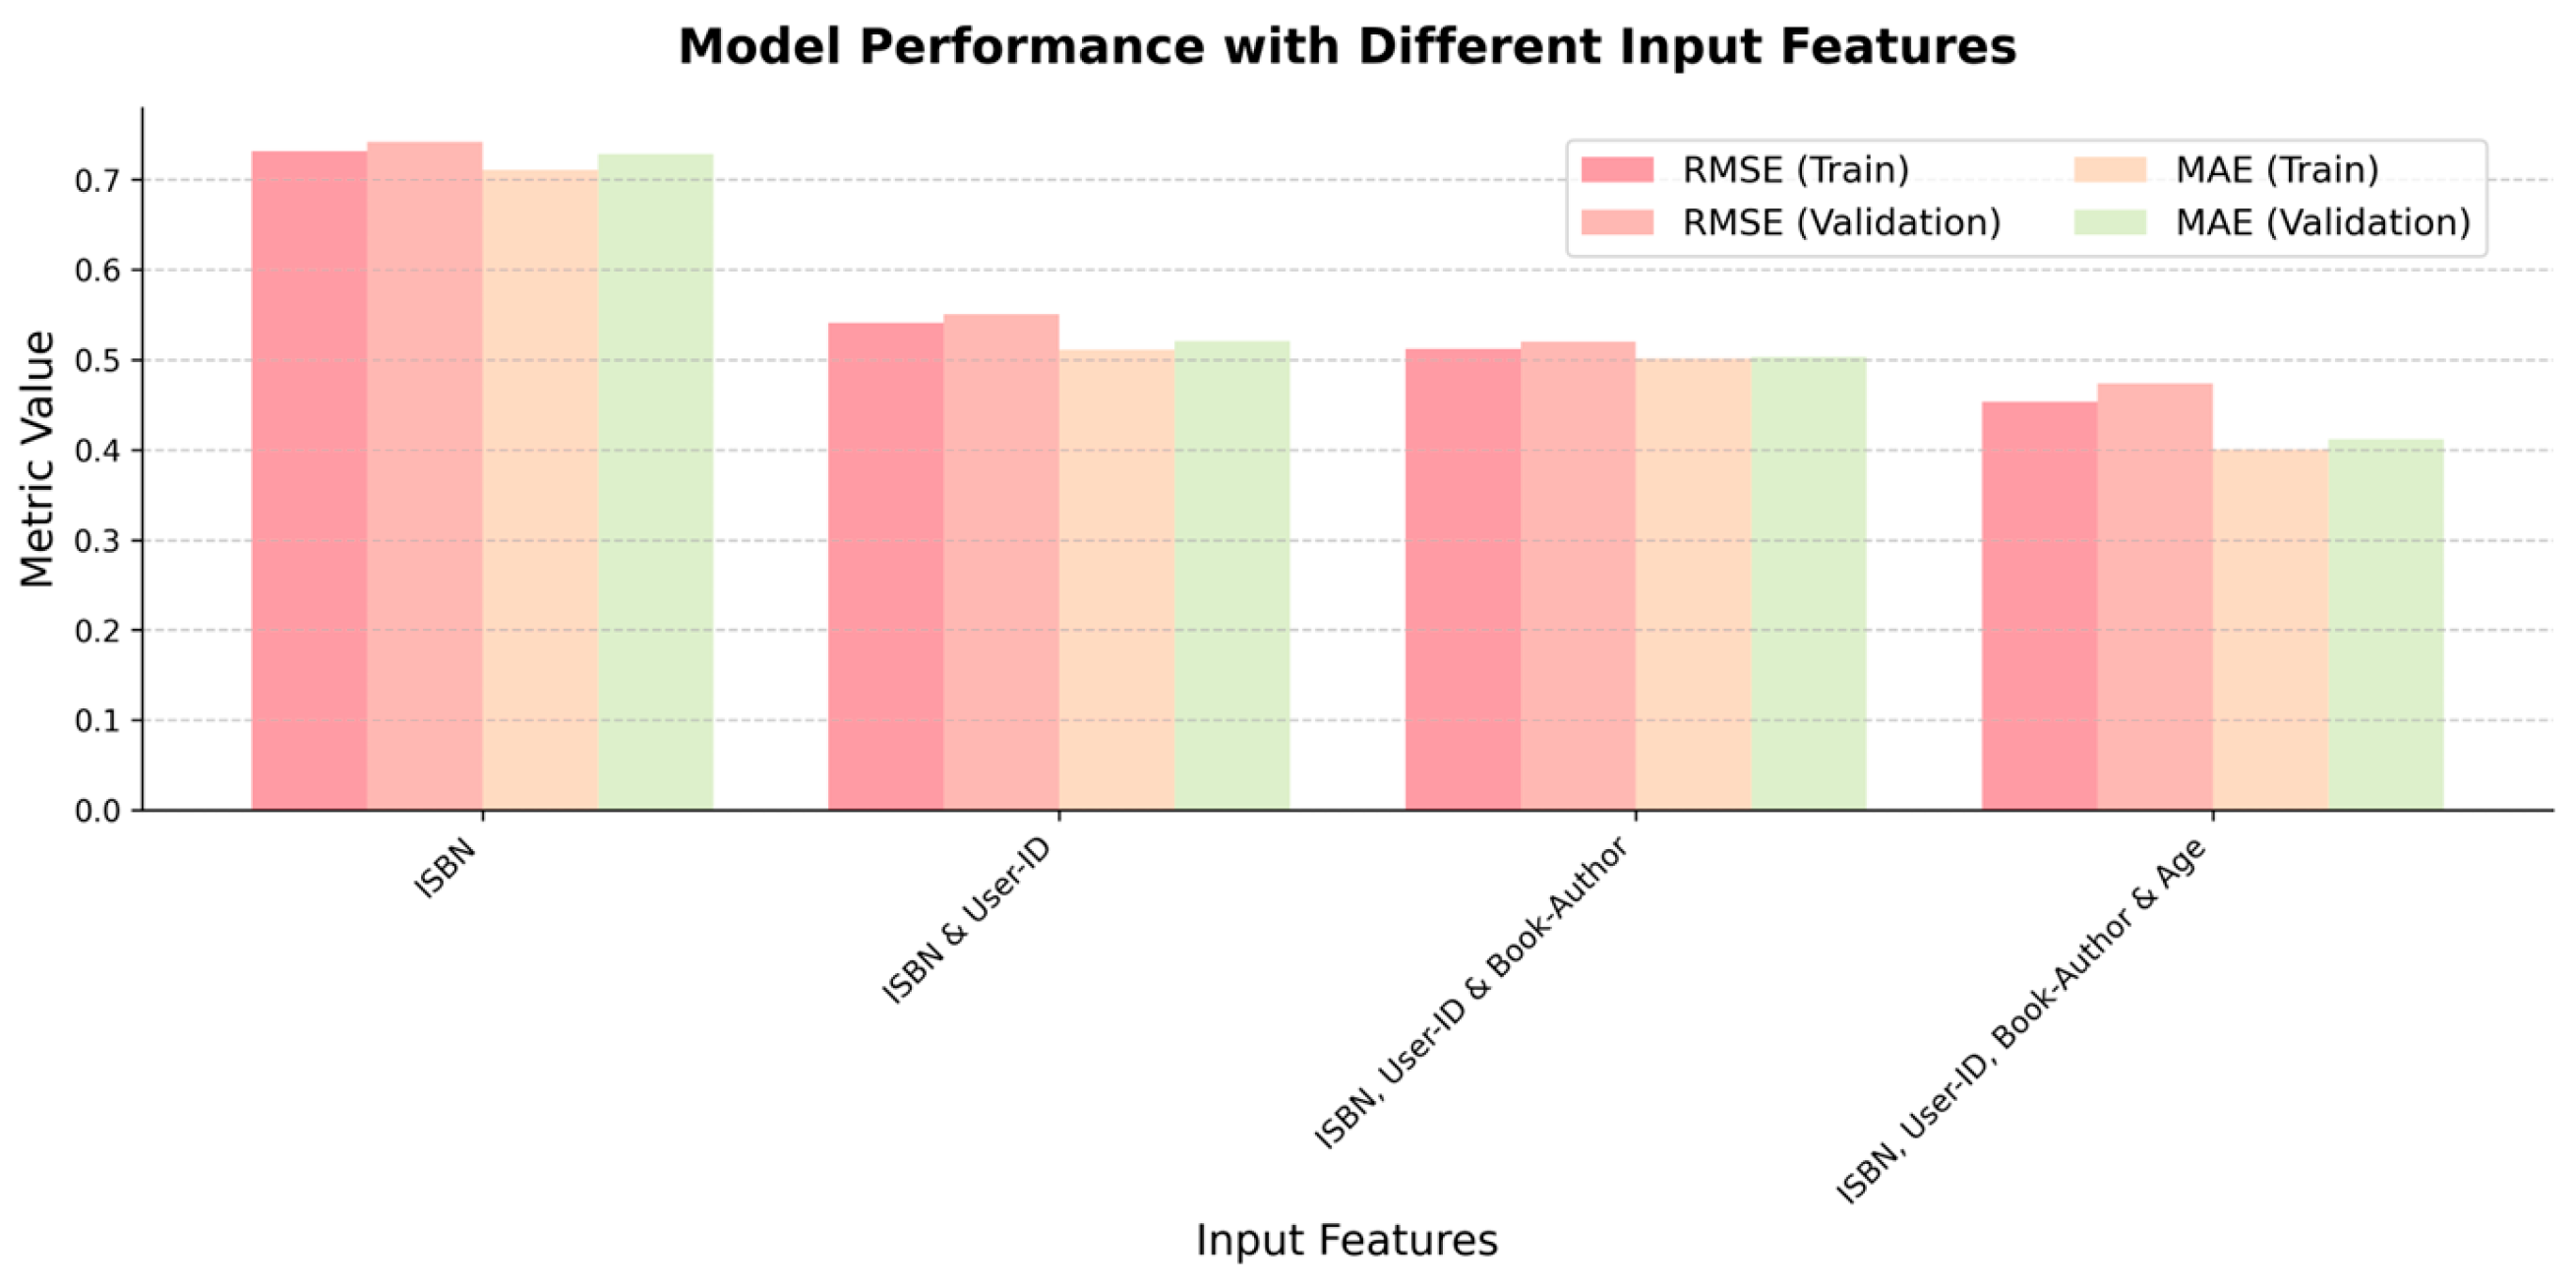
The results are presented in Table 6, which reports the root mean squared error (RMSE) and mean absolute error (MAE) metrics for models trained with varying combinations of input features, including ISBN, User-ID, Book-Author, and Age, on both the training and validation sets. These metrics provide insights into the impact of different data features on the prediction accuracy and generalization ability of the models.
Figure 11 illustrates the same results graphically. It can be observed that incorporating additional input features progressively improves the model’s performance. The model trained with only the ISBN feature achieved an RMSE of 0.7312 and an MAE of 0.7105 on the training set. By incorporating User-ID, Book-Author, and Age features, the model’s performance was enhanced, with the combination of ISBN, User-ID, Book-Author, and Age features achieving the lowest RMSE of 0.4531 and MAE of 0.4005 on the training set, and an RMSE of 0.4735 and an MAE of 0.4121 on the validation set. These results demonstrate the importance of leveraging relevant data features to enhance the model’s generalization capability and ability to adapt to diverse domains effectively.

6.3. Discussion

Overall, integrating multiple heterogeneous information sources, such as user IDs, movie genres, and tags, remains crucial for enhancing the performance of recommendation systems. Relying solely on movie ID information is clearly insufficient, and user information and diverse content features are necessary to fully exploit the patterns within the data.
Among all input feature combinations, the final combination achieved the optimal performance, indicating that the model can effectively utilize these heterogeneous information sources to learn more generalized and robust representations, resulting in the best recommendation accuracy on both the training and validation sets.
Therefore, when designing recommendation system models, we should strive to incorporate various forms of information sources, including user data, item content data, and others, to fully exploit the value of the data. Through proper feature engineering and model design, it is possible to obtain more accurate and highly generalizable recommendations. At the same time, we need to be aware that different features may have varying impacts on model performance, and adjustments should be made according to specific circumstances.

7. Conclusions

This paper evaluated the impact of different models and input features on the performance of recommendation systems. Table 3 compared six models: the normal predictor algorithm, the baseline-only method, KNN-based models, SVD, single-task learning, and multi-task learning, in terms of RMSE and MAE metrics. The results showed that the multi-task learning model achieved the best performance on both the training and validation sets, with the lowest RMSE and MAE values, indicating that this model can better learn patterns within the data and provide more accurate recommendations.
Table 4 investigated the influence of input feature combinations on model performance. We found that using MovieId or ISBN as the sole input feature resulted in very limited performance. Incorporating the UserId feature significantly improved performance, highlighting the importance of user information in encoding preference patterns. Further adding content features led to further reductions in RMSE and MAE on both the training and validation sets, reaching optimal levels.
These findings underscore the importance of integrating heterogeneous information sources. Recommendation systems should not rely solely on single content features like movie IDs but should also incorporate user data, movie genres, tags, and other diverse information sources. Through feature engineering and model design, the patterns within the data can be fully exploited, improving recommendation accuracy and generalization ability.
In summary, this paper’s main conclusions are twofold: (1) Advanced model architectures, such as multi-task learning, can significantly enhance recommendation performance; (2) Integrating heterogeneous information sources, including user data and content data, is crucial for obtaining high-quality recommendation systems. These conclusions provide valuable insights and guidance for future recommendation system model design and feature engineering.
Although the proposed multi-task learning approach demonstrated promising results, there are a few key limitations to acknowledge. Firstly, the evaluation metrics employed primarily focused on rating prediction accuracy but did not fully capture important qualitative aspects that contribute to user satisfaction and engagement, such as diversity, novelty, and serendipity of the recommendations. Secondly, the integration of other potentially valuable data sources, such as social network data and user-generated reviews, was not explored, which could further enhance recommendation quality and personalization.
For future work, we plan to explore more advanced multi-task learning architectures. This could involve different ways of sharing information across tasks or adding new auxiliary tasks. We also want to evaluate our approaches on larger and more diverse datasets from other domains like e-commerce or social media. Incorporating additional data sources and features, such as social network data or user reviews, may further improve recommendation accuracy. Developing models that provide explainable and fair recommendations is also valuable for real-world deployment. Finally, we aim to conduct online user studies to assess the practical utility of our models, and investigate techniques to improve scalability and efficiency for large-scale systems.

Author Contributions

Conceptualization, Q.W.; Data curation, Q.W., Y.C., Z.H. and M.X.; Formal analysis, Q.W., E.J., H.Z., Y.Y., Z.H. and M.X.; Investigation, E.J., H.Z., Y.Y., Z.H. and M.X.; Methodology, Q.W.; Project administration, M.X.; Resources, H.Z., Y.C., Y.Y., D.B.D. and M.X.; Software, Q.W., E.J., Y.C. and D.B.D.; Supervision, M.X.; Visualization, E.J., Y.Y. and Z.H.; Writing—original draft, M.X.; Writing—review and editing, Q.W., Y.Y., D.B.D. and Z.H. All authors have read and agreed to the published version of the manuscript.

Funding

This work was supported in part by the National Natural Science Foundation of China, Grant/Award Numbers: U1809209; Key Project of Zhejiang Provincial Natural Science Foundation, Grant/Award Numbers: LD21F020001, LZ20F020022; Major Project of Wenzhou Natural Science Foundation, Grant/Award Numbers: ZY2019020; Wenzhou Municipal Science and Technology Bureau, Grant/Award Numbers: G20210009.

Institutional Review Board Statement

Not applicable.

Informed Consent Statement

Not applicable.

Data Availability Statement

Publicly available datasets were analyzed in this study. These datasets can be found here: https://grouplens.org/datasets/movielens/ (accessed on 15 May 2022). https://www.kaggle.com/datasets/arashnic/book-recommendation-dataset (accessed on 16 May 2022).

Conflicts of Interest

The authors declare that they have no conflicts of interest.

References

  1. Natarajan, S.; Vairavasundaram, S.; Natarajan, S.; Gandomi, A.H. Resolving Data Sparsity and Cold Start Problem in Collaborative Filtering Recommender System Using Linked Open Data. Expert Syst. Appl. 2020, 149, 113248. [Google Scholar] [CrossRef]
  2. Zhang, Z.; Zhang, Y.; Ren, Y. Employing Neighborhood Reduction for Alleviating Sparsity and Cold Start Problems in User-Based Collaborative Filtering. Inf. Retr. J. 2020, 23, 449–472. [Google Scholar] [CrossRef]
  3. Afoudi, Y.; Lazaar, M.; Al Achhab, M. Hybrid Recommendation System Combined Content-Based Filtering and Collaborative Prediction Using Artificial Neural Network. Simul. Model. Pract. Theory 2021, 113, 102375. [Google Scholar] [CrossRef]
  4. Widayanti, R.; Chakim, M.H.R.; Lukita, C.; Rahardja, U.; Lutfiani, N. Improving Recommender Systems Using Hybrid Techniques of Collaborative Filtering and Content-Based Filtering. J. Appl. Data Sci. 2023, 4, 289–302. [Google Scholar] [CrossRef]
  5. Zheng, Y.; Wang, D. A Survey of Recommender Systems with Multi-Objective Optimization. Neurocomputing 2021, 474, 141–153. [Google Scholar] [CrossRef]
  6. Zaizi, F.E.; Qassimi, S.; Rakrak, S. Multi-Objective Optimization with Recommender Systems: A Systematic Review. Inf. Syst. 2023, 117, 102233. [Google Scholar] [CrossRef]
  7. Njeri, N.R.; Ndung’u, R.N.; Mariga, W.G. Developing Hybrid-Based Recommender System with Naïve Bayes Optimization to Increase Prediction Efficiency. Int. J. Comput. Inf. Technol. 2021, 10, 96–103. [Google Scholar] [CrossRef]
  8. Fu, Z.; Niu, X.; Maher, M.L. Deep Learning Models for Serendipity Recommendations: A Survey and New Perspectives. ACM Comput. Surv. 2023, 56, 1–26. [Google Scholar] [CrossRef]
  9. Harper, F.M.; Konstan, J.A. The MovieLens Datasets: History and context. ACM Trans. Interact. Intell. Syst. 2015, 5, 1–19. [Google Scholar] [CrossRef]
  10. GroupLens. MovieLens 20M Dataset. Available online: https://www.kaggle.com/datasets/grouplens/movielens-20m-dataset (accessed on 15 May 2022).
  11. Ziegler, C.-N. Book Recommendation Dataset. Available online: https://www.kaggle.com/datasets/arashnic/book-recommendation-dataset (accessed on 16 May 2022).
  12. Eliyas, S.; Ranjana, P. Recommendation Systems: Content-Based Filtering vs Collaborative Filtering. In Proceedings of the 2022 2nd International Conference on Advance Computing and Innovative Technologies in Engineering (ICACITE), Greater Noida, India, 28–29 April 2022; pp. 1360–1365. [Google Scholar]
  13. Javed, U.; Shaukat, K.; Hameed, I.A.; Iqbal, F.; Mahboob Alam, T.; Luo, S. A Review of Content-Based and Context-Based Recommendation Systems. Int. J. Emerg. Technol. Learn. 2021, 16, 274. [Google Scholar] [CrossRef]
  14. Nallamala, S.H.; Bajjuri, U.R.; Anandarao, S.; Prasad, D.D.; Mishra, P. A Brief Analysis of Collaborative and Content Based Filtering Algorithms Used in Recommender Systems. IOP Conf. Ser. Mater. Sci. Eng. 2020, 981, 022008. [Google Scholar] [CrossRef]
  15. Wu, X. Comparison between Collaborative Filtering and Content-Based Filtering. Highlights Sci. Eng. Technol. 2022, 16, 480–489. [Google Scholar] [CrossRef]
  16. Zhou, Y.; Cao, Y.; Shang, Y.; Zhou, C.; Pan, S.; Zheng, L.; Li, Q. Explainable Hyperbolic Temporal Point Process for User-Item Interaction Sequence Generation. ACM Trans. Inf. Syst. 2023, 41, 1–26. [Google Scholar] [CrossRef]
  17. Alamdari, P.M.; Navimipour, N.J.; Hosseinzadeh, M.; Safaei, A.A.; Darwesh, A. A Systematic Study on the Recommender Systems in the E-Commerce. IEEE Access 2020, 8, 115694–115716. [Google Scholar] [CrossRef]
  18. Peng, S.; Siet, S.; Ilkhomjon, S.; Kim, D.-Y.; Park, D.-S. Integration of Deep Reinforcement Learning with Collaborative Filtering for Movie Recommendation Systems. Appl. Sci. 2024, 14, 1155. [Google Scholar] [CrossRef]
  19. Martins, G.B.; Papa, J.P.; Adeli, H. Deep Learning Techniques for Recommender Systems Based on Collaborative Filtering. Expert Syst. 2020, 37, e12647. [Google Scholar] [CrossRef]
  20. Fang, J.; Li, B.; Gao, M. Collaborative Filtering Recommendation Algorithm Based on Deep Neural Network Fusion. Int. J. Sens. Netw. 2020, 34, 71. [Google Scholar] [CrossRef]
  21. Aljunid, M.F.; Huchaiah, M.D. An Efficient Hybrid Recommendation Model Based on Collaborative Filtering Recommender Systems. CAAI Trans. Intell. Technol. 2021, 6, 480–492. [Google Scholar] [CrossRef]
  22. Feng, C.; Liang, J.; Song, P.; Wang, Z. A Fusion Collaborative Filtering Method for Sparse Data in Recommender Systems. Inf. Sci. 2020, 521, 365–379. [Google Scholar] [CrossRef]
  23. Huda, A.A.; Fajarudin, R.; Hadinegoro, A. Sistem Rekomendasi Content-Based Filtering Menggunakan TF-IDF Vector Similarity Untuk Rekomendasi Artikel Berita. Build. Inform. Technol. Sci. 2022, 4, 1679–1686. [Google Scholar] [CrossRef]
  24. Wakil, K.; Bakhtyar, R.; Ali, K.; Alaadin, K. Improving Web Movie Recommender System Based on Emotions. Int. J. Adv. Comput. Sci. Appl. 2015, 6, 218–226. [Google Scholar] [CrossRef]
  25. Geetha, G.; Safa, M.; Fancy, C.; Saranya, D. A Hybrid Approach Using Collaborative Filtering and Content Based Filtering for Recommender System. J. Phys. Conf. Ser. 2018, 1000, 012101. [Google Scholar] [CrossRef]
  26. Ko, H.; Lee, S.; Park, Y.; Choi, A. A Survey of Recommendation Systems: Recommendation Models, Techniques, and Application Fields. Electronics 2022, 11, 141. [Google Scholar] [CrossRef]
  27. Li, H.; Han, D. A Novel Time-Aware Hybrid Recommendation Scheme Combining User Feedback and Collaborative Filtering. Mob. Inf. Syst. 2020, 2020, 8896694. [Google Scholar] [CrossRef]
  28. Nasser, A.M.; Bhagat, J.; Agrawal, A.; Devadas, T.J. Mean-Reversion Based Hybrid Movie Recommender System Using Collaborative and Content-Based Filtering Methods. Int. J. Stat. Appl. Math. 2023, 8, 121–137. [Google Scholar] [CrossRef]
  29. Saranya, K.G.; Sharma, A. A Critical Review on Location Based Hybrid Filtering Recommender Systems. J. Soft Comput. Paradig. 2023, 5, 1–10. [Google Scholar] [CrossRef]
  30. Ibrahim, M.A.; Bajwa, I.S.; Sarwar, N.; Hajjej, F.; Sakr, H.A. An Intelligent Hybrid Neural Collaborative Filtering Approach for True Recommendations. IEEE Access 2023, 11, 64831–64849. [Google Scholar] [CrossRef]
  31. Zhou, H.; Xiong, F.; Chen, H. A Comprehensive Survey of Recommender Systems Based on Deep Learning. Appl. Sci. 2023, 13, 11378. [Google Scholar] [CrossRef]
  32. Bobadilla, J.; Ortega, F.; Gutiérrez, A.; Alonso, S. Classification-Based Deep Neural Network Architecture for Collaborative Filtering Recommender Systems. Int. J. Interact. Multimed. Artif. Intell. 2020, 6, 68. [Google Scholar] [CrossRef]
  33. Yoon, J.H.; Jang, B. Evolution of Deep Learning-Based Sequential Recommender Systems: From Current Trends to New Perspectives. IEEE Access 2023, 11, 54265–54279. [Google Scholar] [CrossRef]
  34. Wu, L.; Xia, Y.; Min, S.; Xia, Z. Deep Attentive Interest Collaborative Filtering for Recommender Systems. IEEE Trans. Emerg. Top. Comput. 2023, 1, 1–15. [Google Scholar] [CrossRef]
  35. Chicaiza, J.; Valdiviezo-Diaz, P. A Comprehensive Survey of Knowledge Graph-Based Recommender Systems: Technologies, Development, and Contributions. Information 2021, 12, 232. [Google Scholar] [CrossRef]
  36. Sulikowski, P.; Kucznerowicz, M.; Bąk, I.; Romanowski, A.; Zdziebko, T. Online Store Aesthetics Impact Efficacy of Product Recommendations and Highlighting. Sensors 2022, 22, 9186. [Google Scholar] [CrossRef] [PubMed]
  37. Sulikowski, P. Evaluation of Varying Visual Intensity and Position of a Recommendation in a Recommending Interface Towards Reducing Habituation and Improving Sales. In Advances in E-Business Engineering for Ubiquitous Computing; ICEBE 2019; Lecture Notes on Data Engineering and Communications Technologies; Chao, K.M., Jiang, L., Hussain, O., Ma, S.P., Fei, X., Eds.; Springer: Cham, Switzerland, 2020; Volume 41. [Google Scholar] [CrossRef]
  38. Sulikowski, P.; Zdziebko, T.; Hussain, O.; Wilbik, A. Fuzzy Approach to Purchase Intent Modeling Based on User Tracking For E-commerce Recommenders. In Proceedings of the 2021 IEEE International Conference on Fuzzy Systems (FUZZ-IEEE), Luxembourg, 11–14 July 2021; pp. 1–8. [Google Scholar]
  39. Gao, M.; Li, J.-Y.; Chen, C.-H.; Li, Y.; Zhang, J.; Zhan, Z.-H. Enhanced Multi-Task Learning and Knowledge Graph-Based Recommender System. IEEE Trans. Knowl. Data Eng. 2023, 35, 10281–10294. [Google Scholar] [CrossRef]
  40. Deng, Y.; Zhang, W.; Xu, W.; Lei, W.; Chua, T.-S.; Lam, W. A Unified Multi-Task Learning Framework for Multi-Goal Conversational Recommender Systems. ACM Trans. Inf. Syst. 2023, 41, 1–25. [Google Scholar] [CrossRef]
  41. Wan, X. Influence of Feature Scaling on Convergence of Gradient Iterative Algorithm. J. Phys. Conf. Ser. 2019, 1213, 032021. [Google Scholar] [CrossRef]
  42. Zhao, C.; Sun, S.; Han, L.; Peng, Q. Hybrid matrix factorization for recommender systems in social networks. Neural Netw. World 2016, 26, 559–569. [Google Scholar] [CrossRef]
  43. Abdesselam, R. A Topological Approach of Principal Component Analysis. Int. J. Data Sci. Anal. 2021, 7, 20. [Google Scholar] [CrossRef]
  44. Atanu, E.Y. Analysis of Nigeria’s Crime Data: A Principal Component Approach Using Correlation Matrix. Int. J. Sci. Res. Publ. 2019, 9, p8503. [Google Scholar] [CrossRef]
  45. Salih Hasan, B.M.; Abdulazeez, A.M. A Review of Principal Component Analysis Algorithm for Dimensionality Reduction. J. Soft Comput. Data Min. 2021, 2, 20–30. [Google Scholar] [CrossRef]
  46. Yao, J.; Lopes, M. Rates of Bootstrap Approximation for Eigenvalues in High-Dimensional PCA. Stat. Sin. 2024, 33, 1461–1481. [Google Scholar] [CrossRef]
  47. Langworthy, B.; Cai, J.; Corty, R.W.; Kosorok, M.R.; Fine, J.P. Principal Components Analysis for Right Censored Data. Stat. Sin. 2023, 33, 1985–2016. [Google Scholar] [CrossRef]
  48. Sundararajan, R.R. Principal Component Analysis Using Frequency Components of Multivariate Time Series. Comput. Stat. Data Anal. 2021, 157, 107164. [Google Scholar] [CrossRef]
  49. Jolliffe, I.T.; Cadima, J. Principal Component Analysis: A Review and Recent Developments. Philos. Trans. R. Soc. A: Math. Phys. Eng. Sci. 2016, 374, 20150202. [Google Scholar] [CrossRef]
  50. Sahityabhilash, K.; Shyry, S.P. Impact of Loss Function Using M-LSTM Classifier for Sequence Data. Int. J. Psychosoc. Rehabil. 2020, 24, 3487–3494. [Google Scholar] [CrossRef]
  51. Dessain, J. Improving the Prediction of Asset Returns with Machine Learning by Using a Custom Loss Function. Adv. Artif. Intell. Mach. Learn. 2023, 3, 1640–1653. [Google Scholar] [CrossRef]
  52. Jun, H.; Kim, H.J. Loss Functions in Machine Learning for Seismic Random Noise Attenuation. Geophys. Prospect. 2023, 72, 978–995. [Google Scholar] [CrossRef]
  53. Hurtik, P.; Tomasiello, S.; Hula, J.; Hynar, D. Binary Cross-Entropy with Dynamical Clipping. Neural Comput. Appl. 2022, 34, 12029–12041. [Google Scholar] [CrossRef]
  54. Harwell, M. A Strategy for Using Bias and RMSE as Outcomes in Monte Carlo Studies in Statistics. J. Mod. Appl. Stat. Methods 2018, 17, 2726–2739. [Google Scholar] [CrossRef]
  55. Qi, J.; Du, J.; Siniscalchi, S.M.; Ma, X.; Lee, C.-H. On Mean Absolute Error for Deep Neural Network Based Vector-To-Vector Regression. IEEE Signal Process. Lett. 2020, 27, 1485–1489. [Google Scholar] [CrossRef]
  56. Colace, F.; Conte, D.; De Santo, M.; Lombardi, M.; Santaniello, D.; Valentino, C. A Content-Based Recommendation Approach Based on Singular Value Decomposition. Connect. Sci. 2022, 34, 2158–2176. [Google Scholar] [CrossRef]
Figure 1. Correlation Heatmap.
Information 15 00312 g001
Figure 2. Cumulative Variance Ratio.
Information 15 00312 g002
Figure 3. Scree Plot of Eigenvalues.
Information 15 00312 g003
Figure 4. Loadings of Features on Principal Components.
Information 15 00312 g004
Figure 5. Loss Function Performance.
Information 15 00312 g005
Figure 6. RMSE of Rating Estimator.
Information 15 00312 g006
Figure 7. MAE of Rating Estimator.
Information 15 00312 g007
Figure 8. Comparison of Different Model Using the MovieLens Dataset.
Information 15 00312 g008
Figure 9. Model Performance with Different Data Features Using the MovieLens Dataset.
Information 15 00312 g009
Figure 10. Comparison of Different Models Using the Book Recommendation Dataset.
Information 15 00312 g010
Figure 11. Model Performance with Different Data Features Using the Book Recommendation Dataset.
Information 15 00312 g011
Table 1. Feature Correlation Matrix Table.
GenresTagId UserIdMovieId
Genres1.000000−0.0004780.013489−0.014273
TagId −0.0004781.0000000.0000760.007608
UserId0.0134890.0000761.000000−0.033311
MovieId−0.0142730.007608−0.0333111.000000
Table 2. The Loadings for Each Feature in Each Principal Component.
Principal ComponentGenresTagIdUserIdMovieId
PC1−0.497154−0.285909−0.6367700.515381
PC20.119684−0.9105690.3859350.087145
PC30.7118010.133904−0.0599090.686891
PC4−0.4815110.2668140.6648230.504944
Table 3. Comparison of Different Models Using the MovieLens Dataset.
Metric ValueDataSVD 1Normal Predictor 1Baseline-Only Method 1KNNBasic 1Single-Task LearningMulti-Task Learning
RMSETraining0.88221.43261.00211.04710.63970.0295
Validation0.65170.0286
MAETraining0.67941.14620.79020.83720.52440.0219
Validation0.52790.0218
1 Five-fold cross-validation is performed on the dataset.
Table 4. Model Performance with Different Data Features Using the MovieLens Dataset.
Metric ValueDataMovieIdMovieId and UserIdMovieId, UserId and GenresMovieId, UserId, Genres and TagId
RMSETraining0.58120.03200.03120.0305
Validation0.61970.03620.03490.0259
MAETraining0.37130.01910.01830.0164
Validation0.41170.02180.01980.0171
Table 5. Comparison of Different Models Using the Book Recommendation Dataset.
Metric ValueDataSVD 1Normal Predictor 1Baseline-Only Method 1KNNBasic 1Single-Task LearningMulti-Task Learning
RMSETraining3.54.91083.56303.94580.79750.4563
Validation0.80730.4676
MAETraining2.81483.88183.06633.54050.70250.3911
Validation0.71230.4015
1 Five-fold cross-validation is performed on the dataset.
Table 6. Model Performance with Different Data Features Using the Book Recommendation Dataset.
Metric ValueDataISBNISBN and User-IDISBN, User-ID and Book-AuthorISBN, User-ID, Book-Author and Age
RMSETraining0.73120.54110.51210.4531
Validation0.74230.55050.52020.4735
MAETraining0.71050.51140.50150.4005
Validation0.72810.52120.50320.4121
Disclaimer/Publisher’s Note: The statements, opinions and data contained in all publications are solely those of the individual author(s) and contributor(s) and not of MDPI and/or the editor(s). MDPI and/or the editor(s) disclaim responsibility for any injury to people or property resulting from any ideas, methods, instructions or products referred to in the content.