1. Introduction
Magnetic resonance imaging (MRI) is a crucial medical imaging technology that provides detailed information on organs, soft tissues, and bones of patients, assisting doctors in optimizing treatment [
1,
2]. Recent advancements in MRI analysis have not only improved the quality of images but also facilitated early detection and assessment of various diseases. For example, transformers and convolutional neural networks (CNNs) have shown promising results in brain MRI analysis for Alzheimer′s dementia diagnosis [
3,
4,
5]. Similarly, vision transformers and CNNs have been extensively studied for fetal brain segmentation from MRI images [
6]. However, despite its diagnostic potential, MRI faces significant challenges in terms of acquisition time and cost, which limits its widespread use in clinical practice. To address these issues, our study focuses on enhancing MRI resolution through super-resolution techniques, specifically leveraging deep learning models. This approach not only accelerates the MRI scanning process but also produces high-resolution images that can aid in various downstream clinical applications, including diagnostic workup and biopsy workup. The slow acquisition rate stems from the demand for detailed information and rigorous calibration requirements, with imaging type, pulse sequence, scanning area, and the number of weighted scans influencing acquisition time [
7]. Moreover, low-resolution MRI images often lack the necessary details for accurate detection and grading of lesions, presenting a significant challenge in clinical practice [
8]. Image quality also impacts acquisition time; although high resolution is preferred, it increases both acquisition time and costs. MRI scans are expensive, and while low-field scanners [
9] reduce costs, they produce lower image resolution. Image super-resolution (SR) in the field of machine learning, particularly SR methods based on generative adversarial networks (GAN) [
10], offer potential for accelerating the MRI scanning process and reconstructing high-quality images. By leveraging these techniques, we can address the clinical challenges posed by low-resolution MRI and improve the accuracy of lesion detection and grading [
11]. While these methods show promise, they also have limitations such as the potential for artifacts and noise amplification, which need to be carefully considered for clinical applications. After performing MRI scans faster and collecting lower-resolution raw data, SR methods can be utilized to reconstruct high-resolution MRI images. By shifting processing time to post-scan data handling, the scanning process can be significantly expedited. Our research primarily focuses on such methods.
In recent decades, significant progress has been made in enhancing image resolution, with SR technology gaining increasing attention in image processing. Deep learning-based methods have outperformed traditional SR algorithms [
12], and this paper focuses on such models. Super-resolution CNN models, in particular, have shown promise in improving MRI resolution and aiding experts in the detection and grading of diseases [
13]. We classify existing deep learning-based SR methods into categories such as linear networks, residual networks, dense networks, and generative adversarial networks. However, despite their progress, previous implementations of CNN for resolution enhancement have exhibited certain gaps, such as difficulties in handling complex textures or lengthy computation times [
14]. SRCNN [
15], the first end-to-end deep learning-based SR algorithm, enlarged low-resolution (LR) images through bicubic interpolation and employed three convolutional layers. Subsequent works increased network layers for better performance, introducing residual structures to address gradient vanishing issues, resulting in models like EDSR [
16]. Dense models were also applied to SR, with examples including SR-GAN-Densenet [
17] and RDN [
18]. While these networks excel in peak signal-to-noise ratios (PSNR), their image fidelity and visual perception quality at higher resolutions are limited. GANs have generated better outputs through adversarial learning, leading to the development of SRGAN [
19], which performs well in image visual perception despite lower PSNR. Similarly, ESRGAN [
20], an enhanced version of SRGAN, further improves the perceptual quality of super-resolved images by introducing residual-in-residual dense blocks and using relativistic adversarial loss. ESRGAN′s contributions highlight the importance of enhancing the GAN framework for super-resolution tasks, which inspires our approach to developing the MRISR model. The success of Transformer [
21,
22,
23] in natural language processing has led to its application in computer vision, including high-level vision tasks. Transformer-based methods have shown superiority in modeling long-range dependencies, but convolutions can still enhance visual representations. Transformer has also been introduced into low-level vision tasks, with Swin Transformer (SwinIR) [
24] demonstrating remarkable performance in SR. However, SwinIR may restore incorrect textures and exhibit block artifacts due to its window partitioning mechanism.
To overcome the limitations and harness the potential of Transformer in SR tasks, we innovatively integrated the VMamba model [
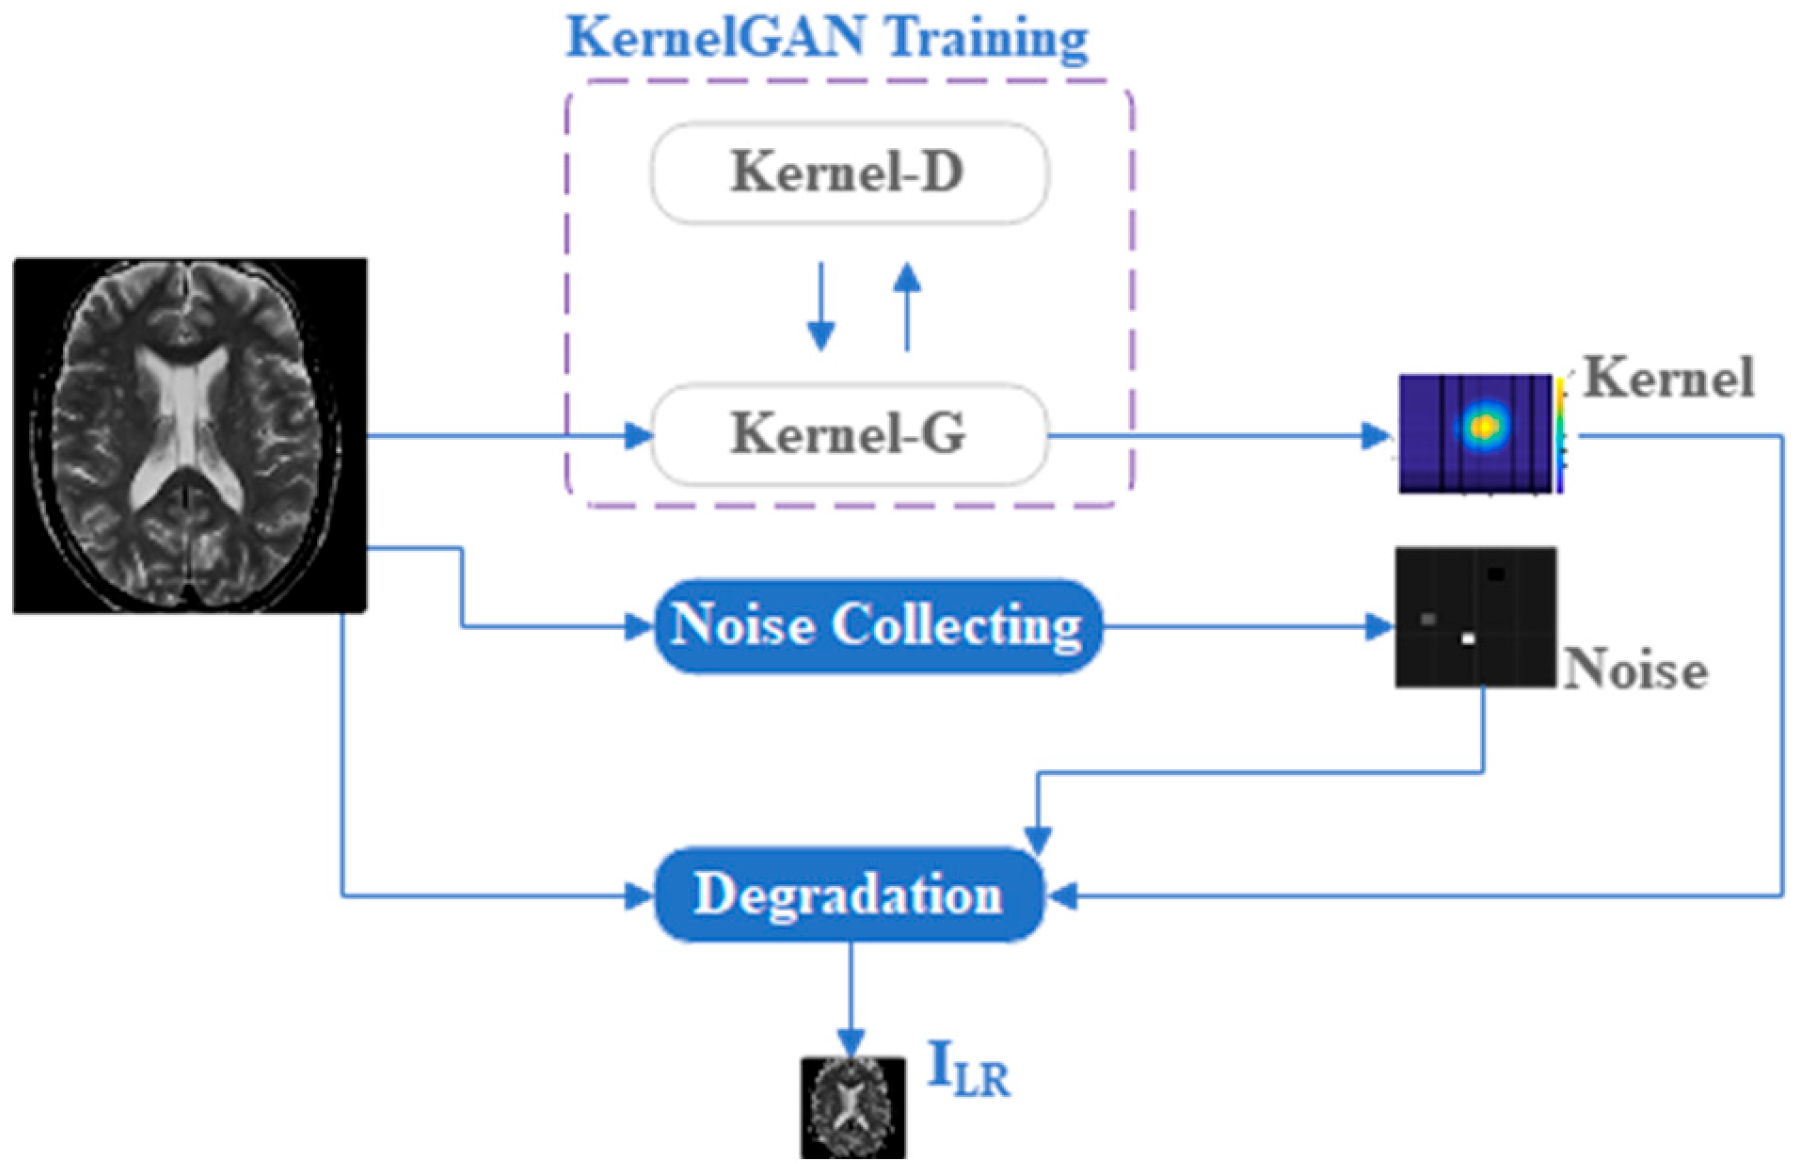
25] with the Transformer model, crafting an overlapping cross-attention block. This modular design energizes an augmented set of pixels for reconstruction, scrutinizing virtually every pixel and faithfully restoring accurate, detailed textures. In the pursuit of quadrupling MRI image resolution, the construction of training datasets for super-resolution analysis networks confronts a myriad of challenges. Notably, the scarcity of naturally occurring high to low resolution image pair training sets emerges as the pivotal obstacle. Conventionally, researchers have relied on bicubic downsampling techniques to generate such image pairs, yet this approach often leads to the loss of frequency-related trajectory details. To tackle this challenge, inspired by the groundbreaking blind SR model KernelGAN [
26] and blind image denoising models [
27,
28,
29,
30], our study leverages generative adversarial networks to explicitly estimate the degradation kernels of natural high- to low-resolution image pairs. Furthermore, we endeavor to quantify the distribution of degradation noise and apply tailored degradation processing to images, thereby establishing a comprehensive dataset of high- to low-resolution image pairs. This approach not only improves the quality of training data but also enhances the robustness and generalizability of our model. However, it is important to note that our model, like any other SR method, may still face challenges in certain extreme cases, such as images with extremely low SNR or complex artifacts, which require further investigation and optimization. Stemming from these two pivotal innovative designs, we introduce the MRISR super-resolution analysis model whose preeminence lies in its unique network architecture and pioneering methodology. This superiority manifests itself in the following salient aspects:
Constructing High-Quality Training Datasets: Innovatively estimating degradation kernels and injecting noise, we crafted a training set of near-natural high- to low-resolution MRI image pairs, surpassing traditional limitations.
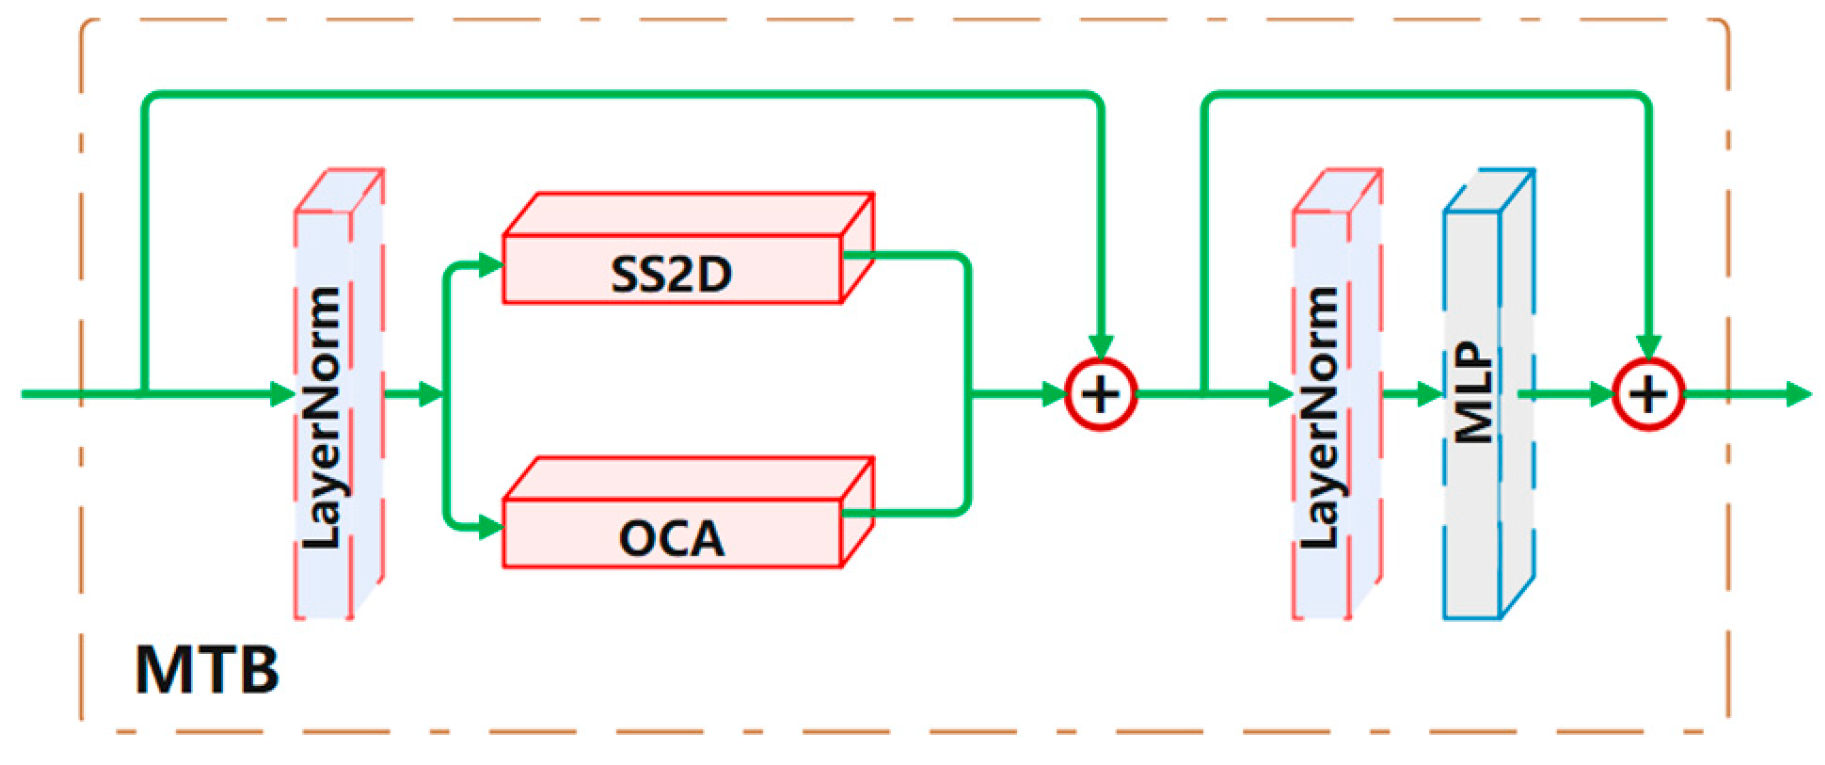
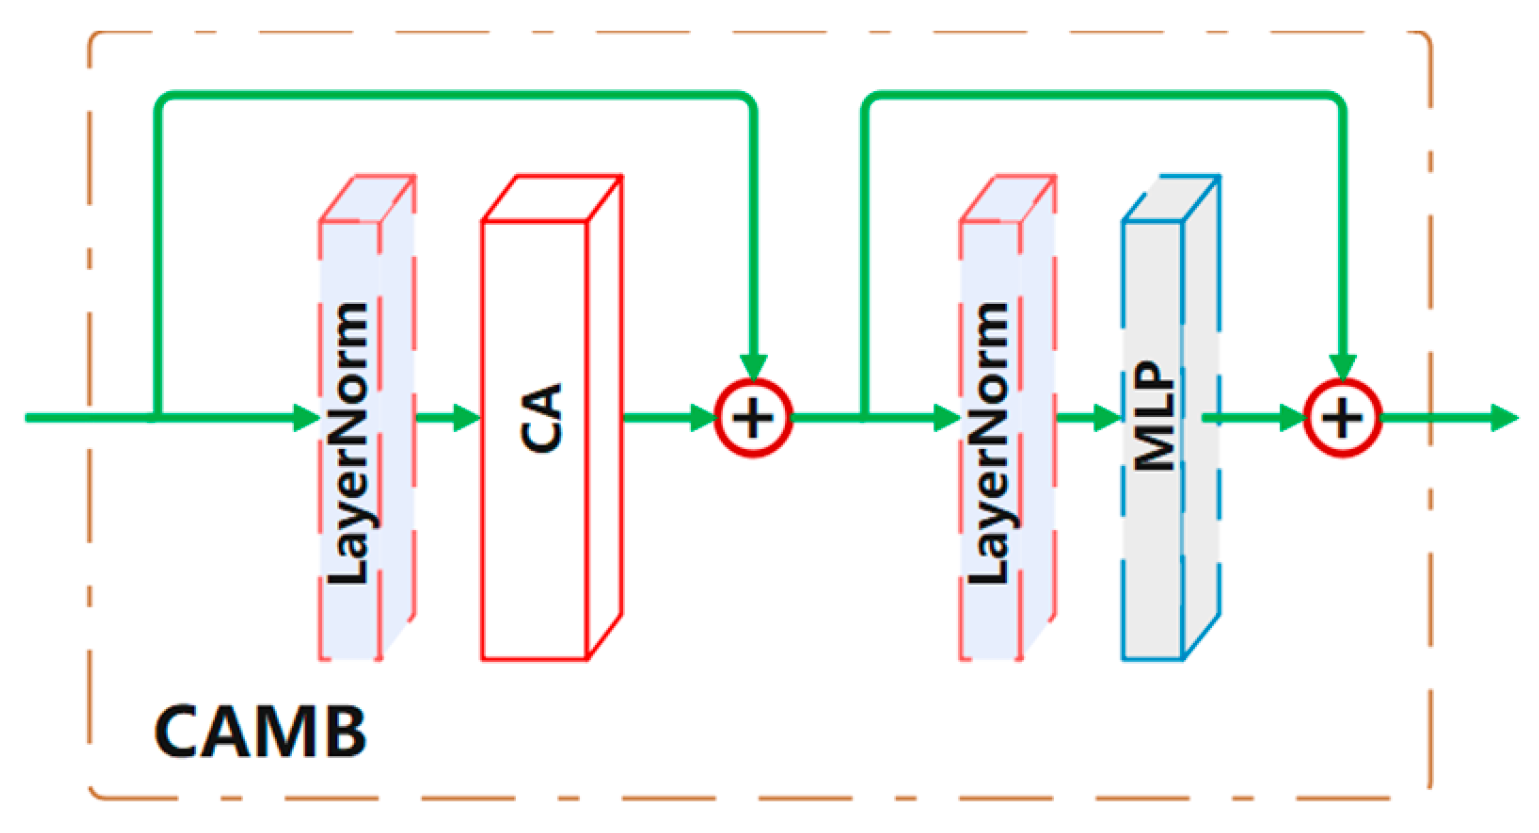
Introducing the VMamba-Transformer MRI Super-Resolution Model: The MRISR model fuses VMamba and Transformer technologies, leveraging mixed Transformer blocks (MTB) and cross-attention mixed blocks (CAMB) to markedly improve image reconstruction quality.
Excellent No-Reference Quality Assessment: The MRISR model excels on multiple no-reference image quality metrics, outperforming current state-of-the-art methods.
Novel Solution for Rapid MRI: Enhancing resolution while preserving image quality, MRISR offers a novel technology for rapid MRI in clinical diagnosis.
3. Experiments and Results
The proposed model, MRISR, along with other comparative models, such as EDSR8-RGB [
32], RCAN [
33], RS-ESRGAN [
34], and KerSRGAN [
35], were all executed and tested within the PyTorch environment. This environment leveraged modules provided by the “sefibk/KernelGAN” project, the “xinntao/BasicSR” project, and the “Tencent/Real-SR” project, all sourced from GitHub repositories. BiCubic interpolation was obtained and calculated directly using built-in Matlab functions.
In this experiment, we utilized the fastMRI [
36] and Fetal MRI [
37] dataset as our foundation. To effectively train and test our model, MRISR initially generated a low-resolution (LR) to high-resolution (HR) image pair dataset (SET_Tr) based on the fastMRI dataset (SET_Src). Specifically, we randomly selected 1936 images from the 36,689 images in SET_Src and trained them individually using KernelGAN, generating a degradation kernel dataset (SET_Ker). Subsequently, we randomly selected another 3976 images from SET_Src and extracted noise patches from these images to construct a noise patch dataset (SET_N). During the model training phase, we individually degraded the images in SET_Src using degradation kernels and injected noise. It is noteworthy that the degradation kernel and injected noise for each image were randomly selected from SET_Ker and SET_N, respectively. This paper randomly selects one sub-dataset in Fetal MRI as the testing dataset (ROI_Te) containing 784 images.
Regarding the network structure parameters and constant coefficients of the loss function for the kernel generator (KGAN-G) and kernel discriminator (KGAN-D) in KernelGAN, they have been extensively described in previous sections and are, therefore, not repeated here. During the training process, both the generator and discriminator employed the ADAM optimizer with identical parameter settings. Specifically, the learning rates for KGAN-G and KGAN-D were set to 0.0002, with a reduction factor of ×0.1 applied every 750 iterations. The entire network underwent a total of 3000 iterations of training.
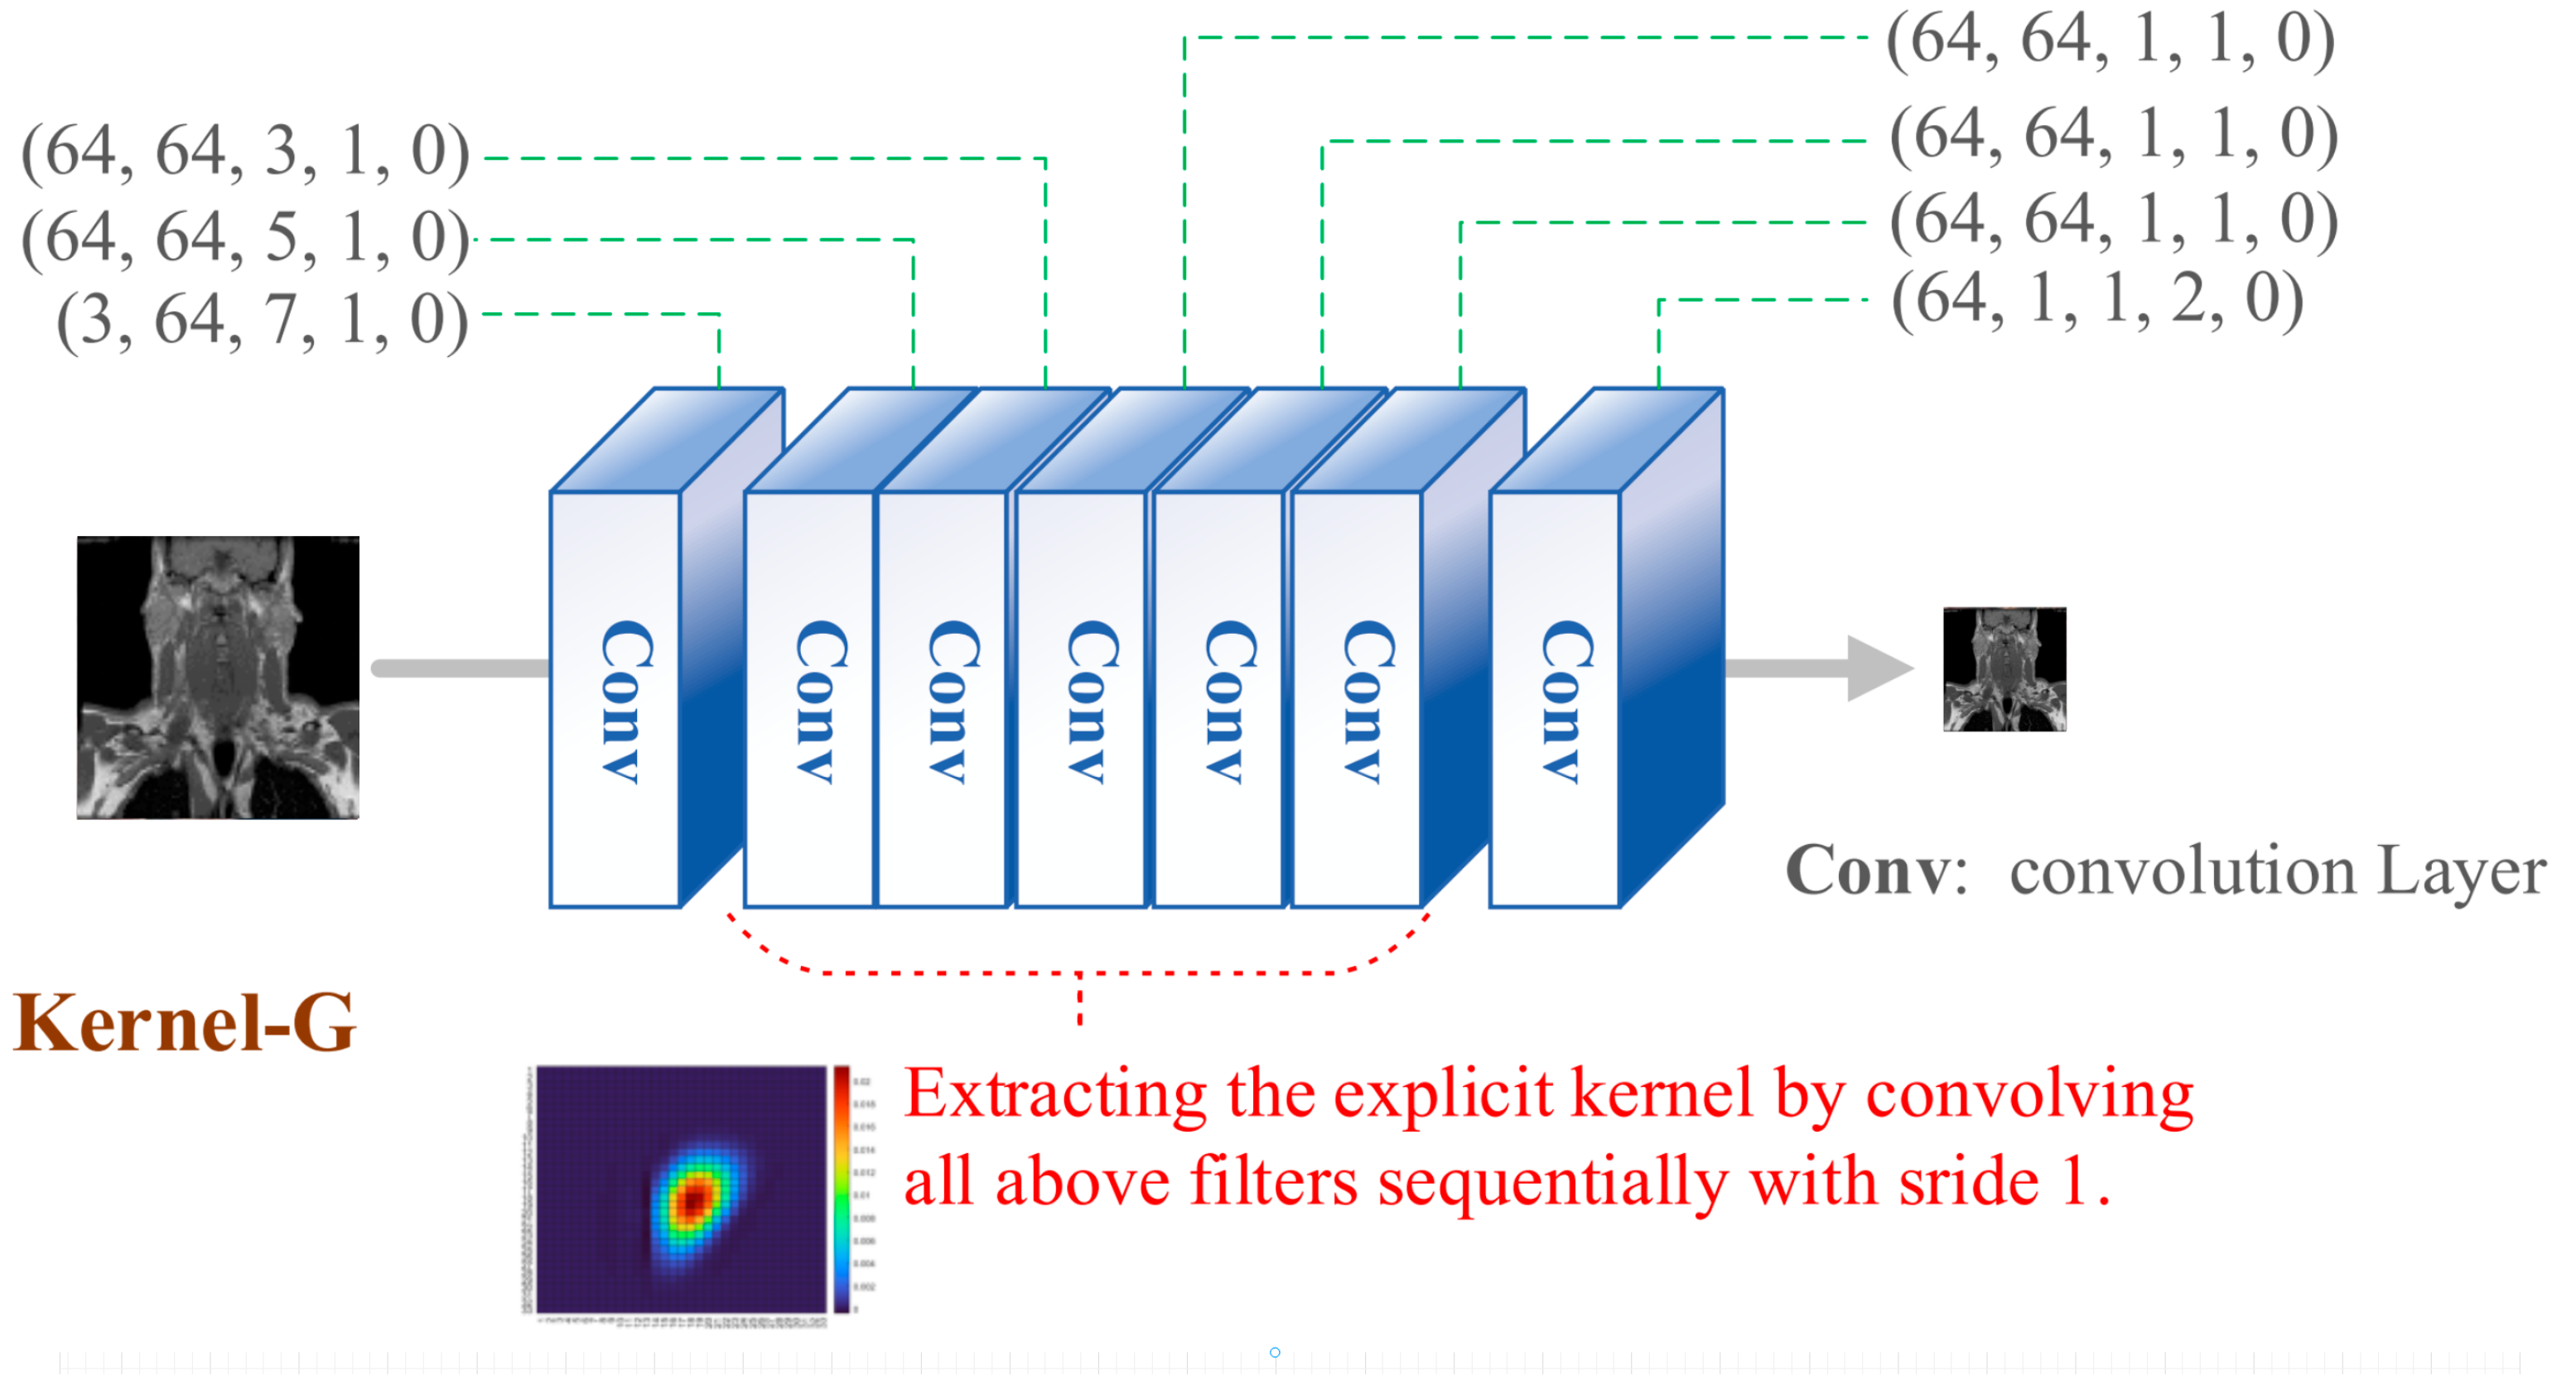
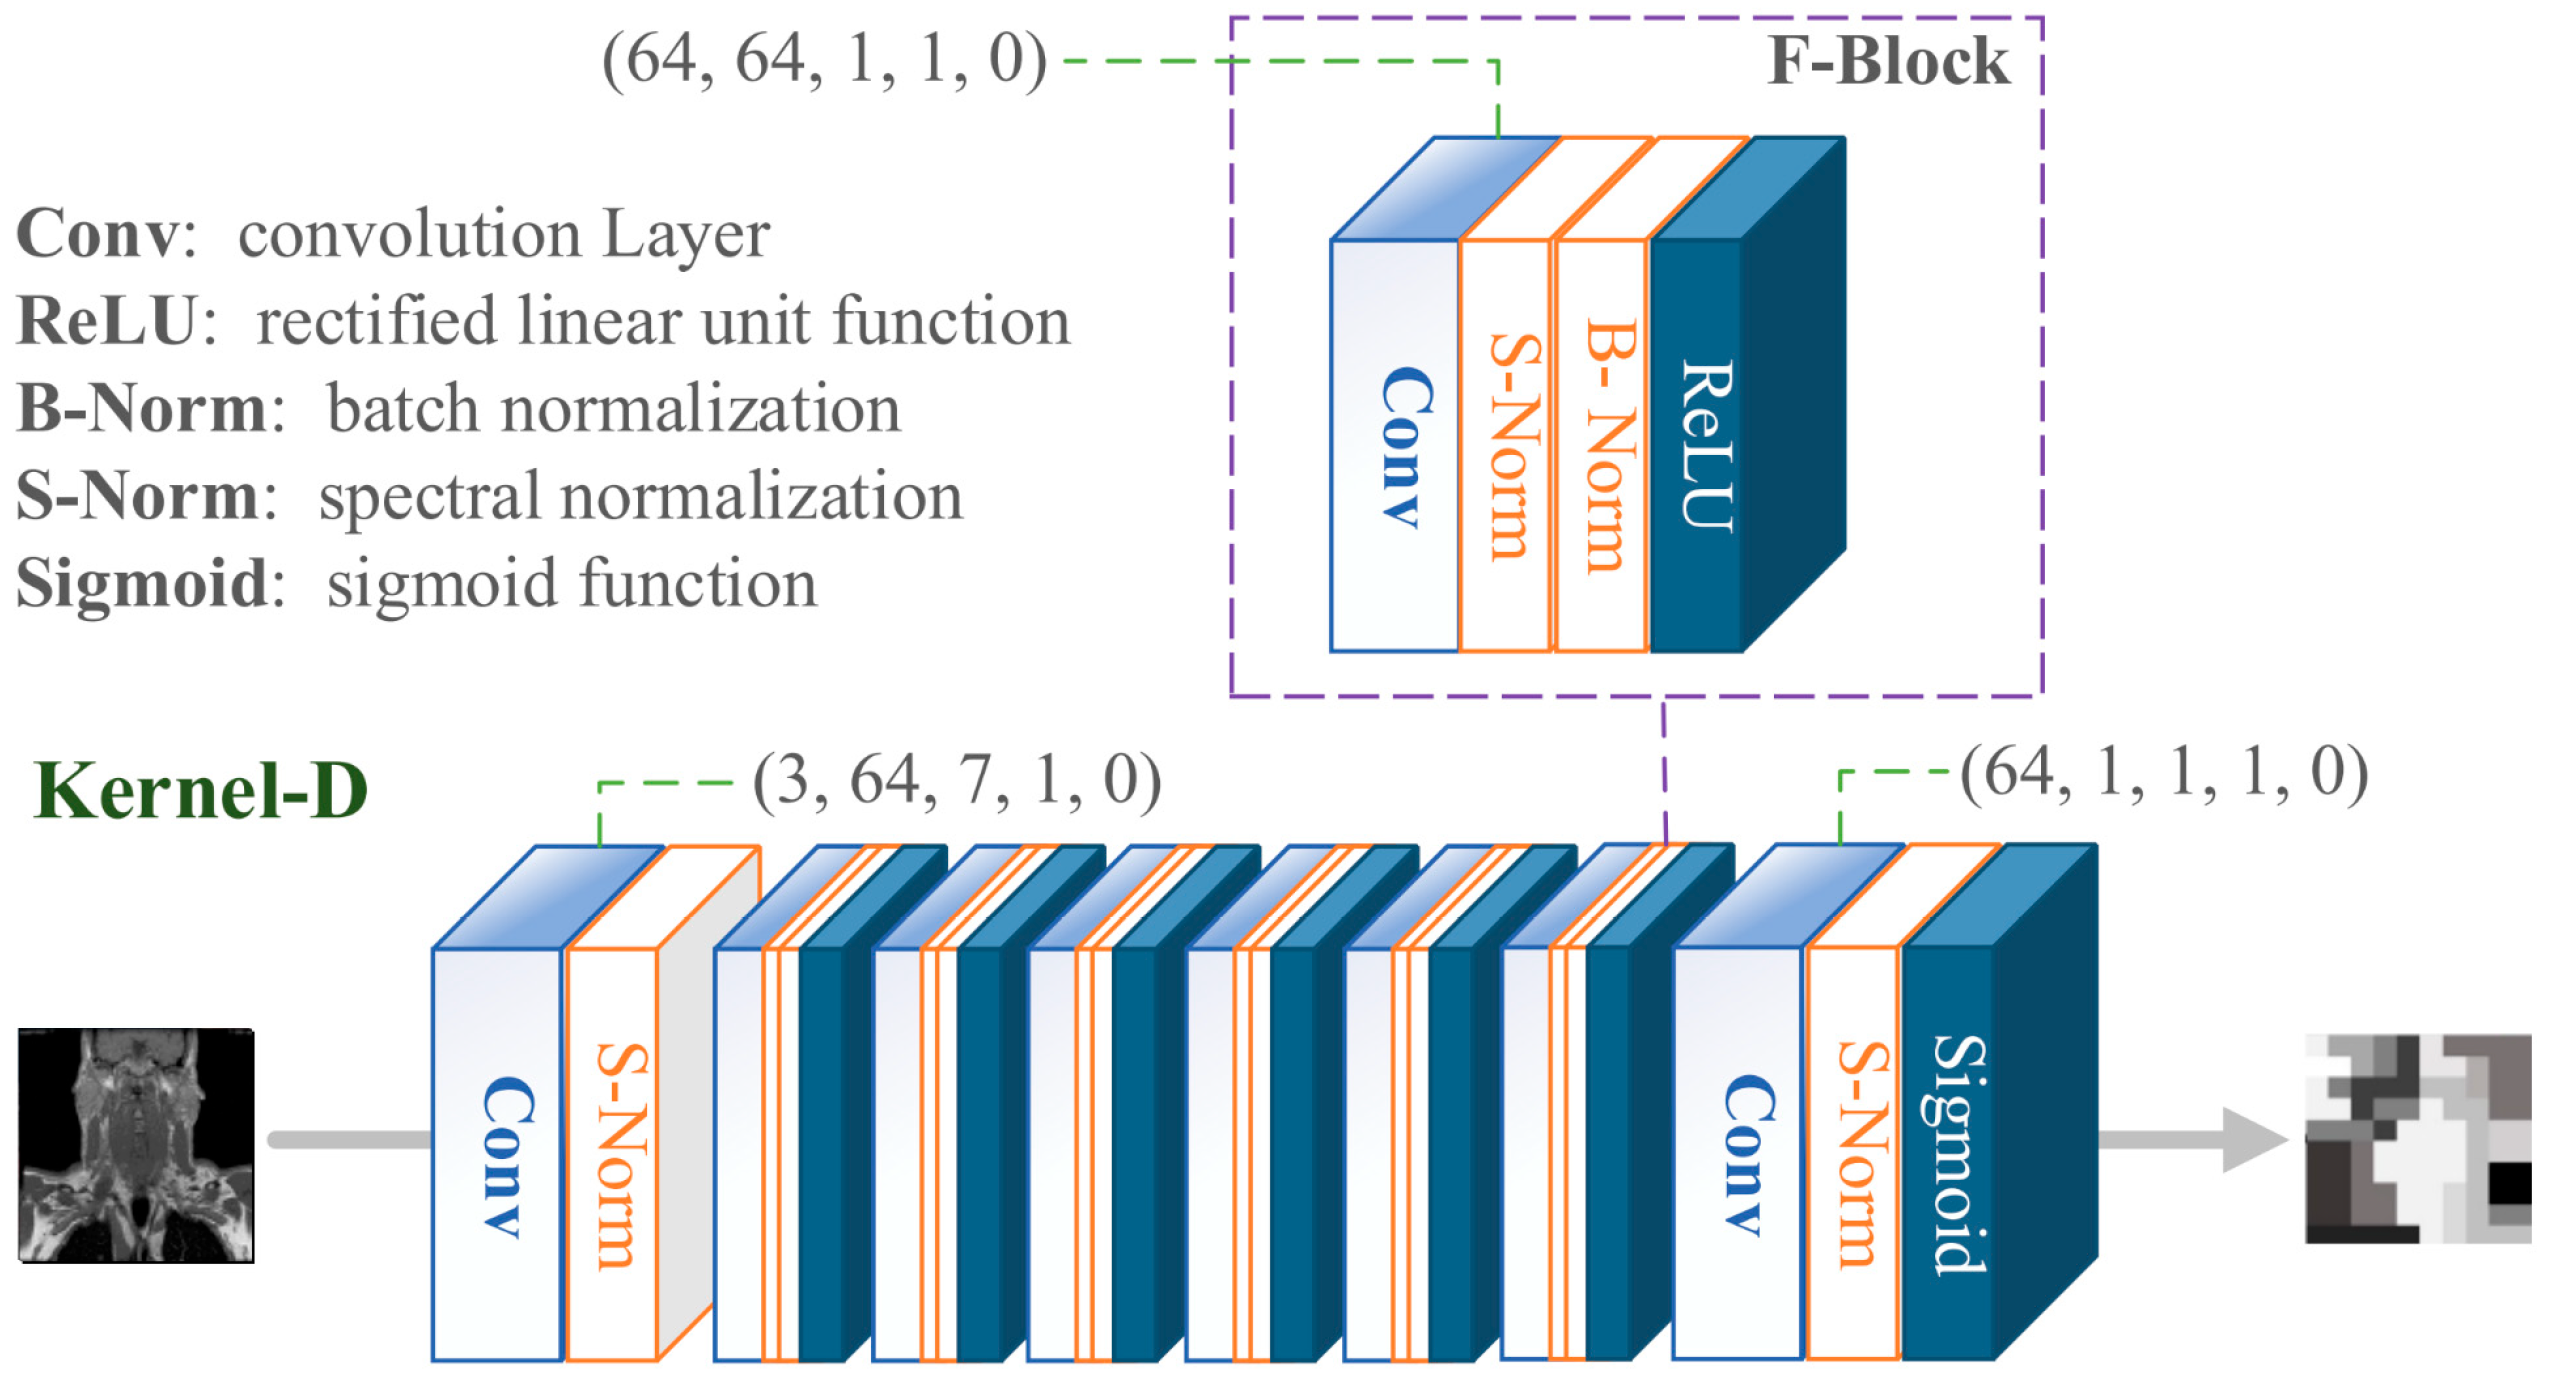
In the KernelGAN architecture, multiple convolutional layers are meticulously designed, each playing a pivotal role in the overall framework. Following a rigorous series of extensive testing and experimental validation, we have precisely ascertained the optimal parameter settings for these convolutional layers within the network. These parameters must strictly adhere to the detailed specifications outlined in
Table 1, ensuring the attainment of optimal performance and effectiveness.
Since the source images are already of the highest resolution, there are no actual HR ground truth images for comparison. Traditional metrics like PSNR and SSIM are inapplicable in this scenario. To assess the quality of generated images, this study adopts NR-IQA metrics [
38], specifically NIQE [
39], BRISQUE [
40], and PIQE [
41]. The assessment values are calculated using the corresponding Matlab functions, with lower scores indicating better perceptual quality. This provides an objective and quantitative basis for evaluating the generated images.
In this study, five advanced image super-resolution reconstruction models, namely, EDSR8-RGB, RCAN, RS-ESRGAN, KerSRGAN, and the newly proposed MRISR, were comprehensively employed to process a total of 784 images from the SET_Te dataset, successfully generating high-resolution (x4 HR) images, and the parameters used in the implementation are detailed in
Table 2.
To objectively evaluate the quality of these generated images, the NIQE, BRISQUE, and PIQE values, which are three widely recognized no-reference image quality assessment (NR-IQA) metrics, were calculated for each image using Matlab software (version: R2021a). NIQE constitutes a fully blind model for image quality assessment, constructing a suite of “quality-aware” statistical features rooted in a streamlined and potent spatial domain natural scene statistics framework. It undertakes training by exclusively harnessing quantifiable deviations from the statistical patterns inherent in natural images. BRISQUE, on the other hand, represents a versatile no-reference image quality assessment model anchored in spatial domain natural scene statistics. Rather than focusing on distortion-specific attributes, BRISQUE employs statistics derived from locally normalized luminance coefficients to gauge potential deviations from “naturalness.” PIQE, meanwhile, assesses image quality by quantifying distortions independently of any training data, relying on the extraction of local features. The evaluative metrics of NIQE, BRISQUE, and PIQE can be determined using the respective Matlab functions—niqe, brisque, and piqe. These functions yield positive real numbers confined to the interval from 0 to 100, with lower values denoting superior perceptual quality and higher values indicating diminished perceptual quality.
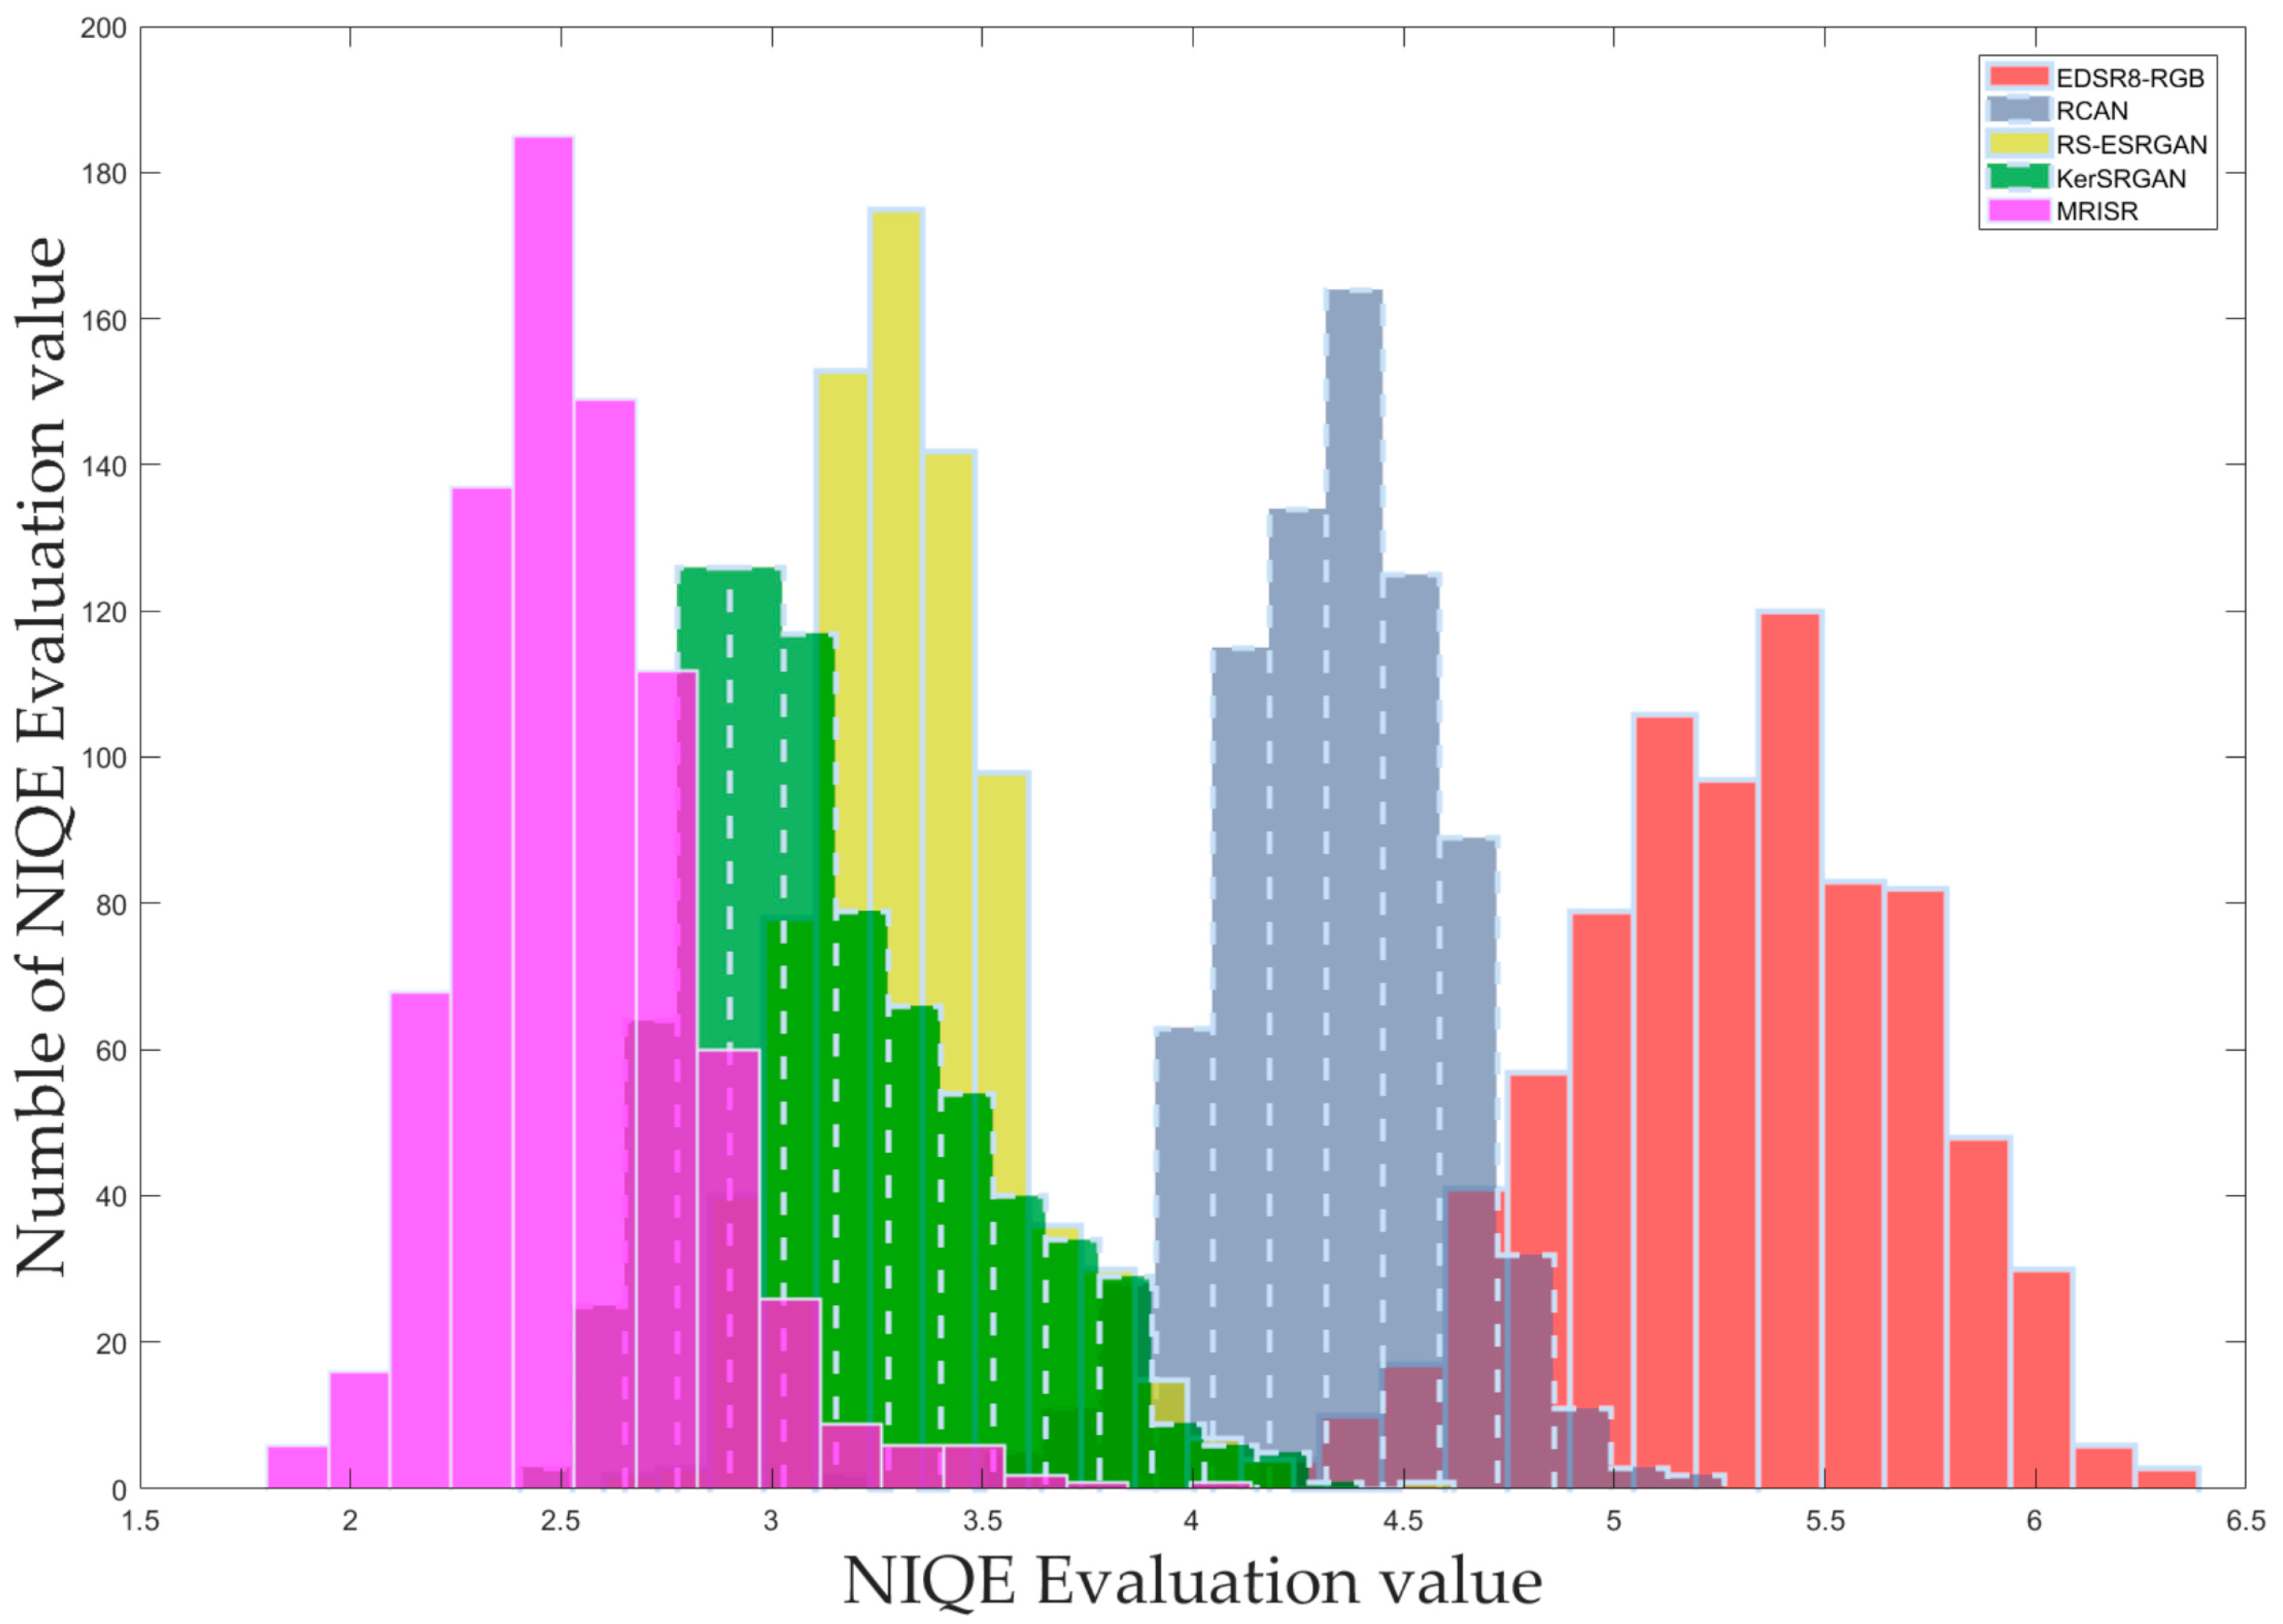
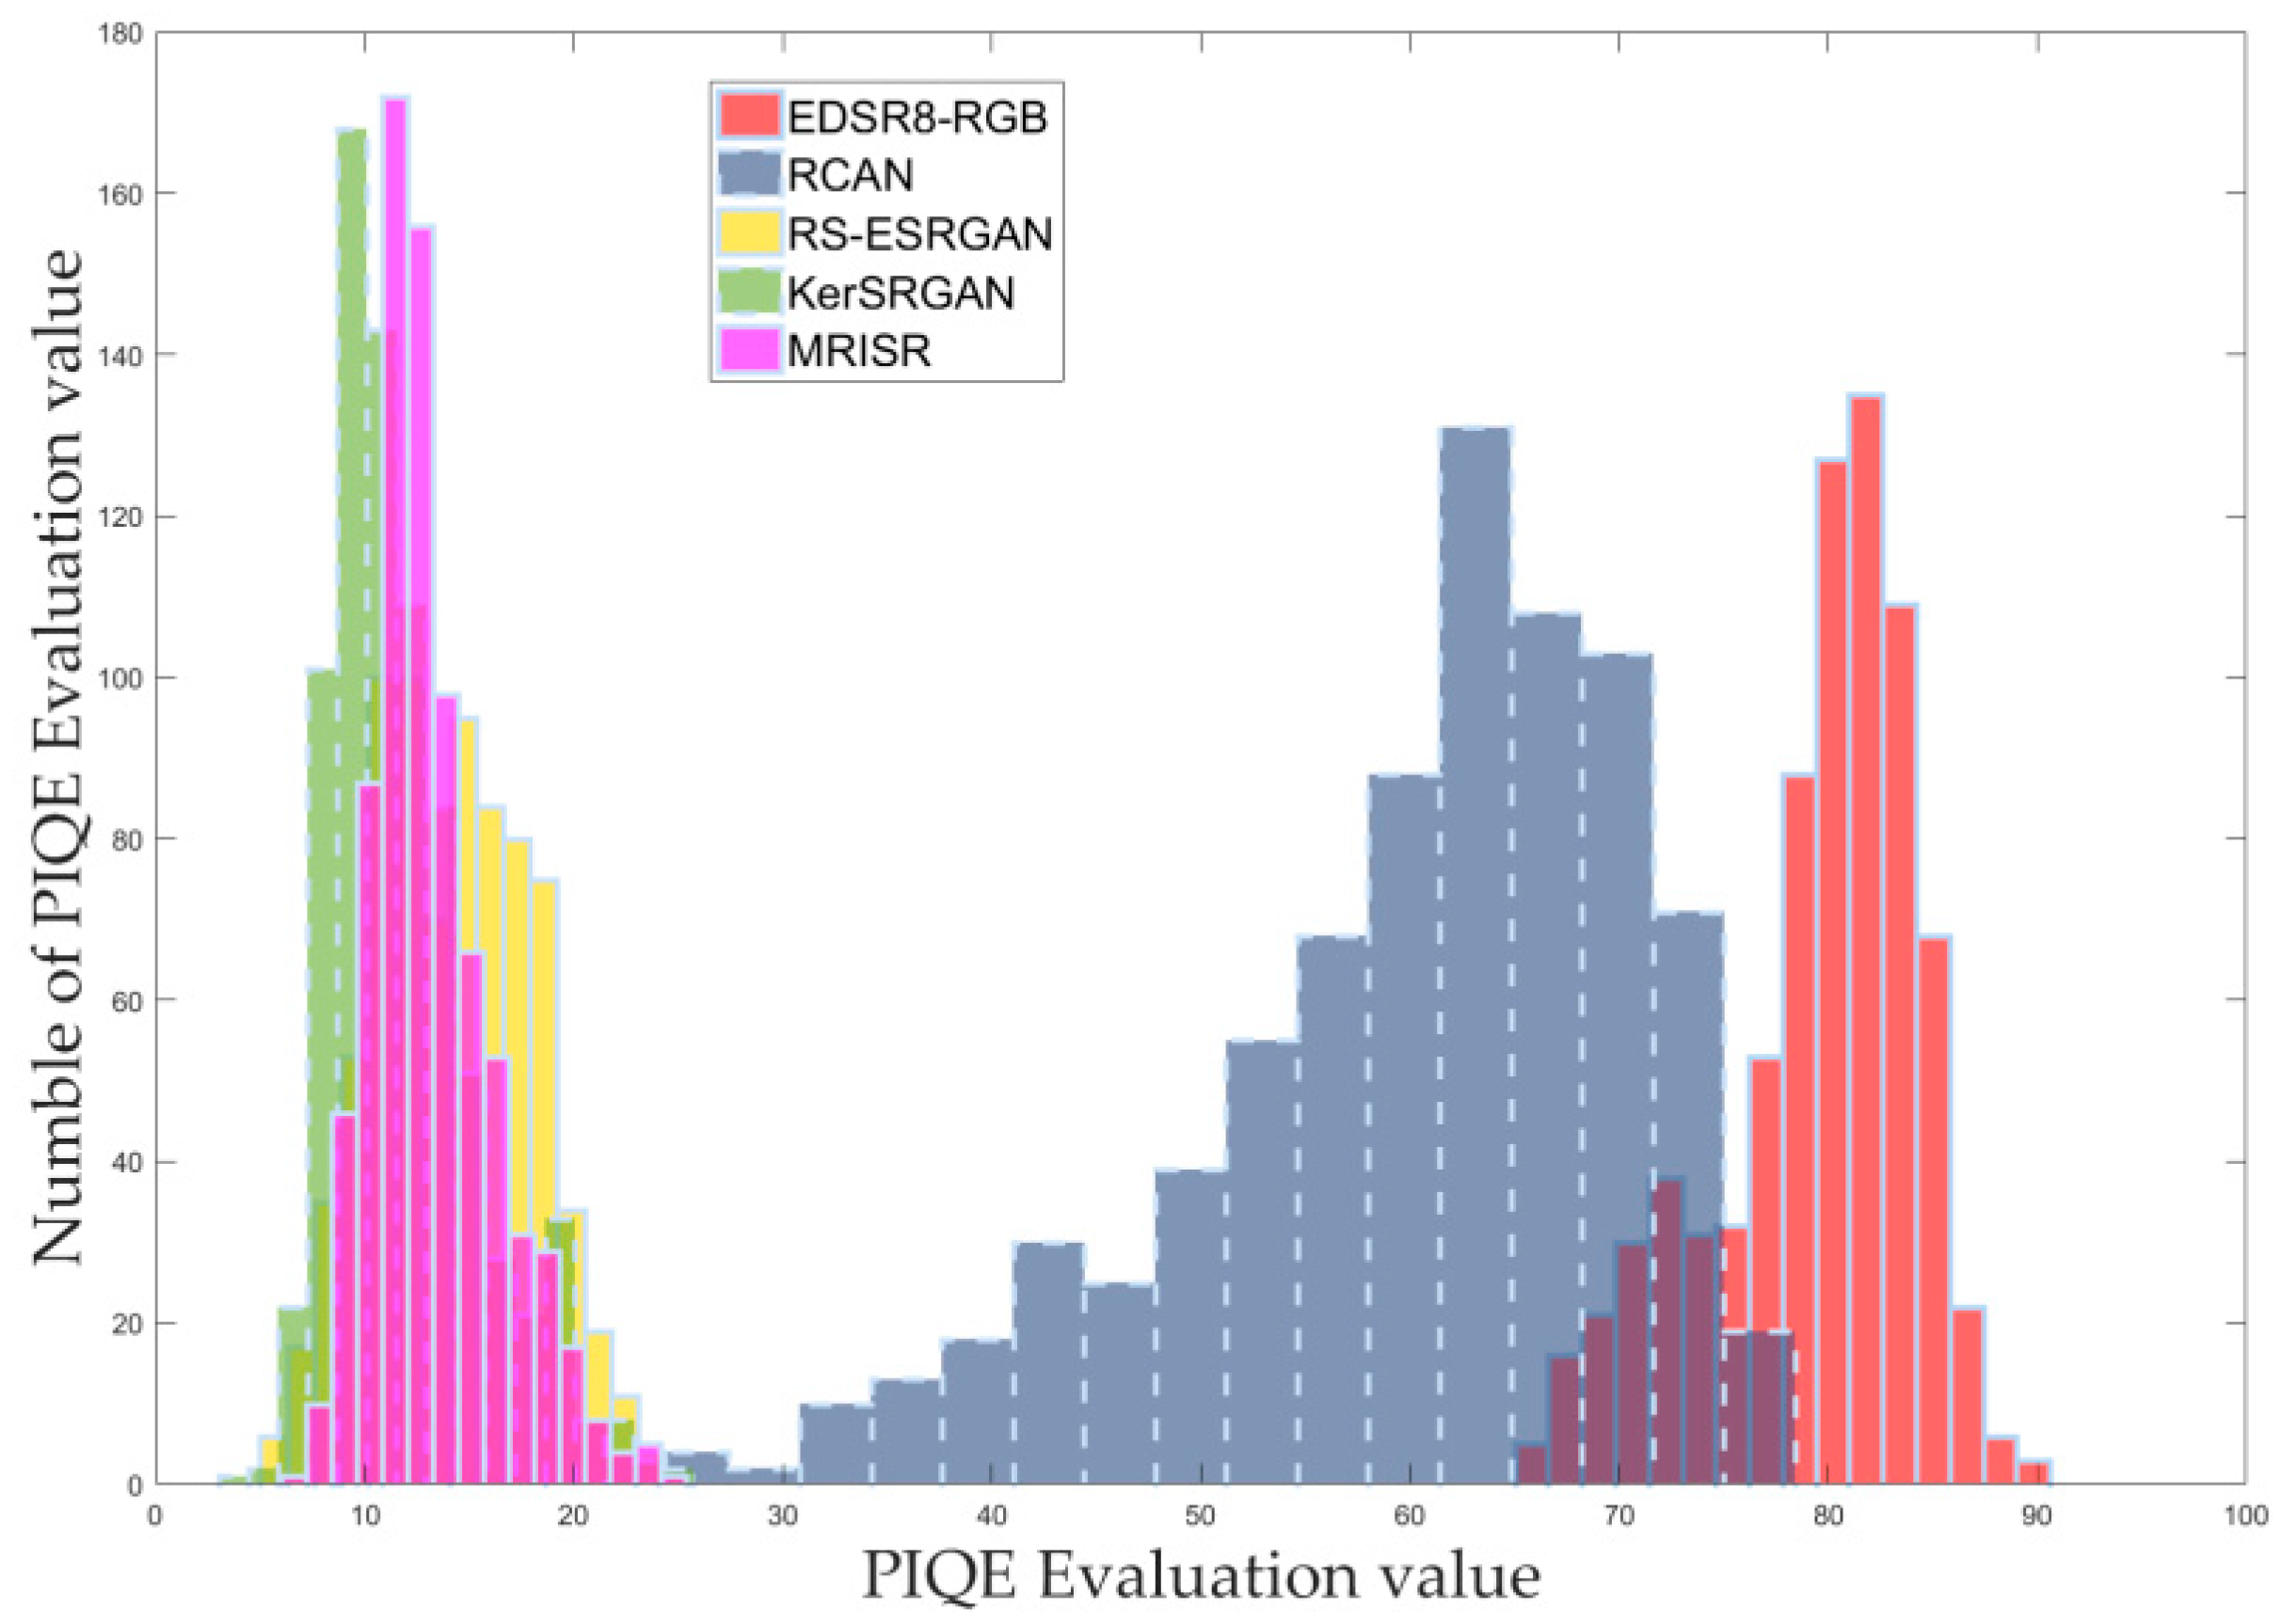
Based on the distribution of these assessment values, corresponding histograms were carefully drawn and clearly presented in
Figure 13,
Figure 14 and
Figure 15, facilitating intuitive comparison and analysis. Furthermore, to comprehensively showcase the performance differences among the models, the mean and extreme values derived from the assessment values were detailed in
Table 3, enabling further data analysis and discussion. Both the histograms and the table consistently demonstrate that the newly proposed MRISR model exhibits significant advantages and outperforms the other four comparison models across various NR-IQA metrics.
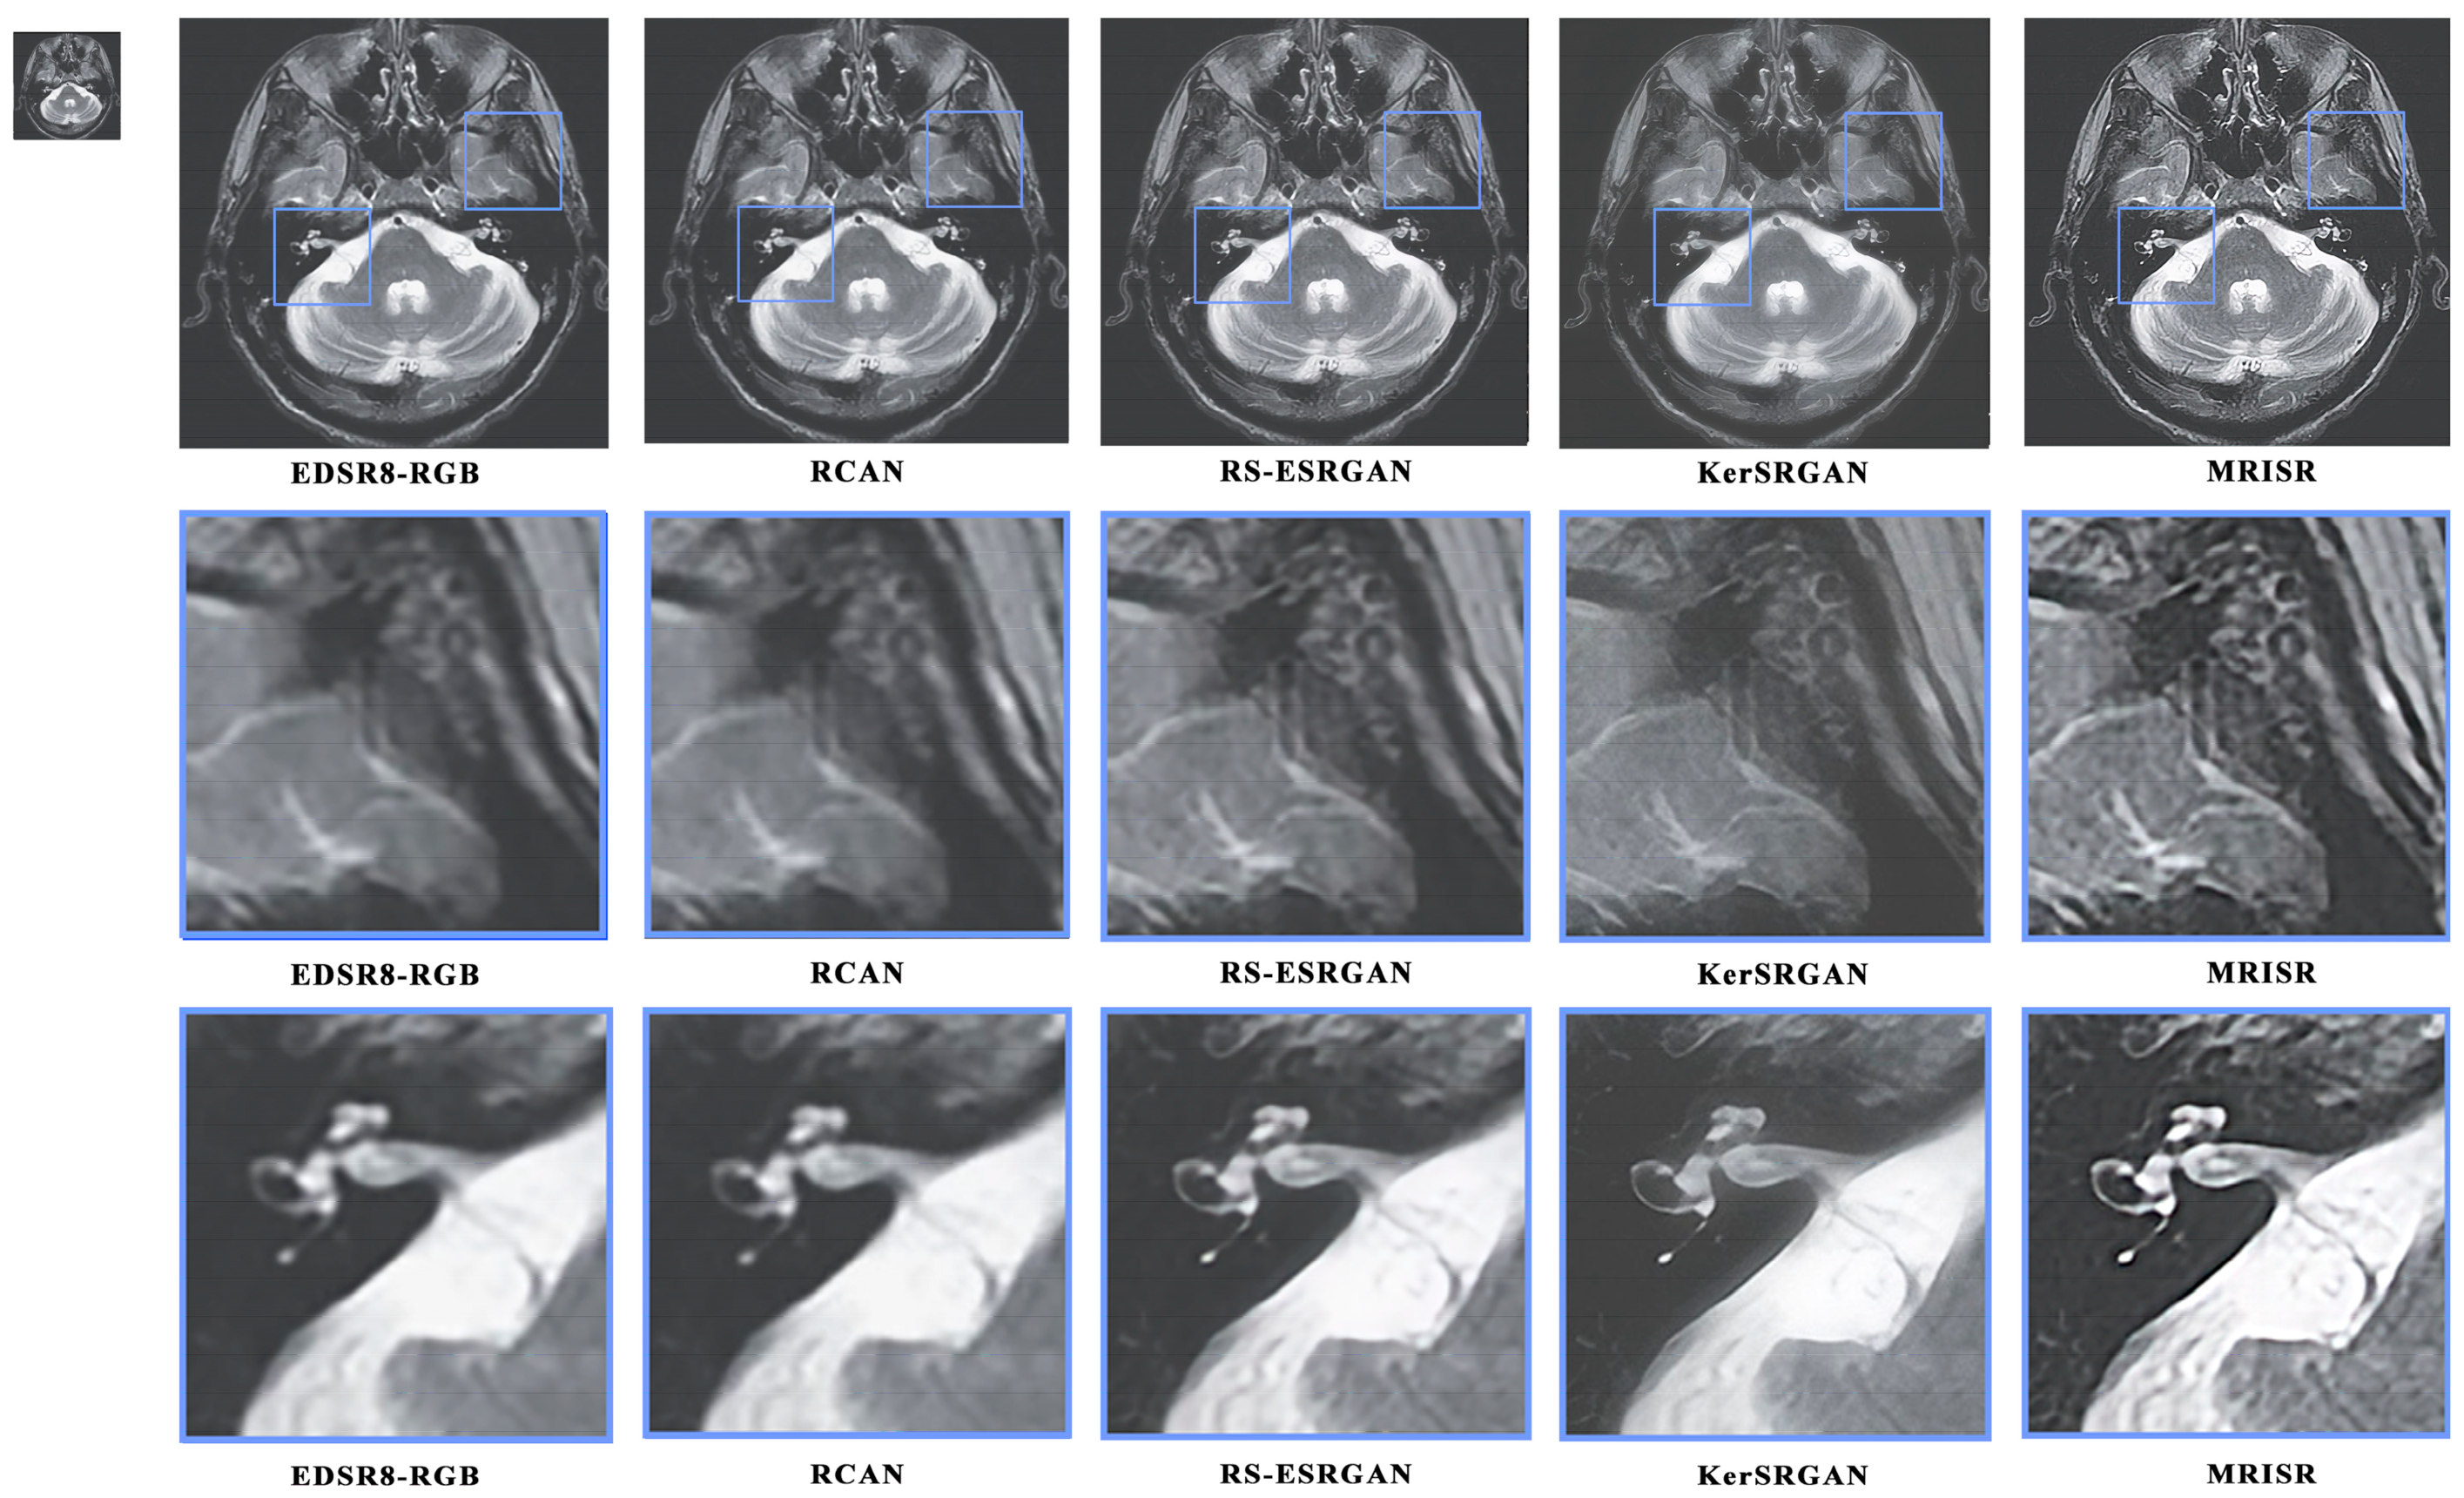
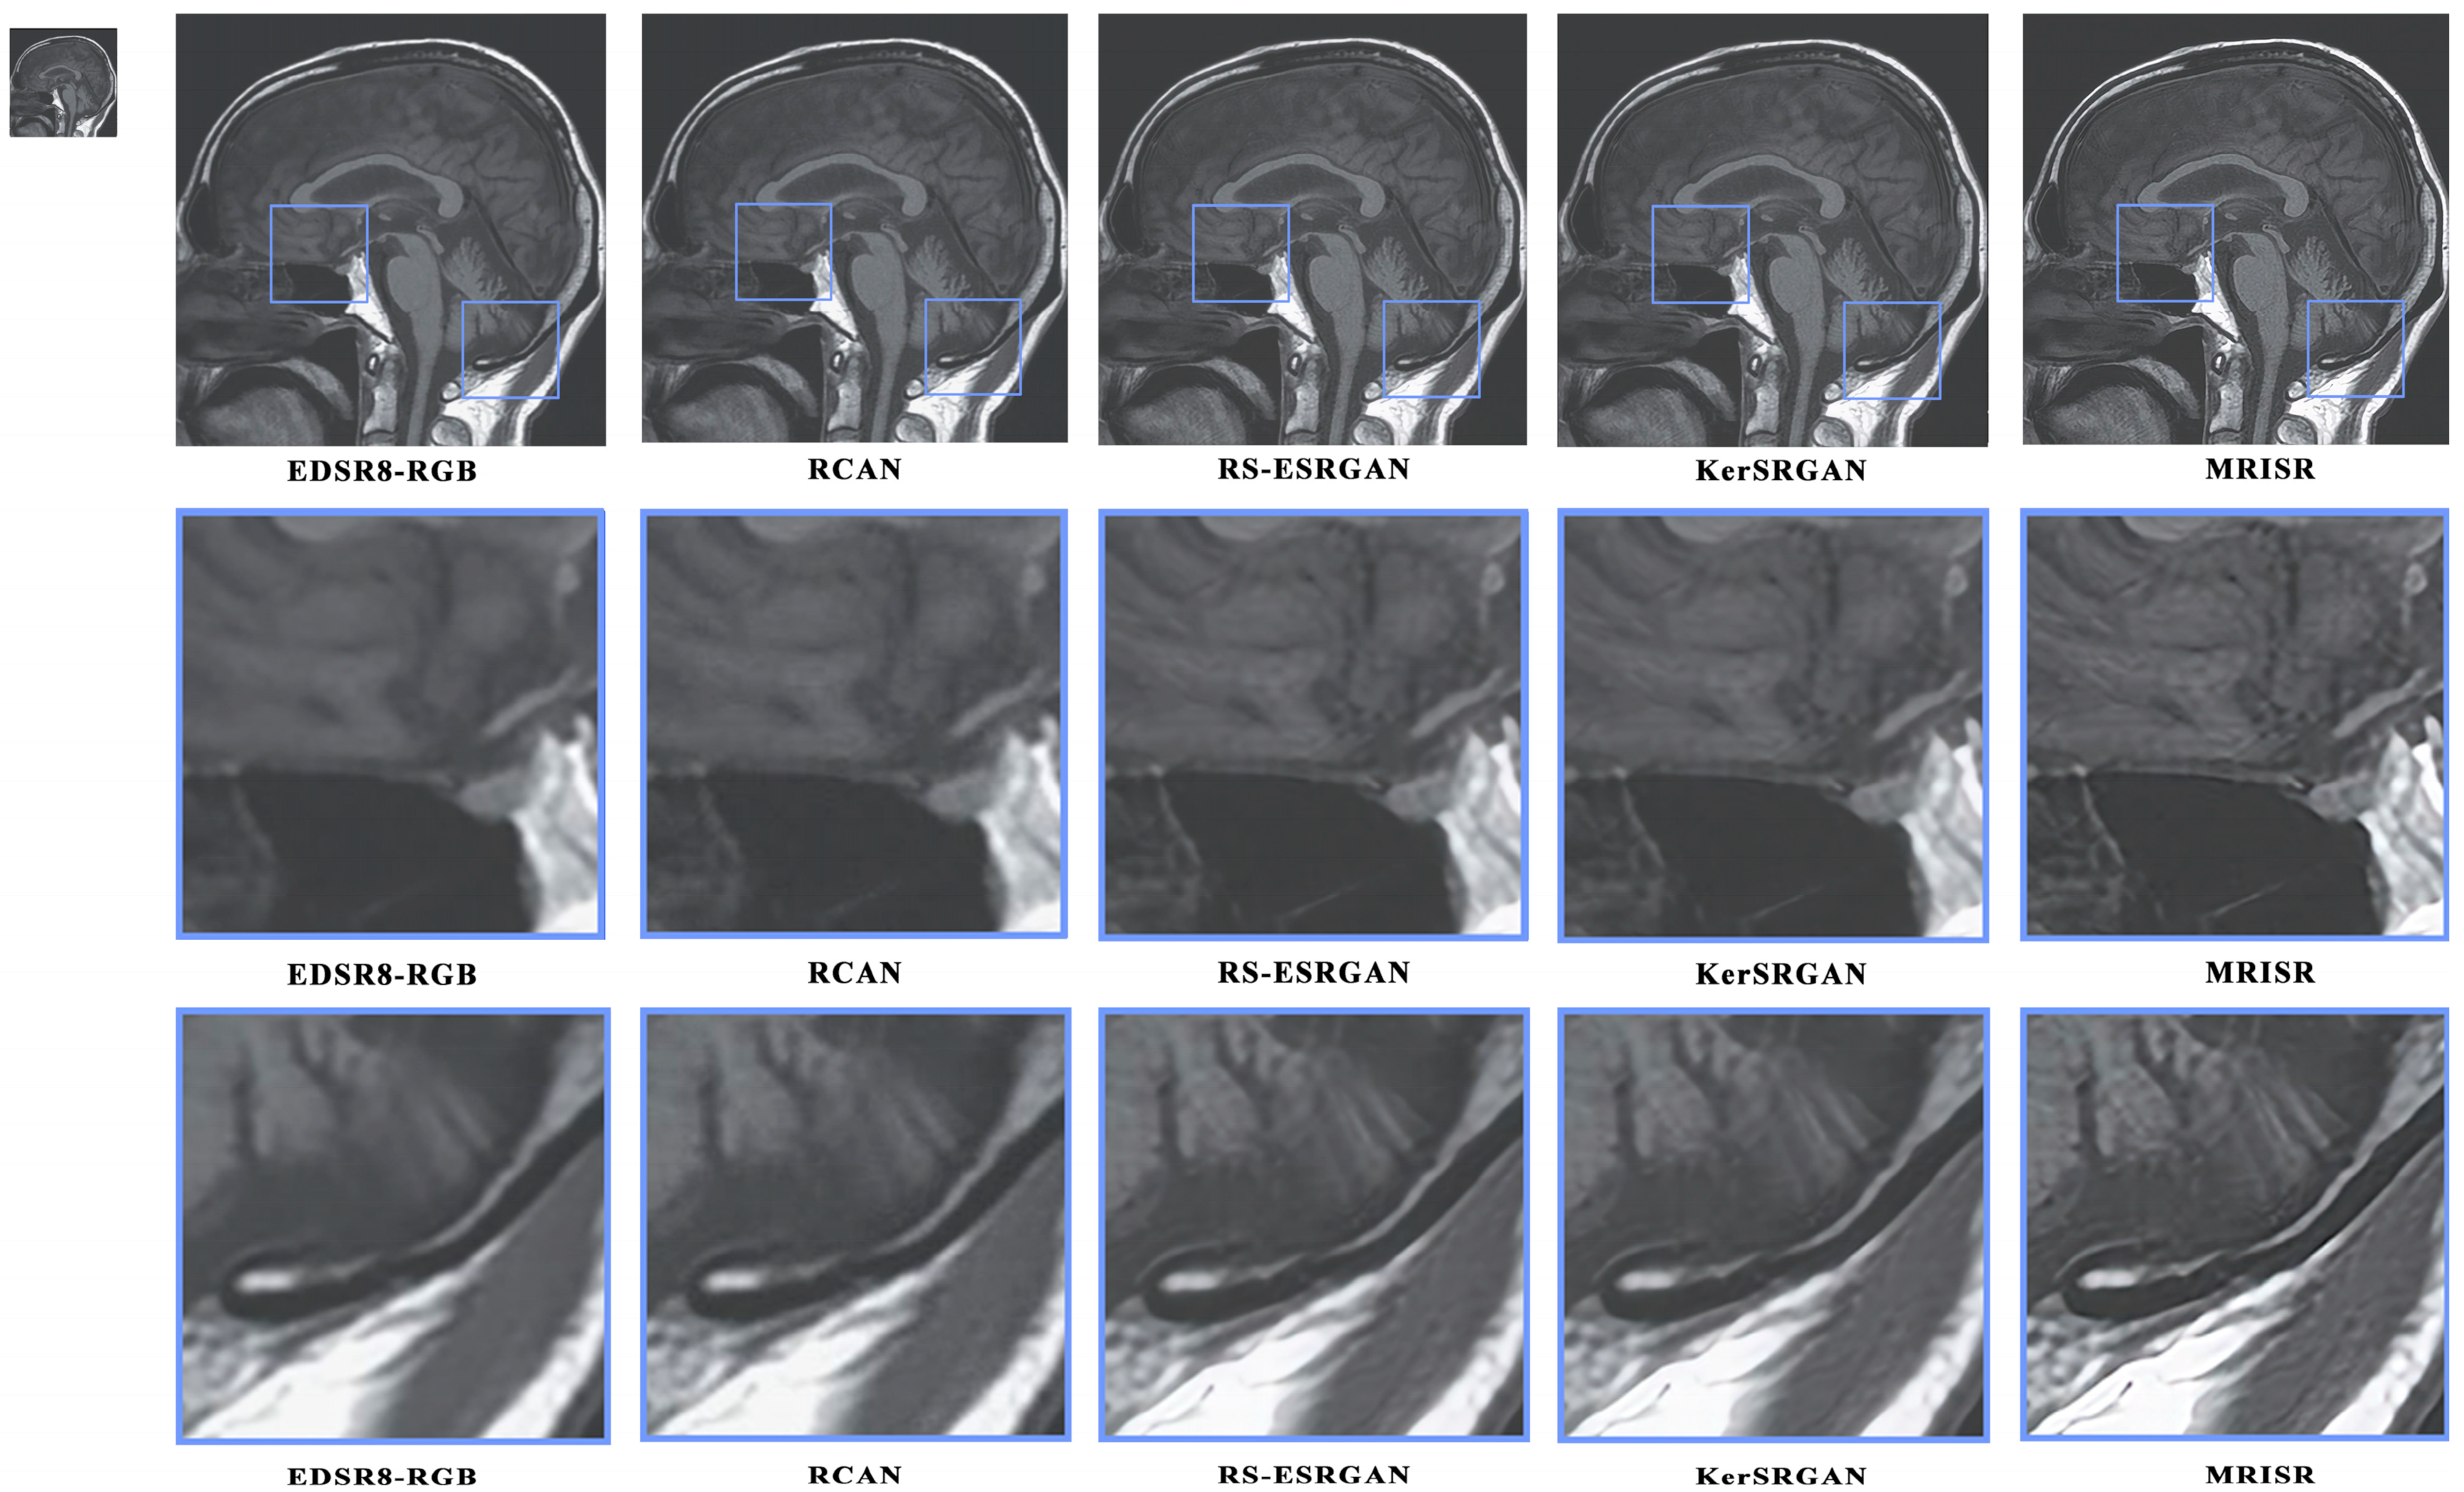
Figure 16 and
Figure 17 present a visual comparison of images generated by different algorithms, with the objective of conducting a comprehensive analysis of the performance of various models in the task of image super-resolution reconstruction. Through a detailed examination of images featuring complex terrains, it is evident that, due to the inherent limitations of traditional interpolation algorithms, such as the bicubic method, the processed images exhibit a high degree of blurring and smoothing, ultimately resulting in a significant loss of detailed information. In contrast, while advanced deep learning models, like EDSR8-RGB, RCAN, and RS-ESRGAN, have demonstrated notable advancements in image super-resolution reconstruction, they still exhibit certain deficiencies in accurately distinguishing noise with sharp edges, leading to blurred outputs and unsatisfactory detail recovery. The proposed MRISR model in this paper, however, introduces innovative noise estimation and reconstruction strategies, resulting in generated images that exhibit clearer boundaries between objects and backgrounds, along with more accurate detail recovery. This indicates that our estimated noise distribution is closer to the real noise, thereby effectively enhancing the overall quality of image super-resolution reconstruction. When compared with models such as EDSR8-RGB, RCAN, and RS-ESRGAN, the results of the proposed MRISR model exhibit significantly improved visual clarity, richer details, and no blurring artifacts, fully demonstrating its superiority and effectiveness in the task of image super-resolution reconstruction.
4. Discussion
The proposed MRI super-resolution analysis model, MRISR, exhibits substantial enhancements over existing methodologies in both quantitative and qualitative metrics. By employing an innovative approach that utilizes GAN for the estimation of degradation kernels and the injection of realistic noise, we have successfully curated a high-quality dataset comprising paired high- and low-resolution MRI images. This dataset, when combined with the unique fusion of VMamba and Transformer technologies, has proven to be remarkably effective in reconstructing high-resolution MRI images while meticulously preserving intricate details and textures.
Prior deep learning-driven super-resolution methods, including SRCNN, EDSR, SR-GAN-Densenet, and RDN, have significantly improved image resolution. However, they encounter challenges in accurately maintaining image fidelity and visual perception quality at higher resolutions. GAN-based approaches, such as SRGAN, have partially addressed these limitations through adversarial learning, resulting in improved image quality despite lower peak signal-to-noise ratio (PSNR) values. Nevertheless, there remains room for improvement, particularly in capturing intricate texture details. The MRISR model transcends these barriers by integrating advanced techniques, notably VMamba and Transformer-based mixed blocks and cross-attention mixed blocks. This distinctive network architecture empowers MRISR to attain superior performance across multiple no-reference image quality assessment metrics, surpassing state-of-the-art methods like EDSR8-RGB, RCAN, RS-ESRGAN, and KerSRGAN.
A pivotal contribution of this study lies in the utilization of KernelGAN for the explicit estimation of degradation kernels and the integration of realistic noise into the dataset. This approach mitigates the shortcomings of traditional bicubic downsampling methods, which frequently result in the loss of frequency-related trajectory details. By generating low-resolution images that more faithfully mimic real-world degradation, MRISR can leverage a more representative dataset for learning, thereby enhancing reconstruction performance. The outcomes reveal that the estimated degradation kernels and noise distribution closely mirror those observed in natural MRI images, enabling MRISR to produce super-resolved images with sharper boundaries and more precise details. This underscores the critical importance of the degradation model and noise estimation strategy in achieving high-quality MRI super-resolution.
The capability of MRISR to reconstruct high-resolution MRI images with minimal loss of detail carries profound implications for clinical diagnostics. By quadrupling image resolution while preserving image quality, MRISR opens up new avenues for rapid MRI technology. This advancement could lead to reduced scan times and mitigated patient discomfort, thereby making MRI scans more accessible and cost-effective for a broader patient population. Furthermore, the enhanced image quality facilitated by MRISR has the potential to enable more accurate diagnoses and optimized treatment planning. The ability to visualize intricate anatomical structures and pathologies in greater detail may facilitate earlier disease detection and more targeted interventions.
Despite the MRISR model′s superior performance on predefined MRI datasets, it is important to note that the model has not yet been validated in real-time imaging or environments with variable settings/MRI protocols. This limits its flexibility and robustness in practical clinical applications. To overcome this limitation and enhance the model′s utility, future work will aim to validate the model under more diverse MRI settings and protocols. This will ensure that the model can function effectively in a broader range of clinical scenarios, thereby enhancing its practical applicability. Additionally, while the MRISR model has shown superiority across multiple image quality assessment metrics, it has not been tested in real-world environments or compared against the judgments of experienced radiologists. This restricts its widespread adoption in clinical practice. To further strengthen the model′s practicality and credibility, future endeavors will involve testing the model in real-world settings and collaborating with seasoned radiologists to validate and compare the model′s reconstruction results. Finally, we recognize that training bias may influence the performance of the MRISR model. As the model is trained on a specific MRI dataset, it may be constrained by the biases and limitations of that dataset. To mitigate this effect, future work will focus on using larger and more diverse MRI datasets for training, thereby enhancing the model′s generalization capability and robustness. Additionally, we will explore other techniques, such as data augmentation and transfer learning, to further reduce the impact of training bias on model performance.
Author Contributions
Conceptualization, Y.L. and M.Y.; methodology, Y.L.; software, Y.L. and M.Y.; validation, Y.L. and M.Y.; formal analysis, Y.L.; resources, Y.L., M.Y. and T.B.; writing—original draft preparation, Y.L., M.Y. and T.B.; writing—review and editing, M.Y.; project administration, Y.L.; funding acquisition, Y.L. and H.W. All authors have read and agreed to the published version of the manuscript.
Funding
This research was funded by the General University Key Field Special Project of Guangdong Province, China (Grant No. 2024ZDZX1004); the General University Key Field Special Project of Guangdong Province, China (Grant No. 2022ZDZX1035); the Research Fund Program of Guangdong Key Laboratory of Aerospace Communication and Networking Technology (Grant No. 2018B030322004).
Informed Consent Statement
Patient consent was waived due to we used a publicly authorized dataset, which has been obtained informed consent from all subjects involved in the dataset.
Data Availability Statement
The SR images by models EDSR8-RGB, RCAN, RS-ESRGAN, KerSRGAN and MRISR are available online at Baidu Wangpan (code: k7ix). The trained models of EDSR8-RGB, RCAN, RS-ESRGAN, KerSRGAN and MRISR are available online at Baidu Wangpan (code: b3jm). Additionally, all the codes generated or used during the study are available online at github/MRISR.
Conflicts of Interest
The authors declare no conflicts of interest. The funders had no role in the design of the study, in the collection, analyses, or interpretation of data, in the writing of the manuscript, or in the decision to publish the results. Author Haitao Wu was employed by the company Shenzhen CZTEK Co., Ltd. The remaining authors declare that the research was conducted in the absence of any commercial or financial relationships that could be construed as a potential conflict of interest.
References
- Li, W.; Zhang, M. Advances in Medical Imaging Technologies and Their Impact on Clinical Practices. Med. Insights 2024, 1, 1–8. [Google Scholar] [CrossRef]
- Hayat, M.; Aramvith, S. Transformer’s Role in Brain MRI: A Scoping Review. IEEE Access 2024, 12, 108876–108896. [Google Scholar] [CrossRef]
- Carcagnì, P.; Leo, M.; Del Coco, M.; Distante, C.; De Salve, A. Convolution neural networks and self-attention learners for Alzheimer dementia diagnosis from brain MRI. Sensors 2023, 23, 1694. [Google Scholar] [CrossRef]
- Takahashi, S.; Sakaguchi, Y.; Kouno, N.; Takasawa, K.; Ishizu, K.; Akagi, Y.; Aoyama, R.; Teraya, N.; Bolatkan, A.; Shinkai, N. Comparison of Vision Transformers and Convolutional Neural Networks in Medical Image Analysis: A Systematic Review. J. Med. Syst. 2024, 48, 1–22. [Google Scholar] [CrossRef]
- Bravo-Ortiz, M.A.; Holguin-Garcia, S.A.; Quiñones-Arredondo, S.; Mora-Rubio, A.; Guevara-Navarro, E.; Arteaga-Arteaga, H.B.; Ruz, G.A.; Tabares-Soto, R. A systematic review of vision transformers and convolutional neural networks for Alzheimer’s disease classification using 3D MRI images. Neural Comput. Appl. 2024, 1–28. [Google Scholar] [CrossRef]
- Ciceri, T.; Squarcina, L.; Giubergia, A.; Bertoldo, A.; Brambilla, P.; Peruzzo, D. Review on deep learning fetal brain segmentation from Magnetic Resonance images. Artif. Intell. Med. 2023, 143, 102608. [Google Scholar] [CrossRef]
- Bogner, W.; Otazo, R.; Henning, A. Accelerated MR spectroscopic imaging—A review of current and emerging techniques. NMR Biomed. 2021, 34, e4314. [Google Scholar] [CrossRef] [PubMed]
- Bhat, S.S.; Fernandes, T.T.; Poojar, P.; da Silva Ferreira, M.; Rao, P.C.; Hanumantharaju, M.C.; Ogbole, G.; Nunes, R.G.; Geethanath, S. Low-field MRI of stroke: Challenges and opportunities. J. Magn. Reson. Imaging 2021, 54, 372–390. [Google Scholar] [CrossRef]
- Arnold, T.C.; Freeman, C.W.; Litt, B.; Stein, J.M. Low-field MRI: Clinical promise and challenges. J. Magn. Reson. Imaging 2023, 57, 25–44. [Google Scholar] [CrossRef]
- Goodfellow, I.; Pouget-Abadie, J.; Mirza, M.; Xu, B.; Warde-Farley, D.; Ozair, S.; Courville, A.; Bengio, Y. Generative adversarial networks. Commun. ACM 2020, 63, 139–144. [Google Scholar] [CrossRef]
- Chen, Z.; Pawar, K.; Ekanayake, M.; Pain, C.; Zhong, S.; Egan, G.F. Deep learning for image enhancement and correction in magnetic resonance imaging—State-of-the-art and challenges. J. Digit. Imaging 2023, 36, 204–230. [Google Scholar] [CrossRef] [PubMed]
- Qiu, D.; Cheng, Y.; Wang, X. Medical image super-resolution reconstruction algorithms based on deep learning: A survey. Comput. Methods Programs Biomed. 2023, 238, 107590. [Google Scholar] [CrossRef]
- Mamo, A.A.; Gebresilassie, B.G.; Mukherjee, A.; Hassija, V.; Chamola, V. Advancing Medical Imaging Through Generative Adversarial Networks: A Comprehensive Review and Future Prospects. Cogn. Comput. 2024, 16, 2131–2153. [Google Scholar] [CrossRef]
- Yu, M.; Shi, J.; Xue, C.; Hao, X.; Yan, G. A review of single image super-resolution reconstruction based on deep learning. Multimed. Tools Appl. 2024, 83, 55921–55962. [Google Scholar]
- Lv, Y.; Ma, H. Improved SRCNN for super-resolution reconstruction of retinal images. In Proceedings of the 2021 6th International Conference on Intelligent Computing and Signal Processing (ICSP), Xi’an, China, 9–11 April 2021; pp. 595–598. [Google Scholar]
- Lin, K. The performance of single-image super-resolution algorithm: EDSR. In Proceedings of the 2022 IEEE 5th International Conference on Information Systems and Computer Aided Education (ICISCAE), Dalian, China, 23–25 September 2022; pp. 964–968. [Google Scholar]
- De Leeuw Den Bouter, M.; Ippolito, G.; O’Reilly, T.; Remis, R.; Van Gijzen, M.; Webb, A. Deep learning-based single image super-resolution for low-field MR brain images. Sci. Rep. 2022, 12, 6362. [Google Scholar] [CrossRef]
- Wang, L.; Wang, Y.; Lin, Z.; Yang, J.; An, W.; Guo, Y. Learning a single network for scale-arbitrary super-resolution. In Proceedings of the IEEE/CVF International Conference on Computer Vision, Montreal, BC, Canada, 11–17 October 2021; pp. 4801–4810. [Google Scholar]
- Abbas, R.; Gu, N. Improving deep learning-based image super-resolution with residual learning and perceptual loss using SRGAN model. Soft Comput. 2023, 27, 16041–16057. [Google Scholar] [CrossRef]
- Wang, X.; Yu, K.; Wu, S.; Gu, J.; Liu, Y.; Dong, C.; Qiao, Y.; Change Loy, C. Esrgan: Enhanced super-resolution generative adversarial networks. In Proceedings of the European Conference on Computer Vision (ECCV) Workshops, Munich, Germany, 8–14 September 2018. [Google Scholar]
- Han, K.; Wang, Y.; Chen, H.; Chen, X.; Guo, J.; Liu, Z.; Tang, Y.; Xiao, A.; Xu, C.; Xu, Y. A survey on vision transformer. IEEE Trans. Pattern Anal. Mach. Intell. 2022, 45, 87–110. [Google Scholar] [CrossRef] [PubMed]
- Chen, X.; Wang, X.; Zhou, J.; Qiao, Y.; Dong, C. Activating more pixels in image super-resolution transformer. In Proceedings of the IEEE/CVF Conference on Computer Vision and Pattern Recognition, Vancouver, BC, Canada, 17–24 June 2023; pp. 22367–22377. [Google Scholar]
- Liu, Z.; Lin, Y.; Cao, Y.; Hu, H.; Wei, Y.; Zhang, Z.; Lin, S.; Guo, B. Swin transformer: Hierarchical vision transformer using shifted windows. In Proceedings of the IEEE/CVF International Conference on Computer Vision, Montreal, BC, Canada, 11–17 October 2021; pp. 10012–10022. [Google Scholar]
- Liang, J.; Cao, J.; Sun, G.; Zhang, K.; Van Gool, L.; Timofte, R. Swinir: Image restoration using swin transformer. In Proceedings of the IEEE/CVF International Conference on Computer Vision, Montreal, BC, Canada, 11–17 October 2021; pp. 1833–1844. [Google Scholar]
- Liu, Y.; Tian, Y.; Zhao, Y.; Yu, H.; Xie, L.; Wang, Y.; Ye, Q.; Liu, Y. VMamba: Visual State Space Model. arXiv 2024, arXiv:1406.2661. [Google Scholar] [CrossRef]
- Bell-Kligler, S.; Shocher, A.; Irani, M. Blind super-resolution kernel estimation using an internal-GAN. Adv. Neural Inf. Process. Syst. 2019, 32, 1–10. [Google Scholar]
- Soh, J.W.; Cho, N.I. Deep universal blind image denoising. In Proceedings of the 2020 25th International Conference on Pattern Recognition (ICPR), Milan, Italy, 10–15 January 2021; pp. 747–754. [Google Scholar]
- Chen, J.; Chen, J.; Chao, H.; Yang, M. Image blind denoising with generative adversarial network based noise modeling. In Proceedings of the IEEE Conference on Computer Vision and Pattern Recognition, Salt Lake City, UT, USA, 18–22 June 2018; pp. 3155–3164. [Google Scholar]
- Fu, B.; Zhang, X.; Wang, L.; Ren, Y.; Thanh, D.N. A blind medical image denoising method with noise generation network. J. X-ray Sci. Technol. 2022, 30, 531–547. [Google Scholar] [CrossRef]
- Wang, Z.; Liu, J.; Li, G.; Han, H. Blind2unblind: Self-supervised image denoising with visible blind spots. In Proceedings of the IEEE/CVF Conference on Computer Vision and Pattern Recognition, New Orleans, LA, USA, 18–24 June 2022; pp. 2027–2036. [Google Scholar]
- Hinz, T.; Fisher, M.; Wang, O.; Wermter, S. Improved techniques for training single-image GANs. In Proceedings of the IEEE/CVF Winter Conference on Applications of Computer Vision, Virtual Conference, 5–9 January 2021; pp. 1300–1309. [Google Scholar]
- Liu, S.; Zheng, C.; Lu, K.; Gao, S.; Wang, N.; Wang, B.; Zhang, D.; Zhang, X.; Xu, T. Evsrnet: Efficient video super-resolution with neural architecture search. In Proceedings of the IEEE/CVF Conference on Computer Vision and Pattern Recognition, Nashville, TN, USA, 20–25 June 2021; pp. 2480–2485. [Google Scholar]
- Liu, Y. RCAN based MRI super-resolution with applications. In Proceedings of the 2023 7th International Conference on Electronic Information Technology and Computer Engineering, Xiamen, China, 20–22 October 2023; pp. 357–361. [Google Scholar]
- Meng, F.; Wu, S.; Li, Y.; Zhang, Z.; Feng, T.; Liu, R.; Du, Z. Single remote sensing image super-resolution via a generative adversarial network with stratified dense sampling and chain training. IEEE Trans. Geosci. Remote Sens. 2023, 26, 5400822. [Google Scholar] [CrossRef]
- Li, Y.; Chen, L.; Li, B.; Zhao, H. 4× Super-resolution of unsupervised CT images based on GAN. IET Image Process. 2023, 17, 2362–2374. [Google Scholar] [CrossRef]
- Tibrewala, R.; Dutt, T.; Tong, A.; Ginocchio, L.; Lattanzi, R.; Keerthivasan, M.B.; Baete, S.H.; Chopra, S.; Lui, Y.W.; Sodickson, D.K. FastMRI Prostate: A public, biparametric MRI dataset to advance machine learning for prostate cancer imaging. Sci. Data 2024, 11, 404. [Google Scholar] [CrossRef] [PubMed]
- Payette, K.; de Dumast, P.; Kebiri, H.; Ezhov, I.; Paetzold, J.C.; Shit, S.; Iqbal, A.; Khan, R.; Kottke, R.; Grehten, P. An automatic multi-tissue human fetal brain segmentation benchmark using the fetal tissue annotation dataset. Sci. Data 2021, 8, 167. [Google Scholar] [PubMed]
- Golestaneh, S.A.; Dadsetan, S.; Kitani, K.M. No-reference image quality assessment via transformers, relative ranking, and self-consistency. In Proceedings of the IEEE/CVF Winter Conference on Applications of Computer Vision, Waikoloa, HI, USA, 3–8 January 2022; pp. 1220–1230. [Google Scholar]
- Wu, L.; Zhang, X.; Chen, H.; Wang, D.; Deng, J. VP-NIQE: An opinion-unaware visual perception natural image quality evaluator. Neurocomputing 2021, 463, 17–28. [Google Scholar] [CrossRef]
- Chow, L.S.; Rajagopal, H. Modified-BRISQUE as no reference image quality assessment for structural MR images. Magn. Reson. Imaging 2017, 43, 74–87. [Google Scholar] [CrossRef]
- Chan, R.W.; Goldsmith, P.B. A psychovisually-based image quality evaluator for JPEG images. In Proceedings of the 2000 IEEE International Conference on Systems, Man & Cyberbetics - Cyberbetics Evolving to Systems, Humans, Organizations, and their Complex Interactions, Nashville, TN, USA, 8–11 October 2000; pp. 1541–1546. [Google Scholar]
Figure 1.
Visual representation of the specific process of proposed model.
Figure 2.
Flowchart Illustrating the process of degrading source images into LR images .
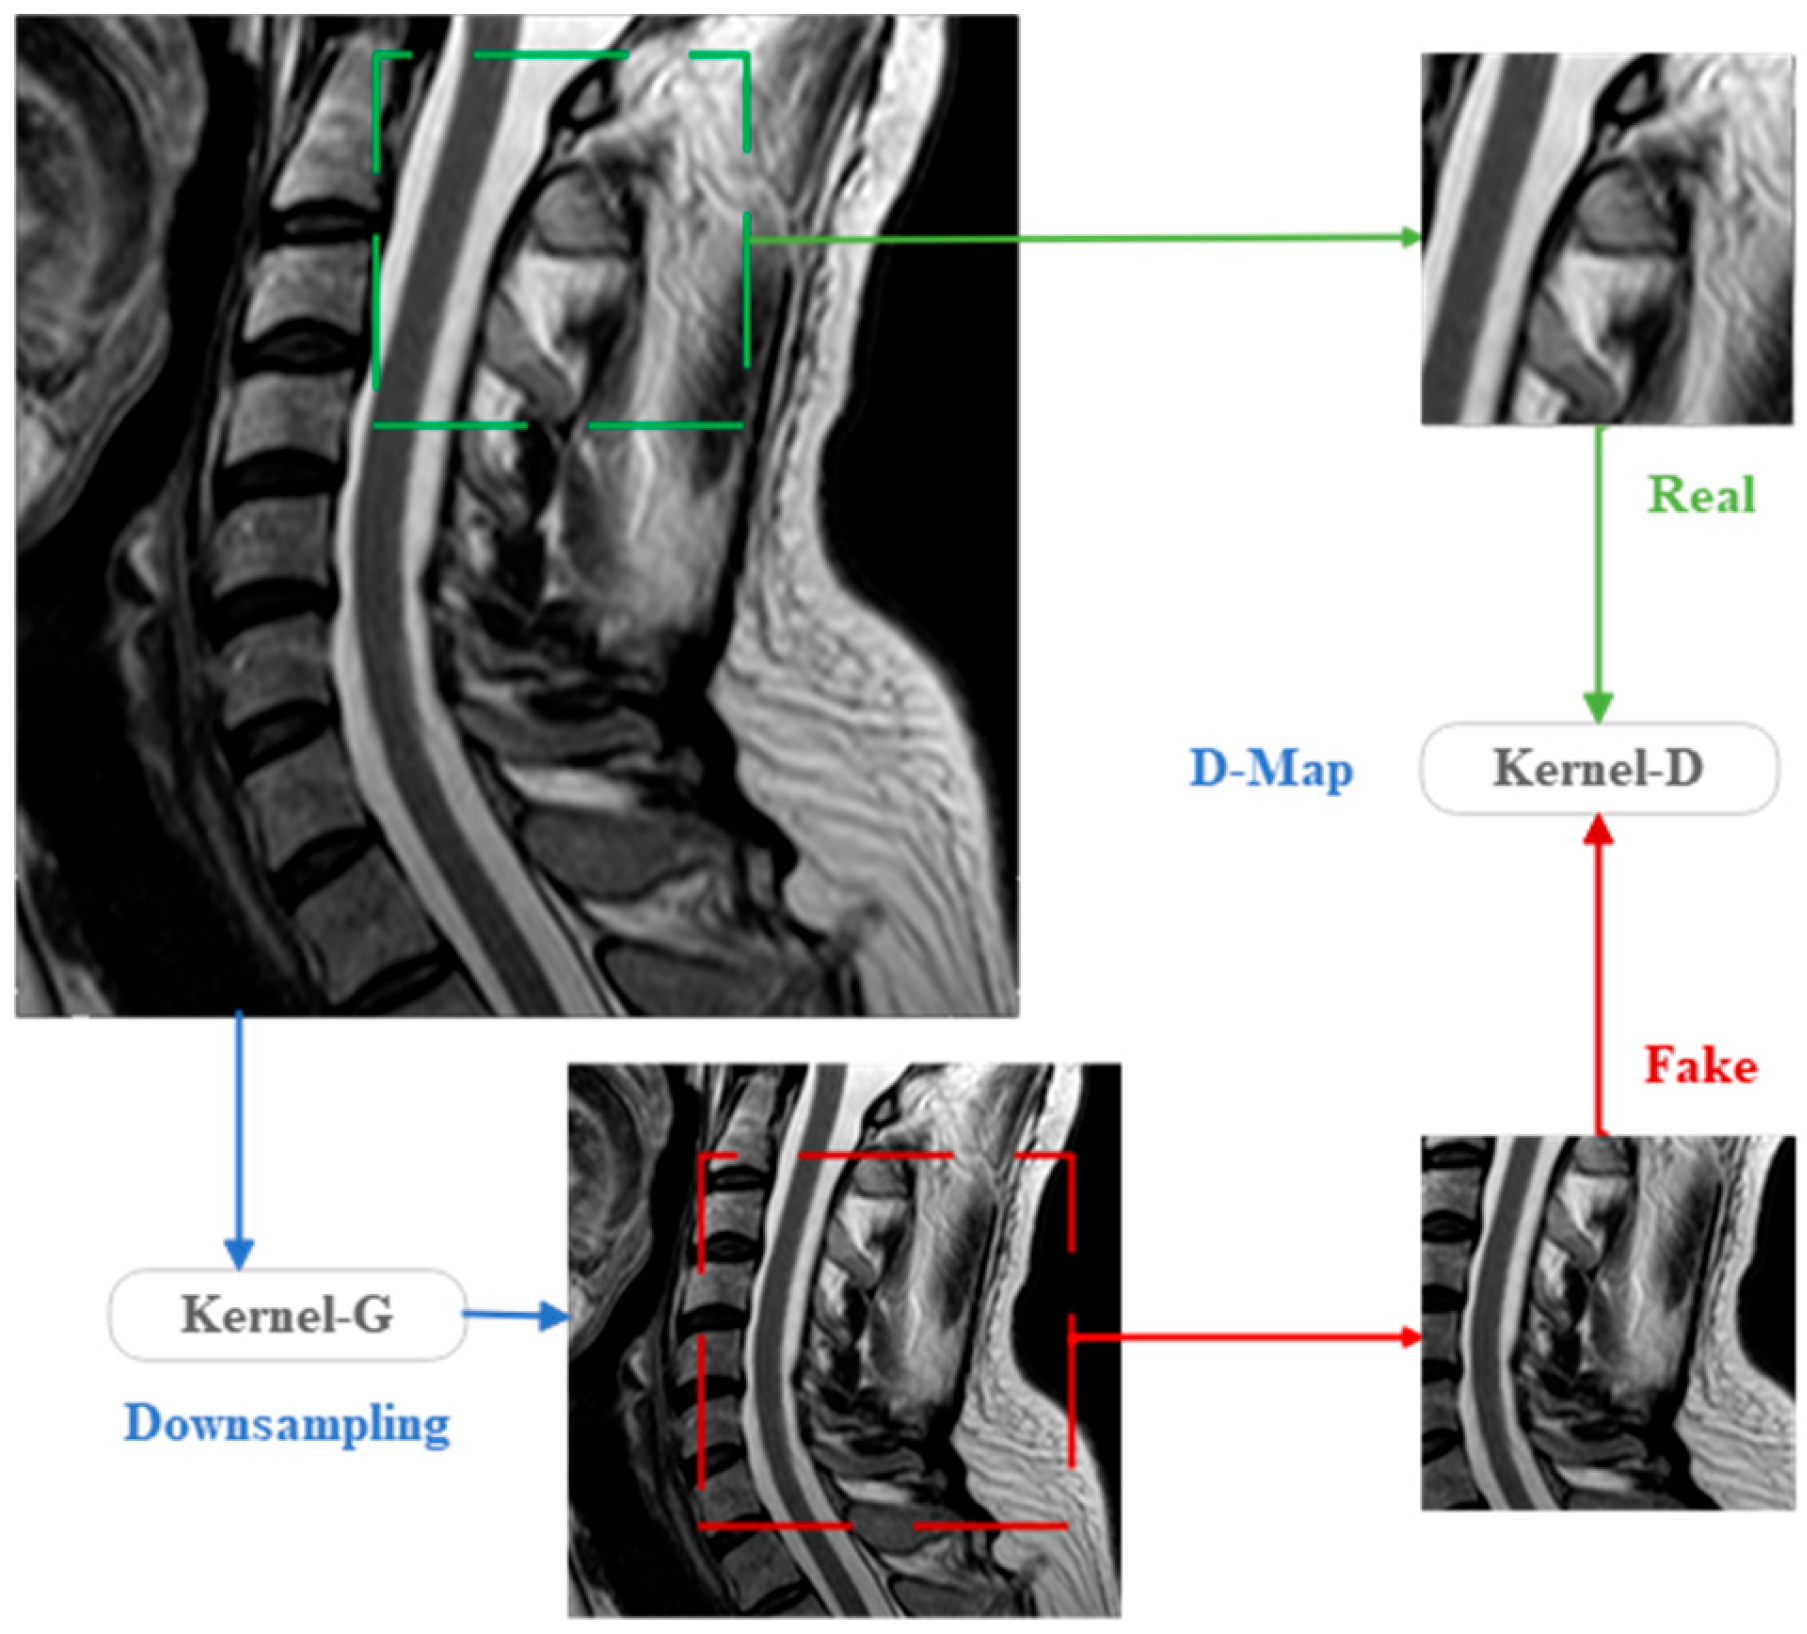
Figure 3.
KernelGAN structure.
Figure 4.
Kernel generator network structure.
Figure 5.
Kernel discriminator network structure.
Figure 6.
Graphic examples of degradation kernels.
Figure 7.
Architecture of the super-resolution analysis network (MRISR).
Figure 8.
Structure of mixed attention group with residual connection (MTOG).
Figure 9.
Mixed attention block (MTB).
Figure 10.
Overlapping channel attention (OCA).
Figure 11.
Two-dimensional selective scan (SS2D).
Figure 12.
Cross-attention block (CAMB).
Figure 13.
Distribution of assessment values for the NIQE.
Figure 14.
Distribution of assessment values for the RISQUE.
Figure 15.
Distribution of assessment values for the PIQE.
Figure 16.
Visual comparison of the generated images.
Figure 17.
Visual comparison of the generated images.
Table 1.
Specific parameter settings for convolutional layers in KernelGAN.
| | In_
Channels | Out_
Channels | Kernel_
Size | Stride | Padding | Other
Parameters |
|---|
| KGAN-G | 3 | 64 | 7 | 1 | 0 | default |
| 64 | 64 | 5 | 1 | 0 | default |
| 64 | 64 | 3 | 1 | 0 | default |
| 64 | 64 | 1 | 1 | 0 | default |
| 64 | 64 | 1 | 1 | 0 | default |
| 64 | 64 | 1 | 1 | 0 | default |
| 64 | 1 | 1 | 2 | 0 | default |
| KGAN-D | 3 | 64 | 7 | 1 | 0 | default |
| 64 | 64 | 1 | 1 | 0 | default |
| 64 | 1 | 1 | 1 | 0 | default |
Table 2.
Specific parameter settings for reconstruction models.
| Model | EDSR8-RGB | RCAN | RS-ESRGAN | KerSRGAN | MRISR |
|---|
| Network | network_g:
type: EDSR
num_in_ch: 3
num_out_ch: 3
num_feat: 256
num_block: 32
upscale: 4
res_scale: 0.1
img_range: 255. | network_g:
type: RCAN
num_in_ch: 3
num_out_ch: 3
num_feat: 64
num_group: 10
num_block: 20
squeeze_factor: 16
upscale: 4
res_scale: 1
img_range: 255. | network_g:
type: RRDBNet
num_in_ch: 3
num_out_ch: 3
num_feat: 64
num_block: 23
network_d:
type: VGGStyleDiscriminator128
num_in_ch: 3
num_feat: 64 | network_G:
type: RRDBNet
num_in_ch: 3
num_out_ch: 3
num_feat: 64
num_block: 23
network_D:
type: NLayerDiscriminator
num_in_ch: 3
num_feat: 64
num_layer: 3 | network_g:
type: MTOG
num_in_ch: 3
num_out_ch: 3
num_feat: 64
num_block: 20
upscale: 4
res_scale: 1
img_range: 255. |
| Traing | optim_g:
type: Adam
learningrate: 1 × 10⁻⁴
weight_decay: 0
betas: [0.9, 0.99]
scheduler:
type:MultiStepLR
milestones: [2 × 10⁵]
gamma: 0.5
total_iter: 3 × 10⁵ | optim_g:
type: Adam
learningrate: 1 × 10⁻⁴
weight_decay: 0
betas: [0.9, 0.99]
scheduler:
type: MultiStepLR
milestones: [2 × 10⁵]
gamma: 0.5
total_iter: 3 × 10⁵ | optim_g:
type: Adam
learningrate: 1 × 10⁻⁴
weight_decay: 0
betas: [0.9, 0.99]
optim_d:
type:Adam
learningrate: 1 × 10⁻⁴
weight_decay: 0
betas: [0.9, 0.99]
scheduler:
type:MultiStepLR
milestones: [5 × 10⁴, 1 × 10⁵, 2 × 10⁵, 3 × 10⁵]
gamma: 0.5
total_iter: 4 × 10⁵ | optim_g:
type: Adam
learningrate: 1 × 10⁻⁴
weight_decay: 0
betas: [0.9, 0.999]
optim_d:
type:Adam
learningrate: 1 × 10⁻⁴
weight_decay: 0
betas: [0.9, 0.999]
scheduler:
type:MultiStepLR
milestones: [5 × 10³, 1 × 10⁴, 2 × 10⁴, 3 × 10⁴]
gamma: 0.5
total_iter: 6 × 10⁵ | optim_g:
type: Adam
learningrate: 1 × 10⁻⁴
weight_decay: 0
betas: [0.9, 0.99]
scheduler:
type:MultiStepLR
milestones: [2 × 10⁵]
gamma: 0.5
total_iter: 3 × 10⁵ |
Table 3.
Statistical data of NIQE, BRISQUE, and PIQE assessment values.
| | EDSR8-RGB | RCAN | RS-ESRGAN | KerSRGAN | MRISR |
|---|
| NIQE mean | 5.851 | 5.041 | 4.108 | 3.743 | 2.286 |
| NIQE max | 6.676 | 5.28 | 4.749 | 5.195 | 3.452 |
| NIQE min | 4.209 | 3.899 | 2.729 | 2.867 | 1.025 |
| BRISQUE mean | 49.673 | 47.514 | 23.258 | 22.459 | 15.789 |
| BRISQUE max | 60.312 | 58.572 | 33.774 | 44.027 | 42.839 |
| BRISQUE min | 42.859 | 36.064 | 8.648 | 3.943 | 3.108 |
| PIQE mean | 80.299 | 60.502 | 15.044 | 14.709 | 13.122 |
| PIQE max | 33.459 | 78.378 | 25.631 | 25.884 | 24.667 |
| PIQE min | 65.744 | 26.539 | 8.586 | 7.688 | 6.767 |
| Disclaimer/Publisher’s Note: The statements, opinions and data contained in all publications are solely those of the individual author(s) and contributor(s) and not of MDPI and/or the editor(s). MDPI and/or the editor(s) disclaim responsibility for any injury to people or property resulting from any ideas, methods, instructions or products referred to in the content. |
© 2024 by the authors. Licensee MDPI, Basel, Switzerland. This article is an open access article distributed under the terms and conditions of the Creative Commons Attribution (CC BY) license (https://creativecommons.org/licenses/by/4.0/).

