Abstract
Agriculture stands as the cornerstone of Africa’s economy, supporting over 60% of the continent’s labor force. Despite its significance, the quality assessment of agricultural products remains a challenging task, particularly at a large scale, consuming valuable time and resources. The African plum is an agricultural fruit that is widely consumed across West and Central Africa but remains underrepresented in AI research. In this paper, we collected a dataset of 2892 African plum samples from fields in Cameroon representing the first dataset of its kind for training AI models. The dataset contains images of plums annotated with quality grades. We then trained and evaluated various state-of-the-art object detection and image classification models, including YOLOv5, YOLOv8, YOLOv9, Fast R-CNN, Mask R-CNN, VGG-16, DenseNet-121, MobileNet, and ResNet, on this African plum dataset. Our experimentation resulted in mean average precision scores ranging from 88.2% to 89.9% and accuracies between 86% and 91% for the object detection models and the classification models, respectively. We then performed model pruning to reduce model sizes while preserving performance, achieving up to 93.6% mean average precision and 99.09% accuracy after pruning YOLOv5, YOLOv8 and ResNet by 10–30%. We deployed the high-performing YOLOv8 system in a web application, offering an accessible AI-based quality assessment tool tailored for African plums. To the best of our knowledge, this represents the first such solution for assessing this underrepresented fruit, empowering farmers with efficient tools. Our approach integrates agriculture and AI to fill a key gap.
Keywords:
agriculture; artificial intelligence; object detection; African plums; YOLOv5; YOLOv8; YOLOv9; Fast R-CNN; Mask R-CNN; VGG-16; DenseNet-121; MobileNet; ResNet 1. Introduction
Accurate assessment of fruit quality is essential for ensuring food security and optimizing agricultural production. In recent years, there has been a growing need for innovative solutions to address the challenges faced in fruit quality evaluation. Computer vision and artificial intelligence (AI) techniques are increasingly being explored for applications such as fruit detection and grading. Plums are an important fruit crop worldwide, with several varieties commonly grown across regions for their nutritional and economic value. AI and machine learning have been applied to tasks like plum detection, sorting, and quality assessment for plums like the European plum. However, one variety that remains understudied is the African plum.
The African plum, also known as Dacryodes edulis [1], is a significant crop grown by smallholders in Africa. As a biodiverse species, it contributes significantly to food security and rural livelihoods in over 20 countries. Commonly found in home gardens and smallholdings, African plum is estimated to support millions of farm households through food, nutrition, and income generation [2]. It bears fruit year-round, providing a reliable staple high in vitamins C and A [3]. Leaves are also collected as food seasoning or fodder. Its multi-purpose uses enhance resilience for subsistence farmers. Culturally, African plum plays dietary and medicinal roles, with all plant parts consumed or utilized. It forms part of the region’s cultural heritage and traditional ecological knowledge systems [4]. However, lack of improved production practices and limited access to markets have prevented scale-up of its commercial potential [5]. Better quality assessment and grading methods specific to African plum could help address this challenge. Our study aims to develop such techniques using artificial intelligence as a means to support livelihoods dependent on this vital traditional crop.
This research aims to explore the application of machine learning [6,7] and computer vision algorithms [8,9] to address this issue and enable industrial-scale quality control. This study focuses on developing a computer vision system for contactless quality assessment of African plums, a widely cultivated crop in Africa.
In recent years, the field of computer vision, particularly deep learning (DL) algorithms, has emerged as a promising solution for fruit assessment [10,11]. Deep convolutional neural networks (CNNs) have revolutionized image classification and identification [12], enabling accurate and reliable analysis of fruit quality. Recent research studies have demonstrated the effectiveness of object detection models in fruit assessment. For instance, a study published in 2023 utilized the YOLOv5 model to assess apple quality, achieving an accuracy of 90.6% [13]. Similarly, a research paper from 2023 showcased the successful application of the Mask R-CNN model in identifying and localizing defects in citrus fruits, achieving an F1-score of 85.6% [14].
Pruning techniques have emerged as a valuable approach to further optimize the performance of object detection models in fruit assessment. Pruning involves selectively removing redundant or less informative parameters, connections, or structures from a trained model, leading to more efficient and computationally lightweight models. By applying pruning techniques, researchers have successfully enhanced the efficiency and effectiveness of fruit assessment models. For instance, in a study published in 2022, pruning techniques were employed to optimize a YOLOv5 model used for apple quality assessment, resulting in a more compact and computationally efficient model while maintaining high accuracy [15].
Recent research highlights the remarkable capabilities of object detection models, such as YOLO, Mask R-CNN, Fast R-CNN, VGG-16, DenseNet-121, MobileNet, and ResNet, in accurately identifying and localizing external quality attributes of various fruits. The successful application of these models demonstrates their potential for automating fruit quality assessment and enhancing grading processes, contributing to overall improvements in fruit assessment and quality control practices.
This study focuses on developing models based on a range of architectures, including YOLOv5 [16], YOLOv8 [17], YOLOv9 [18], Fast R-CNN [19], Mask R-CNN [20], VGG-16 [21], DenseNet121 [22], MobileNet [23], and ResNet [24], specifically tailored for the external quality assessment of African plums.
To assess the quality of African plums, we collected a comprehensive dataset of over 2892 labeled images, divided into training, validation, and testing sets. The aforementioned models were trained, fine-tuned, and validated. Among these, YOLOv8 demonstrated the highest accuracy in detecting surface defects. We integrated YOLOv8 into a prototype inspection system to evaluate its effectiveness in contactless quality sorting at an industrial scale. This integration aims to enhance the efficiency of sorting processes, improving productivity and quality assurance in the agricultural industry. The main contributions of this work are as follows:
- Developed models based on YOLOv9, YOLOv8, YOLOv5, Fast R-CNN, Mask R-CNN, VGG-16, DenseNet-121, MobileNet, and ResNet for African plum quality assessment;
- Implemented pruning techniques to optimize YOLOv9, YOLOv8, YOLOv5, MobileNet, and ResNet models, resulting in more efficient, computationally lightweight models;
- Collected a new labeled dataset of over 2892 African plum samples, the first of its kind for this fruit crop, see Figure 1;
- Deployed the best-performing model (YOLOv8) in a web interface for real-time defect detection [25]. A running instance [26].
Such data-driven solutions could enhance African agriculture by addressing production challenges for underutilized native crops.
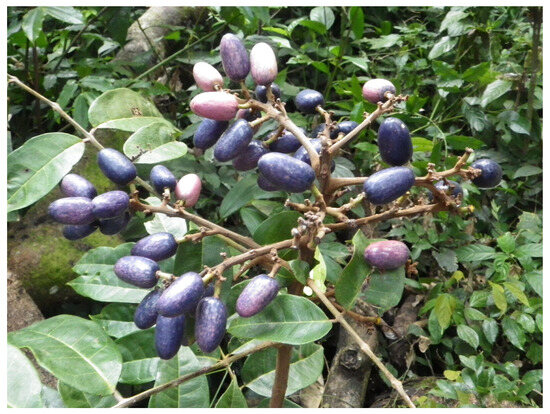
Figure 1.
Sample images showcasing plum fruits on the fruit tree [27].
2. Related Works on Plum
The application of computer vision and deep learning for agricultural product quality assessment and defect detection has gained significant attention in recent years. Several studies have explored the utilization of convolutional neural networks (CNNs) for detecting defects and classifying the quality grades of various fruits, vegetables, and grains.
In the context of fruit defect detection, CNNs have been employed to detect defects on apples [28], oranges [29], strawberries [30], and mangoes [31], among other fruits. For instance, Khan et al. [32] developed a deep learning-based apple disease detection system. They constructed a dataset of 9000 high-quality apple leaf images covering various diseases. The system uses a two-stage approach, with a lightweight classification model followed by disease detection and localization. The results showed promising classification accuracy of 88% and a maximum average precision of 42%. Similarly, Faster R-CNN models have been employed for accurate defect detection in citrus fruits, achieving comparable accuracies [33]. Additionally, Kusrini et al. [34] compared deep learning models for mango pest and disease recognition using a labeled tropical mango dataset. VGG16 achieved the highest accuracy at 89% in validation and 90% in testing, with a testing time of 2 s for 130 images.
The application of object detection models such as Faster R-CNN, SSD, YOLO, DenseNet, and Mask R-CNN has also been prevalent in agricultural applications [35]. Notably, YOLO models trained on mango images have demonstrated high accuracy in detecting anthracnose disease [36]. YOLOv3 has shown superior performance compared to other models in detecting apple leaf diseases [32]. Recent studies have also utilized DenseNet-121 and VGG-16 models for fruit defect detection and quality assessment [37], further highlighting their effectiveness in this domain. Additionally, MobileNet and ResNet architectures have been extensively studied and applied in various computer vision tasks. The MobileNet architecture, introduced by Szegedy et al. [38], utilizes inception modules to achieve high accuracy while maintaining computational efficiency.
While these studies have made significant contributions to fruit quality assessment and defect detection, the incorporation of pruning techniques to optimize model performance and streamline computational complexity has been gaining attention. In our work, we extended the existing research by applying pruning techniques to five models: YOLOv9, YOLOv8, YOLOv5, MobileNet, and ResNet. By selectively removing redundant parameters and connections, pruning helped improve the efficiency and speed of these models without compromising their accuracy.
In summary, deep CNNs and object detection models have demonstrated remarkable capabilities in assessing agricultural product quality and detecting defects. Our work contributes to this field by targeting the African plum and demonstrating the feasibility of an intelligent vision system for automating post-harvest processing. The comprehensive evaluation of our pruned models on the African plum dataset showcased improved efficiency without sacrificing accuracy. However, further research is needed to address real-world complexities, such as variations in shape, size, color, and imaging conditions, when deploying these models practically in African settings. The inclusion of Densenet-121 and VGG-16 models in our study further expands the range of models used for fruit defect detection, enhancing the comprehensiveness of our research in this area.
3. Data Collection and Dataset Description
The acquisition of a robust and comprehensive dataset is essential for the development of an effective deep learning model. In this section, we present the details of our data collection process and describe the African plum dataset collected from major plum-growing regions in Cameroon.
We utilized an android phone to capture a total of 2892 images, encompassing both good and defective African plums. Our data collection strategy involved acquiring images from three distinct agro-ecological regions: Littoral (coastal tropical climate), North West (highland tropical climate), and North (Sudano-Sahelian climate). By capturing images across diverse regions, we ensured the inclusion of variations in plum size, shape, color, and defects, making our dataset representative of real-world scenarios.
The image capture process took place at two different orchards within each region over a three-month period, coinciding with the peak harvesting season. To enhance the robustness of our dataset, we took images against varying backgrounds, such as soil, white paper boards, shed walls, etc. This approach aimed to expose the deep learning model to different visual contexts, ultimately improving its performance. Furthermore, we captured images of the plums from multiple angles to portray their comprehensive appearance.
Considering the impact of lighting conditions on image quality, we acquired images at different times of the day, including early morning, noon, afternoon, and dusk. We specifically accounted for both shade and direct sunlight conditions during image capture. To ensure the dataset covered a wide range of defects, we included various types of defective plums, such as bruised, cracked, rotten, spotted, and unaffected good plums. Each plum was imaged multiple times, resulting in high-resolution images that provide detailed information for analysis.
To facilitate subsequent analysis and model training, all images were annotated using the labeling tool in Roboflow. Our annotation process involved marking bounding boxes around each plum in the images. We defined three distinct classes: good plums, bad plums (defective plums), and a background class that indicates the absence of fruit in the image.To maintain annotation consistency, a single annotator was responsible for labeling the entire dataset. Additionally, another annotator validated the efficiency of the annotations. Also, extensive data cleaning procedures were employed to ensure data quality and integrity. As a result, we obtained a final curated dataset consisting of 2892 annotated images.
Figure 1 showcases sample images depicting plum fruits on the fruit tree, providing a visual representation of the African plum.
Our diverse and comprehensive African plum dataset captures the inherent complexities of the real-world agricultural setting. The dataset incorporates variations in growing conditions, plum quality, and imaging environments, making it an invaluable resource for training robust deep learning models for automated defective plum detection. The availability of such a dataset will contribute to advancements in agricultural technology and pave the way for more efficient and accurate fruit assessment processes.
4. Model Architecture
In this section, we present an evaluation of different state-of-the-art convolutional neural network (CNN) architectures for classification and object detection. The objective is to determine the most suitable approach for our specific application of object detection in the context of the African plum dataset.
4.1. Model and Technique Descriptions
We consider the following eight CNN architectures for evaluation:
- You Only Look Once (YOLO): YOLO frames object detection as a single-stage regression problem, directly predicting bounding boxes and class probabilities in one pass [39]. We experiment with YOLOv5, YOLOv8, and YOLOv9, which build upon smaller, more efficient backbone networks like CSPDarknet53 compared to earlier YOLO variants. These models divide the image into a grid and associate each grid cell with bounding box data. YOLOv8 and YOLOv9 improve accuracy through an optimized neck architecture that enhances the flow of contextual information between the backbone and prediction heads [17]. YOLOv5’s Architecture is shown in Figure 2.
- Fast R-CNN: Fast R-CNN is a two-stage detector that utilizes a Region Proposal Network (RPN) to propose regions of interest (RoIs), followed by classification and refinement of the detected objects in each RoI [40]. It employs a Region-of-Interest Pooling (RoIPool) layer to extract fixed-sized feature maps from the backbone network’s feature maps for each candidate box.
- Mask R-CNN: Building on Faster R-CNN, Mask R-CNN introduces a parallel branch for predicting segmentation masks on each RoI, in addition to bounding boxes and class probabilities [20]. It utilizes a mask prediction branch with a Fully Convolutional Network (FCN) to predict a binary mask for each RoI. This per-pixel segmentation ability enables instance segmentation tasks alongside object detection.
- DenseNet-121: DenseNet-121 is a widely used convolutional neural network model that features densely connected layers, which improve gradient flow and reduce the number of parameters required compared to traditional architectures. Although it is primarily a classification model, it has been integrated into object detection frameworks like Mask R-CNN to enhance feature extraction and improve performance in complex object detection tasks [22].
- VGG16: VGG16 is a widely adopted CNN architecture that has shown strong performance in object detection tasks [21]. Its deep network structure and large receptive field contribute to its ability to capture and represent complex visual patterns.
- MobileNet: MobileNet, also known as Inception-v1, is another popular CNN architecture introduced by Szegedy et al. [38]. It employs the concept of inception modules, which are designed to capture multi-scale features by using filters of different sizes within the same layer. GoogleNet’s architecture enables efficient training and inference with a reduced number of parameters.
- ResNet: ResNet, proposed by He et al. [24], addresses the degradation problem in deep neural networks by introducing residual connections. These skip connections allow the gradients to flow more easily during training, enabling the training of very deep networks. ResNet has achieved state-of-the-art performance in various computer vision tasks, including image classification and object detection.
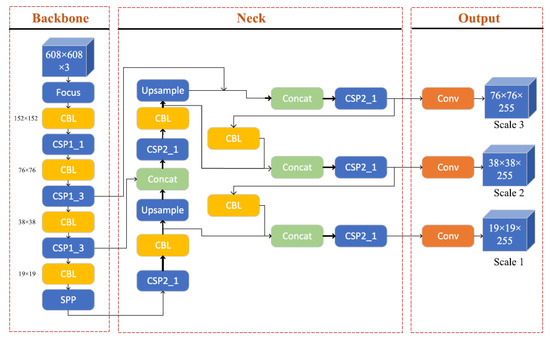
Figure 2.
The YOLOv5 is structured into three primary segments: the backbone, neck, and output [41].
4.2. Key Features
Each of the evaluated architectures brings unique features and innovations that contribute to their overall performance and effectiveness:
- YOLO: YOLO models provide real-time object detection capabilities due to their single-stage regression approach and optimized architecture.
- Fast R-CNN: The two-stage design of Fast R-CNN, with the RPN and RoIPool layer, enables accurate localization and classification of objects in images.
- Mask R-CNN: In addition to bounding boxes and class probabilities, Mask R-CNN introduces per-pixel segmentation to enable instance-level object detection and segmentation.
- DenseNet-121: DenseNet-121 is a convolutional neural network known for its densely connected architecture, where each layer is connected to every other layer, facilitating better gradient flow and feature reuse.
- VGG16: With its deep network structure and large receptive field, VGG16 has demonstrated strong performance in previous image classification studies.
- MobileNet: MobileNet’s inception modules allow it to capture multi-scale features efficiently, leading to good performance with fewer parameters.
- ResNet: ResNet’s residual connections address the degradation problem in deep networks, enabling the training of very deep architectures and achieving state-of-the-art performance in various computer vision tasks.
4.3. Supporting Evidence
We support our evaluation of these architectures by referring to relevant papers that describe their architectures and demonstrate their performance in object detection tasks. Please refer to the following citations for more detailed information: YOLO: [17,39], Fast R-CNN: [40], Mask R-CNN: [20], DenseNet-121: [22], VGG16: [21], GoogleNet: [23], and ResNet: [24].
4.4. Framework and Dataset
To facilitate the evaluation process, we leverage the Roboflow framework [42] for data labeling, augmentation, and model deployment. Roboflow is a comprehensive computer vision platform that streamlines the development lifecycle from data preparation to model deployment and monitoring; it provides tools for dataset creation, annotation, augmentation, and model training using popular frameworks, allowing users to package and deploy models as APIs or embedded solutions, with hosted deployment, inference, and performance tracking capabilities, as well as support for team collaboration and versioning, enabling efficient development of computer vision applications.
4.5. Application Relevance
Comparing these model architectures is crucial for our specific object detection task in the context of the African plum dataset. By evaluating the performance of these architectures, we aim to identify the most suitable approach that can accurately and efficiently detect objects in our dataset. This determination will help us make informed decisions regarding the choice of model for our application, potentially improving the efficiency and accuracy of object detection in African plum images. Additionally, understanding the strengths and weaknesses of each architecture will provide valuable insights for future research and development in the field of object detection.
5. Experimental Results and Analysis
This section presents the experimental results and analysis of the African plum defect detection system. It covers the data preprocessing steps, model training, evaluation results, and a detailed discussion.
Figure 3 provides an overview of the key steps in our implementation. The process starts with data collection, followed by data preprocessing. We then evaluated various object detection models, including YOLOv5, YOLOv8, YOLOv9, Fast R-CNN, Mask R-CNN, VGG16, DenseNet-121, MobileNet, and ResNet, the models were then trained and validated, and finally evaluated on the test set to assess their performances.
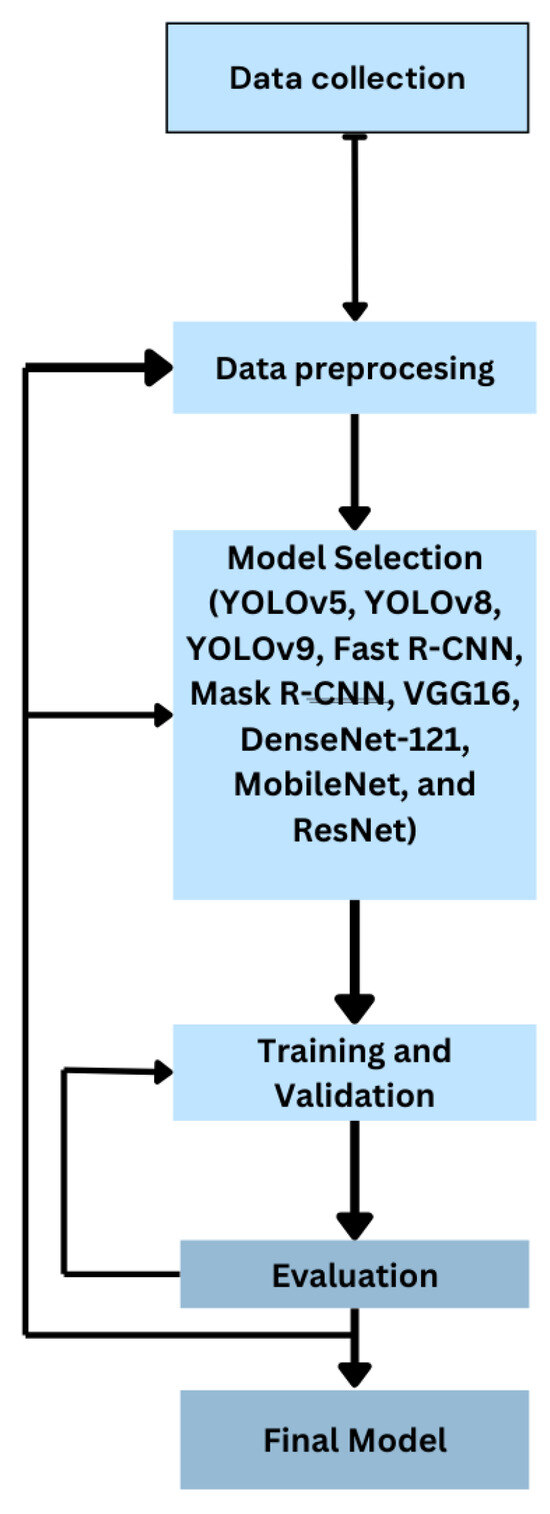
Figure 3.
Overview of the key steps in our implementation. These structured steps ensure efficient implementation of the project.
The subsequent subsections will delve into the details of each step, providing further insights into our experimental approach and findings.
5.1. Data Preprocessing and Augmentation
The raw African plum image dataset underwent several preprocessing steps to prepare it for model training and evaluation. These steps are described below:
- Labeling for object detection models: The dataset of 2892 images was manually annotated using the Roboflow platform. Each image was labeled to delineate the regions corresponding to good and defective plums. Additionally, a background class was used to indicate areas where no fruit was present in the image (see Figure 4).
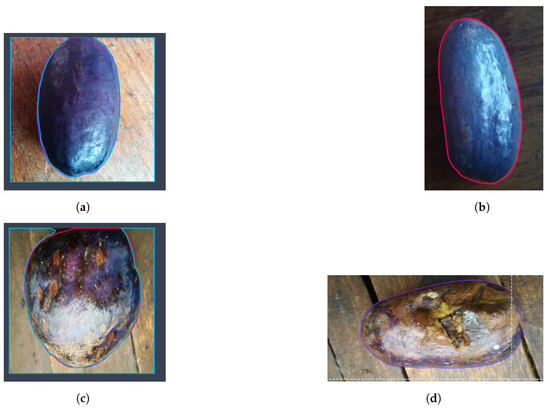 Figure 4. Sample images showcasing the labeling of good and defective plums with and without the background category. (a) Labeling of a good plum with the background class. (b) Labeling of a good plum. (c) Labeling of a defective plum with the background class. (d) Labeling of a defective plum.
 - Labeling for classification models: For the classification models, a simplified labeling approach was used. Two separate annotation files were created, one for good plums and one for defective plums. The images were labeled with their respective class, without the inclusion of a background class. This approach was suitable for the classification task performed by these models.
- Augmentation: To increase the diversity of the dataset and improve the model’s generalization ability, online data augmentation techniques were applied during training. These techniques included rotations, flips, zooms, and hue/saturation shifts. By augmenting the data, we introduced additional variations and enhanced the model’s ability to handle different scenarios.
- Data splitting: The dataset was split into three subsets: a training set comprising 70% of the data, a validation set comprising 20%, and a test set comprising the remaining 10%. The splitting was performed in a stratified manner to ensure a balanced distribution of good and defective plums in each subset.
- Image resizing: The image resolutions used for the various models were selected based on the specific requirements and constraints of each model. The YOLOv5, YOLOv8, and YOLOv9 models, which are designed for real-time object detection, used higher input resolutions (416 × 416, 800 × 800, and 640 × 640, respectively) to capture more detailed visual information and improve the model’s ability to detect smaller objects. The Mask R-CNN and Faster R-CNN models, used for instance segmentation, required higher-resolution inputs (640 × 640) to accurately delineate object boundaries and capture fine-grained details. In contrast, the VGG16, DenseNet-121, MobileNet, and ResNet models, which are classification-based and were trained on the ImageNet dataset, used a standard input size of 224 × 224 pixels, as this lower resolution is sufficient for image classification tasks, which focus on recognizing high-level visual features rather than detailed object detection or segmentation.
5.2. Model Training
The training process involved training the Yolov9, YOLOv5, YOLOv8, Mask R-CNN, Fast R-CNN, VGG16, and DenseNet-121 models using the Google Colab framework. The key details of the model training are summarized in Table 1.

Table 1.
Training details for the YOLOv5, YOLOv8, YOLOv9, Mask R-CNN, Fast R-CNN, VGG16, DenseNet-121, MobileNet, and ResNet models.
The number of training epochs for each model was varied based on the complexity of the task and the dataset, with the Mask R-CNN model requiring the most training iterations (10,000) due to the more complex instance segmentation task. Among the YOLO-based models, YOLOv9 requires the fewest training epochs (30) due to the simpler object detection task and the use of a pre-trained backbone.
The YOLOv5 model was trained, see Figure 5, with an input resolution of 416 × 416 pixels, using a batch size of 16. The Adam optimizer was employed with a learning rate determined through hyperparameter tuning. The model was trained for 150 epochs, iterating over the training dataset multiple times to optimize the model’s parameters.
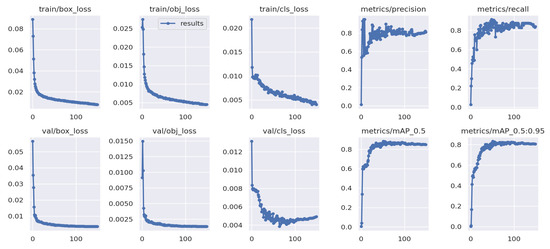
Figure 5.
YOLOv5 training performance. This figure shows the training curves for the YOLOv5 object detection model. The top plot displays the loss function during the training process, which includes components for bounding box regression, object classification, and objectness prediction. The bottom plot displays the model’s mAP50 and mAP50-95 metrics on the validation dataset, which are key indicators of the model’s ability to accurately detect and classify objects.
The YOLOv8 model was trained, see Figure 6, with an input resolution of 800 × 800 pixels and a batch size of 16. The Adam optimizer was used, and the model was trained for 80 epochs. The training process involved updating the model’s parameters to minimize the detection loss and enhance its ability to accurately detect and classify good and defective plums.
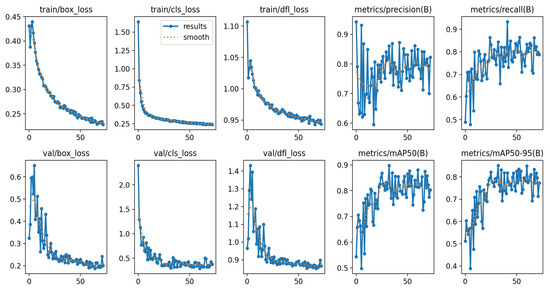
Figure 6.
YOLOv8 training and evaluation. This figure presents the performance metrics for the YOLOv8 object detection model during the training and evaluation phases. The top plot shows the training loss, which is composed of components for bounding box regression, object classification, and objectness prediction. The bottom plot displays the model’s mAP50 and mAP50-95 metrics on the validation dataset, which are key indicators of the model’s ability to accurately detect and classify objects.
Similarly, the YOLOv9 model was trained as illustrated in Figure 7, using an input resolution of 640 × 640 pixels and a batch size of 16. The training process, utilizing the Adam optimizer, spanned 30 epochs.
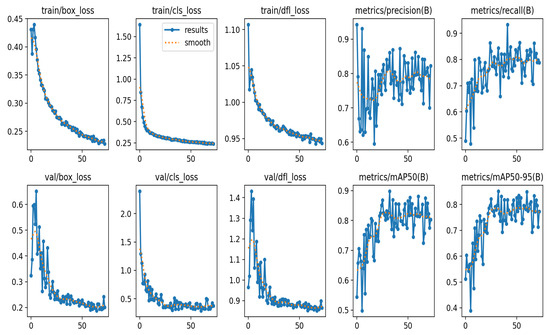
Figure 7.
YOLOv9 training and evaluation. This figure presents the performance metrics for the YOLOv9 object detection model during the training and evaluation phases. The top plot shows the training loss, which is composed of components for bounding box regression, object classification, and objectness prediction. The bottom plot displays the model’s mAP50 and mAP50-95 metrics on the validation dataset, which are key indicators of the model’s ability to accurately detect and classify objects.
The Fast R-CNN, Figure 8, and Mask R-CNN, Figure 9, models were also trained on the African plum dataset. These models were trained with an input resolution of 640 × 640 pixels. The Faster R-CNN model employed the SGD optimizer with a batch size of 64 and was trained for 1500 iterations. On the other hand, the Mask R-CNN model utilized the stochastic gradient descent (SGD) optimizer with a batch size of 8 and was trained for 10,000 iterations.
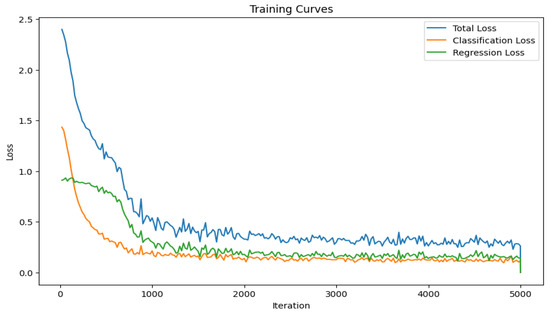
Figure 8.
Fast R-CNN training and evaluation metrics. This figure shows the training and validation metrics for the Fast R-CNN object detection model. The blue line represents the overall training loss, which includes components for bounding box regression, object classification, and region proposal classification. The orange and green lines show the validation metrics for the classification loss and the regression loss, respectively. These metrics indicate the model’s performance in generating accurate region proposals and classifying/localizing detected objects.
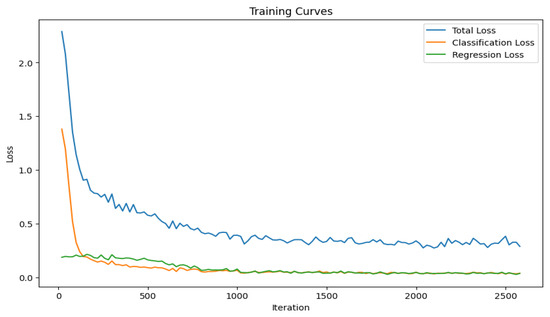
Figure 9.
Mask R-CNN training and evaluation metrics. This figure presents the training and validation performance metrics for the Mask R-CNN instance segmentation model. The blue line represents the overall training loss, which includes components for bounding box regression, object classification, and region proposal classification. The orange and green lines show the validation metrics for the classification loss and the regression loss, respectively. These metrics indicate the model’s performance in generating accurate region proposals and classifying/localizing detected objects.
The VGG16, Figure 10, and DenseNet-121, Figure 11, models were trained for the classification task using an input resolution of 224 × 224 pixels. A batch size of 32 was used for both models. The Adam optimizer was employed, and the models were trained for 15 epochs. The MobileNet and ResNet models were also trained on the African plum dataset. Both models were trained with an input resolution of 224 × 224 pixels and a batch size of 32. The Adam optimizer was used, and the models were trained for 40 epochs and 16 epochs, respectively.
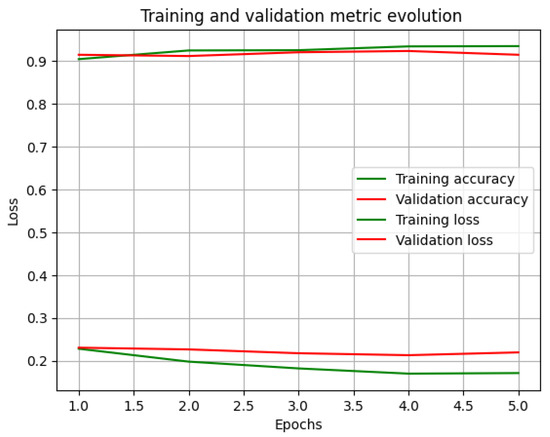
Figure 10.
Training and validation metrics for the VGG-16 model. The top curves represent training (green) and validation (red) accuracy, while the bottom curves depict training (green) and validation (red) loss. The model demonstrates rapid generalization from a strong initial point, as indicated by the swift convergence of accuracy and loss metrics.
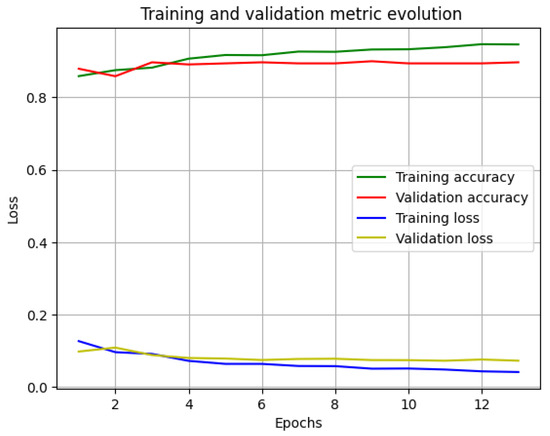
Figure 11.
Training and validation metrics for the DenseNet-121 model. The top curves represent training (green) and validation (red) accuracy, while the bottom curves depict training (blue) and validation (yellow) loss. The model demonstrates rapid generalization from a strong initial point, as indicated by the swift convergence of accuracy and loss metrics.
The training process involved feeding the models with the annotated dataset, allowing them to learn the features and patterns associated with good and defective plums. The models’ parameters were adjusted iteratively during training to minimize the detection and classification error, optimizing their performance for the African plum defect detection task. The models’ training details, including the input resolution, batch size, optimizer, and training epochs, were carefully selected to achieve the best possible performance.
We applied pruning techniques to optimize the YOLOv9, YOLOv8, YOLOv5, ResNet, and MobileNet models. Specifically, we utilized a technique called Magnitude-based Pruning, which identifies and removes the least significant weights or filters based on their absolute values. This method involves ranking all weights or filters in the model by their magnitude and setting a pruning threshold to discard those below this threshold. By removing these less important components, we effectively reduced the number of parameters in the models. This pruning process not only decreased the model size and computational requirements but also aimed to maintain the overall performance of the models.
6. Evaluation and Results
The results presented in Table 2 and Table 3 offer key insights into the performance of deep learning models for African plum quality assessment.

Table 2.
Evaluation results for the YOLOv5, YOLOv8, Faster R-CNN, and Mask R-CNN models.

Table 3.
Evaluation results for the VGG16, DenseNet-121, MobileNet, and ResNet models.
Table 2 highlights the superior object detection capabilities of YOLO models, particularly YOLOv8, which achieved a mean average precision (mAP) of 93.6%, with 87% precision and 90% recall. This demonstrates YOLOv8’s strong ability to detect both defective and quality plums, making it an effective tool for agricultural quality control. YOLOv5, with an mAP of 89.5%, further underscores the robustness of the YOLO architecture. YOLOv8’s 87% precision means that 87% of plums detected as damaged were indeed defective, while the 90% recall indicates the model successfully identified 90% of all defective plums. Although the high recall is crucial to avoid missed defects, the 10% of undetected damages and 13% false positives suggest potential areas for improvement. Figure 12 illustrates various predictions generated by YOLO models, highlighting the differences in performance between YOLOv5, YOLOv8, and YOLOv9.
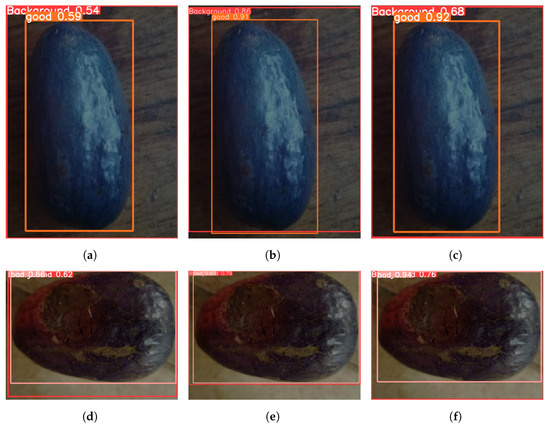
Figure 12.
Model predictions with background class: YOLOv5, YOLOv8, and YOLOv9. (a) YOLOv5 good fruit prediction. (b) YOLOv8 good fruit prediction. (c) YOLOv9 good fruit prediction. (d) YOLOv5 bad fruit prediction. (e) YOLOv8 bad fruit prediction. (f) YOLOv9 bad fruit prediction.
In Table 3, ResNet emerged as the top classification model, with an F1-score of 94%, accuracy of 90%, precision of 91%, and recall of 98%. These metrics reflect ResNet’s balanced performance, with high precision minimizing misclassification and high recall ensuring the identification of nearly all relevant instances. MobileNet also performed well, underscoring its practicality for real-time fruit classification. The F1-score of 94% balances precision and recall, making ResNet particularly suitable for scenarios where both misclassifications and missed detections carry significant costs, such as in the agricultural domain where classification errors can impact both product quality and operational efficiency.
Pruning analysis in Table 4 demonstrates that reducing the size of YOLO models by up to 20% had minimal impact on mAP, with YOLOv8 maintaining an 81% mAP even after pruning. This suggests that smaller, more efficient versions of these models can be deployed on edge devices, which is a key advantage for use in rural areas with limited bandwidth. Similarly, Table 5 shows that ResNet and MobileNet retained high accuracy post-pruning, with ResNet’s accuracy dropping only to 79.7% and MobileNet remaining above 86%. This resilience to pruning enhances the practical applicability of these models, enabling efficient and scalable deployment in diverse agricultural environments.

Table 4.
Results of pruned YOLOv5, YOLOv8, and YOLOv9 models.

Table 5.
Results of pruned ResNet and MobileNet models.
The diversity of the dataset, in terms of plum size, shape, and defects, also played a significant role in model performance. DenseNet-121, with its densely connected layers, performed robustly, whereas simpler models like VGG-16 exhibited limitations. Overall, YOLOv8 and MobileNet demonstrated high efficiency and low computational requirements, making them ideal for real-time deployment on mobile or web-based platforms. This was successfully demonstrated through the integration of YOLOv8 into a web-based quality assessment tool.
In agricultural practices, such a model can streamline the sorting process, reduce labor costs, and increase the overall efficiency of the production line. It can also help in maintaining a consistent quality of produce, which is crucial for consumer satisfaction and brand reputation. Moreover, in the context of precision agriculture, these metrics can inform more nuanced decisions, such as yield prediction, disease detection, and supply chain management, which are vital for sustainable and profitable farming operations.
7. Conclusions
In this research, we have demonstrated the feasibility of utilizing deep learning techniques for automated external quality evaluation of African plums. A comprehensive dataset comprising over 2892 African plum images was curated, encompassing variations in shape, size, color, defects, and imaging conditions across major plum-growing regions in Cameroon. Through the utilization of this dataset, we trained and evaluated different deep learning architectures including YOLOv5, YOLOv8, YOLOv9, Fast R-CNN, Mask R-CNN, VGG16, DenseNet-121, MobileNet, and ResNet for the detection and quantification of defects as well as classification tasks on the plum surface.
Among the object detection models, YOLOv8 and YOLOv9 exhibited strong performances, with mean average precision (mAP) values of 89% and 93.1%, respectively, and F1-scores of 89% and 87.9%. These results indicate the suitability of the YOLO framework for accurate and efficient defect detection in African plums. Furthermore, both models were successfully integrated into a functional web application, enabling real-time surface inspection of African plums.
For the classification task, the results from VGG16, DenseNet-121, MobileNet, and ResNet models were evaluated based on precision, recall, F1-score, and accuracy. However, the pruning results for these models were not provided in the available information, making it challenging to discuss the impact of pruning on their performance.
The evaluation of pruning techniques on the YOLOv8 and YOLOv9 models revealed their sensitivity to pruning levels. While moderate pruning (10% and 20%) maintained relatively high mAP values, heavy pruning (30%) significantly degraded their performance. These results highlight the importance of considering pruning strategies carefully to strike a balance between model size reduction and performance preservation.
Moving forward, there are several avenues for expanding upon this research. Firstly, the collection of more annotated data encompassing additional plum varieties, growing seasons, and defect types would further enhance the robustness and generalization capability of the models. Additionally, exploring solutions for internal quality assessment using non-destructive techniques such as hyperspectral imaging would be an important direction for future research.
Furthermore, extending the application of intelligent inspection to other African crops by creating datasets and models specific to those commodities would broaden the impact of this technology. Evaluating model performance under challenging real-world conditions and incorporating active learning techniques for online improvement are also crucial for ensuring the practical applicability and effectiveness of these AI-based systems.
In summary, this pioneering work demonstrates the potential of AI and advanced sensing technologies in transforming African agriculture. By addressing the limitations identified in this study through future research, we can unlock the full capabilities of intelligent technology to enhance food systems and contribute to the sustainable development of African agriculture.
Author Contributions
Conceptualization, A.N.F.; methodology, A.N.F., S.R.C. and M.A.; software, A.N.F. and S.R.C.; validation, A.N.F., S.R.C. and M.A.; formal analysis, A.N.F. and S.R.C.; investigation, A.N.F. and M.A.; resources, A.N.F.; data curation, A.N.F. and S.R.C.; writing—original draft preparation, A.N.F. and S.R.C.; writing—review and editing, A.N.F., S.R.C. and M.A.; visualization, A.N.F., S.R.C. and M.A.; supervision, A.N.F.; project administration, A.N.F. All authors have read and agreed to the published version of the manuscript.
Funding
This research received no external funding.
Institutional Review Board Statement
Not applicable.
Informed Consent Statement
Not applicable.
Data Availability Statement
The raw data supporting the conclusions of this article will be made available by the authors on request.
Conflicts of Interest
The authors declare no conflicts of interest.
References
- Ajibesin, K.K. Dacryodes edulis (G. Don) HJ Lam: A review on its medicinal, phytochemical and economical properties. Res. J. Med. Plant 2011, 5, 32–41. [Google Scholar]
- Schreckenberg, K.; Degrande, A.; Mbosso, C.; Baboulé, Z.B.; Boyd, C.; Enyong, L.; Kanmegne, J.; Ngong, C. The social and economic importance of Dacryodes edulis (G. Don) HJ Lam in Southern Cameroon. For. Trees Livelihoods 2002, 12, 15–40. [Google Scholar] [CrossRef]
- Rimlinger, A.; Carrière, S.M.; Avana, M.L.; Nguegang, A.; Duminil, J. The influence of farmers’ strategies on local practices, knowledge, and varietal diversity of the safou tree (Dacryodes edulis) in Western Cameroon. Econ. Bot. 2019, 73, 249–264. [Google Scholar] [CrossRef]
- Swana, L.; Tsakem, B.; Tembu, J.V.; Teponno, R.B.; Folahan, J.T.; Kalinski, J.C.; Polyzois, A.; Kamatoa, G.; Sandjo, L.P.; Chamcheu, J.C.; et al. The Genus Dacryodes Vahl.: Ethnobotany, Phytochemistry and Biological Activities. Pharmaceuticals 2023, 16, 775. [Google Scholar] [CrossRef] [PubMed]
- Leakey, R.R.; Tientcheu Avana, M.L.; Awazi, N.P.; Assogbadjo, A.E.; Mabhaudhi, T.; Hendre, P.S.; Degrande, A.; Hlahla, S.; Manda, L. The future of food: Domestication and commercialization of indigenous food crops in Africa over the third decade (2012–2021). Sustainability 2022, 14, 2355. [Google Scholar] [CrossRef]
- Sarker, I.H. Machine learning: Algorithms, real-world applications and research directions. SN Comput. Sci. 2021, 2, 160. [Google Scholar] [CrossRef]
- Zhou, Z.H. Machine Learning; Springer Nature: London, UK, 2021. [Google Scholar]
- Szeliski, R. Computer Vision: Algorithms and Applications; Springer Nature: London, UK, 2022. [Google Scholar]
- Szeliski, R. Concise Computer Vision. An Introduction into Theory and Algorithms; Springer: Berlin/Heidelberg, Germany, 2014. [Google Scholar]
- Apostolopoulos, I.D.; Tzani, M.; Aznaouridis, S.I. A General Machine Learning Model for Assessing Fruit Quality Using Deep Image Features. AI 2023, 4, 812–830. [Google Scholar] [CrossRef]
- Xiao, F.; Wang, H.; Xu, Y.; Zhang, R. Fruit Detection and Recognition Based on Deep Learning for Automatic Harvesting: An Overview and Review. Agronomy 2023, 13, 1625. [Google Scholar] [CrossRef]
- Krizhevsky, A.; Sutskever, I.; Hinton, G.E. Imagenet classification with deep convolutional neural networks. In Proceedings of the 25th International Conference on Neural Information Processing Systems, Lake Tahoe, NV, USA, 3–6 December 2012. [Google Scholar]
- Xu, B.; Cui, X.; Ji, W.; Yuan, H.; Wang, J. Apple grading method design and implementation for automatic grader based on improved YOLOv5. Agriculture 2023, 13, 124. [Google Scholar] [CrossRef]
- Rahat, S.M.S.S.; Al Pitom, M.H.; Mahzabun, M.; Shamsuzzaman, M. Lemon Fruit Detection and Instance Segmentation in an Orchard Environment Using Mask R-CNN and YOLOv5. In Computer Vision and Image Analysis for Industry 4.0; CRC Press: Boca Raton, FL, USA, 2023; pp. 28–40. [Google Scholar]
- Mao, D.; Zhang, D.; Sun, H.; Wu, J.; Chen, J. Using filter pruning-based deep learning algorithm for the real-time fruit freshness detection with edge processors. J. Food Meas. Charact. 2024, 18, 1574–1591. [Google Scholar] [CrossRef]
- Solawetz, J. What Is Yolov5? A Guide for Beginners; Roboflow: Des Moines, IA, USA, 2022. [Google Scholar]
- Hussain, M. YOLO-v1 to YOLO-v8, the Rise of YOLO and Its Complementary Nature toward Digital Manufacturing and Industrial Defect Detection. Machines 2023, 11, 677. [Google Scholar] [CrossRef]
- Wang, C.-Y.; Yeh, I.H.; Mark Liao, H.Y. YOLOv9: Learning What You Want to Learn Using Programmable Gradient Information. arXiv 2024, arXiv:2402.13616. [Google Scholar]
- Girshick, R. Fast R-CNN. In Proceedings of the IEEE International Conference on Computer Vision, Santiago, Chile, 7–13 December 2015; pp. 1440–1448. [Google Scholar]
- He, K.; Gkioxari, G.; Doll’ar, P.; Girshick, R. Mask R-CNN. In Proceedings of the IEEE International Conference on Computer Vision, Venice, Italy, 22–29 October 2017; pp. 2961–2969. [Google Scholar]
- Simonyan, K.; Zisserman, A. Very deep convolutional networks for large-scale image recognition. arXiv 2014, arXiv:1409.1556. [Google Scholar]
- Huang, G.; Liu, Z.; Van Der Maaten, L.; Weinberger, K.Q. Densely connected convolutional networks. In Proceedings of the IEEE Conference on Computer Vision and Pattern Recognition, Honolulu, HI, USA, 21–26 July 2017; pp. 4700–4708. [Google Scholar]
- Howard, A.G. Mobilenets: Efficient convolutional neural networks for mobile vision applications. arXiv 2017, arXiv:1704.04861. [Google Scholar]
- He, K.; Zhang, X.; Ren, S.; Sun, J. Deep residual learning for image recognition. In Proceedings of the IEEE Conference on Computer Vision and Pattern Recognition, Las Vegas, NV, USA, 27–30 June 2016; pp. 770–778. [Google Scholar]
- Available online: https://shorturl.at/bShHi (accessed on 7 October 2024).
- YOLOV8 Running Instance. Available online: https://shorturl.at/hmrzF (accessed on 7 October 2024).
- Pachylobus edulis G.Don. Gen. Hist. 1832, 18, 89. Available online: https://powo.science.kew.org/taxon/urn:lsid:ipni.org:names:128214-1 (accessed on 7 October 2024).
- Chu, P.; Li, Z.; Lammers, K.; Lu, R.; Liu, X. Deep learning-based apple detection using a suppression mask R-CNN. Pattern Recognit. Lett. 2021, 147, 206–211. [Google Scholar] [CrossRef]
- Asriny, D.M.; Rani, S.; Hidayatullah, A.F. Orange fruit images classification using convolutional neural networks. IOP Conf. Ser. Mater. Sci. Eng. 2020, 803, 012020. [Google Scholar] [CrossRef]
- Lamb, N.; Chuah, M.C. A strawberry detection system using convolutional neural networks. In Proceedings of the 2018 IEEE International Conference on Big Data (Big Data), Seattle, WA, USA, 10–13 December 2018; pp. 2515–2520. [Google Scholar]
- Nithya, R.; Santhi, B.; Manikandan, R.; Rahimi, M.; Gandomi, A.H. Computer vision system for mango fruit defect detection using deep convolutional neural network. Foods 2022, 11, 3483. [Google Scholar] [CrossRef]
- Khan, A.I.; Quadri, S.M.K.; Banday, S.; Shah, J.L. Deep diagnosis: A real-time apple leaf disease detection system based on deep learning. Comput. Electron. Agric. 2022, 198, 107093. [Google Scholar] [CrossRef]
- Liu, X.; Li, G.; Chen, W.; Liu, B.; Chen, M.; Lu, S. Detection of dense Citrus fruits by combining coordinated attention and cross-scale connection with weighted feature fusion. Appl. Sci. 2022, 12, 6600. [Google Scholar] [CrossRef]
- Kusrini, K.; Suputa, S.; Setyanto, A.; Agastya, I.M.A.; Priantoro, H.; Pariyasto, S. A comparative study of mango fruit pest and disease recognition. TELKOMNIKA (Telecommun. Comput. Electron. Control) 2022, 20, 1264–1275. [Google Scholar] [CrossRef]
- Čakić, S.; Popović, T.; Krčo, S.; Nedić, D.; Babić, D. Developing object detection models for camera applications in smart poultry farms. In Proceedings of the 2022 IEEE International Conference on Omni-layer Intelligent Systems (COINS), Barcelona, Spain, 1–3 August 2022; pp. 1–5. [Google Scholar]
- Yumang, A.N.; Samilin, C.J.N.; Sinlao, J.C.P. Detection of Anthracnose on Mango Tree Leaf Using Convolutional Neural Network. In Proceedings of the 2023 15th International Conference on Computer and Automation Engineering (ICCAE), Sydney, Australia, 3–5 March 2023; pp. 220–224. [Google Scholar]
- Palakodati, S.S.S.; Chirra, V.R.R.; Yakobu, D.; Bulla, S. Fresh and Rotten Fruits Classification Using CNN and Transfer Learning. Rev. D’Intell. Artif. 2020, 34, 617–622. [Google Scholar] [CrossRef]
- Szegedy, C.; Vanhoucke, V.; Ioffe, S.; Shlens, J.; Wojna, Z. Rethinking the inception architecture for computer vision. In Proceedings of the IEEE Conference on Computer Vision and Pattern Recognition, Las Vegas, NV, USA, 27–30 June 2016; pp. 2818–2826. [Google Scholar]
- Redmon, J.; Divvala, S.; Girshick, R.; Farhadi, A. You only look once: Unified, real-time object detection. In Proceedings of the IEEE Conference on Computer Vision and Pattern Recognition, Las Vegas, NV, USA, 27–30 June 2016; pp. 779–788. [Google Scholar]
- Ren, S.; He, K.; Girshick, R.; Sun, J. Faster r-cnn: Towards real-time object detection with region proposal networks. In Proceedings of the 28th International Conference on Neural Information Processing Systems, Montreal, ON, Canada, 7–12 December 2015. [Google Scholar]
- Zhu, L.; Geng, X.; Li, Z.; Liu, C. Improving YOLOv5 with attention mechanism for detecting boulders from planetary images. Remote Sens. 2021, 13, 3776. [Google Scholar] [CrossRef]
- Lin, Q.; Ye, G.; Wang, J.; Liu, H. RoboFlow: A data-centric workflow management system for developing AI-enhanced Robots. Conf. Robot. Learn. 2022, 164, 1789–1794. [Google Scholar]
Disclaimer/Publisher’s Note: The statements, opinions and data contained in all publications are solely those of the individual author(s) and contributor(s) and not of MDPI and/or the editor(s). MDPI and/or the editor(s) disclaim responsibility for any injury to people or property resulting from any ideas, methods, instructions or products referred to in the content. |
© 2024 by the authors. Licensee MDPI, Basel, Switzerland. This article is an open access article distributed under the terms and conditions of the Creative Commons Attribution (CC BY) license (https://creativecommons.org/licenses/by/4.0/).