Article

Interactive Segmentation for Medical Images Using Spatial Modeling Mamba

1
School of Electronic and Electrical Engineering, Wuhan Textile University, Wuhan 430077, China
2
School of Computer Science, Wuhan University, Wuhan 430072, China
3
School of Information Engineering, Tarim University, Alaer 843300, China
*
Author to whom correspondence should be addressed.
Information 2024, 15(10), 633; https://doi.org/10.3390/info15100633
Submission received: 9 September 2024 / Revised: 8 October 2024 / Accepted: 9 October 2024 / Published: 14 October 2024
(This article belongs to the Special Issue Applications of Deep Learning in Bioinformatics and Image Processing)

Abstract

:
Interactive segmentation methods utilize user-provided positive and negative clicks to guide the model in accurately segmenting target objects. Compared to fully automatic medical image segmentation, these methods can achieve higher segmentation accuracy with limited image data, demonstrating significant potential in clinical applications. Typically, for each new click provided by the user, conventional interactive segmentation methods reprocess the entire network by re-inputting the click into the segmentation model, which greatly increases the user’s interaction burden and deviates from the intended goal of interactive segmentation tasks. To address this issue, we propose an efficient segmentation network, ESM-Net, for interactive medical image segmentation. It obtains high-quality segmentation masks based on the user’s initial clicks, reducing the complexity of subsequent refinement steps. Recent studies have demonstrated the strong performance of the Mamba model in various vision tasks; however, its application in interactive segmentation remains unexplored. In our study, we incorporate the Mamba module into our framework for the first time and enhance its spatial representation capabilities by developing a Spatial Augmented Convolution (SAC) module. These components are combined as the fundamental building blocks of our network. Furthermore, we designed a novel and efficient segmentation head to fuse multi-scale features extracted from the encoder, optimizing the generation of the predicted segmentation masks. Through comprehensive experiments, our method achieved state-of-the-art performance on three medical image datasets. Specifically, we achieved 1.43 NoC@90 on the Kvasir-SEG dataset, 1.57 NoC@90 on the CVC-ClinicDB polyp segmentation dataset, and 1.03 NoC@90 on the ADAM retinal disk segmentation dataset. The assessments on these three medical image datasets highlight the effectiveness of our approach in interactive medical image segmentation.

Graphical Abstract

1. Introduction

Precise and reliable segmentation of organs or lesions from medical imaging data (such as CT and MRI) is essential for a wide range of clinical applications. Despite significant advancements in deep learning-based automatic segmentation methods [1,2] over the years, including the success of U-Net [3,4] and Transformer-based approaches [5,6], achieving consistent and accurate segmentation in complex pathological conditions remains challenging for clinical applications. These challenges primarily arise from the inherent characteristics of medical images, including poor image quality, variations in imaging modalities, and inter-patient differences, which make segmentation more difficult. In contrast, interactive segmentation methods [7], which leverage users’ expertise and experience to obtain more accurate segmentation results, are more practical in clinical applications. Interactive segmentation allows additional user prompts (such as bounding boxes [8,9,10], scribbles [11,12,13], and clicks [14,15,16,17]) to effectively segment target objects in images. Among these, click-based methods are the most widely used due to their simplicity and well-established training and evaluation protocols. In this study, we use widely adopted click-based interactions to guide the network segmentation process, with positive clicks in the foreground region and negative clicks in the background region.
Although interactive segmentation typically results in better segmentation quality, the optimal interactive segmentation method should satisfy the following criteria: (1) achieve precise segmentation with minimal user interaction to reduce the user’s burden; (2) be highly efficient to provide real-time responses when processing data; and (3) adapt well to various objects and imaging techniques. However, current interactive segmentation methods struggle to simultaneously meet all these competing requirements.
Recent advances in click-based interactive methods focus on two orthogonal directions: (1) developing more efficient backbone networks and (2) exploring refinement modules built on top of the backbones. For the former, various hierarchical backbones have been developed. For instance, FocusCut [18] and RITM [17] use ConvNets as the foundational segmentation network; iSegformer [19] proposes a segmentation network combining Swin Transformer and a lightweight multilayer perceptron (MLP); and SimpleClick [20] uses ViT with a simple feature pyramid as the backbone for interactive segmentation. Compared to traditional methods, these approaches often rely on large backbones to achieve satisfactory segmentation results, increasing the training complexity of the model parameters. To further enhance segmentation performance, a number of refinement modules have been proposed, such as click refinement [18,21] and click imitation [22]. Addressing the efficiency of refinement modules, EMC-Click [23] proposes an effective method using a lightweight mask correction network, but it still relies on a large backbone network, failing to consider the model’s overall performance. In this research, we explore the first direction, designing an efficient backbone network based on a general pipeline for interactive segmentation methods to better meet practical application needs.
Transformers are excellent at capturing long-term relationships, but they have drawbacks for high-resolution biomedical images due to the high computational cost associated with the quadratic scaling of the self-attention mechanism with input size. Conversely, Mamba [24], derived from State Space Models (SSMs) [25], scales with sequence length in a linear or nearly linear manner while maintaining the ability to represent long-range dependencies. They improve the efficiency of training and inference by using hardware-aware algorithms and selection mechanisms, providing a promising solution for efficiently handling long sequences in medical image segmentation. Recent studies have explored the application of Mamba in computer vision (CV). For instance, Vision Mamba [26] proposed a general-purpose visual backbone with bidirectional Mamba blocks, which performed well across various vision tasks. In contrast, VMamba [27] developed a Mamba-based visual backbone with hierarchical representations and introduced a cross-scan module to address direction sensitivity issues arising from the differences between 1D sequences and 2D images. Task-specific architectures using Mamba blocks based on nnUNet [28] and Swin-UNETR [29] are proposed by U-Mamba [30] and SegMamba [31], respectively. These models have achieved notable success in vision tasks, further supporting Mamba’s superior performance as a viable alternative to Transformers in visual modeling. However, the potential application of Mamba-based backbone networks for interactive segmentation has not yet been explored. Therefore, our work investigates the segmentation performance of Mamba models with feature inputs fused from clicks and images.
Our main contributions can be summarized as follows:
  • We propose ESM-Click, the first interactive medical image segmentation method using the Mamba-based backbone network ESM-Net. Our method reduces the computational cost of the segmentation network while maintaining high-quality segmentation results.
  • We design a Spatial Feature Enhancement Convolution (SAC) module to enhance the spatial expression ability of fused features from 2D image information and interaction information, using a gating mechanism to learn dynamic feature selection for each channel and spatial position.
  • We construct a multi-scale feature-fusion module as part of the segmentation head, combining the advantages of KAN in nonlinear modeling ability and interpretability to improve the model’s segmentation accuracy.
  • Comprehensive evaluations on three medical image datasets demonstrate that our ESM-Click exhibits good robustness, paving the way for Mamba’s application in interactive segmentation.

2. Related Work

2.1. Interactive Image Segmentation

Interactive segmentation (IS) is a highly active research area focusing on the dynamic interaction between humans and machines. Traditional interactive segmentation methods [10,12,32,33] employ graphs defined on image pixels to address segmentation challenges. However, these approaches rely solely on low-level features, rendering them inadequate for handling complex environments. Given the success of ConvNets in extracting robust image features, several methods have adopted successful backbone networks to enhance segmentation outcomes. The first deep learning approach to interactive segmentation was presented by DIOS [7], which proposed a classic sampling strategy to simulate positive and negative clicks for model training. Based on the existing erroneous prediction areas, IT IS [34] proposed a novel online iterative sampling technique that was refined in RITM [17] using less computational resources. iCMFormer [35] proposed a cross-modal Transformer that effectively utilizes click information to guide model segmentation, producing more robust results. FDRN [36] introduced a decoupled recovery strategy from three perspectives, avoiding redundant computation by preventing feature extraction from the source image in each interaction. ClickAttention [37] addressed the sparse nature of clicks by proposing a click attention mechanism to enhance the propagation of click information across feature maps. MST [38] introduced a multi-scale token adaptive algorithm to improve the segmentation of objects of varying sizes and incorporated contrastive loss to enhance robustness. In addition to global segmentation, f-BRS [16] minimizes the difference between the original image and the predicted mask for optimalization, achieving high-quality segmentation results through further refinement. FocalClick [21] and FocusCut [18] effectively improved segmentation results from the perspective of local refinement. GPCS [39] formulated IS as a Gaussian process classification model for each individual image. EMC-Click [23] designed an efficient mask-refinement network based on the backpropagation process, reducing the computational burden of multiple user interactions and thus improving the efficiency of the model. However, these methods typically rely on a large backbone segmentation network, increasing the difficulty of applying interactive segmentation in clinical applications for medical images. Therefore, we explored efficient backbone network design methods equipped with the Mamba module, which has fewer parameters and significantly speeds up the interactive process.

2.2. Visual Applications of Mamba

To address the challenges associated with long-sequence modeling, Mamba [24], which originated from state-space models (SSM) [25], was developed to handle long-range dependencies. Inspired by the Mamba model, VMamba [27] designed a CSM module to connect 1-D array scanning with 2-D plane traversal, maintaining model fitting capability at linear complexity and demonstrating excellent performance in visual tasks. U-Mamba [30] extended this approach by integrating Mamba layers into the nnUNet [28] encoder, enhancing general medical image segmentation. However, due to U-Mamba’s combination of CNN and SSM as fundamental modules and reliance on nnUNet’s pre- and post-processing capabilities, the model consumes substantial computational resources during training, making it unsuitable as a backbone network for interactive segmentation. Additionally, Vision Mamba [26] combines bidirectional SSM for data-dependent global visual context modeling and positional embedding for position-aware visual understanding. However, Vision Mamba’s design, inspired by ViT [40], segments images into patch sequences, leading to a loss of click information and a reduction in the positional awareness of image features. Our comparative experiments indicated that such structures perform poorly as backbone networks in interactive segmentation models, making them equally unsuitable for interactive segmentation methods. Building on previous explorations of the Mamba model in visual tasks, we investigated its performance in interactive image segmentation, focusing on backbone network structure and model efficiency. Additionally, we developed an efficient interactive segmentation backbone network that incorporates a spatially enhanced Mamba module.

3. Method

We propose ESM-Click to address the efficiency gap between existing methods and practical clinical applications. First, we present an overview of our general pipeline and model structure, followed by a detailed description of the proposed efficient backbone network, ESM-Net.

3.1. Overview Architecture

Our pipeline, depicted in Figure 1, includes a lightweight mask-refinement network and a primary segmentation network called ESM-Net. The overall process is as follows: the original image and user clicks are input into the primary network to generate an initial mask, which is then refined through multiple iterations of backpropagation in the refinement network to achieve satisfactory segmentation results.
Specifically, similar to FCA-Net [15], the initial clicks are used to locate the target object, and the initial segmentation result is crucial for optimizing the subsequent network. Based on the user’s first click, we input the click information into the segmentation network to generate an initial mask and extract relevant features of the target. From the second click onwards, the mask-refinement network is iteratively executed, gradually optimizing the initial mask, and ultimately producing a satisfactory prediction with a minimal number of clicks.
Unlike traditional automatic segmentation methods, interactive segmentation networks integrate the image, click map, and predicted mask to perform segmentation. The click map is typically represented as a binary disc or distance map to encode positive and negative clicks. The encoded click map is input into the segmentation network along with the image, and the user determines the next click position based on the current segmentation result.
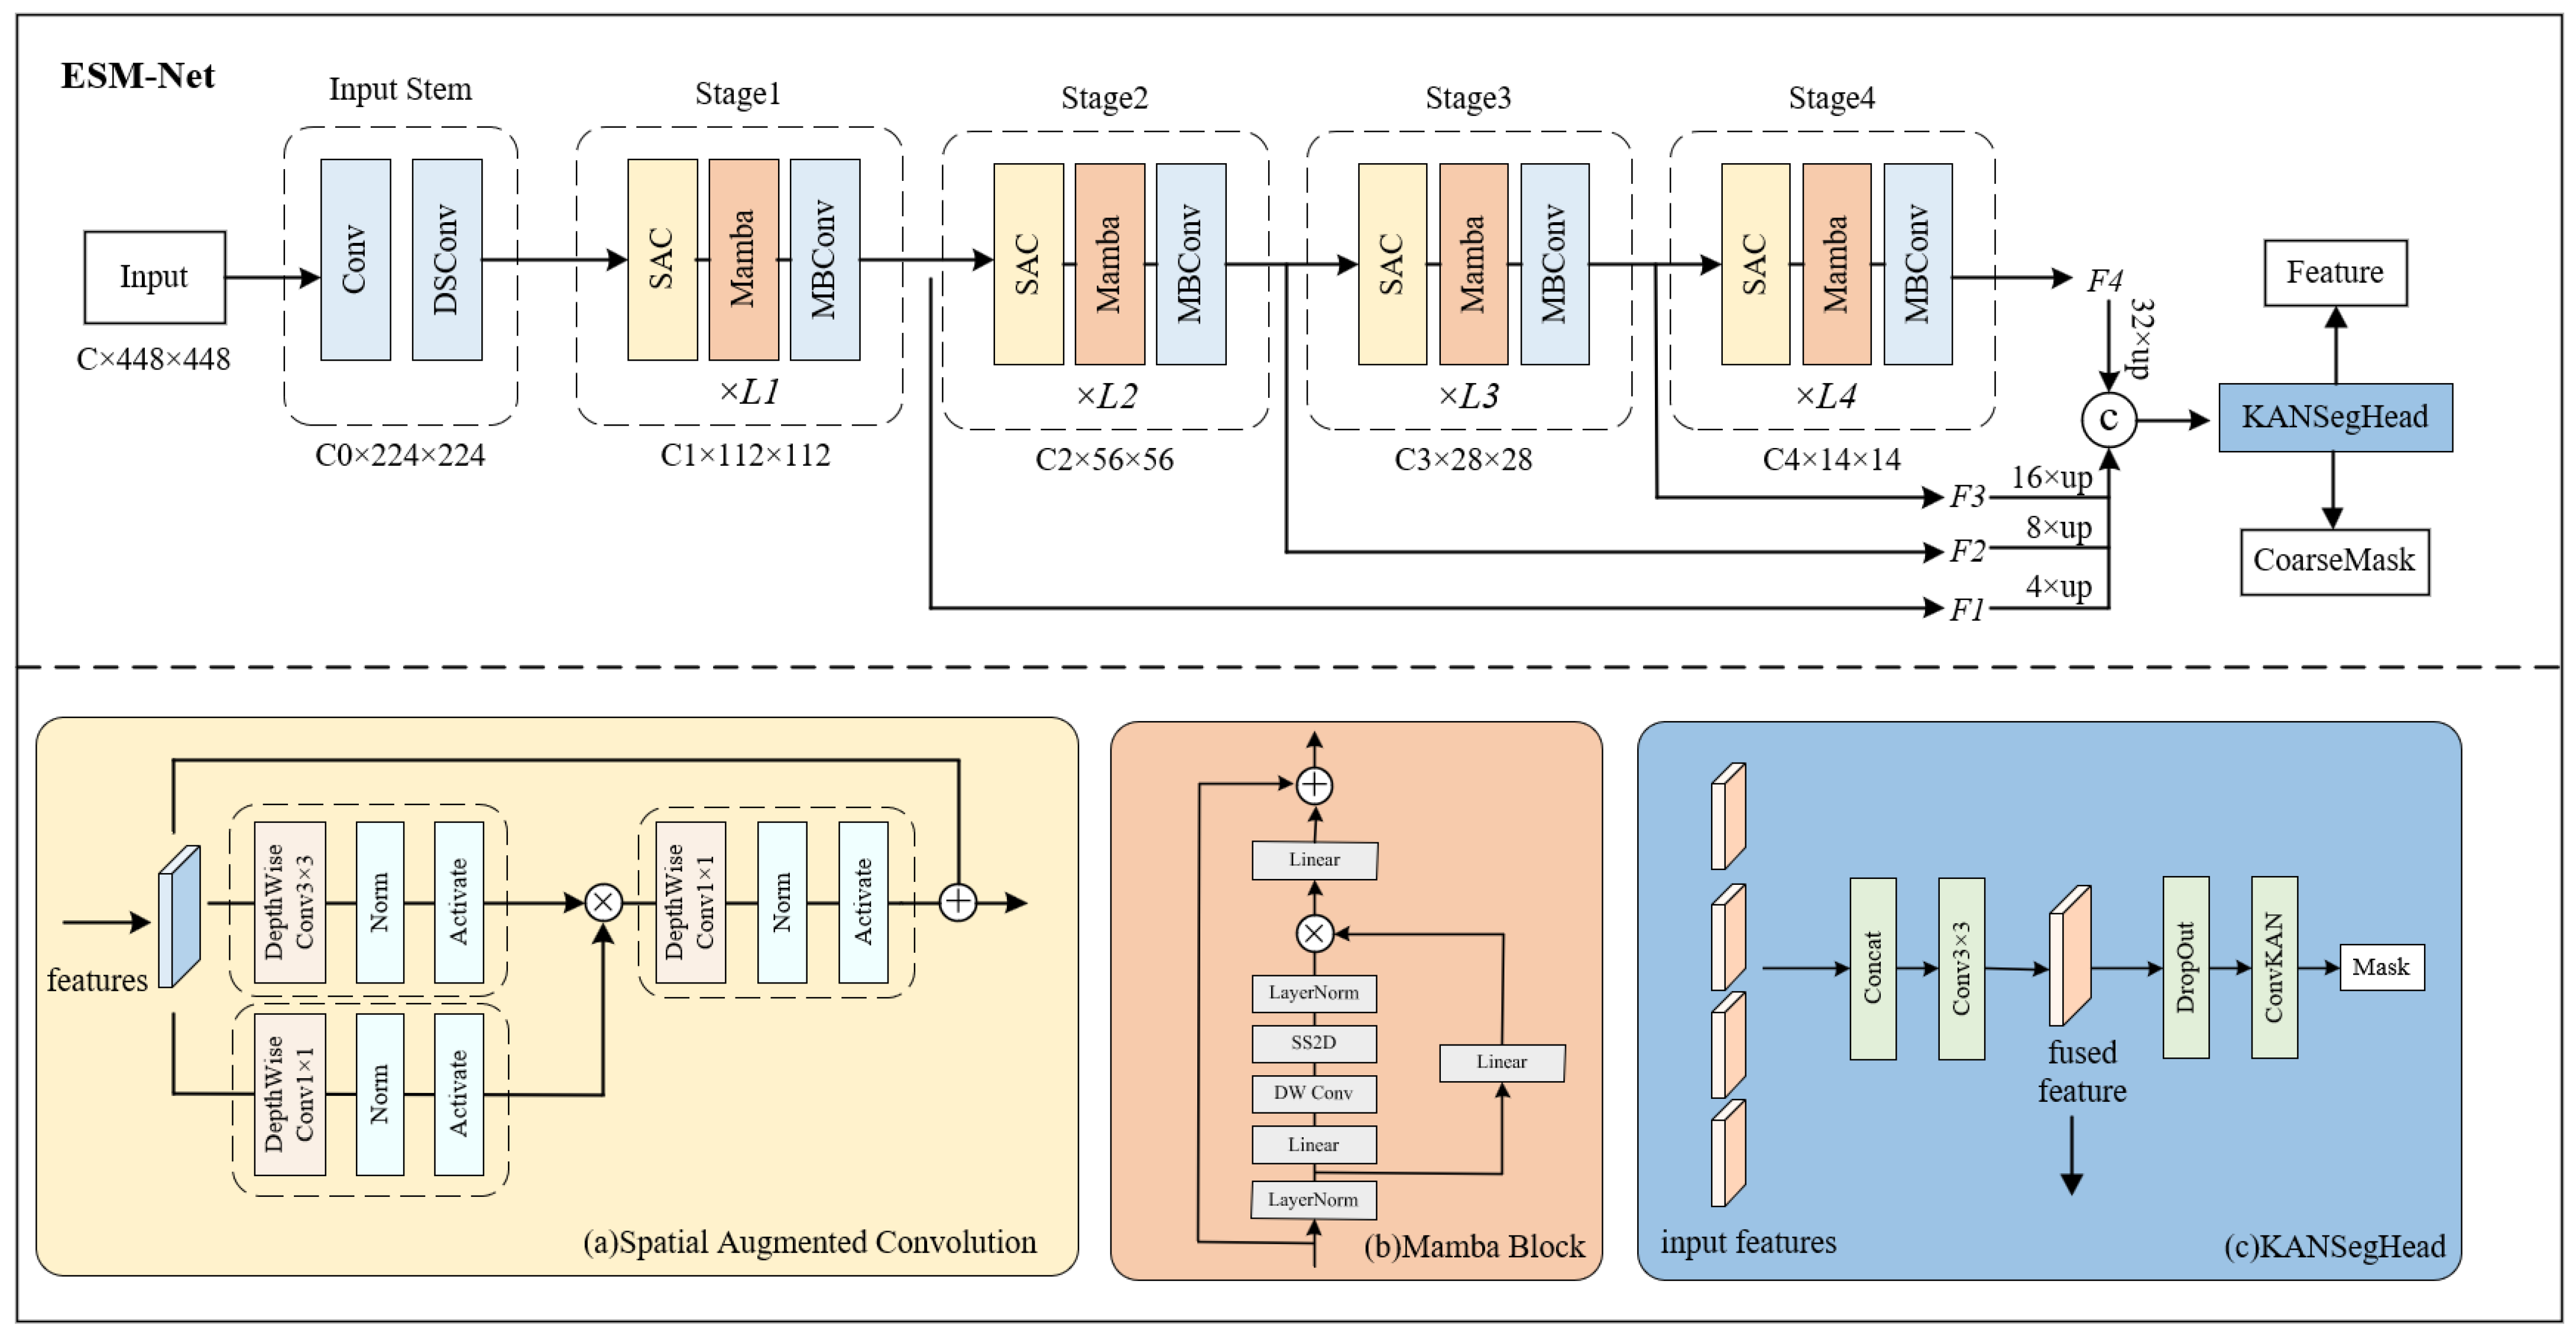
ESM-Net handles the segmentation task for the first click, utilizing a standard encoder-decoder architecture that effectively captures both local features and global contextual information. The encoder integrates spatially enhanced convolution (SAC) modules and Mamba modules, leveraging the lightweight MBConv modules from EfficientNetv2 [41] for downsampling. During upsampling, we designed a segmentation head based on KAN [42], which fuses features from four scales to generate the segmentation result. Experiments have validated the effectiveness of this segmentation head.

3.2. Proposed ESM-Net

As illustrated in Figure 2, the overall architecture of ESM-Net is introduced. Specifically, ESM-Net includes an input stem, four downsampling stages for extracting multi-scale features, an upsampling decoder, and a segmentation head for outputting the segmentation results. The detailed design and implementation of each module are described below.

3.2.1. Mamba Block

Global and multi-scale feature modeling play a decisive role in medical image segmentation. Typically, Transformers are employed for global feature extraction; however, handling excessively long feature sequences often results in computational overhead. In contrast, VMamba [27] effectively combines the advantages of CNNs and ViTs, utilizing cross-scanning modules to traverse the spatial domain, addressing the issue of image-orientation sensitivity. Additionally, Mamba’s block-sequence traversal enhances the flow of information during feature extraction, thereby improving the quality of visual representations, which results in outstanding performance in image segmentation tasks. Given that medical images inherently suffer from noise, distortion, and quality issues, simply converting images into block sequences using methods like ViT often results in further loss of detail. The superior performance of Mamba over Transformers in medical image segmentation raises expectations for its application in interactive medical image segmentation. Moreover, Transformer-based networks rely on attention mechanisms to achieve better contextual understanding. However, the downside is the large computational cost, which increases quadratically with the output size. In contrast, Mamba offers faster inference speed, enabling computational costs to scale linearly or near-linearly with sequence length. This characteristic makes it well-suited for building efficient segmentation networks based on Mamba, addressing the prediction time limitations of interactive segmentation methods. Additionally, the Mamba model employs a hardware-aware algorithm that fully leverages the memory hierarchy of GPUs, enhancing computation speed. This algorithm combines the recursive computational efficiency of RNNs with the parallel processing advantages of CNNs, resulting in significantly higher efficiency when handling long sequence data. While CNNs offer faster processing speeds, they have limitations when dealing with complex structures and patterns, where Mamba excels.
Leveraging the aforementioned advantages, we employ the Mamba module for global feature extraction, ensuring high efficiency in both training and inference phases. Our core Mamba module is derived from the VMamba, as illustrated in Figure 2b. Initially, the input undergoes dimensional transformation, converting 2D features into feature sequences. Following layer normalization, the sequences are split into two paths: one path passes through a linear embedding layer followed by SiLU activation, while the other path passes through linear layers, separable convolutions, and activation functions. The 2D-Selective-Scan module is then used to further extract features, and the results of the two branches are multiplied element-wise to obtain the merged features. Finally, residual connections are used to add the input and output, yielding the output of the Mamba module. The computational process at each stage can be defined as:
F ^ n l = S A C ( F n l ) ,   F ˜ n l = M a m b a ( L N ( F ^ n l ) ) + F ^ n l ,
where SAC denotes the proposed Spatial Augmented Convolution module, which will be discussed in the following sections. LN represents layer normalization.

3.2.2. Spatial Augmented Convolution (SAC) Module

The Mamba module compresses 2D features into a feature sequence to model feature dependencies, which can lead to deficiencies in spatial relationship representation. To address this issue and enhance the spatial representation of features prior to the Mamba layer, we designed a Spatially Augmented Convolution module (SAC), which incorporates a gating-like mechanism and uses depth-wise separable convolution blocks with varying kernel depths as its core components.
Gating mechanisms are typically used in Recurrent Neural Network [43] (RNN) units to process sequential data, which aligns with the feature sequences in our Mamba module. By introducing a gating mechanism to control the flow of information, it enhances the memory and representation capabilities of the model. During training, the network adjusts the parameters of its gating mechanism based on the relationship between the input data and target labels. This allows the model to selectively retain and transmit important information while filtering out irrelevant or redundant data. We implement the gating mechanism using clicks and nonlinear activation functions, enabling the network to flexibly filter and process information, thereby improving the overall task performance.
As illustrated in Figure 2a, the input 2D features are fed into two composite convolution modules with kernel sizes of 1 × 1 and 3 × 3. These are followed by standard BatchNormalization layers and hswish activation functions. The features from the two paths are then multiplied pixel-wise to control information transmission akin to a gating mechanism. The collaborative operation of these two paths effectively regulates feature updates, thereby capturing the spatial dependencies of the data. A final composite convolution block further integrates the features, leveraging residual features to reuse input features and enhance the overall feature representation. The entire computational process can be formulated as:
S A C ( y ) = y + C 3 × 3 ( C 3 × 3 C 1 × 1 ( y ) ) ,
where y denotes the input 2D features, C represents the depth-wise separable convolution, and the superscripts indicate the respective convolution kernel parameters. The activation functions and normalization layers have been omitted for brevity.

3.2.3. KANSegHead

Kolmogorov–Arnold Networks [42] (KAN) represent an innovative shift in neural network design, challenging traditional concepts such as the Multilayer Perceptron (MLP). The core of KAN is rooted in an elegant and abstract mathematical theorem by Kolmogorov and Arnold. This theorem states that any multivariate continuous function can be represented as a nested superposition of univariate continuous functions. By adapting the Kolmogorov–Arnold theorem, KAN employs learnable univariate functions and additive operations instead of adjusting the weights and biases of linear combinations for each node input, thus transforming this theorem into a neural network architecture. In KANs, each weight is essentially a small function. Unlike traditional nodes that apply fixed nonlinear activation functions, each learnable activation function in KAN edges processes inputs and produces outputs.
KAN convolutions are similar to traditional convolutions, but instead of applying dot products between corresponding pixels in the kernel and image, they apply learnable nonlinear activation functions to each element before summing them. The KAN convolution kernel is equivalent to a KAN linear layer with four inputs and one output neuron. Compared to traditional convolution methods, KAN convolution layers reduce the number of parameters by almost half while maintaining comparable accuracy, making them suitable for our network.
In our work, we implement a lightweight segmentation head, KANSegHead, using efficient and expressive convolution layers based on KAN theory, as illustrated in Figure 2c. Initially, our segmentation head receives image features at four different scales, modifies the channel numbers and dimensions through convolution operations, and concatenates all feature maps for integration. After a dropout process to prevent over-reliance on local features, the final segmentation result is produced using KAN convolution. The computational process of the entire segmentation head can be described as:
F = C o n v ( C o n c a t ( U p ( X i , ( H 0 , W 0 ) ) ) ) , i = 1 , 2 , 3 , 4 ,
S = C o n v K A N ( F , W k a n , b k a n ) ,
where U p represents the upsampling process, H 0 and W 0 denotes the features at unified spatial dimensions, and W k a n and b k a n denotes the convolution kernel and bias parameters. In this formula, we describe the process of integrating the four received scales, followed by our ConvKAN layer to output the segmentation results. Our lightweight segmentation head effectively utilizes multi-scale features from the backbone network and completes an efficient segmentation process.

3.3. Loss Function

In the overall model architecture, we supervise the coarse segmentation network using Normalized Focal Loss [44] L n f l and Sigmoid Binary Cross-Entropy loss L s B C E . Previous studies have demonstrated that NFL converges faster and outperforms the widely used binary cross-entropy in interactive segmentation tasks. Similar training pipelines have been proposed by RITM [17] and subsequent works [21]. For the mask-refinement part, we follow the FocalClick [21] method by adding a boundary weight of 1.5 to the NFL loss, denoted as L b n f l . The total training loss can be expressed by the following Equation (5):
L = L n f l + L s B C E + L b n f l ,
where L n f l , L s B C E , and L b n f l represent the Normalized Focal Loss, Binary Cross-Entropy loss, and Boundary Normalized Focal Loss, respectively. The entire model, encompassing both stages, is trained in a unified end-to-end framework.

4. Experiments

4.1. Datasets

We evaluated our model on three challenging medical image segmentation datasets: Kvasir-SEG [45], CVC-ClinicDB [46], and ADAM [47].
  • Kvasir-SEG [45] is a dataset for pixel-level colon polyp segmentation, containing 1000 gastrointestinal polyp images and their corresponding masks, all annotated and verified by experienced gastroenterologists. Following the official dataset split, we selected 800 images for the training set, 100 images for the validation set, and 100 images for the test set.
  • CVC-ClinicDB [46] is the official dataset for the MICCAI 2015 sub-challenge on automatic polyp detection in colonoscopy videos, consisting of 612 static images extracted from colonoscopy video sequences from 29 different series. Out of these, 489 images were used for training, 61 images for validation, and 61 images for testing.
  • ADAM [47] was introduced at the ISBI 2020 satellite event, aimed at improving diagnostic capabilities for Age-related Macular Degeneration (AMD). The primary task of ADAM-Task2 is the detection and segmentation of the optic disc in retinal images. The ADAM dataset includes 381 retinal images and their corresponding masks. Consistent with the splits of the previous datasets, 304 images were used for training, 38 for validation, and 38 for testing.
For all three medical image segmentation datasets, we followed an 8:1:1 split ratio for the training, validation, and test sets. All images were resized to 448 × 448 pixels for input into the model.

4.2. Evaluation Metrics

We employed standard metrics commonly used in interactive segmentation to ensure fair comparison. During evaluation, clicks are simulated based on the discrepancies between the previous predicted mask and the ground truth. The first click is positioned at the center of the target, while subsequent clicks are placed at the center of the largest error region. We used the Number of Clicks (NoC) as an evaluation metric to determine the number of clicks needed to reach the target Intersection over Union (IoU). We established two target IoU thresholds: 85% and 90%, denoted as NoC%85 and NoC%90, respectively.
I oU = T P T P + F P + F N ,
D i c e = 2 × T P 2 × T P + F P + F N ,
In the above formulas, TP (True Positive) represents the number of pixels predicted as positive that are also labeled as positive, FP (False Positive) refers to the number of pixels predicted as positive but labeled as negative, and FN (False Negative) indicates the number of pixels predicted as negative but labeled as positive. The Dice coefficient is used to measure the similarity between images, while IoU (Intersection over Union) represents the ratio of the overlap between the prediction and the target label. Both metrics range from 0 to 1, with values closer to 1 indicating a higher degree of similarity between the predicted results and the ground truth labels.
Additionally, to validate the effectiveness of our model, we used the average IoU and average Dice corresponding to the first click as evaluation metrics to consistently measure the segmentation quality of a single segmentation. Our goal is to achieve higher Dice and IoU scores with the first-click-guided segmentation to ensure better subsequent click-segmentation performance, ultimately achieving better segmentation quality with fewer clicks.

4.3. Implementation Details

For all datasets, we trained the model for 200 epochs with an initial learning rate of 5 × 10⁻⁴, which was decayed tenfold at the 170th and 190th epochs. The network was trained using images of size 448 × 448 with a batch size of 16. Similar to EMC-Click, we employed image-augmentation techniques such as random resizing within the range of [0.75, 1.40], horizontal flipping, and random adjustments to brightness, contrast, and RGB values. Our models were developed using Python 3.8 and the PyTorch 1.10 [48] framework.

4.4. Comparison with State-of-Art Methods

4.4.1. Computational Analysis

The objective of ESM-Click is to propose a lightweight backbone segmentation network. For the backbone network, maintaining segmentation quality while ensuring efficiency is a critical factor. Table 1 presents a detailed analysis and comparison of model parameters and FLOPs. We categorized the models into four prototypes based on their backbones following the methods of previous works. For a fair comparison, we used the same benchmarks and the same computing environment (NVIDIA RTX 3090, Intel Xeon E5-2678 v3). All models were evaluated using images with a resolution of 448 × 448 pixels to calculate the aforementioned metrics.
In Table 1, we observe that most existing works employ larger base models as the backbone network for interactive segmentation, resulting in high parameter counts and prolonged training times. Compared to these prevalent networks, including purely CNN-based networks such as HRNet, our approach demonstrates significantly lower FLOPs and parameter counts. Additionally, due to our lightweight backbone and mask-refinement networks, our entire network exhibits substantial computational cost advantages. We also calculated the inference time per click, SPC (seconds per click), for different networks during the inference process. Since the number of images in the test set is fixed and the maximum number of clicks for each network is the same, we used the total inference time of the model to compute the time consumed per click, reflecting the real-time performance of the models during testing. As shown in Table 1, ESM-Net requires less inference time, making it suitable for practical applications. Additionally, thanks to the lightweight backbone network and mask-refinement network, our entire network exhibits significant computational cost advantages. The results demonstrate that methods based on the Mamba model outperform Transformer and CNN-based models in terms of computational efficiency and inference time.

4.4.2. Performance Comparison

  • Comparison of the Performance of Different Interactive Segmentation Models
Table 2 presents a comparison of our method with existing interactive segmentation approaches. To ensure a fair comparison, all methods were trained under identical settings. In contrast to state-of-the-art methods such as CDNet [49], RITM [17], FocalClick [21], SimpleClick [20], AdaptiveClick [50], and EMC-Click [23], our method demonstrates superior performance and higher segmentation quality. Notably, our approach requires fewer user clicks to achieve accurate segmentation.
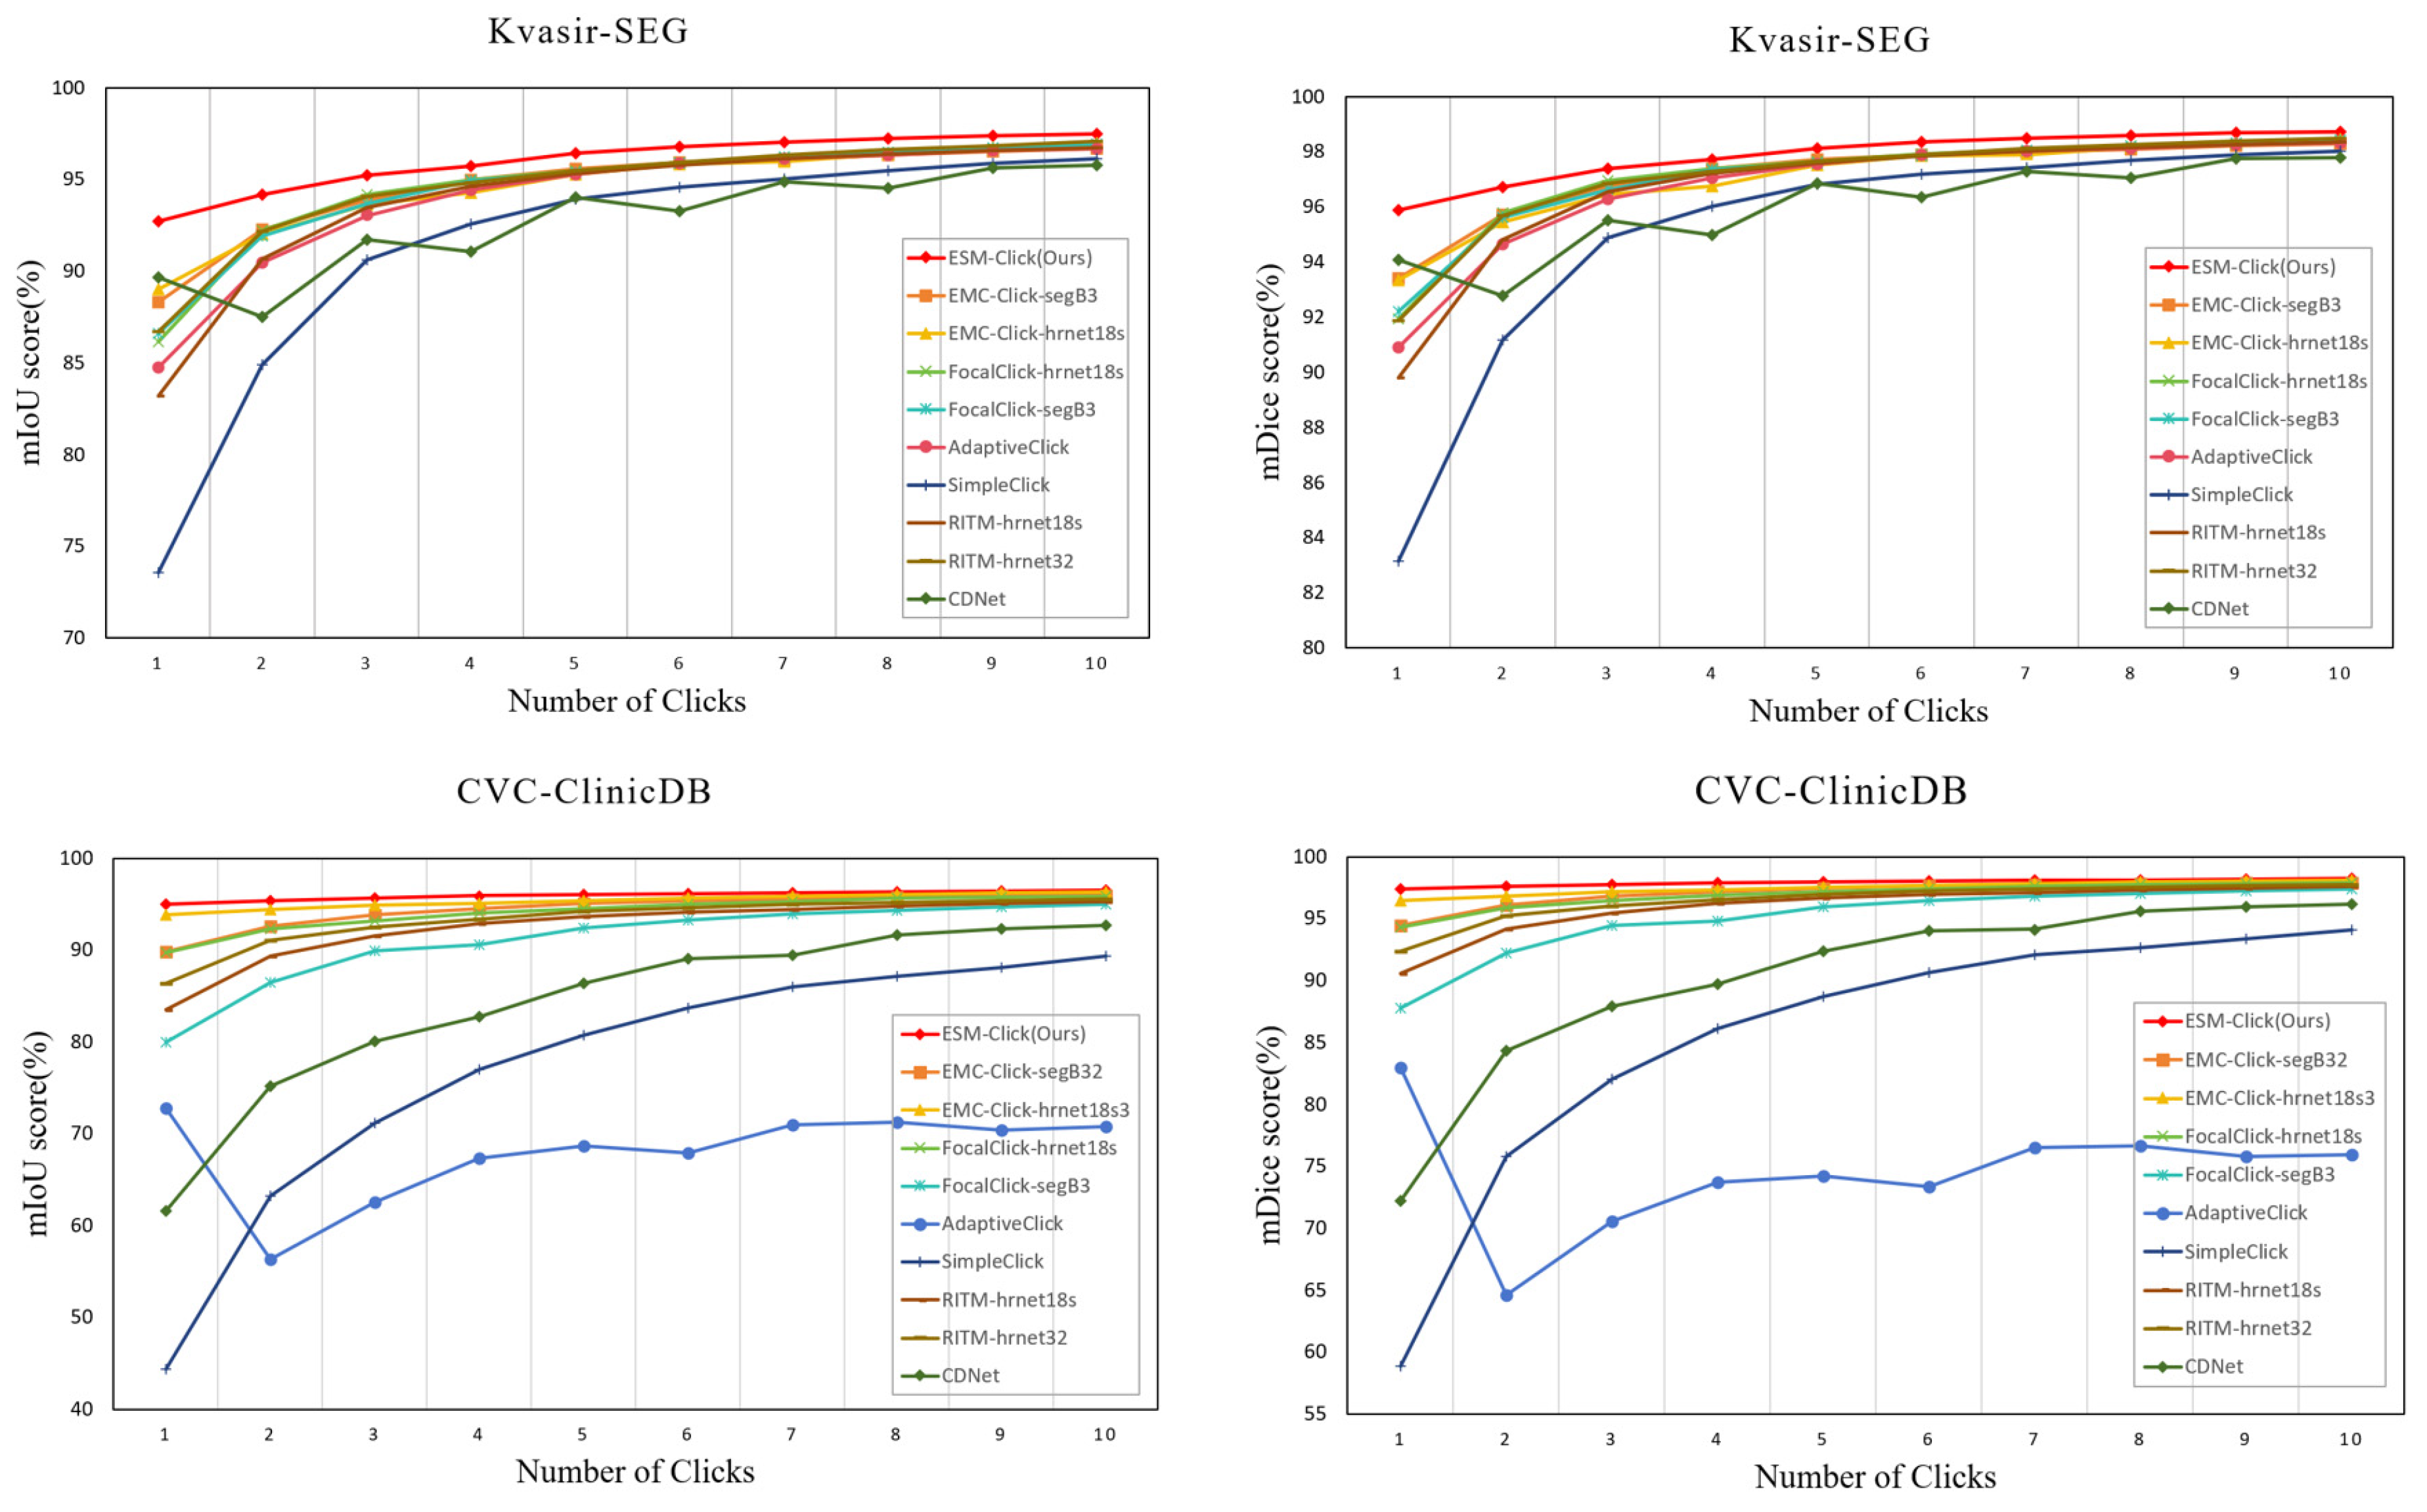
In Figure 3, we display the refinement results of different methods after each click, evaluating the segmentation quality using mIoU and mDice scores. It is evident that ESM-Click consistently achieves higher segmentation accuracy during the refinement process after each click. By leveraging the ESM-Net backbone network, our method accurately identifies the segmentation target with the first click and progressively improves precision with subsequent clicks. In contrast, models based on ViT backbones, such as SimpleClick and AdaptiveClick, perform less effectively on these datasets. Interactive segmentation methods based on HRNet [51] and Segformer [52], such as RITM, FocalClick, and EMC-Click, also perform less effectively compared with our approach. Our method not only ensures precise target segmentation but also minimizes the number of clicks required to reach a certain segmentation quality, aligning with the objectives of our interactive segmentation methodology.
2.
Improvement with a Single Interaction Click
To further evaluate the effectiveness of our method, we compared the average IoU and Dice scores achieved after the first click, as shown in Table 3. The first click, primarily processed by the backbone network, is crucial for locating the segmentation target. Compared to other methods, our model produces higher-quality masks after the first click. This initial high-quality mask ensures that subsequent mask refinements yield better results.

4.5. Qualitative Analysis

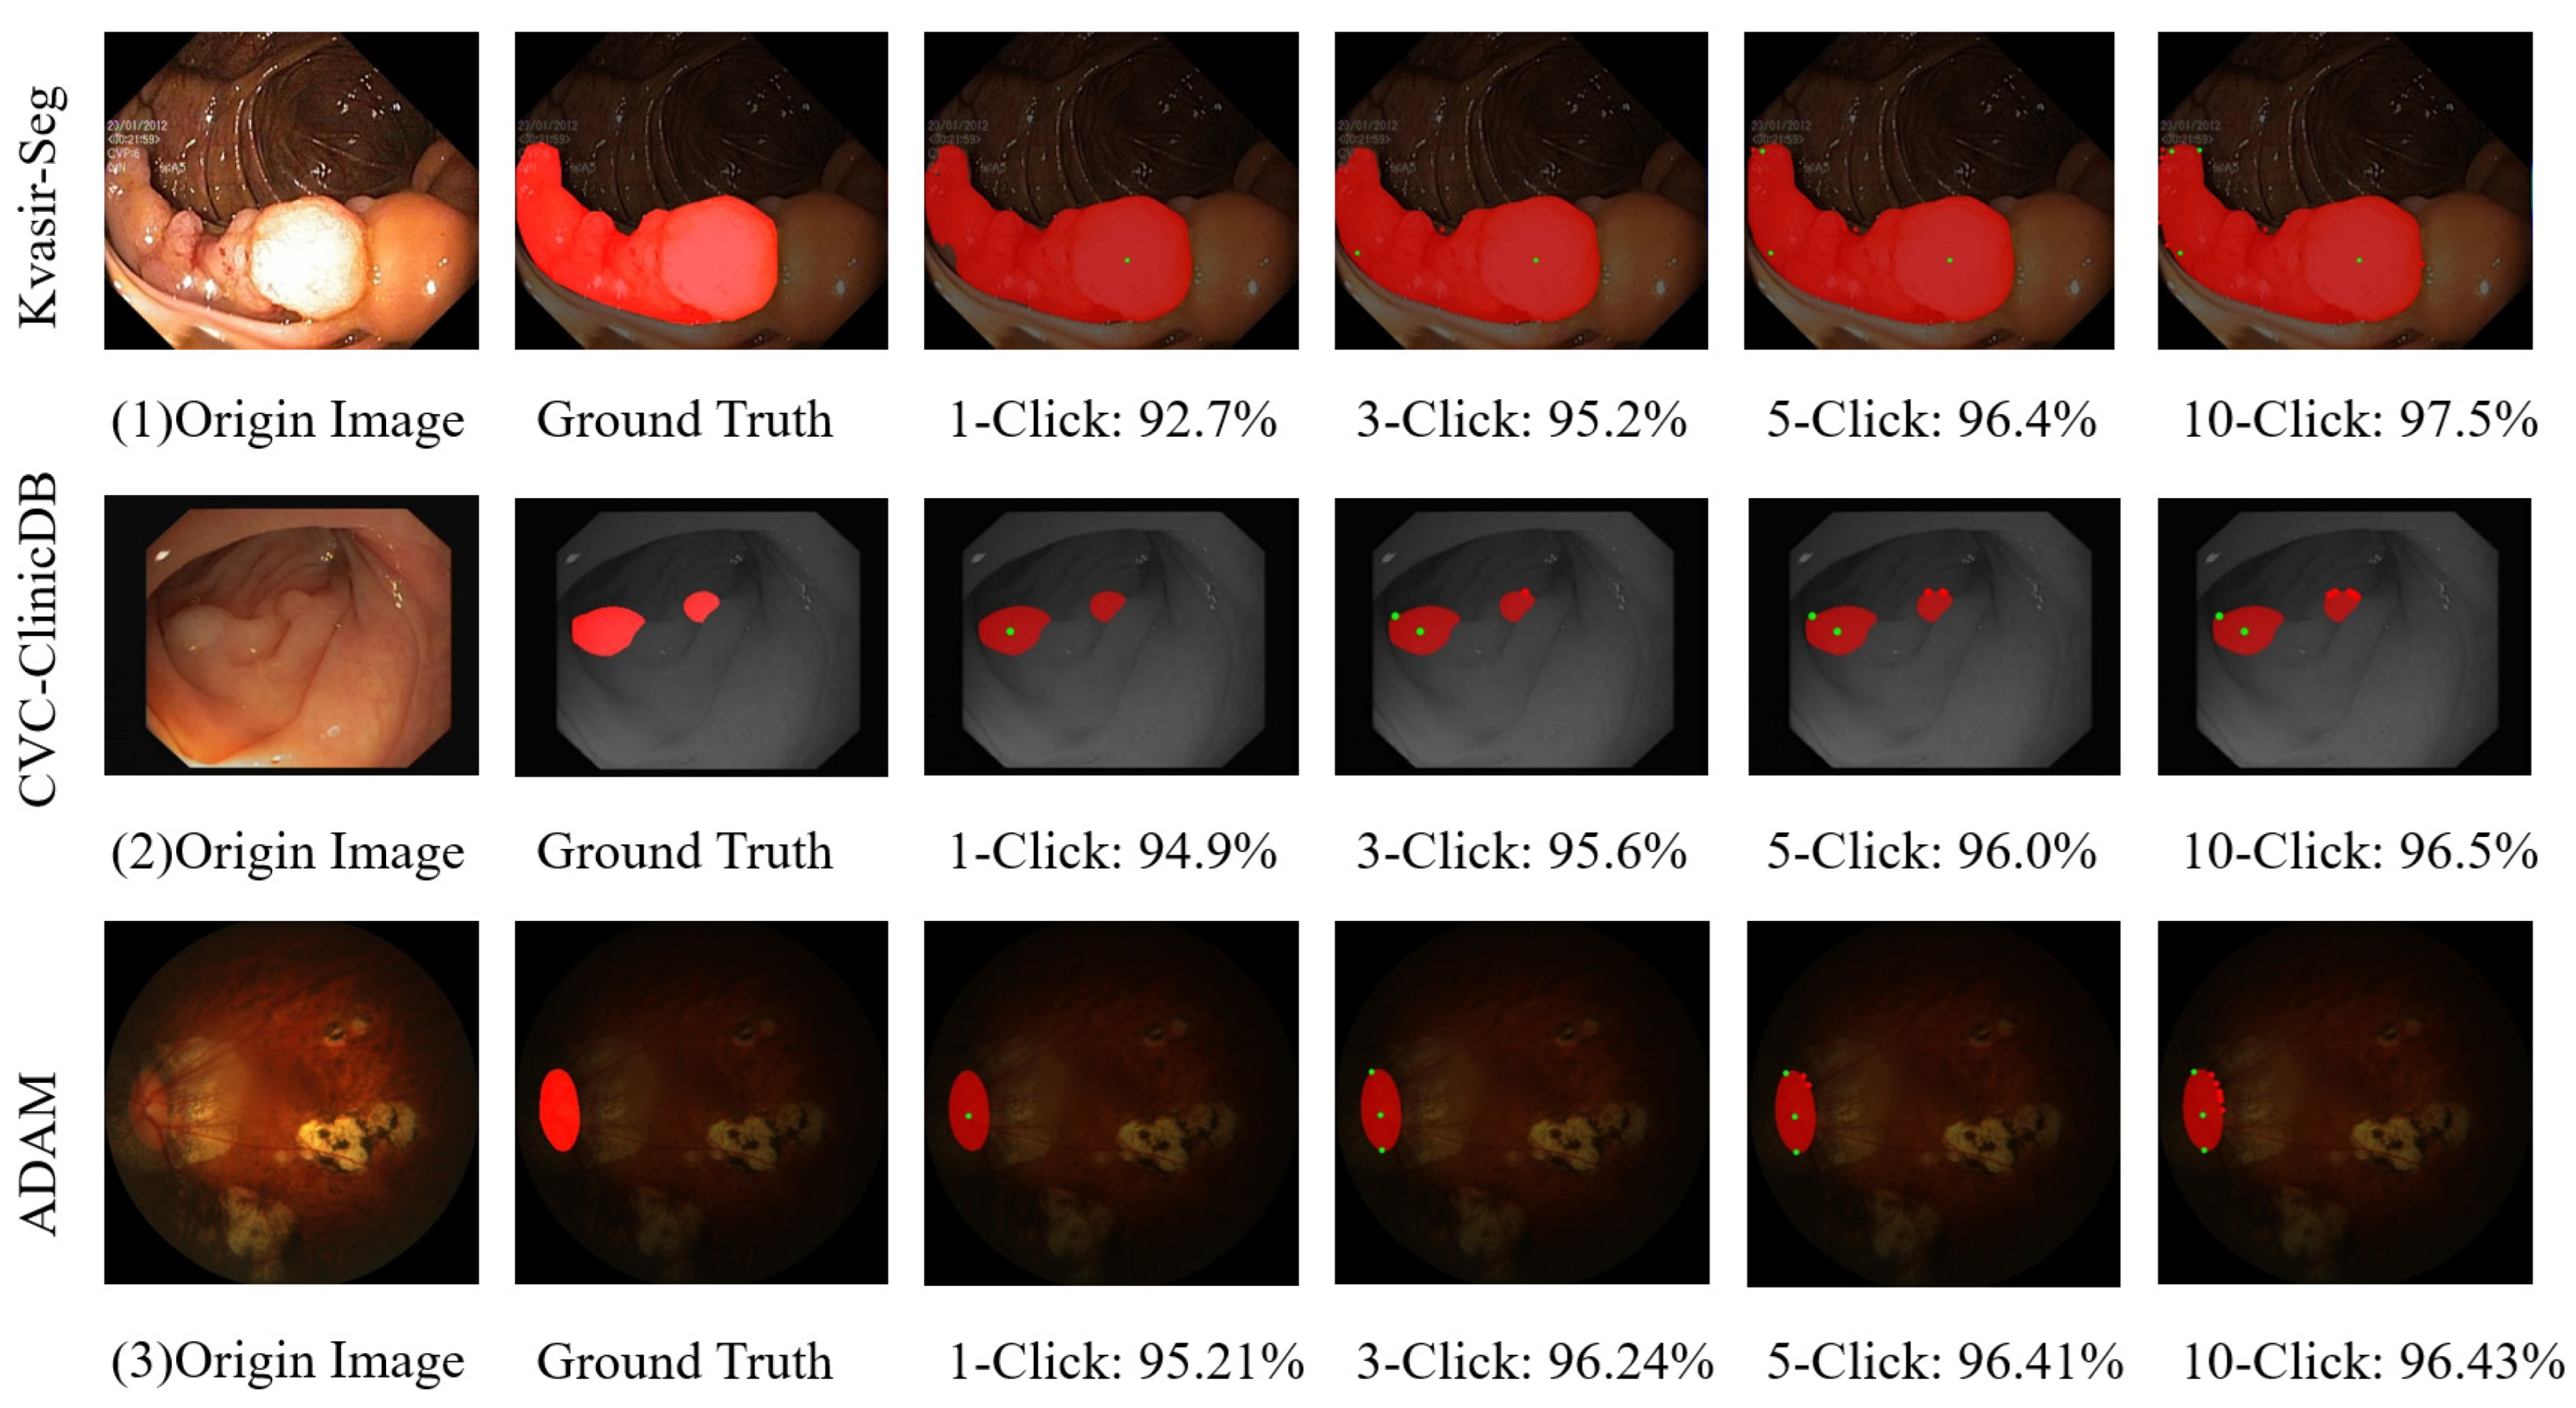
Figure 4 illustrates examples of interactive segmentation performed by the ESM-Click model on the Kvasir-SEG, CVC-ClinicDB, and ADAM datasets. We chose challenging cases from each dataset during testing as segmentation examples, displaying segmentation results with different numbers of clicks for comparative analysis. From the segmentation results, ESM-Click consistently achieves higher segmentation accuracy throughout the refinement process. Our model achieves good segmentation performance with just one user-guided click and progressively refines the mask with subsequent clicks. This leads to a final prediction closely approximating the ground truth. The high-quality segmentation achieved with the first click allows subsequent clicks to focus on refining edges and correcting specific areas. This is particularly beneficial for segmenting objects with regular sizes, such as the optic disc images in the ADAM dataset. From the results of the challenging cases illustrated, our model shows significant advantages in segmenting irregular, uneven, and multi-target objects.

4.6. Ablation Studies

We conducted ablation experiments on the new modules of the backbone network to assess the effectiveness of each new module in the backbone network, with the results displayed in Table 4. These experiments focused on the challenging Kvasir-SEG and CVC-ClinicDB datasets.
Ablation of Mamba and SAC Modules To comprehensively evaluate the SAC and Mamba modules, we used a baseline network that consisted of the MBConv module for downsampling, along with simple upsampling and segmentation heads. Starting with this baseline, we sequentially added each module and evaluated segmentation performance across datasets. As shown in the table, the Mamba module significantly improves global information modeling, enabling users to achieve the specified IoU with fewer clicks and accurately enhancing target segmentation performance with a single click. Through ablation of the number of Mamba layers, we determined that maintaining the same number of Mamba layers as MBConv layers resulted in optimal performance. Consequently, we ensured that each downsampling module of the network contained an equal number of Mamba modules and MBConv layers.
Ablation of KANSegHead Module To assess the effectiveness of the KANSegHead, we compared it with a simple segmentation head that used a single 2D convolution layer to output the mask from the fused features. Compared to this simple segmentation head, our KANSegHead significantly enhances the relationships, resulting in higher-quality mask outputs. Specifically, we calculated the Dice and IoU scores for the first segmentation result and the ground truth, as shown in Table 4. The results indicate that our segmentation head provides superior segmentation performance.

5. Conclusions

In this paper, we propose an efficient segmentation method, ESM-Click, based on click interaction, which has been successfully applied to interactive medical image segmentation tasks. The experimental results demonstrate that this method exhibits strong segmentation performance on two polyp segmentation datasets and one optic disc segmentation dataset. Compared to traditional interactive segmentation models, the proposed ESM-Net backbone significantly reduces computational complexity, enhancing feasibility for real-time applications. However, the model remains dependent on high-quality input data, and its performance tends to degrade in the presence of substantial noise or low-contrast regions. To further enhance the practical utility of this method, future research will focus on incorporating more adaptive mechanisms and extending the approach to multimodal or 3D data processing.
Moreover, we believe that the proposed method in this study is not only applicable to polyp and optic disc segmentation but also holds potential for other medical image processing tasks, such as tumor detection and organ segmentation. Future studies could evaluate the method across a wider range of medical scenarios to further validate its broader applicability.

Author Contributions

Conceptualization, Y.T. and H.Z.; Methodology, Y.T.; Software, H.Z. and Y.L.; Validation, Y.T. and X.Z.; Formal analysis, Y.T.; Investigation, Y.T.; Resources, H.Z.; Data curation, Y.T.; Writing—original draft preparation, Y.T.; Writing—review and editing, Y.T. and H.Z.; Visualization, Y.T.; Supervision, H.Z. and Y.L.; Project administration, H.Z. and X.Z. All authors have read and agreed to the published version of the manuscript.

Funding

This research was funded by the Bingtuan Science and Technology Program (No. 2022DB005).

Institutional Review Board Statement

Not applicable.

Informed Consent Statement

Not applicable.

Data Availability Statement

Publicly available datasets were used in this study. The Kvasir-SEG dataset can be found here: Simula Datasets—Kvasir SEG (https://datasets.simula.no/kvasir-seg/) (accessed on 3 June 2024). The CVC-ClinicDB dataset can be found here: Cvc-Clinicdb—Grand Challenge (grand-challenge.org) (https://polyp.grand-challenge.org/CVCClinicDB/) (accessed on 22 June 2024). The ADAM dataset can be found here: Home—Grand Challenge (grand-challenge.org) (https://amd.grand-challenge.org/) (accessed on 22 June 2024).

Conflicts of Interest

The authors declare no conflict of interest.

References

  1. Wang, R.; Lei, T.; Cui, R.; Zhang, B.; Meng, H.; Nandi, A.K. Medical image segmentation using deep learning: A survey. IET Image Process. 2022, 16, 1243–1267. [Google Scholar] [CrossRef]
  2. Shen, D.; Wu, G.; Suk, H.-I. Deep Learning in Medical Image Analysis. Annu. Rev. Biomed. Eng. 2017, 19, 221–248. [Google Scholar] [CrossRef] [PubMed]
  3. Qiu, P.; Yang, J.; Kumar, S.; Ghosh, S.S.; Sotiras, A. AgileFormer: Spatially Agile Transformer UNet for Medical Image Segmentation. arXiv 2024. [Google Scholar] [CrossRef]
  4. Wang, H.; Cao, P.; Wang, J.; Zaiane, O.R. Uctransnet: Rethinking the skip connections in u-net from a channel-wise perspective with transformer. In Proceedings of the AAAI Conference on Artificial Intelligence, online, 22 February–1 March 2022; pp. 2441–2449. [Google Scholar]
  5. Fitzgerald, K.; Matuszewski, B. FCB-SwinV2 transformer for polyp segmentation. arXiv 2023. [Google Scholar] [CrossRef]
  6. Jha, D.; Tomar, N.K.; Sharma, V.; Bagci, U. TransNetR: Transformer-based residual network for polyp segmentation with multi-center out-of-distribution testing. In Proceedings of the Medical Imaging with Deep Learning, Nashville, TN, USA, 10–12 July 2023; pp. 1372–1384. [Google Scholar]
  7. Xu, N.; Price, B.; Cohen, S.; Yang, J.; Huang, T. Deep Interactive Object Selection. In Proceedings of the 2016 IEEE Conference on Computer Vision and Pattern Recognition (CVPR), Las Vegas, NV, USA, 27–30 June 2016. [Google Scholar]
  8. Wu, J.; Zhao, Y.; Zhu, J.-Y.; Luo, S.; Tu, Z. MILCut: A Sweeping Line Multiple Instance Learning Paradigm for Interactive Image Segmentation. In Proceedings of the 2014 IEEE Conference on Computer Vision and Pattern Recognition (CVPR), Columbus, OH, USA, 23–28 June 2014. [Google Scholar]
  9. Lempitsky, V.; Kohli, P.; Rother, C.; Sharp, T. Image segmentation with a bounding box prior. In Proceedings of the 2009 IEEE 12th International Conference on Computer Vision (ICCV), Kyoto, Japan, 27 September–4 October 2009. [Google Scholar]
  10. Rother, C.; Kolmogorov, V.; Blake, A. “GrabCut”: Interactive foreground extraction using iterated graph cuts. ACM J. 2004, 23, 309–314. [Google Scholar] [CrossRef]
  11. Bai, J.; Wu, X. Error-Tolerant Scribbles Based Interactive Image Segmentation. In Proceedings of the 2014 IEEE Conference on Computer Vision and Pattern Recognition (CVPR), Columbus, OH, USA, 23–28 June 2014. [Google Scholar]
  12. Grady, L. Random Walks for Image Segmentation. IEEE Trans. Pattern Anal. Mach. Intell. 2006, 28, 1768–1783. [Google Scholar] [CrossRef]
  13. Li, Y.; Sun, J.; Tang, C.-K.; Shum, H.-Y. Lazy snapping. ACM J. 2004, 23, 303–308. [Google Scholar] [CrossRef]
  14. Jang, W.-D.; Kim, C.-S. Interactive Image Segmentation via Backpropagating Refinement Scheme. In Proceedings of the 2019 IEEE/CVF Conference on Computer Vision and Pattern Recognition (CVPR), Long Beach, CA, USA, 15–20 June 2019. [Google Scholar]
  15. Lin, Z.; Zhang, Z.; Chen, L.-Z.; Cheng, M.-M.; Lu, S.-P. Interactive Image Segmentation With First Click Attention. In Proceedings of the 2020 IEEE/CVF Conference on Computer Vision and Pattern Recognition (CVPR), Seattle, WA, USA, 13–19 June 2020. [Google Scholar]
  16. Sofiiuk, K.; Petrov, I.; Barinova, O.; Konushin, A. f-BRS: Rethinking Backpropagating Refinement for Interactive Segmentation. In Proceedings of the 2020 IEEE/CVF Conference on Computer Vision and Pattern Recognition (CVPR), Seattle, WA, USA, 13–19 June 2020. [Google Scholar]
  17. Sofiiuk, K.; Petrov, I.A.; Konushin, A. Reviving Iterative Training with Mask Guidance for Interactive Segmentation. In Proceedings of the 2022 IEEE International Conference on Image Processing (ICIP), Bordeaux, France, 16–19 October 2022. [Google Scholar]
  18. Lin, Z.; Duan, Z.-P.; Zhang, Z.; Guo, C.-L.; Cheng, M.-M. Focuscut: Diving into a focus view in interactive segmentation. In Proceedings of the IEEE/CVF Conference on Computer Vision and Pattern Recognition, New Orleans, LA, USA, 18–24 June 2022; pp. 2637–2646. [Google Scholar]
  19. Liu, Q. iSegFormer: Interactive Segmentation via Transformers with Application to 3D Knee MR Images. arXiv 2021. [Google Scholar] [CrossRef]
  20. Liu, Q.; Xu, Z.; Bertasius, G.; Niethammer, M. Simpleclick: Interactive image segmentation with simple vision transformers. In Proceedings of the IEEE/CVF International Conference on Computer Vision, Paris, France, 2–6 October 2023; pp. 22290–22300. [Google Scholar]
  21. Chen, X.; Zhao, Z.; Zhang, Y.; Duan, M.; Qi, D.; Zhao, H. FocalClick: Towards Practical Interactive Image Segmentation. arXiv 2022. [Google Scholar] [CrossRef]
  22. Liu, Q.; Zheng, M.; Planche, B.; Karanam, S.; Chen, T.; Niethammer, M.; Wu, Z. PseudoClick: Interactive Image Segmentation with Click Imitation. arXiv 2022. [Google Scholar] [CrossRef]
  23. Du, F.; Yuan, J.; Wang, Z.; Wang, F. Efficient mask correction for click-based interactive image segmentation. In Proceedings of the IEEE/CVF Conference on Computer Vision and Pattern Recognition, Vancouver, BC, Canada, 17–24 June 2023; pp. 22773–22782. [Google Scholar]
  24. Gu, A.; Dao, T. Mamba: Linear-Time Sequence Modeling with Selective State Spaces. arXiv 2023. [Google Scholar] [CrossRef]
  25. Kalman, R.E. A new approach to linear filtering and prediction problems. J. Basic Eng. March 1960, 82, 35–45. [Google Scholar] [CrossRef]
  26. Zhu, L.; Liao, B.; Zhang, Q.; Wang, X.; Liu, W.; Wang, X. Vision mamba: Efficient visual representation learning with bidirectional state space model. arXiv 2024. [Google Scholar] [CrossRef]
  27. Liu, Y.; Tian, Y.; Zhao, Y.; Yu, H.; Xie, L.; Wang, Y.; Ye, Q.; Liu, Y.J.A. VMamba: Visual State Space Model. arXiv 2024. [Google Scholar] [CrossRef]
  28. Isensee, F.; Jaeger, P.F.; Kohl, S.A.; Petersen, J.; Maier-Hein, K.H. nnU-Net: A self-configuring method for deep learning-based biomedical image segmentation. Nat. Methods 2021, 18, 203–211. [Google Scholar] [CrossRef]
  29. Hatamizadeh, A.; Nath, V.; Tang, Y.; Yang, D.; Roth, H.R.; Xu, D. Swin unetr: Swin transformers for semantic segmentation of brain tumors in mri images. In Proceedings of the International MICCAI Brainlesion Workshop, Online, 27 September 2021; pp. 272–284. [Google Scholar]
  30. Ma, J.; Li, F.; Wang, B. U-Mamba: Enhancing Long-range Dependency for Biomedical Image Segmentation. arXiv 2024. [Google Scholar] [CrossRef]
  31. Xing, Z.; Ye, T.; Yang, Y.; Liu, G.; Zhu, L. Segmamba: Long-range sequential modeling mamba for 3d medical image segmentation. arXiv 2024. [Google Scholar] [CrossRef]
  32. Boykov, Y.Y.; Jolly, M.-P. Interactive graph cuts for optimal boundary & region segmentation of objects in N-D images. In Proceedings of the Eighth IEEE International Conference on Computer Vision, Vancouver, BC, Canada, 7–14 July 2001. [Google Scholar]
  33. Gulshan, V.; Rother, C.; Criminisi, A.; Blake, A.; Zisserman, A. Geodesic star convexity for interactive image segmentation. In Proceedings of the 2010 IEEE Conference on Computer Vision and Pattern Recognition (CVPR), San Francisco, CA, USA, 13–18 June 2010. [Google Scholar]
  34. Mahadevan, S.; Voigtlaender, P.; Leibe, B. Iteratively Trained Interactive Segmentation. arXiv 2018. [Google Scholar] [CrossRef]
  35. Li, K.; Vosselman, G.; Yang, M.Y. Interactive image segmentation with cross-modality vision transformers. In Proceedings of the IEEE/CVF International Conference on Computer Vision, Paris, France, 2–6 October 2023; pp. 762–772. [Google Scholar]
  36. Zeng, H.; Wang, W.; Tao, X.; Xiong, Z.; Tai, Y.-W.; Pei, W. Feature decoupling-recycling network for fast interactive segmentation. In Proceedings of the 31st ACM International Conference on Multimedia, Ottawa, ON, Canada, 29 October–3 November 2023; pp. 6665–6675. [Google Scholar]
  37. Xu, L.; Li, S.; Chen, Y.; Chen, J.; Huang, R.; Wu, F. ClickAttention: Click Region Similarity Guided Interactive Segmentation. arXiv 2024. [Google Scholar] [CrossRef]
  38. Xu, L.; Li, S.; Chen, Y.; Luo, J. MST: Adaptive Multi-Scale Tokens Guided Interactive Segmentation. arXiv 2024. [Google Scholar] [CrossRef]
  39. Zhou, M.; Wang, H.; Zhao, Q.; Li, Y.; Huang, Y.; Meng, D.; Zheng, Y. Interactive Segmentation as Gaussian Process Classification. arXiv 2023. [Google Scholar] [CrossRef]
  40. Dosovitskiy, A.; Beyer, L.; Kolesnikov, A.; Weissenborn, D.; Zhai, X.; Unterthiner, T.; Dehghani, M.; Minderer, M.; Heigold, G.; Gelly, S. An image is worth 16x16 words: Transformers for image recognition at scale. arXiv 2020. [Google Scholar] [CrossRef]
  41. Tan, M.; Le, Q. EfficientNetV2: Smaller Models and Faster Training. arXiv 2021. [Google Scholar] [CrossRef]
  42. Liu, Z.; Wang, Y.; Vaidya, S.; Ruehle, F.; Halverson, J.; Soljačić, M.; Hou, T.Y.; Tegmark, M. Kan: Kolmogorov-arnold networks. arXiv 2024. [Google Scholar] [CrossRef]
  43. Graves, A. Long short-term memory. In Supervised Sequence Labelling with Recurrent Neural Networks; Springer: Berlin/Heidelberg, Germany, 2012; pp. 37–45. [Google Scholar]
  44. Sofiiuk, K.; Barinova, O.; Konushin, A. AdaptIS: Adaptive Instance Selection Network. In Proceedings of the 2019 IEEE/CVF International Conference on Computer Vision (ICCV), Seoul, Republic of Korea, 27 October–2 November 2019. [Google Scholar]
  45. Jha, D.; Smedsrud, P.H.; Riegler, M.A.; Halvorsen, P.; De Lange, T.; Johansen, D.; Johansen, H.D. Kvasir-seg: A segmented polyp dataset. In Proceedings of the MultiMedia Modeling: 26th International Conference, MMM 2020, Daejeon, Republic of Korea, 5–8 January 2020; Part II 26; pp. 451–462. [Google Scholar]
  46. Bernal, J.; Sánchez, F.J.; Fernández-Esparrach, G.; Gil, D.; Rodríguez, C.; Vilariño, F. WM-DOVA maps for accurate polyp highlighting in colonoscopy: Validation vs. saliency maps from physicians. Comput. Med. Imaging Graph. 2015, 43, 99–111. [Google Scholar] [CrossRef]
  47. Fang, H.; Li, F.; Fu, H.; Sun, X.; Cao, X.; Lin, F.; Son, J.; Kim, S.; Quellec, G.; Matta, S. Adam challenge: Detecting age-related macular degeneration from fundus images. IEEE Trans. Med. Imaging 2022, 41, 2828–2847. [Google Scholar] [CrossRef]
  48. Paszke, A.; Gross, S.; Massa, F.; Lerer, A.; Bradbury, J.; Chanan, G.; Killeen, T.; Lin, Z.; Gimelshein, N.; Antiga, L.; et al. PyTorch: An Imperative Style, High-Performance Deep Learning Library. arXiv 2019. [Google Scholar] [CrossRef]
  49. Chen, X.; Zhao, Z.; Yu, F.; Zhang, Y.; Duan, M. Conditional diffusion for interactive segmentation. In Proceedings of the IEEE/CVF International Conference on Computer Vision, Montreal, BC, Canada, 11–17 October 2021; pp. 7345–7354. [Google Scholar]
  50. Lin, J.; Chen, J.; Yang, K.; Roitberg, A.; Li, S.; Li, Z.; Li, S. AdaptiveClick: Click-Aware Transformer with Adaptive Focal Loss for Interactive Image Segmentation. arXiv 2024. [Google Scholar] [CrossRef]
  51. Sun, K.; Xiao, B.; Liu, D.; Wang, J. Deep High-Resolution Representation Learning for Human Pose Estimation. In Proceedings of the 2019 IEEE/CVF Conference on Computer Vision and Pattern Recognition (CVPR), Long Beach, CA, USA, 15–20 June 2019. [Google Scholar]
  52. Xie, E.; Wang, W.; Yu, Z.; Anandkumar, A.; Alvarez, J.M.; Luo, P. SegFormer: Simple and efficient design for semantic segmentation with transformers. Adv. Neural Inf. Process. Syst. 2021, 34, 12077–12090. [Google Scholar]
Figure 1. ESM-Click Overview. Our model comprises two stages: preliminary segmentation and refinement segmentation. The encoded image and click features are fed into our proposed ESM-Net segmentation network to extract target-aware features and generate a coarse segmentation mask guided by the initial click. Starting from the second click, the new user-provided click is fed into the refinement network to optimize the details of the previously generated coarse mask. By iteratively executing the refinement network, a high-quality prediction mask is eventually produced.
Information 15 00633 g001
Figure 2. The Overall Architecture of ESM-Net integrates Spatial Augmented Convolution (SAC), Mamba modules, and MBConv for downsampling within the encoder module. (a) The Spatial Augmented Convolution Module enhances the spatial representation of features before input to the Mamba Module using a gate-like structure. (b) The Mamba Module transforms input features into feature sequences and processes them with SS2D to obtain comprehensive features from the merged sequences. (c) KAN SegHead receives multi-scale features from the encoder and utilizes KANLinear layers to output the final segmentation mask.
Information 15 00633 g002
Figure 3. The mean Intersection over Union (mIoU) and mean Dice coefficient (mDice) scores corresponding to the predictions obtained per click using different methods on the Kvasir-SEG and Clinic datasets.
Information 15 00633 g003
Figure 4. Qualitative results of ESM-Click. The first row illustrates example segmentations from the Kvasir-SEG dataset. The second row presents segmentation examples from the Clinic dataset with varying numbers of clicks. The third row showcases interactive segmentation cases from the ADAM dataset. Segmentation probability maps are depicted in blue; segmentation overlays on the original images are shown in red using the IoU evaluation metric. Green dots indicate positive clicks, while red dots indicate negative clicks.
Information 15 00633 g004
Table 1. Comparison of the computational cost across different backbones.
BackboneFLOPs (G)Params (M)SPC/ms
hr18s+ocr8.24.2195
hr32+ocr39.2730.94146
Segformer-B328.945.66119
ViT-Base44867.1787.02127
ESM-Net4.512.4687
Table 2. Comparisons between six benchmarks. NoC@85 and NoC@90, respectively, denote the number of clicks required to reach the IoU of 85% and 90%, and lower is better for the value.
ModelBackboneKvasir-SEGCVC-ClinicDBADAM
NoC@85NoC@90NoC@85NoC@90NoC@85NoC@90
CDNet [49]Resnet341.42.053.74.931.241.95
RITM [17]HRNet18s1.592.121.692.751.031.42
HRNet321.51.91.672.281.81.26
SimpleClick [20]ViT-B2.263.166.979.696.187.26
AdaptiveClick [50]ViT-B1.572.135.938.661.212.82
FocalClick [21]HRNet18s-S21.491.841.342.071.822.74
SegformerB3-S21.461.872.083.1522.55
EMC-Click [23]SegformerB3-S21.411.811.331.851.211.95
HRNet18s-S21.421.831.31.591.051.08
ESM-Click (Ours)ESM-Net1.171.431.151.571.031.03
Table 3. The mIoU and mDice values of the segmentation results after the first click for different methods and their respective backbone networks.
ModelBackboneKvasir-SEGCVC-ClinicDBADAM
IoU (%)Dice (%)IoU (%)Dice (%)IoU (%)Dice (%)
FocalClick [21]HRNet18s-S286.1791.9389.794.393.4196.54
SegformerB3-S286.692.1979.9687.893.6496.68
EMC-Click [23]SegformerB3-S288.3193.4289.7794.4588.6193.89
HRNet18s-S289.0193.3393.8396.4694.3797.09
ESM-Click (Ours)ESM-Net92.795.8794.9697.3695.2197.84
Table 4. Ablation study of the proposed ESM-Net backbone components, using NoC@85, NoC@90, and mIoU and mDice scores for the first click as evaluation metrics. Our ablation experiments revealed that using the same number of Mamba layers as the downsampling convolution modules at each stage significantly enhances model performance. To ensure model efficiency, the spatial augmentation module is applied before all Mamba modules. Additionally, the experiments indicate that Mamba modules require effective residual connections to maintain accuracy.
ModelKvasir-SEGCVC-ClinicDB
NoC@85NoC@90IoU(%)Dice (%)NoC@85NoC@90IoU (%)Dice (%)
MBConv1.962.5989.4993.99 1.361.9788.5593.69
mamba*11.662.2291.0194.851.331.8289.4794.25
mamba*depth-41.21.5891.8195.311.21.6791.3695.38
Mamba*depth-4+SAC1.211.4492.24 95.62 1.161.7492.6296.1
Mamba+SAC+KANSegHead1.171.4392.795.871.151.5794.9697.36
Disclaimer/Publisher’s Note: The statements, opinions and data contained in all publications are solely those of the individual author(s) and contributor(s) and not of MDPI and/or the editor(s). MDPI and/or the editor(s) disclaim responsibility for any injury to people or property resulting from any ideas, methods, instructions or products referred to in the content.