Article

Cyberbullying Detection on Social Media Using Stacking Ensemble Learning and Enhanced BERT

1
Department of Imaging Physics, The University of Texas MD Anderson Cancer Center, Houston, TX 77030, USA
2
Department of Computer and Information Sciences, Universiti Teknologi Petronas, Seri Iskandar 32610, Malaysia
3
Computer Science Department, Community College, King Saud University, Riyadh 145111, Saudi Arabia
*
Author to whom correspondence should be addressed.
Information 2023, 14(8), 467; https://doi.org/10.3390/info14080467
Submission received: 7 July 2023 / Revised: 31 July 2023 / Accepted: 17 August 2023 / Published: 18 August 2023

Abstract

:
The prevalence of cyberbullying on Social Media (SM) platforms has become a significant concern for individuals, organizations, and society as a whole. The early detection and intervention of cyberbullying on social media are critical to mitigating its harmful effects. In recent years, ensemble learning has shown promising results for detecting cyberbullying on social media. This paper presents an ensemble stacking learning approach for detecting cyberbullying on Twitter using a combination of Deep Neural Network methods (DNNs). It also introduces BERT-M, a modified BERT model. The dataset used in this study was collected from Twitter and preprocessed to remove irrelevant information. The feature extraction process involved utilizing word2vec with Continuous Bag of Words (CBOW) to form the weights in the embedding layer. These features were then fed into a convolutional and pooling mechanism, effectively reducing their dimensionality, and capturing the position-invariant characteristics of the offensive words. The validation of the proposed stacked model and BERT-M was performed using well-known model evaluation measures. The stacked model achieved an F1-score of 0.964, precision of 0.950, recall of 0.92 and the detection time reported was 3 min, which surpasses the previously reported accuracy and speed scores for all known NLP detectors of cyberbullying, including standard BERT and BERT-M. The results of the experiment showed that the stacking ensemble learning approach achieved an accuracy of 97.4% in detecting cyberbullying on Twitter dataset and 90.97% on combined Twitter and Facebook dataset. The results demonstrate the effectiveness of the proposed stacking ensemble learning approach in detecting cyberbullying on SM and highlight the importance of combining multiple models for improved performance.

1. Introduction

Cyberbullying has become a significant problem in recent years, particularly among young people who use the internet and social media (SM) platforms (e.g., Twitter or Facebook) on a daily basis [1,2]. It involves the use of electronic communication to harass, threaten, or humiliate others, causing significant harm to the victims (individual or group) [3,4]. Cyberbullying can manifest in various ways, including sending threatening messages, spreading rumors or false information, sharing private or sensitive content without consent, impersonating someone, or engaging in persistent and derogatory comments or posts. The anonymity and reach of the internet make it easier for cyberbullies to target their victims, causing severe emotional distress and even leading to suicide in extreme cases [5,6,7]. In light of this growing problem, researchers have sought to develop methods to detect and prevent cyberbullying. One promising approach is the use of Machine Learning (ML) algorithms, which can analyze large amounts of data and identify patterns and relationships between variables [8,9]. However, the task of detecting cyberbullying is complex, and a single machine-learning algorithm is unlikely to be sufficient [10,11,12]
Stacking is an ensemble learning technique that combines predictions from multiple models to improve the overall performance [13,14]. By combining the strengths of different algorithms, stacking can overcome the limitations of a single model and lead to more robust and accurate predictions, which can be especially important in the context of cyberbullying where the stakes are high and the consequences of a false positive or false negative can be severe [13,15,16]. In this paper, we propose a new stacking learning model for the task of detecting cyberbullying from the Twitter platform (currently known as X) and Facebook, which outperformed the state-of-the-art BERT model that is one of the most widely used language models in Natural Language Processing (NLP) and has set new benchmarks for various NLP tasks [17]. BERT (Bidirectional Encoder Representations from Transformers) is a transformer-based pre-training language model that has been trained on large amounts of text data [18]. The model can undergo fine-tuning to adapt and optimize its performance for specific NLP tasks, including sentiment analysis and text classification. BERT uses a bidirectional approach in its encoding process, which allows it to consider the context of a word in both the forward and backward direction, leading to more accurate representations of the words in a sentence [19]. The use of transformers also allows BERT to handle long-range dependencies, which is particularly useful in NLP tasks where context plays an important role [20].
Additionally, the literature has proven that ensemble learning can lead to more robust predictions compared to a single model, which can be especially important in the context of cyberbullying, where the stakes are high and the consequences of a false positive or false negative can be severe [6]. By combining the predictions of multiple models, the ensemble can reduce the risk of making a false prediction and increase the overall accuracy of the detection system [13].
This study aims to evaluate the performance of a stacking ensemble learning model, which is one of the state-of-the-art methods for detecting cyberbullying in the SM datasets. The model combines multiple Deep Neural Network (DNN) models. The predictions from these base models will be combined using a meta-model to make the final prediction. The results of this study will contribute to our understanding of the potential of stacking learning for cyberbullying detection. Additionally, the findings will have practical implications for the development of deep learning algorithms to identify and prevent cyberbullying in real-world applications. These contributions can be summarized as follows:
  • We have proposed a new stacking ensemble learning model for cyberbullying detection based on a continuous bag of words feature extractor.
  • We have introduced a modified BERT model and investigated and evaluated its performance with the standard BERT model and the proposed ensemble learning model performance.
  • We analyzed the performance of two standard BERT models and proposed stacked model with two benchmark datasets from Twitter and Facebook for cyberbullying detection on SM.
  • We conducted and reported an empirical analysis to determine the effectiveness and performance of three methods with different feature extraction methods.
This paper is succinctly organized as follows. Section 2 reviewed the existing research on cyberbullying and the use of machine learning algorithms for its detection. Section 3 describes the methodology used; Section 4 presents the proposed method’s results, including the experiment settings, a discussion of the results, and a visualization of the results. Lastly, Section 5 concludes the work and provides some remarks for future research.

2. Related Works

Cyberbullying on social media, particularly Twitter (currently known as X) and Facebook, is an important problem because it significantly impacts the well-being of individuals, particularly young people who are frequent users of these platforms [21]. Social media provides an easy and accessible platform for individuals to harass, threaten, or humiliate others, leading to severe emotional distress and psychological harm to the victims. The task of detecting cyberbullying is complex and requires considering various factors, such as the language used in online communication, the sender and recipient of the message, and so on [6,13]. A single ML algorithm may not be sufficient to accurately detect all instances of cyberbullying. By combining the predictions of multiple models, ensemble learning can leverage the strengths of different algorithms and overcome the limitations of a single model [21,22]. For example, some algorithms may be better at detecting certain types of cyberbullying, while others may perform better on different types.
Additionally, ensemble learning can lead to more robust predictions compared to a single model, which can be especially important in the context of cyberbullying, where the stakes are high and the consequences of a false positive or false negative can be severe. By combining the predictions of multiple models, the ensemble can reduce the risk of making a false prediction and increase the overall accuracy of the detection system. For example, a study by Muneer and Fati [16] conducted an extensive study using seven different machine learning classifiers for cyberbullying detection on Twitter. The experimental results revealed that Logistic Regression (LR) exhibited superior performance, achieving a median accuracy of approximately 90.57%. Haidar et al. [23] proposed a cyberbullying prevention method for multiple languages, which was evaluated on an authentic Arabic dataset from Arab countries. They employed two Machine Learning (ML) classifiers, namely, Support Vector Machine (SVM) and Naive Bayes (NB), achieving acceptable results. However, this study could benefit from incorporating Deep Learning (DL) techniques and expanding the dataset size to further enhance the performance. Yadav et al. [24] utilized a pretrained BERT model integrated with a novel deep learning network, employing the transformer technique, to detect cyberbullying across various social media platforms. The classification process involves a single linear layer of a neural network, which can be replaced by other deep learning network models such as Convolutional Neural Network (CNN) and RNN if needed. The model underwent extensive training using two social media datasets, one of which is publicly available. The first dataset, called the Formspring dataset, is relatively small in size, while the second dataset, known as the Wikipedia dataset, is significantly larger. Interestingly, the model demonstrated better and more consistent results when applied to the larger Wikipedia dataset, eliminating the need for oversampling techniques to enhance performance.
In addition, another study by Al-Ajlan and Ykhlef [25] developed a cyberbullying detection technique using 20,000 random tweets. They utilized data pre-processing to eliminate noise and undesirable data, partitioning and labeling the data for training. Deep Convolutional Neural Networks (DCNN) were used for classification. Despite their efforts, the experimental findings did not yield promising results. To improve this research, considering a larger and more diverse dataset spanning multiple languages would be valuable. Finally, Similarly, Banerjee et al. [26] leveraged Deep Convolutional Neural Networks (DCNN) to analyze a dataset of 69,874 tweets from Twitter. They utilized Glove’s open-source word embedding to map tweets to vectors, achieving an accuracy of 93.7% with DCNN. Expanding the study to detect cyberbullying in conversations that include both Hindi and English could broaden its scope and applicability. In Wulczyn et al. [27], their primary focus was on the Wiki-Detox dataset. They developed a classifier that demonstrated results, measured in terms of AUC and Spearman correlation, comparable to those of three human workers combined. Their work showcased promising potential for cyberbullying detection. Subburaj et al. [28] proposed an ensemble machine-learning model for cyberbullying detection on social media. The model consisted of four base classifiers, including NB, K-Nearest Neighbor (KNN), RF, and SVM, which were combined using a majority voting scheme. The ensemble model showed an accuracy of 94.78%. The study did not evaluate the performance of the proposed ensemble model on a large and diverse dataset. The authors in [29] proposed a cyberbullying detection framework that incorporates reinforcement learning and integrates multiple natural language processing techniques. This innovative framework takes advantage of human-like behavioral patterns and implements delayed rewards to enhance its performance. Through extensive experimentation on a highly dynamic and populated dataset, the developed model achieved an accuracy of 89.5%. Mahat [30] presented a practical application for cyberbullying detection across multiple social media platforms, utilizing data from Twitter, Wikipedia, and Formspring. The proposed implementation employs LSTM layers to effectively detect cyberbullying instances. Through training the models with the backpropagation method and using the cross-entropy loss function in combination with the Adam optimizer, superior results were achieved compared to traditional approaches. Yadav et al., [31] conducted a comparative study of deep learning methods for detecting hate speech and offensive language in textual data, including CNN, RNN, LSTM, and BERT models. They also explored the impact of class weighting technique on model performance. The results showed that the pre-trained BERT model outperformed other methods in both unweighted and weighted classification. BERT’s ability to capture sentence relationships and contextual dependencies contributed to its superior performance.
Therefore, an improved ensemble learning approach is still needed for cyberbullying detection because current machine and deep learning and ensemble learning approaches have limitations, such as (i) reliance on hand-crafted features: most ensemble learning approaches for cyberbullying detection rely on hand-crafted features, which may not be effective in capturing the complex relationships and patterns in the data. (ii) Limited generalizability: some ensemble learning methods are only effective on specific datasets or social media platforms and may not be generalizable to other platforms or datasets. (iii) High computational cost: ensemble learning methods often require a high computational cost due to the multiple models involved and the large amount of data that needs to be processed. (iv) Lack of interpretability: many ensemble learning methods are not interpretable, meaning it can be difficult to understand why a particular decision was made or how the models arrived at a certain conclusion. (v) Unbalanced datasets: cyberbullying datasets are often highly unbalanced, with a small number of positive cases and a large number of negative cases. This can impact the performance of ensemble learning methods and lead to biased results. Therefore, there is a need for an improved ensemble learning approach that addresses these limitations, has a higher accuracy and provides interpretable results, to effectively detect cyberbullying on social media.

3. Materials and Methods

In this work, we have investigated and examined five baseline models, namely Conv1DLSTM, BiLSTM, LSTM CNN, and the BERT baseline model for detecting cyberbullying. Then, we introduced a modified BERT model and an ensemble stacking learning model. The research methodology that has been followed is illustrated in Figure 1 whereby the following steps are applied to achieve this study’s goal. First, the dataset will be loaded into a local machine to perform the necessary preprocessing on the dataset, including essential Natural Language Processing (NLP) steps such as text cleaning, stemming, tokenizing, and lemmatizing. Then, the problematic comment pattern is analyzed using linguistic techniques. Next, four baseline methods (Conv1DLSTM, BiLSTM, LSTM and CNN) were stacked to build an ensemble stacking learning model for cyberbullying detection. The details explanation is given in the following subsections.

3.1. Datasets and Input Layer

This study uses two datasets to test and validate the performance of the proposed models. The first Twitter (currently known as X) benchmark dataset in [16] was used to detect cyberbullying by identifying offensive and non-offensive tweets. This dataset with the size of 37,373 tweets. The data were numerically labeled with 1 or 0 where 1 represents the offensive tweet and 0 represents the neutral tweet, which means the tweet does not belong to the offensive category.
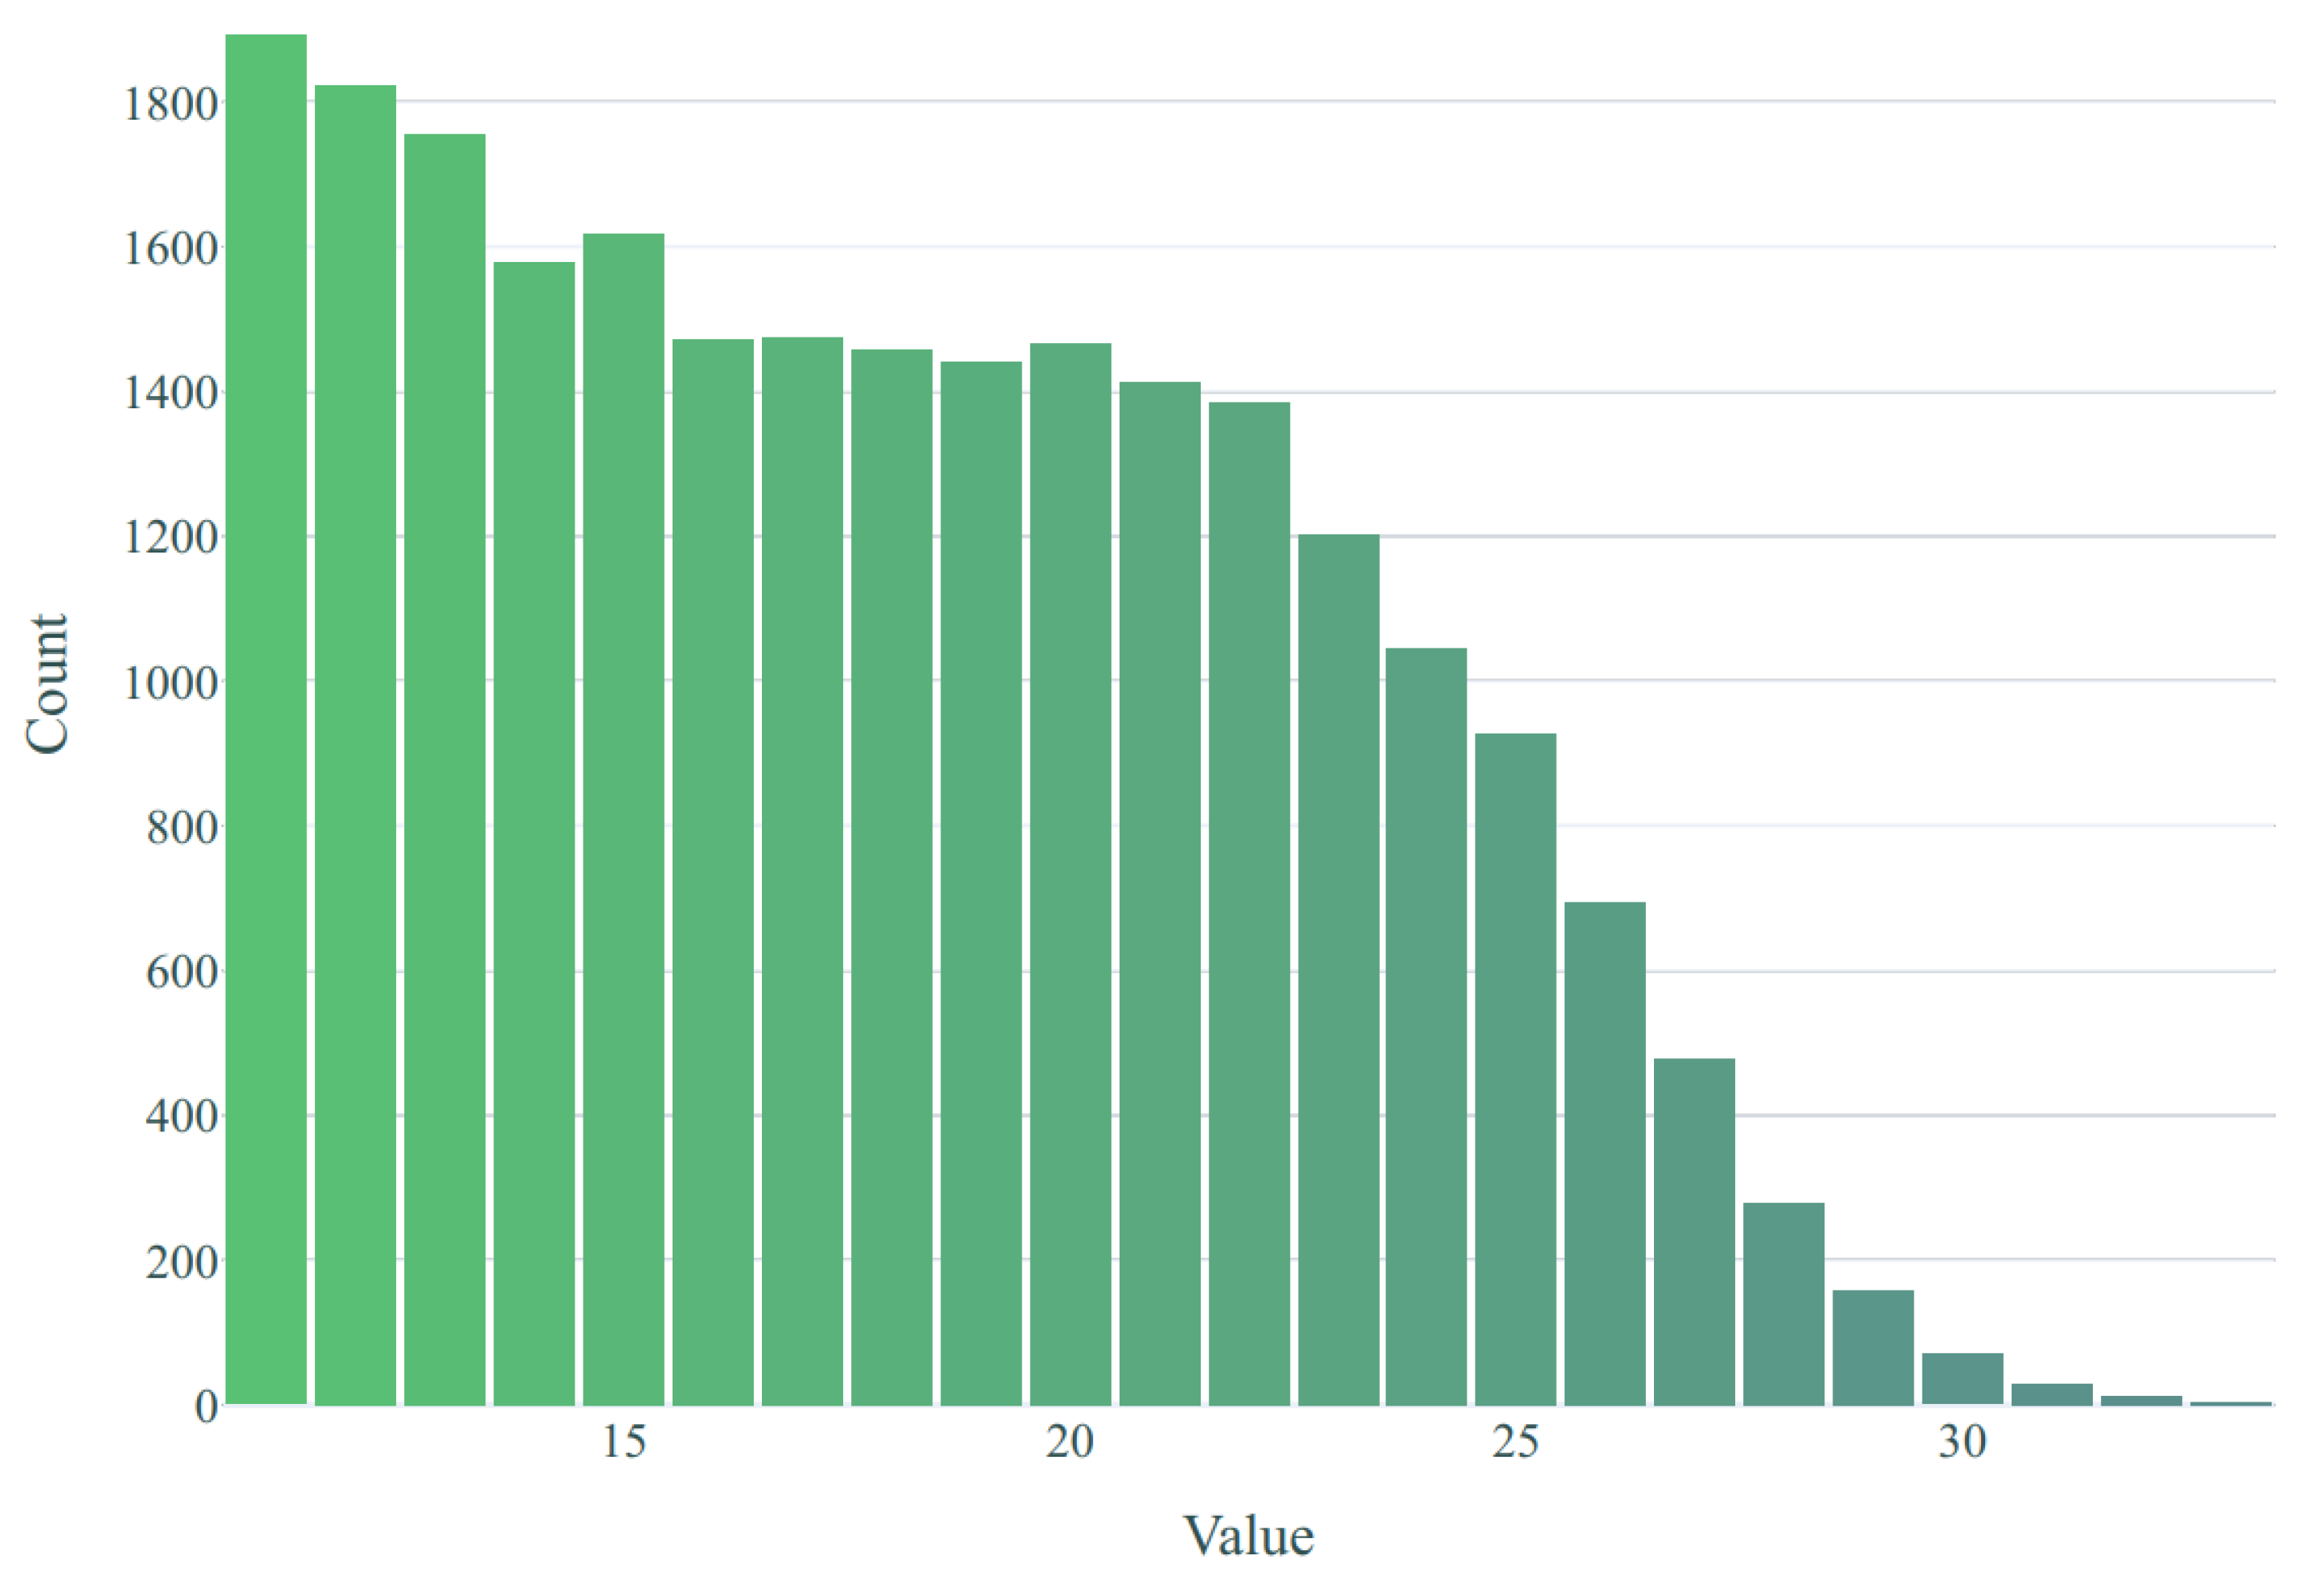
The second dataset used in this study [32] comprises data collected from Twitter and Facebook groups, focusing on suspicious activities, such as racism, discrimination, abusive language, and threatening, predominantly associated with cyberbullying incidents. The data in the dataset was annotated based on the presence of suspicious words used in tweets and comments. Suspicious data points were manually tagged with a label of 1, while non-suspicious data points were labeled with a 0 after the data scraping process. In total, the dataset consists of approximately 20 thousand rows of sentiments. Among these, around 12 thousand data points were tagged with a negative sentiment, indicating the presence of characteristics such as racism, discrimination, and abuse. Conversely, eight thousand data points were labeled with a positive or neutral sentiment, signifying that the data exhibited non-suspicious attributes. Both datasets input information is primarily based on English-language tweets and comments, with some preprocessing methods and data cleaning explained in the following subsection. Figure 2 demonstrates the count of tweets in the first dataset (Twitter) with less than ten words, where the number of tweets equal to nine words is 1972 and considered the highest in the dataset. Finally, Figure 3 shows the count of tweets with a higher number of words, where the number of tweets that are equal to 11 is 1865, and the most extended tweet in the dataset was 52 words. Table 1 shows an example of cyberbullying tweets samples in Twitter dataset.

3.2. Embedding Layer

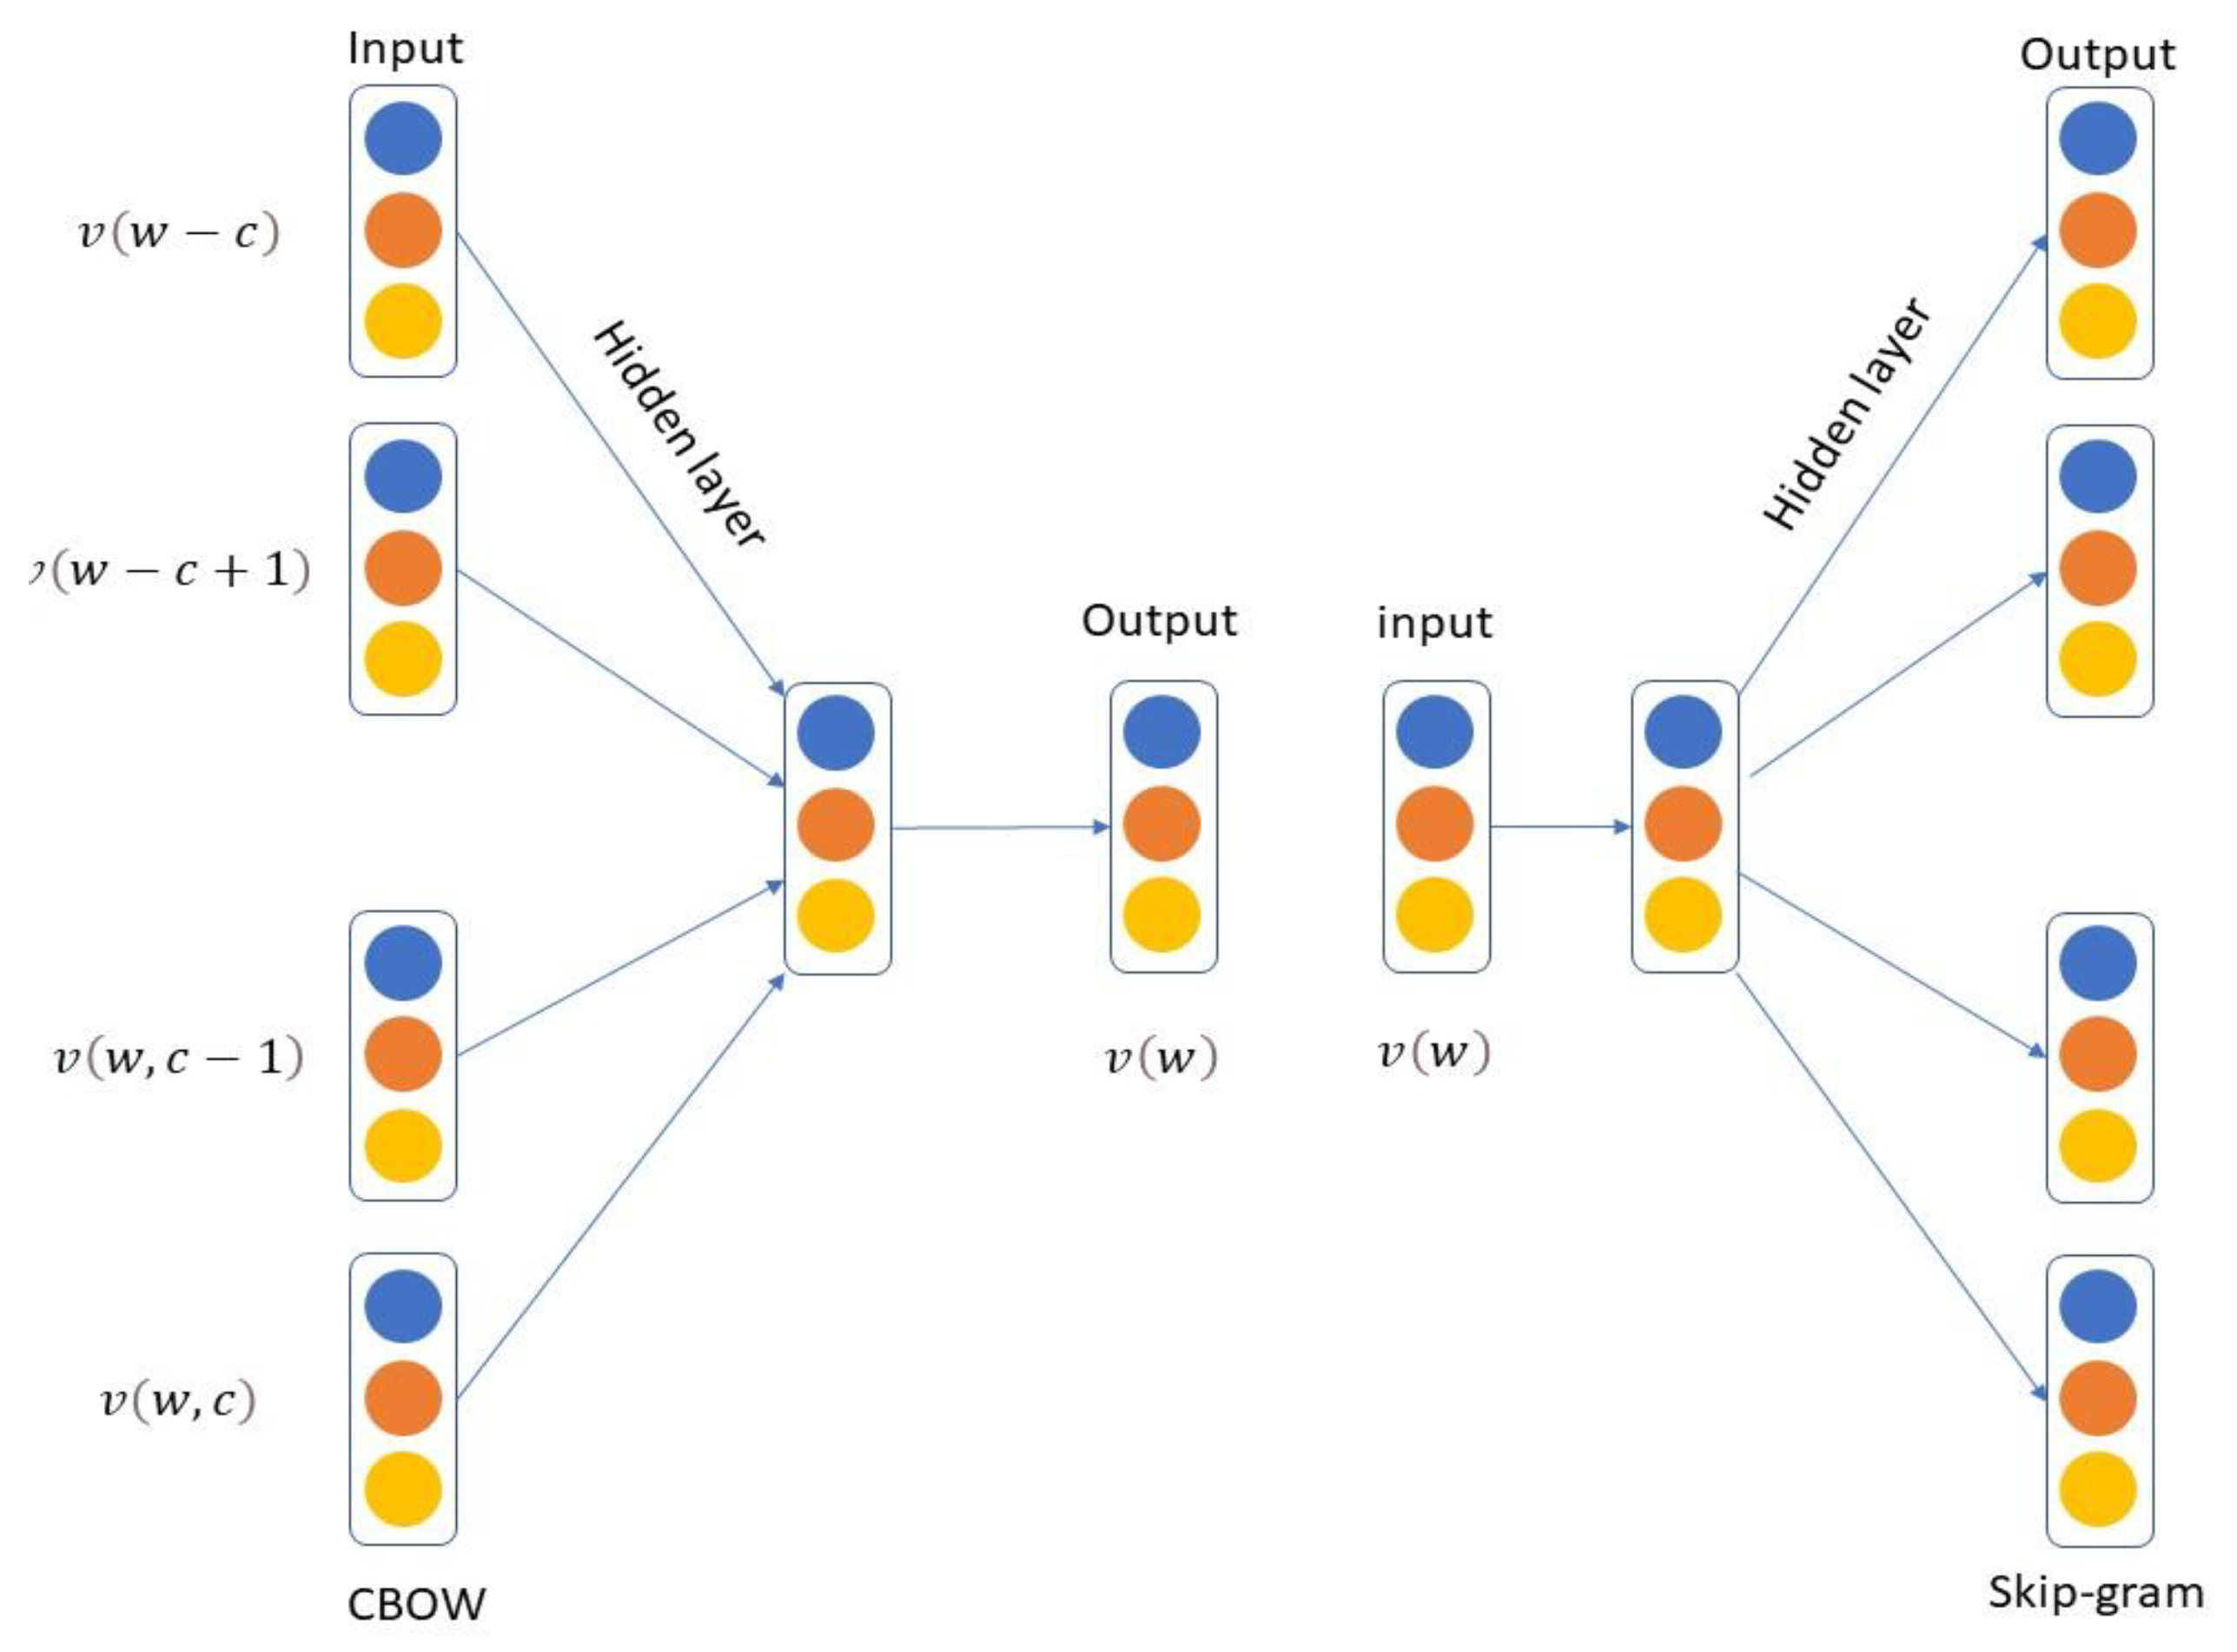
The embedding layer aims to capture the syntactic and semantic relationships between words in a low-dimensional vector space, where a unique vector represents each word. Thus, we used the continuous vector space, whereby similar words will be aggregated in a cluster where vector space is more efficient. Recently, using a neural network to obtain word representations attracted the researcher’s attention as the learner vectors explicitly encode uneven patterns in the texts with several linguistics. Word embedding representations can be learned using the word2vec with Skip-gram [33] and Continuous Bag-of-Words (CBOW) [34] models. Both models have the same objective, except that the Skip-gram model relies on maximizing the prediction probability of the adjacent attributes based on the main word. The importance of CBOW feature extraction for cyberbullying detection is that it provides a way to capture the context of words in a text and their relationships. This is critical for detecting cyberbullying, as the meaning of words can change significantly based on their context and their relationships with other words. For example, the word “you” can have a different meaning when used in a social context compared to when it is used in a hostile or bullying context. CBOW feature extraction can capture these differences and help algorithms better distinguish between bullying and non-bullying text. Figure 4 shows how the CBOW uses word vector representations to anticipate the middle words in a context.
Again, due to the similarity of both CBOW and Skip-gram models, we will try to present their derivation. Both models have a high computational cost, so the training methods used hierarchical SoftMax or negative sampling. Hierarchical SoftMax represents all the words within the vocabulary at the output, which are tree units, using a frequency-based Huffman tree, such as a binary tree [35]. The output layer in the CBOW model with hierarchical SoftMax is substituted with a Huffman tree. The hidden layer averages the input word vectors; thus, the hidden layer’s output is:
h = 1 C u ( context ) ( w ) v ( u )
where v(u) represents the vector associated with the word u, and context f ( ) (w) denote the set of contextual information for the word w. The cardinality of the set context(w) is denoted as C. Based on these definitions, the conditional probability of the word w within a given context can be defined as follows:
p ( w c o n t e x t ( w ) ) = j = 1 k ( w ) 1 h T v n w , j
In the context of a Huffman tree, let n ( w , j ) denote the j-th inner point along the path from the root to the word w. The vector v η w , j represents the vector associated with the inner point n in question and k ( w ) 1 represents the length of the Huffman tree for word w and || is a function defined as:
x = σ ( x ) d j + 1 w 1 σ ( x ) 1 d j + 1 w
where d j + 1 w is the j -th bit of the Huffman code for word w . In the study, we implemented it by maximizing the conditional probability of the Equation during the model’s training in Figure 5 for the context (or target) of the word w . The l o g of the conditional probability provides the loss function as:
l = log p ( w context ( w ) )
The derivative was obtained l as a loss function regarding the vector of the inner point η ( w , j ) as follows:
l v n w , j = l h T v n w , j h T v n w , j v n w , j = h T 1 h T v n w , j
where j = 1,2 , , l ( w ) 1 we define the derivative of l regarding the vector of information contextual of words u as:
l v ( u ) = j = 1 l ( w ) 1 1 h T v n w , j v n w , j
They are mirror images of one another. The CBOW model’s learning goal is to train a word vector that predicts the cantered word inside a certain context; the Skip-gram is used to learn a word vector that predicts surrounding words based on the cantered word. Finally, CBOW feature extraction is an important technique for the task of cyberbullying detection, as it provides a way to capture the context of words and their relationships and reduces the sparsity of text data, making it easier for algorithms to learn and detect cyberbullying.

3.3. Deep Neural Networks (DNN) Baseline Models

This work employed four deep neural network models comprised of Conv1DLSTM, BiLSTM, LSTM and CNN that have been used for cyberbullying detection tasks and examined with the same Twitter dataset. The following sub-sections briefly describe the building models procedure of each DNN baseline model that was utilized for cyberbullying detection.

3.3.1. Long Short-Term Memory and Bidirectional Long Short-Term Memory

LSTM and Bi-LSTM are new variations of RNNs used for processing sequential data, such as natural language, speech, and time-series data. Bi-LSTM is a variant of LSTM that reads the input sequence in both forward and backward directions, thus capturing both past and future context. Bidirectional information helps to improve the accuracy of predictions. The fundamental issue with traditional RNNs is the vanishing gradient problem, which occurs when the gradients of the weights become very small over time, making it difficult for the network to learn long-term dependencies. The purpose of the LSTM architecture is to tackle the issue of preserving and selectively utilizing information from previous time steps in a neural network. To achieve this, LSTM introduces a memory cell that can retain relevant information and control its exposure to the rest of the network when required. This memory cell is regulated by three gates: the input gate, the forget gate, and the output gate. The input gate decides which information should be stored in the memory cell, the forget gate determines which information should be discarded, and the output gate determines which information should be revealed to the remaining components of the network. This mechanism allows the LSTM to learn and maintain long-term dependencies by selectively exposing information from previous time steps to the network when necessary.
Due to the complicated language structure, the weights learned by separate neurons prevent typical DNNs from determining exact representations for the related attributes to cyberbullying tweets. The RNN uses a repetition loop over timesteps to tackle the aforementioned problem circumvent the restriction. A sequence vector x1, …, xn is handled employing a recurrence of the form r t = f α ( r t 1 ,   x t ) , where f indicates the activation function, α is a set of parameters employed at each time step t, and x t is the input at timestep t [36,37]. The parameters defining the connections between the input and hidden layers, as well as the horizontal relationship among activations and the hidden layer to the output layer are allocated for each timestep in a basic recurrent neuron. The forward pass of a primary, recurrent neuron may be represented as follows:
a t = g ( W a a < t 1 > , X t + b a )
y t = f W y . a t + b y
where g reveals the activation function when “t” exemplifies the current timestep. The timestep input reveals by X t , b a defines the bias, and W a presents cumulative weights and timestep t of the activation output denoted by a t . If needed, this a t activation can be utilized to determine the y t estimates at time t.
In addition, DNNs with simple RNN neurons indicate beneficial results in numerous applications. Thus, these neurons remain prone to vanishing gradients and struggle to learn long-term dependencies [36]. In order to solve the gradient disappearance issue and enable the learning of long-term dependencies, the research community has suggested a number of altered recurrent neuron architectures to resolve the simple RNN neuron limitation, such the LSTM method introduced by [38,39].
As previously stated, the work in [40] suggested the LSTM neuron with several enhancements to the design of the simple RNN unit that delivers a strong generalization of GRU. The following are some examples of noticeable variances in the LSTM cell:
  • Standard LSTM units H ¯ t lack the utilization of an importance gate, specifically denoted as Γ r   .
  • LSTM units employ the output gate Γ o   and the update gate Γ u as substitutes for the missing importance gate Γ r   . The output gate determines the value of the hidden state H t in the memory cell, allowing activation outputs to be processed by additional hidden network components.
  • The output gate determines the value of the hidden state H t in the memory cell, allowing activation outputs to be processed by additional hidden network components. The update gate Γ u governs the extent to which the previous hidden state Ht−1 is overwritten to achieve the current hidden state H t . For example, how much memory cell information could be ignored in order for memory cells to work properly.
In practice, the ability of LSTMs to learn long-term dependencies is demonstrated in various sequential data tasks, where the network must use information from previous time steps to accurately predict future time steps. By selectively maintaining information from previous time steps, LSTMs are well-suited for learning long-term dependencies and have been widely used and are highly effective in a variety of sequential data tasks.

3.3.2. Convolutional Neural Network

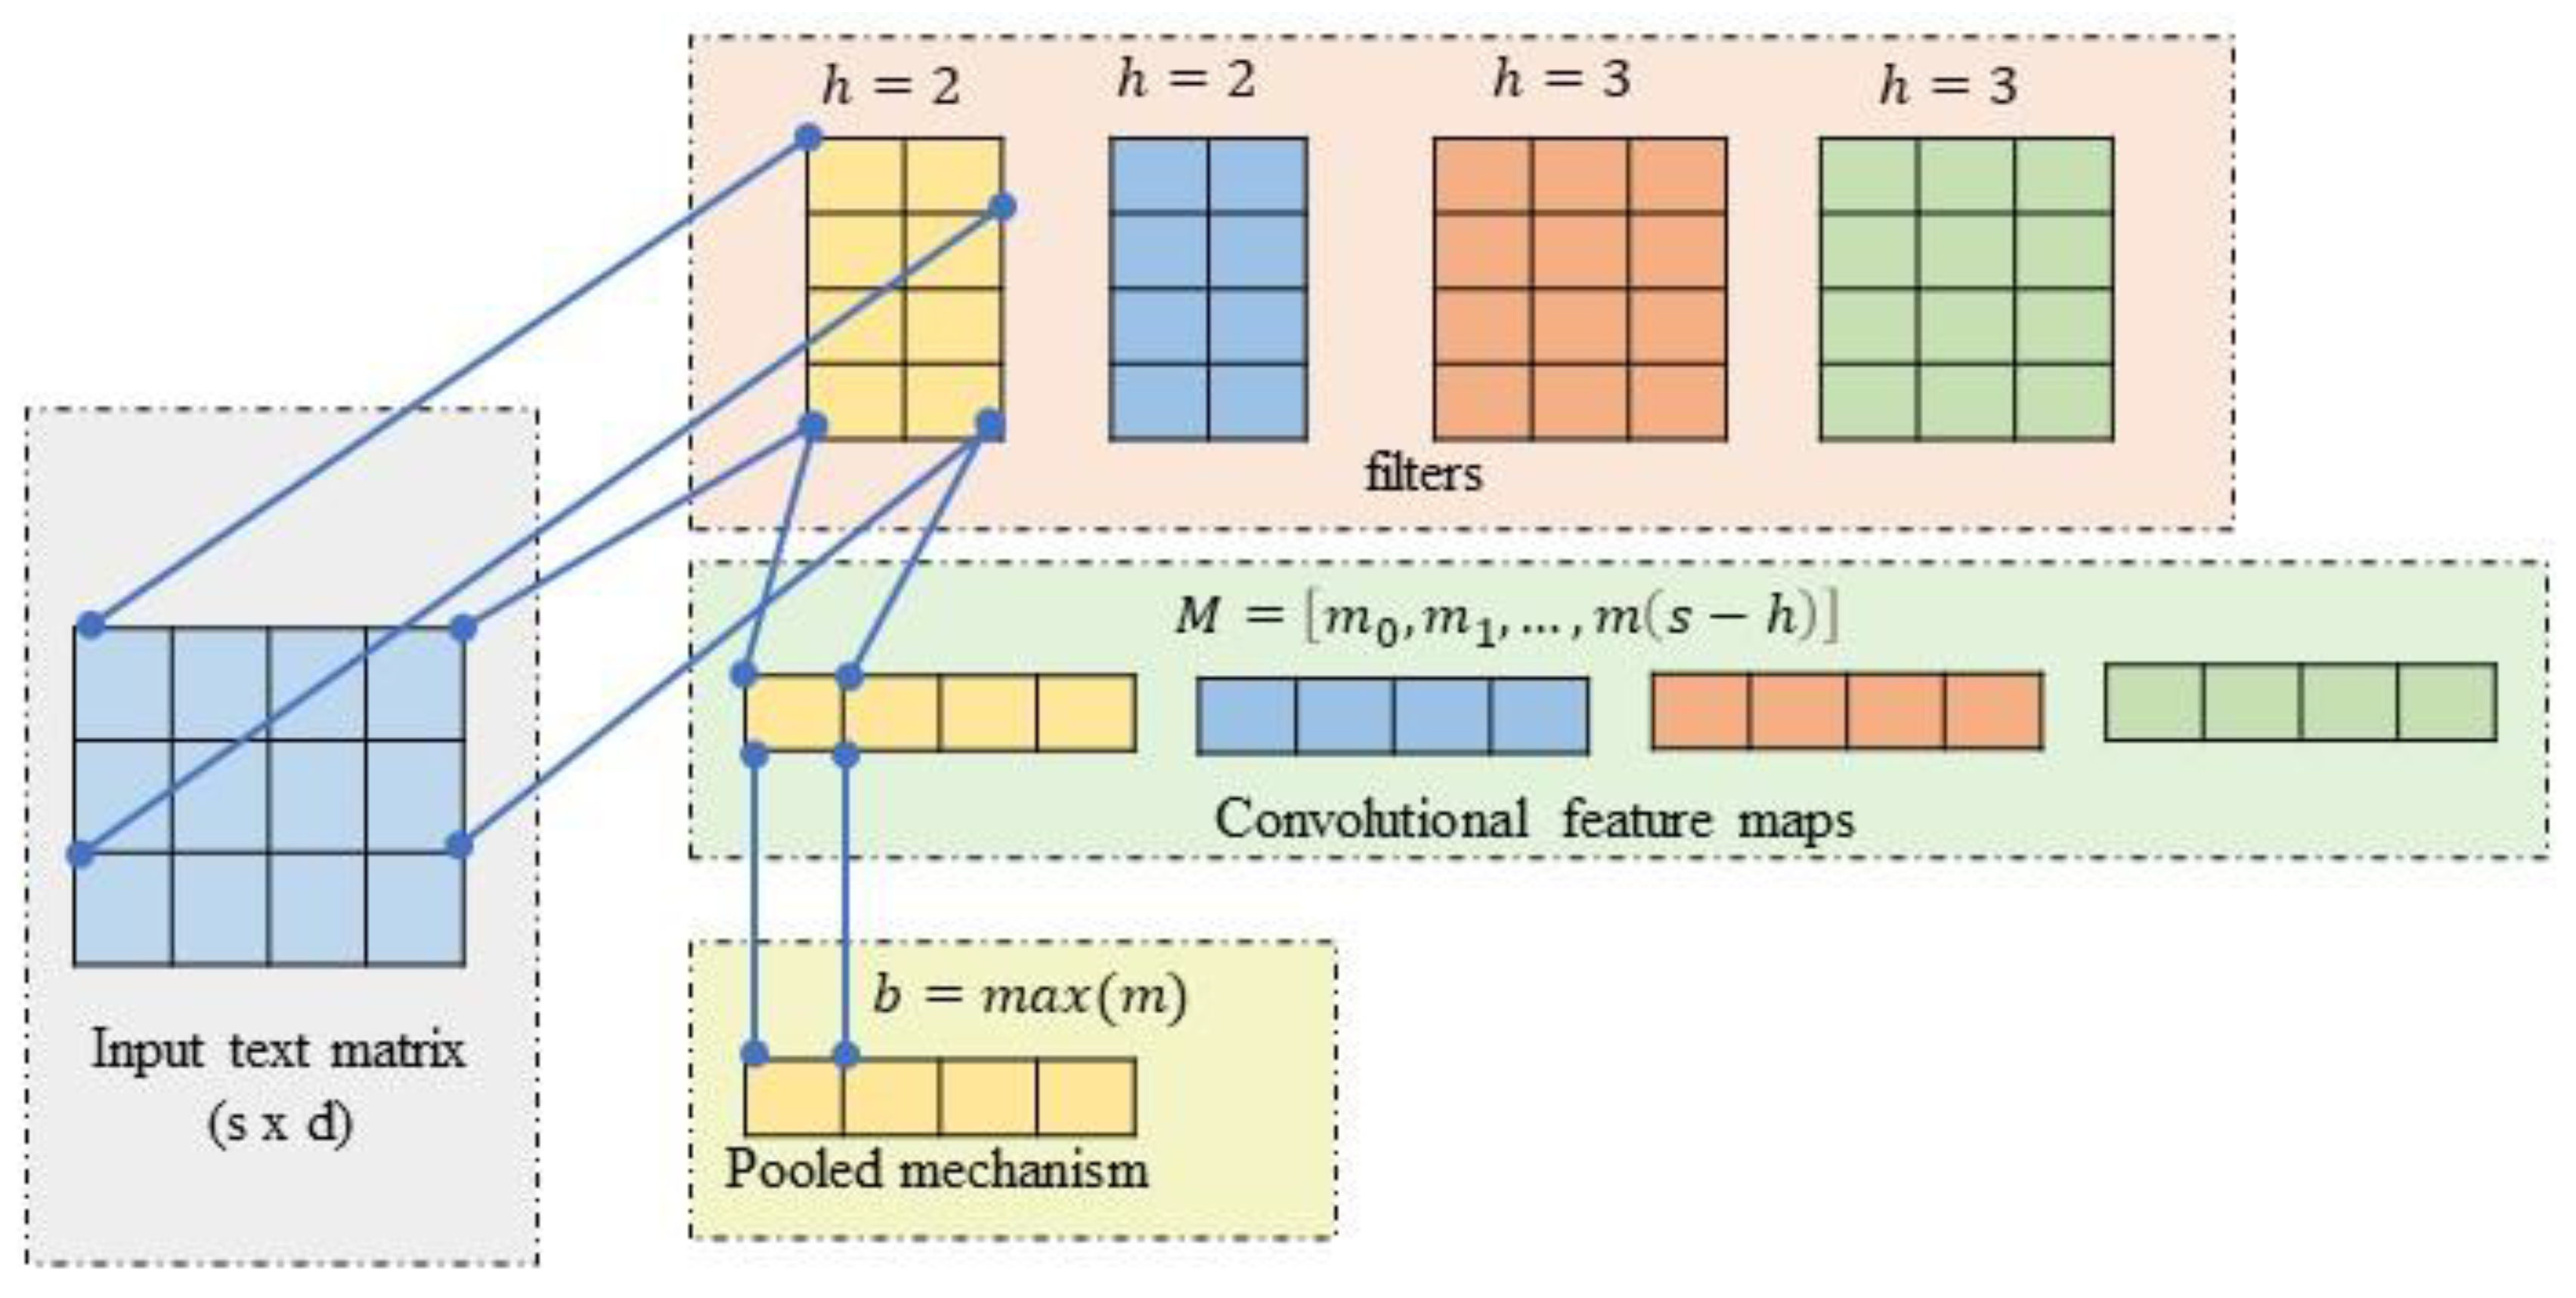
CNNs are intended to tackle learning challenges, including high dimensional input data with complex spatial structures, e.g., data containing images [41], videos [42], time series [43], and sequences prediction [44,45]. Using the fewest trainable parameters possible, CNNs attempt to develop hierarchical filters that can accurately classify massive amounts of incoming data. This transformation is accomplished by facilitating sparse interactions with input data and trainable parameters via parameter sharing. Equivariant representations (also known as feature maps) of the complicated and spatially structured input data are then learned. CNNs comprise various convolution layers. These layers are utilized in NLP applications to better understand the distinctive local features. The study conducted convolution operations on the feature vector from the attention layer by adding a linear filter. For a provided post on social media in a sentence X with distinct x words, first, the embedding vector of size e was generated, then a filter F of size e × h was used repeatedly as a sub-matrix to represent the input data. The results of this generate a feature map M = m 1 , m 2 , , m x h as follows.
m i = F × X i : i + h 1
where i = 0,1 , , x h and X i : j is a sub-matrix of X from row i to j as the popular method is to input feature maps into a pooling or sub-sample layer to increase their dimension. The max-pooling is a regular pooling layer, that chooses the highly significant feature b from the map as follows:
b = m a x 0 i x h m i
The outputs obtained from the pooling layer are concatenated together, resulting in the formation of a pooled feature vector. This pooled feature vector is subsequently employed as the input to the Fully Connected Layer (FCL). Figure 5 shows our extract of the local features.

3.3.3. Fully Connected Layer (FCL)

In an FCL, the feature vector representation derived from the weight vector of the concatenated pooling layers is mapped to the input vector through a weights matrix to learn the bullying data for building the cyberbullying model. The FCL includes multiple dense layers, non-linear activation, SoftMax, and prediction function to obtain the correct bullying classification as follows:
H t = SoftMax w t h t 1 + b t
where w t and b t are parameters learned in training, H t is the obtained from the pooled concatenated feature vector and h t 1 is the feature map received from the CNN layers. The output layer performs the correct classification using the SoftMax function, as in Figure 1. The cross-entropy loss was minimized to learn the model parameters as the training objective using the Adam optimization algorithm [46]. It is provided by:
CrossEntropy ( p , q ) = p ( x ) log ( q ( x ) )
Given a true distribution p , which represents a one-hot vector representing characters in messages posted on social media, and a SoftMax output q , the negative log probability of the true bullies can be computed.

4. Results

4.1. Experimental Setting

This section presents the experiment’s settings along with commentary on their importance. We have used Google Colab GPUs with Python 3.8. The Tensorflow library is used for applications such as computer vision and NLP is used to implement the proposed cyberbullying model and the other baseline models. The objective was to minimize the complexity of the model by removing unnecessary elements, such as the number of hidden nodes, and in the dense layer by finding optimal hyperparameters [47]. An input matrix of 35,873 tweets was constructed to divide the raw input data into tokens, which helped the cyberbullying model to understand the context and interpret the vital information in the text by analyzing the word sequence using tokenization in the Tensorflow library. A preprocessing step was applied before tokenization by removing irregular text formats, text content loss, and incomplete and duplicate documents. Words in the text adding no meaning to the sentence were ceased; they would not affect text processing for the defined purpose and be removed from the vocabulary to reduce noise and the dimension of the feature set. Table 2 shows the experimental parameters and layers of the proposed model.
The word2vec with CBOW concatenated formed the weights in the embedding layer. The 87 dimension of word2vec was trained on word vectors of 149 words from a Twitter cyberbullying dataset and 233 words from mixture dataset. In the proposed DL methods, each neuron spanned between 32 and 256 memory units with a step size of 32, but the stacked model provided an optimum value with the Adam optimization in the Tensorflow library. The library was used to establish the optimum value while restricting the number of iterations to a low value. The maximum number of trials was between five and ten, corresponding to two to three per execution trial, with a dropout of 0.25. For the convolutional layer filters, we have tuned all the layers in each stacking model with the range of 32–132 with kernel sizes of two and four to provide the optimum values. The size of the fully connected layer was 132, initializing word embeddings using Glorot uniform initialization [48] for the model to converge over a SoftMax classifier. The entire model was trained for 20 epochs using the Adam stochastic optimizer. A mini-batch size of 42 yielded better performance for tweets datasets when the class label had over 10 or 20 words; however, the learning rate of 0.001 was adaptive, starting from 0.001 to 0.1 and the dropout of 0.25 was constant throughout the training datasets, irrespective of the class label. The SoftMax function was employed in the output layer without the hashing trick. We followed the statute for the rest of the model, but we changed the model types, for example, instead of Conv1D we changed it with LSTM, or BiLSTM, etc. Finally, the training process was accelerated on the dataset with a class label of less than 50 by setting the learning rate, embedding size, mini-batch size, and the number of epochs to 0.001, 50, 42, and 20, respectively.
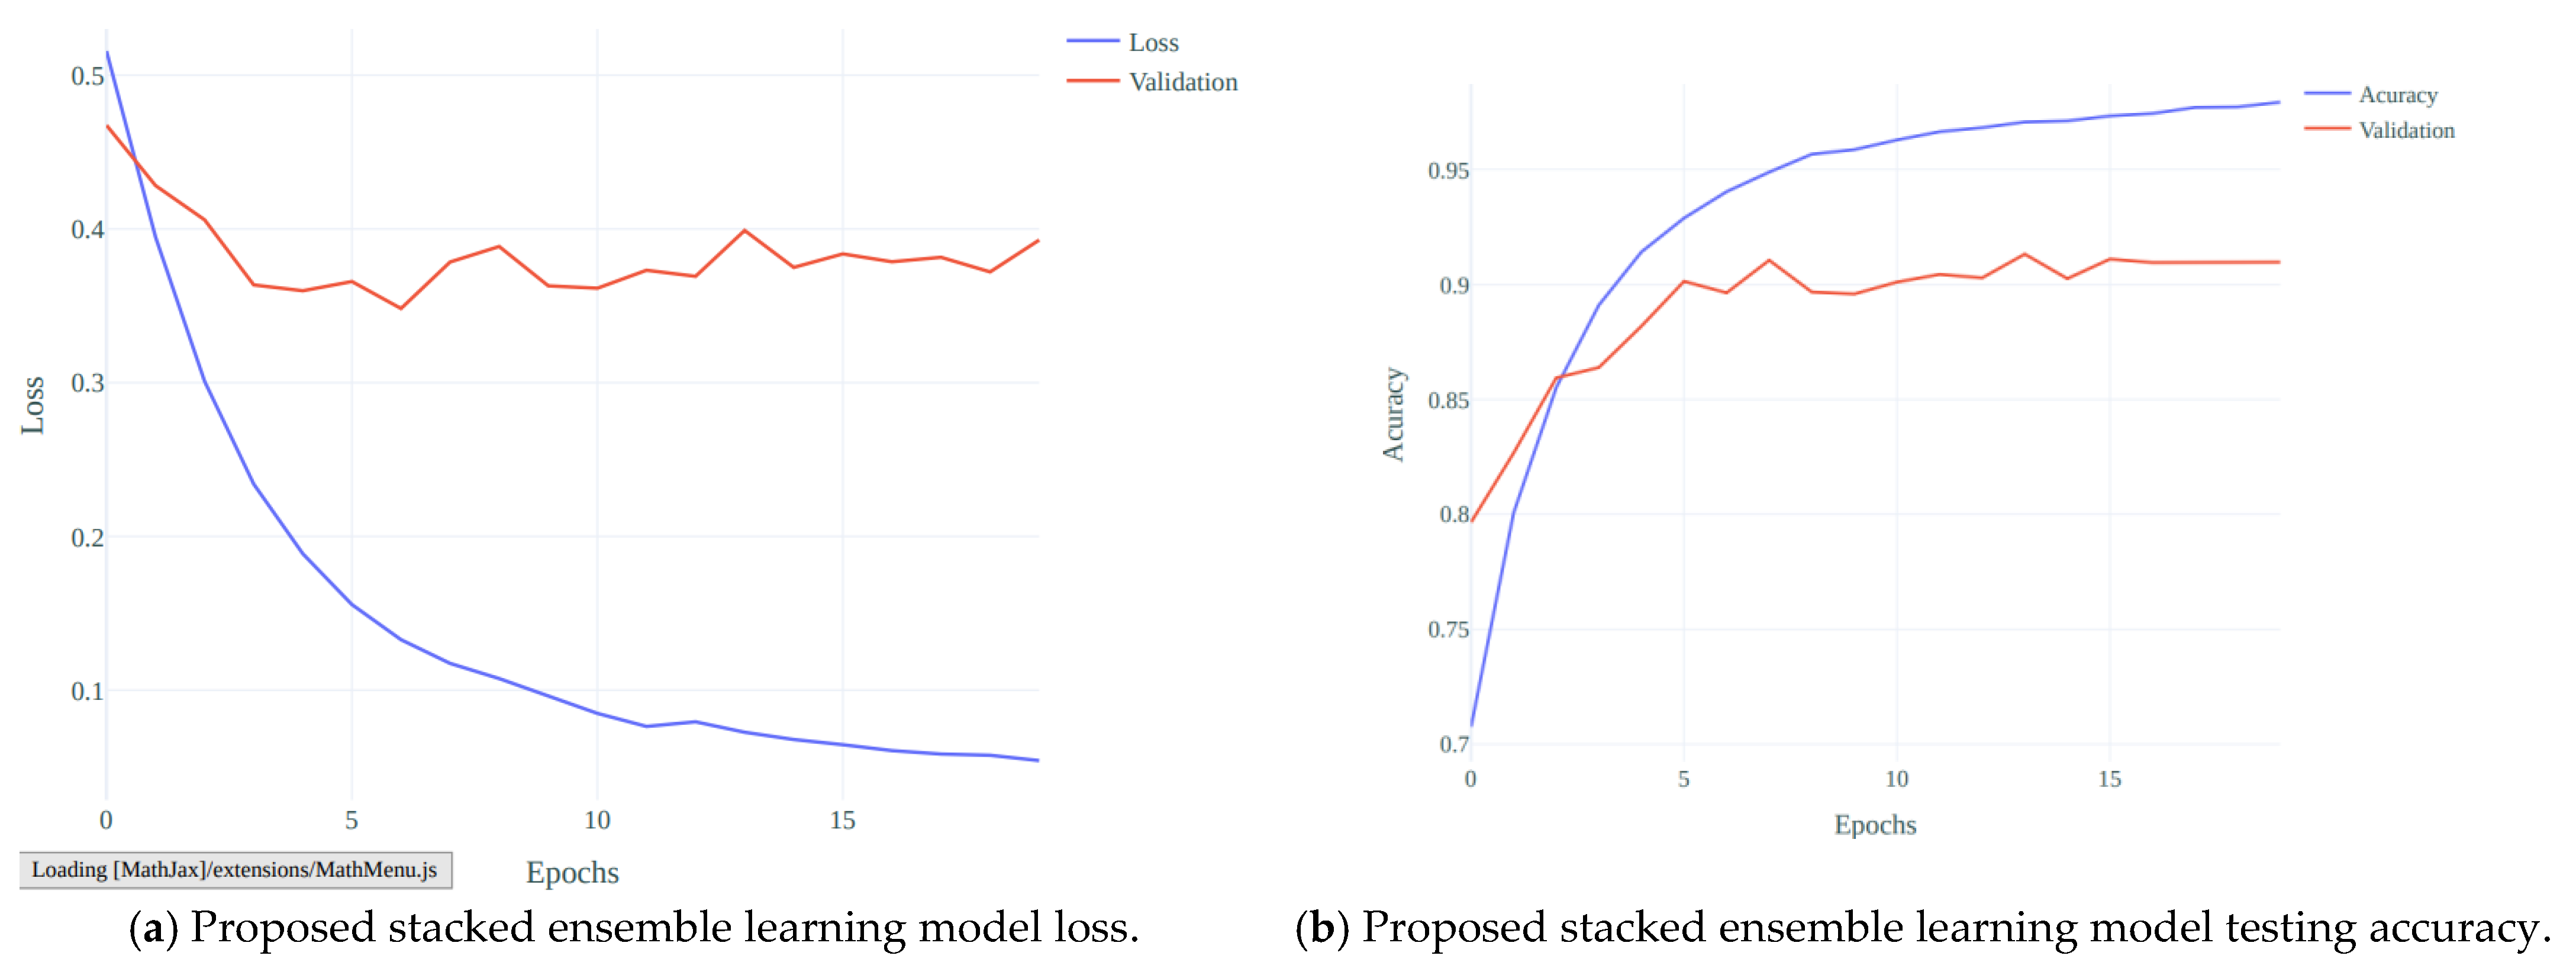
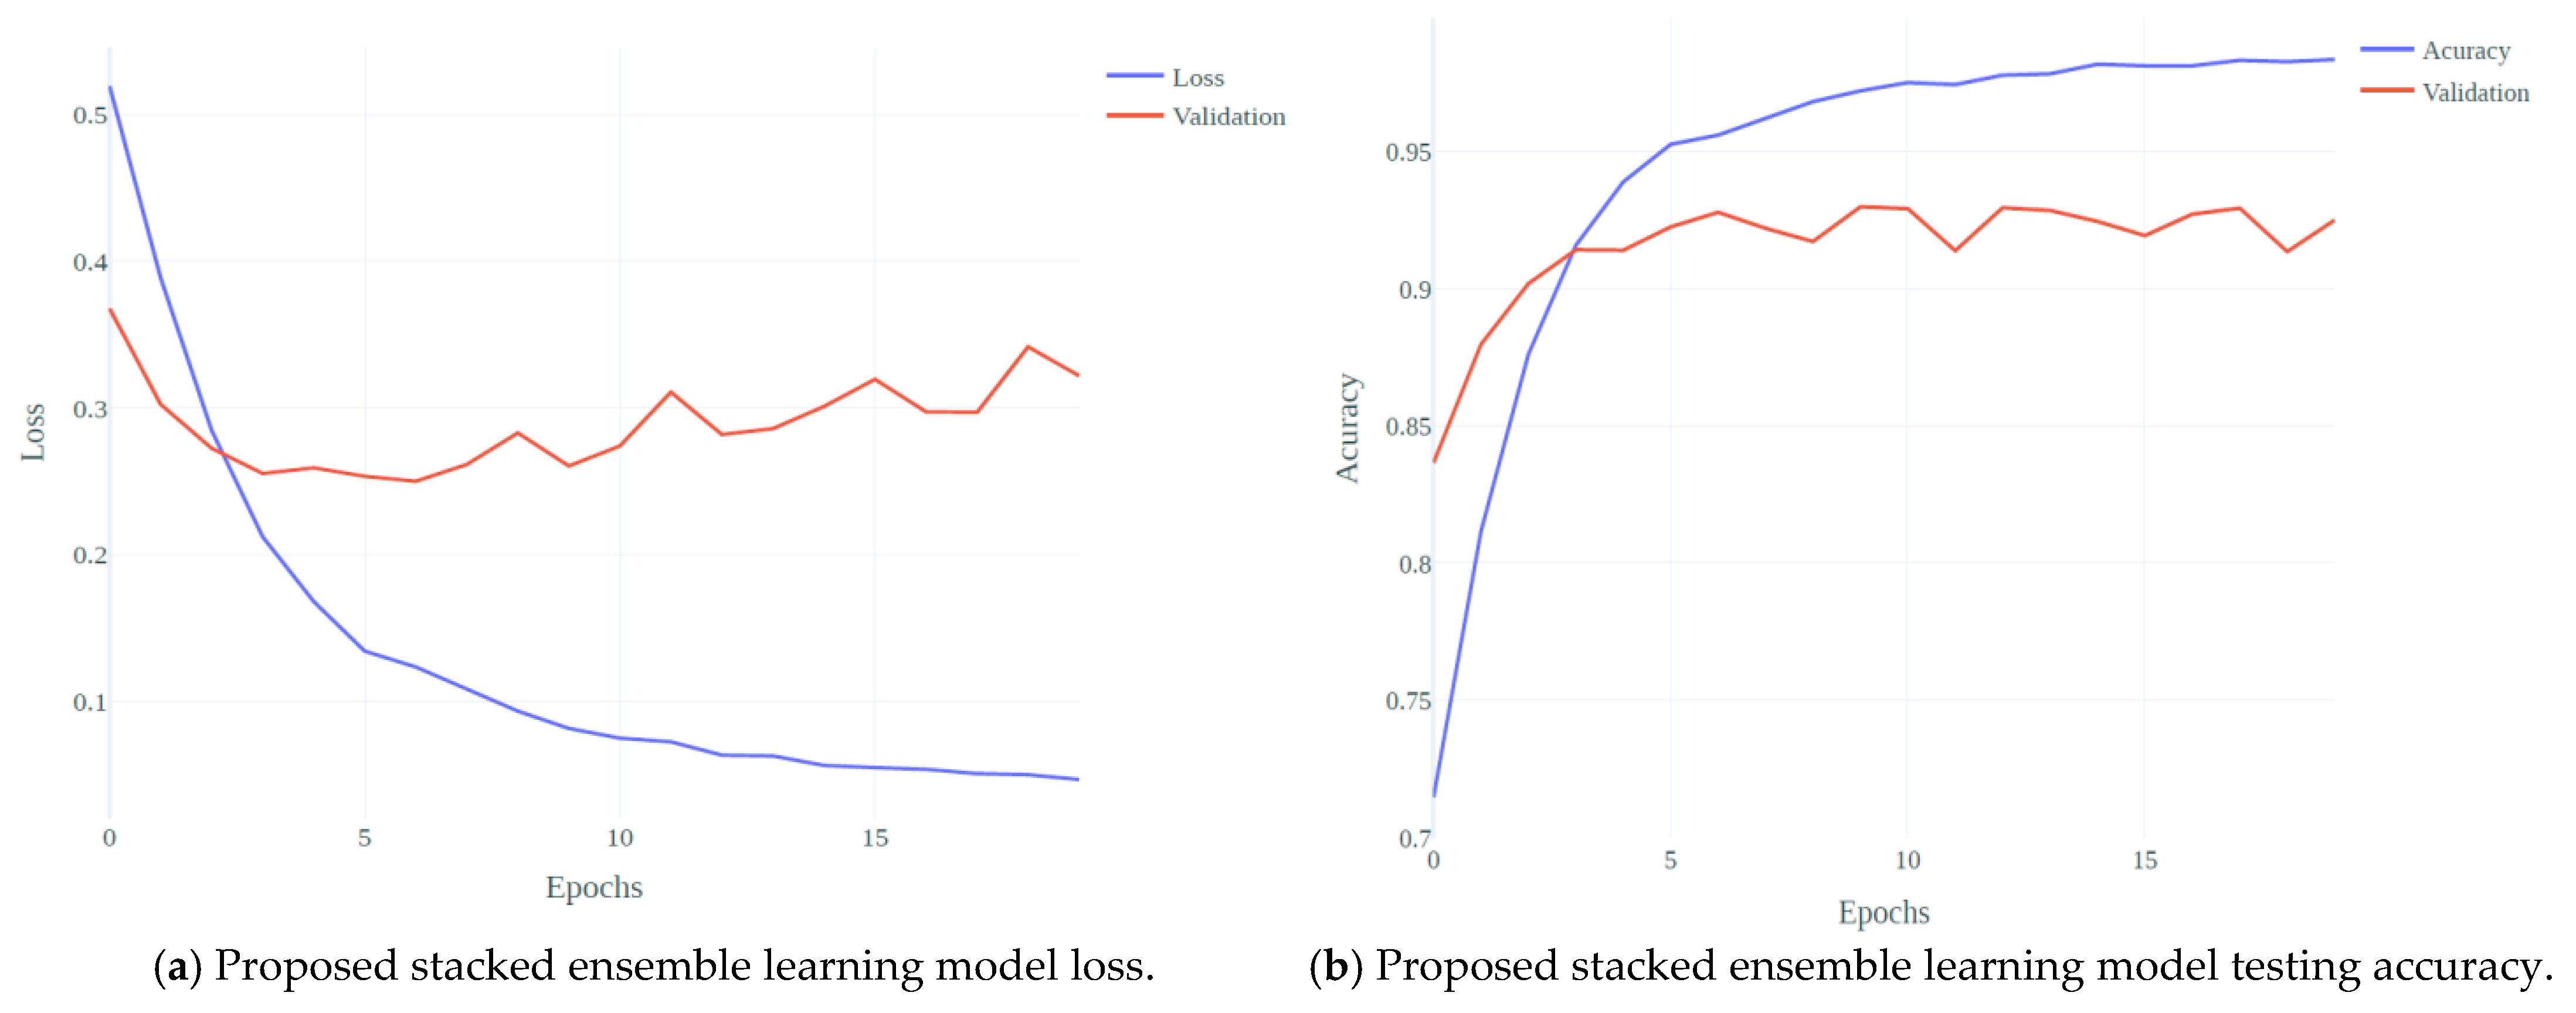
Finally, the five-fold cross-validation all at once and early stopping with monitoring validation loss in max mode with the patience of five trials were applied in the training process to prevent overfitting problems. The proposed stacked ensemble model, loss against model validation, is presented in Figure 6a, and the stacked model accuracy against model validation is shown in Figure 6b. The experimental results of the baseline models, ensemble stacked model, baseline BERT and modified BERT are discussed in the following sub-sections:
Additionally, we have conducted another experiment to test and validate our proposed stacked ensemble model performance on different social media platforms datasets collected from the literature, and it is based on Twitter and Facebook groups. This dataset is based on suspicious activities such as racism, discrimination, abusive language, threatening, which mostly comes in cyberbullying. The proposed model was trained on 20 epochs (with the same experimental setup explained earlier) and the model loss against model validation is presented in Figure 7a. The stacked model accuracy against model validation is shown in Figure 7b. The experimental results of the baseline models, ensemble stacked model, baseline BERT and modified BERT are discussed in the following sub-sections:

4.2. Accuracy, Precision, Recall and F1-Score

This study focused on evaluating the effectiveness of a proposed model in distinguishing cyberbullying from non-cyberbullying by employing various assessment metrics. Different deep learning-based cyberbullying detection models, including the stacked model, BERT, and a modified BERT model, were developed as part of this research. Evaluation criteria play a crucial role in understanding the functionality of competing models in the scientific community. The following evaluation criteria are commonly used to assess the performance of cyberbullying classifiers for social media networks, e.g., Twitter or Facebook:
  • Accuracy measures the proportion of correctly classified tweets compared to the total number of tweets for cyberbullying prediction models. Accordingly, the following calculation may be used.
  • Accuracy = ( t p + t n ) ( t p + f p + t n + f n )
    where fp stands for false positive, fn for false negative, tp for true positive, and tn for true negative.
  • Precision measures the proportion of correctly identified positive samples out of all positive predictions.
  • Recall is a metric that quantifies the proportion of relevant tweets that were successfully retrieved among all the relevant tweets in a given dataset or search.
  • F1-score indicates the harmonic means of precision and recall, representing the balance between these two metrics.
The three assessment metrics mentioned above have widely been used in the literature to assess cyberbullying prediction models. They are computed as follows:
Precision = t p ( t p + f p ) ,
Recall = t p ( t p + f n ) ,
F 1 - score = 2 × p r e c i s i o n × r e c a l l r e c i s i o n + r e c a l l

4.3. Performance Result of Baseline Models

The proposed baseline models are shown in Table 3. Firstly, we experimented with the four baseline models Conv1DLSTM, BiLSTM, LSTM and CNN implementing a word2vec-based CBOW feature extractor on the Twitter dataset, and the baseline models’ performance has been recorded and tabulated as demonstrated in Table 3. The Conv1DLSTM model has outperformed other predictors with an accuracy of 0.8649, precision of 0.8142, recall of 0.7281 and F1-score of 0.8281. Therefore, the BiLSTM baseline model has obtained the lowest performance in detecting cyberbullying with an accuracy of 0.7795, precision of 0.8373, recall of 0.8130 and F1-score of 0.8041. Based on the four-baseline model, our proposed staked ensemble model outperformed both the baseline BERT model (0.921) and the modified BERT version (0.9384), where it achieved an accuracy of 0.974.
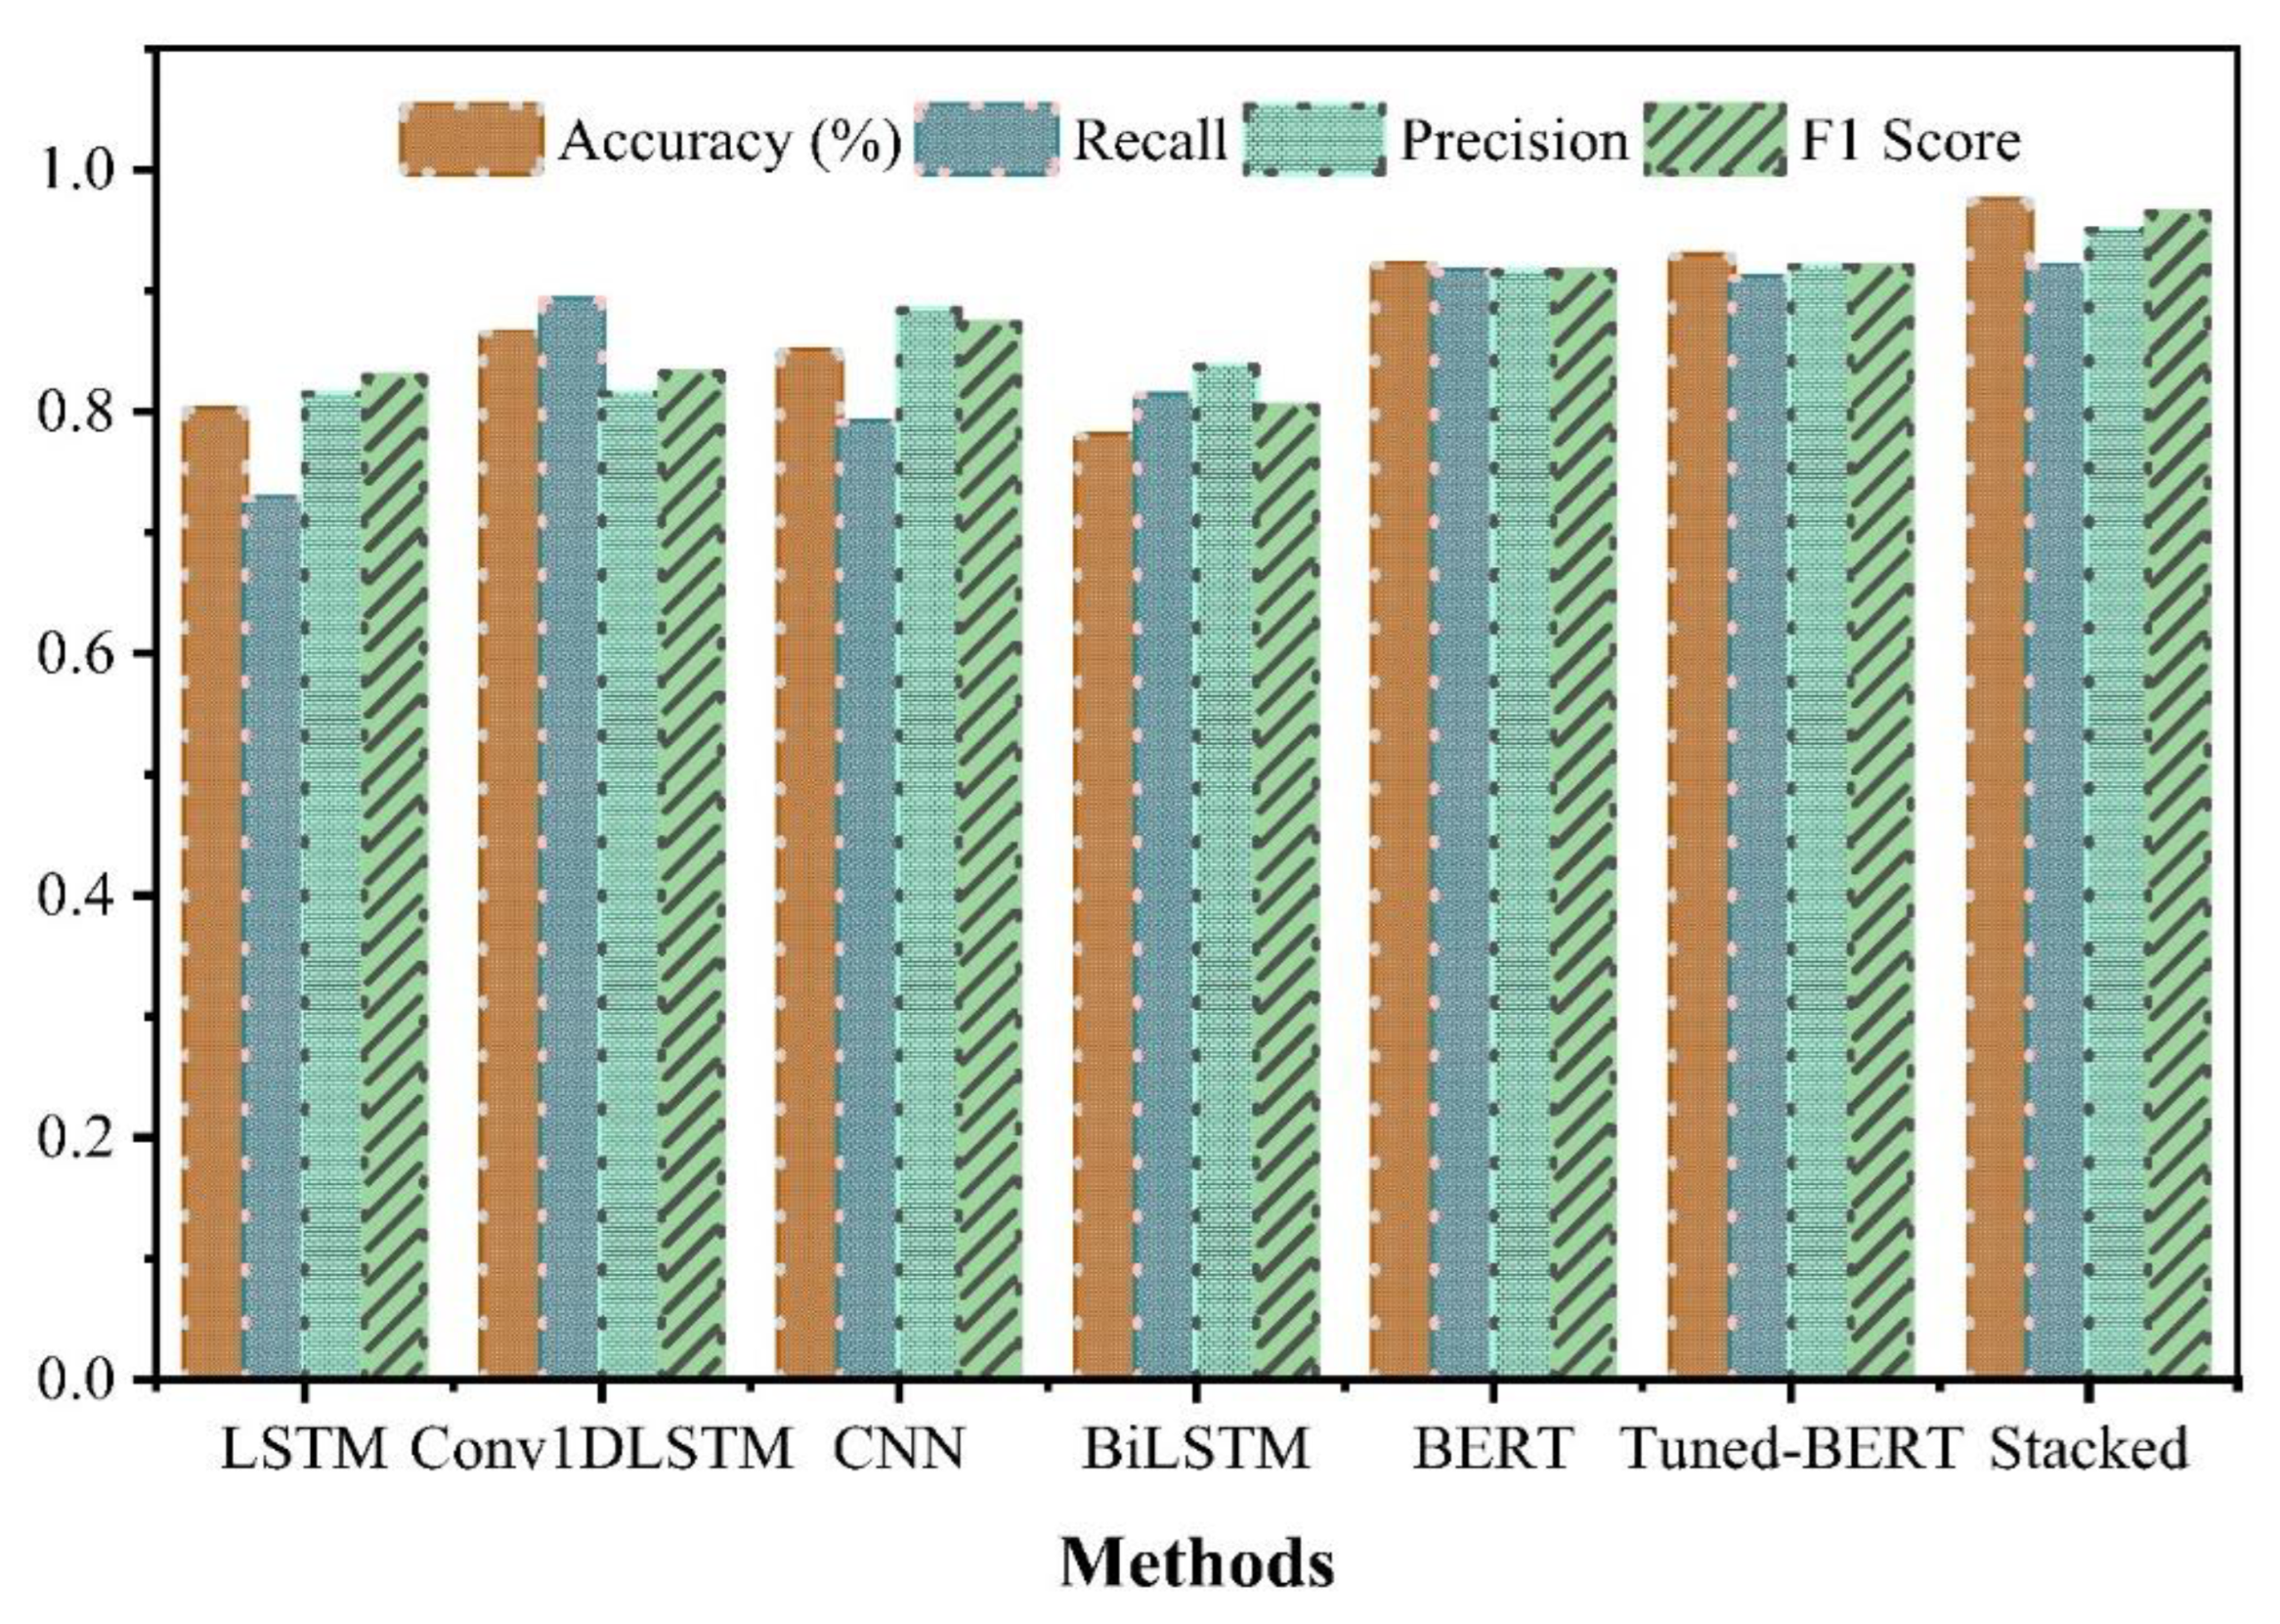
Figure 8 shows our proposed deep learning models, the stacked ensemble model, BERT, and modified BERT. The stacked model architecture, where multiple models are trained and combined to improve the overall accuracy, has outperformed the state-of-the-art BERT model and fine-tuned BERT models, which are pre-trained BERT models that are further trained on a specific task, have also been proposed for cyberbullying identification. Our proposed staked ensemble model achieved an accuracy of 0.974, precision of 0.950, recall of 0.92 and F1-score of 0.964 in detecting cyberbullying.
Additionally, we have tested our models’ performance on a social media platforms dataset (Twitter and Facebook). Table 4 compares the baseline and proposed models on the Facebook dataset in terms of accuracy, precision, recall, and F1-score. Tuned-BERT slightly outperformed both the BERT and stacked models with the highest accuracy of 91.98% and a superior precision, recall, and F1-score. However, it takes 41 min and 23 s, while the proposed stacked model achieves 90.97% accuracy in just 2 min and 45 s, making it a more efficient choice for certain applications.

4.4. Precision-Recall Curve

Precision-recall curves are commonly employed for evaluating the performance of stacked ensemble learning models in binary classification problems, including cyberbullying detection. The precision-recall curve is a graphical representation of the trade-off between precision and recall for different classification thresholds. Precision is the fraction of true-positive predictions among all positive predictions, while recall is the fraction of true-positive predictions among all actual positive instances. These two measures provide a balanced evaluation of the model’s performance by considering both false positive and false negative predictions. The precision-recall curve is created by plotting precision against recall for different classification thresholds. The Area Under the Precision-Recall Curve (AUPRC) is often utilized as a single metric to summarize the performance of the model, where a larger AUPRC indicates a better overall performance. Precision tests the relevance of the expected positive outcomes. At the same time, recall measures the model’s ability to predict positive samples. Both have a high ratio of true positives (high precision) when predicting most positive-type samples in the dataset (high recall). Precision-recall plots allow users to accurately forecast future classification results since they measure the proportion of positive predictions that are true positives [49]. In precision-recall space, the closer a predictor’s score is to the perfect classification point (1,1), the better the predictor performs, and the closer its score is to zero, the worse the predictor performs. Figure 9 shows the model performance for cyberbullying detection in terms of precision-recall measures, respectively.
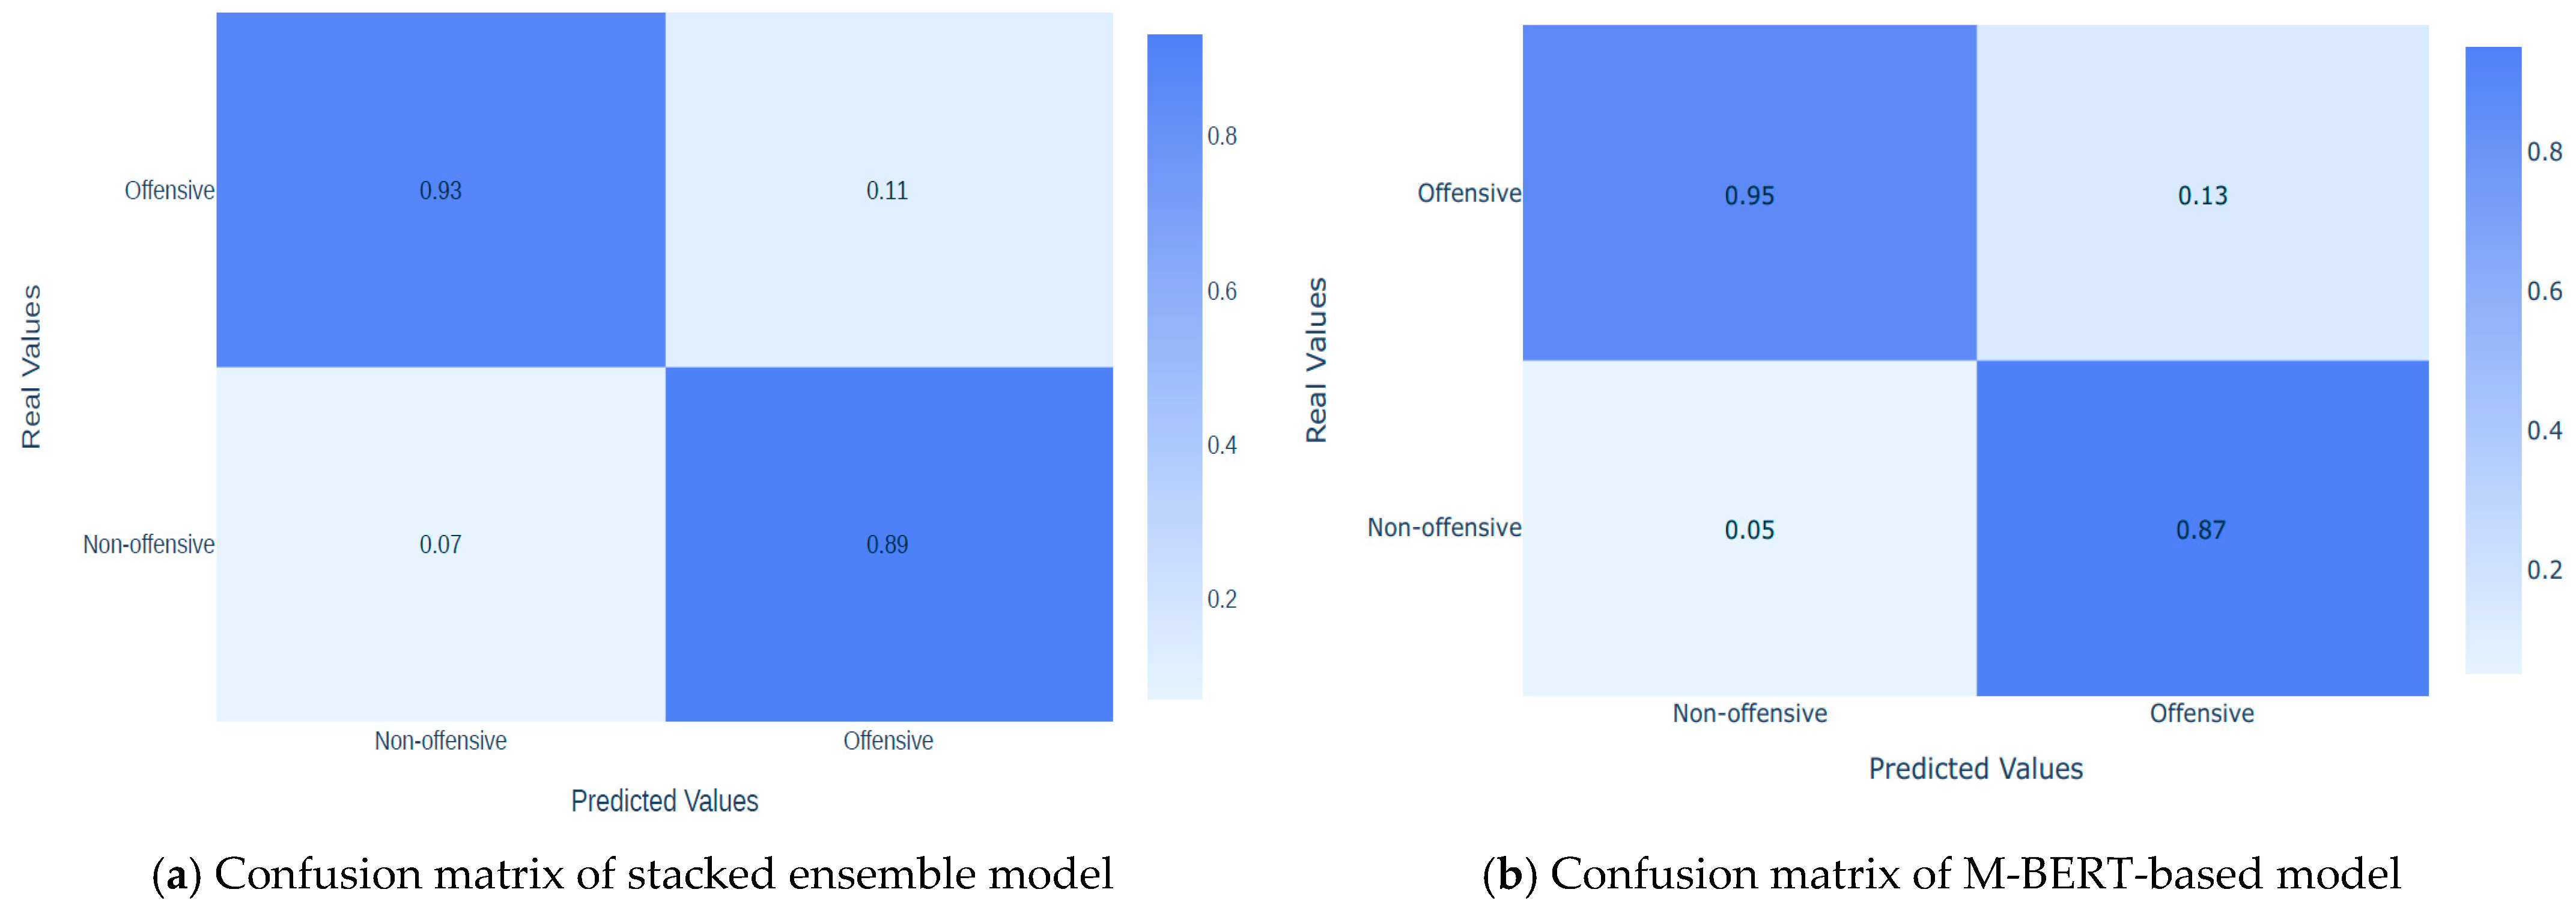
Other critical evaluation matrices utilized in the proposed work are the Receiver Operating Characteristics curve (ROC) and precision-recall curves. A ROC curve is a beneficial two-dimensional depiction of the trade-off between the true-positive and false-positive rates. During the training process, each DL model was tested on a different collection of test data that was not utilized during the training phase. The data was built this way to ensure outcomes are equal and test the detectors’ generalization capabilities. Figure 10 shows confusion matrices of the two best models’ evaluation metrics extracted from a matrix that includes four terms:
True-positive (TP): if the tweets include offensive text, the prediction is true positive, and the model prediction conforms with the presence of the offensive word.
False-positive (FP): if the tweets contain non-offensive text, the outcome is considered false positive, but the model under consideration predicts the existence of a non-offensive tweet.
False-negative (FN): if the tweets have offensive words, but the model negates the presence of offensive words, the effect is a false negative.
True-negative (TN): if the tweets do not contain offensive words and the tested model also predicts that there are no such offensive words, then true negative is the consequence.

4.5. Area under the Curve (AUC)

The Area Under the Curve (AUC) is a commonly used evaluation metric for binary classification problems, such as cyberbullying detection on social media. The AUC represents the overall performance of a classifier by measuring the trade-off between the True-Positive Rate (TPR) and the False-Positive Rate (FPR) across all possible threshold values. In the context of cyberbullying detection, the TPR represents the fraction of actual bullying instances correctly identified by the classifier, while the FPR represents the fraction of non-bullying instances falsely identified as bullying. AUC ranges between 0 and 1, where a perfect classifier would have an AUC of 1, indicating that all actual bullying instances are correctly identified and no non-bullying instances are falsely identified as bullying. A classifier with an AUC of 0.5 would be considered random, indicating that it performs no better than chance in classifying instances as bullying or not.
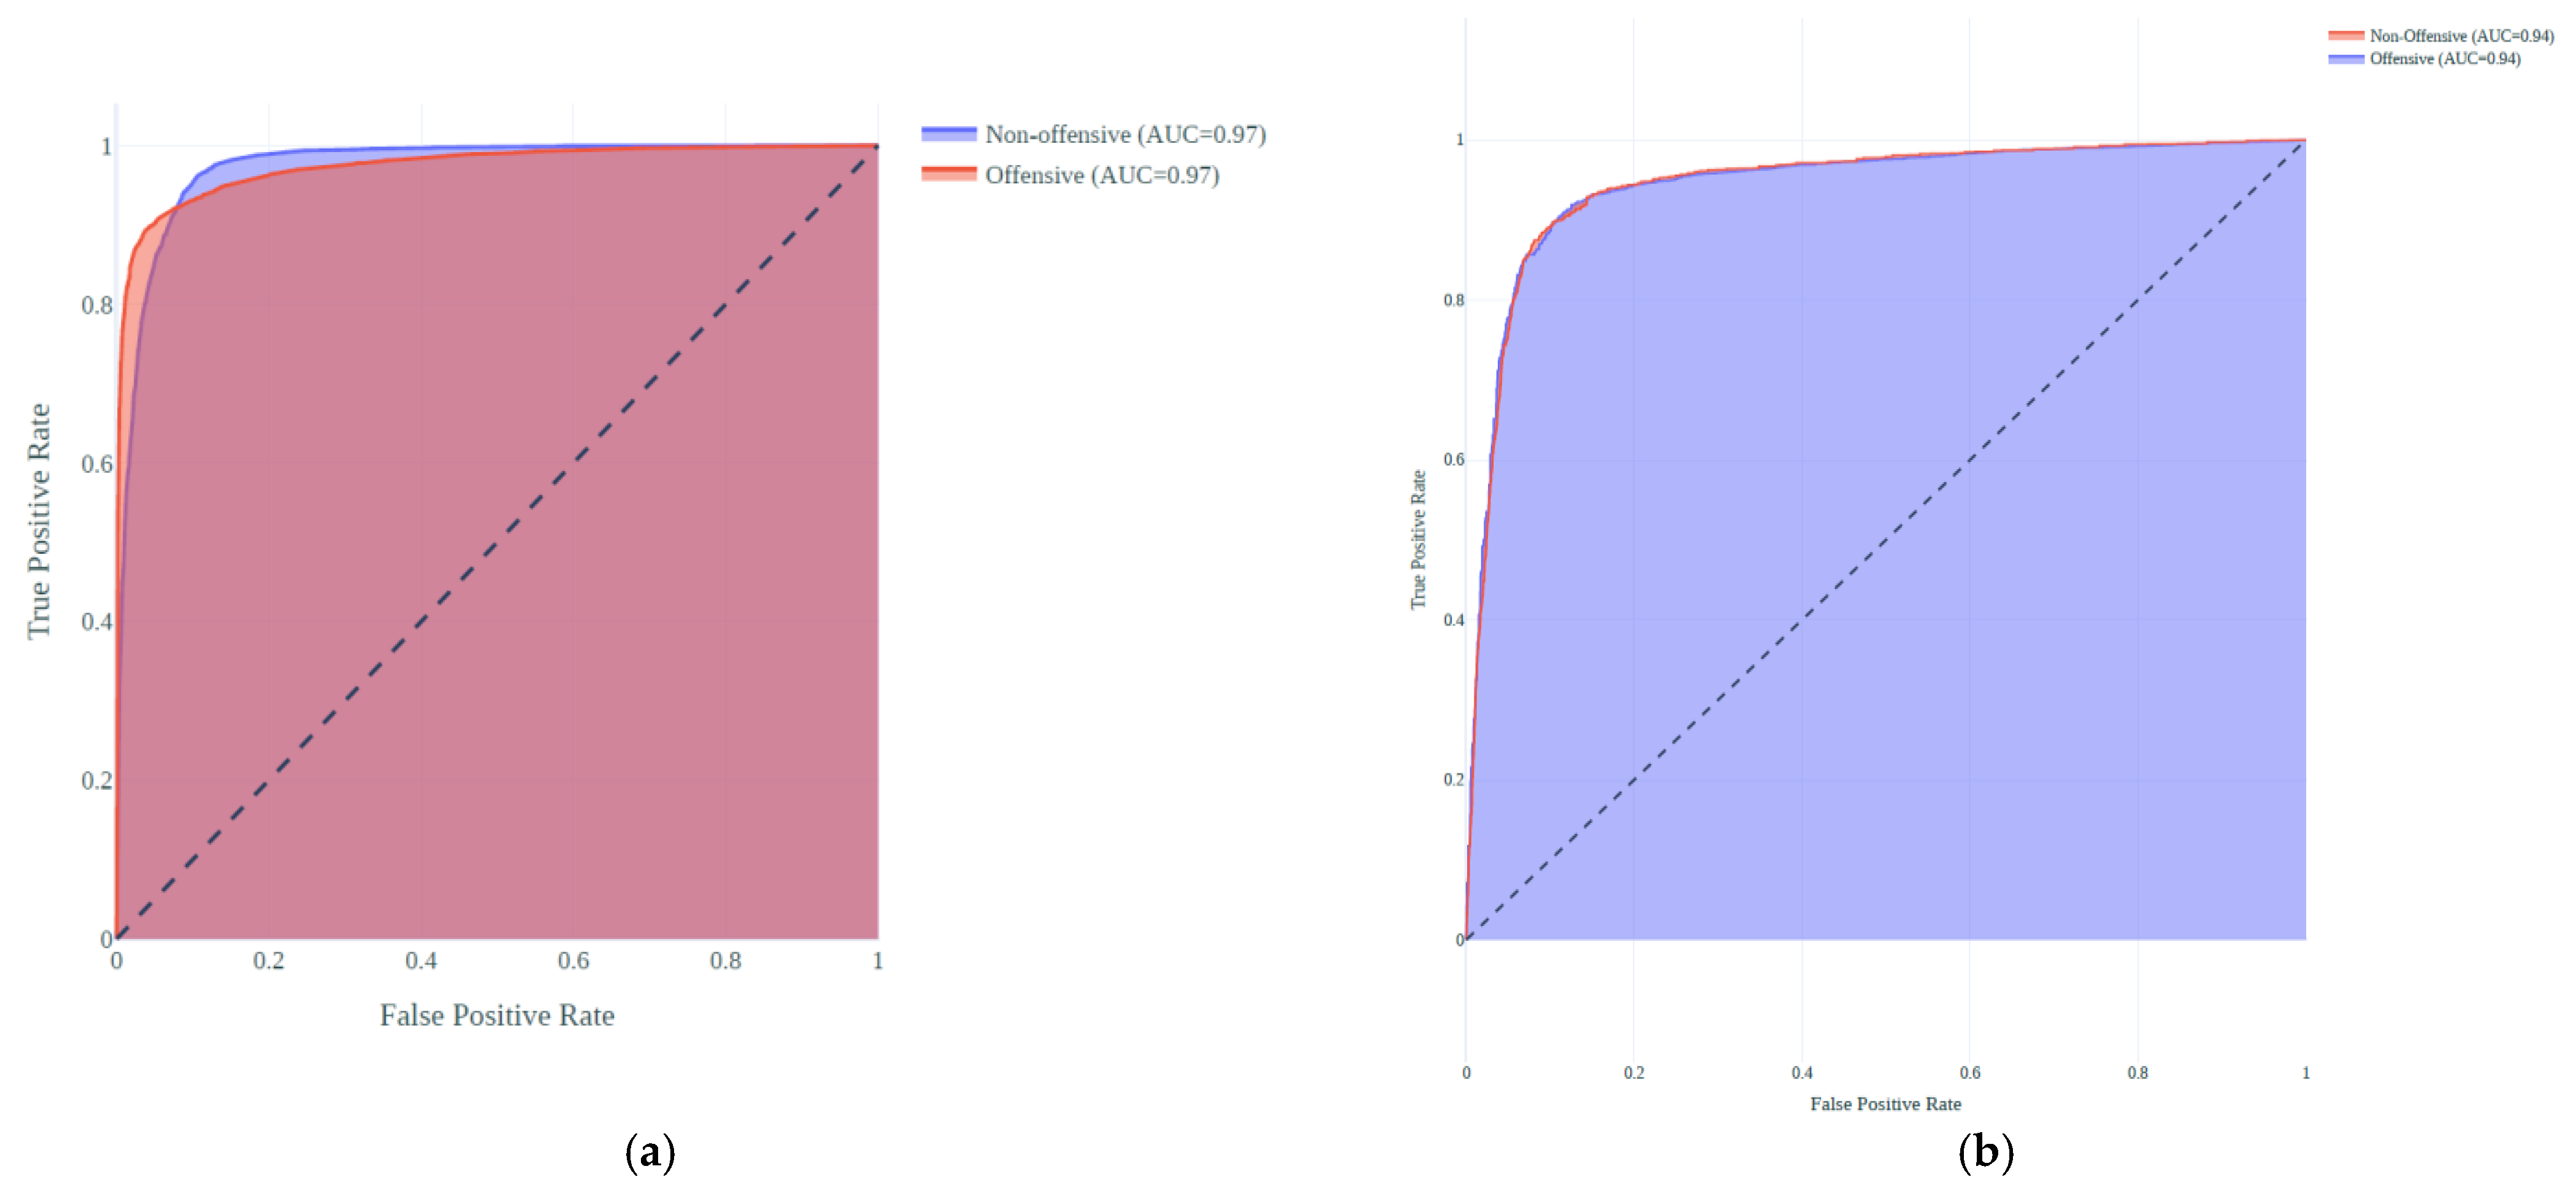
Additionally, the greater the AUC, the better the model’s efficiency in differentiating the positive and negative samples [50]. Figure 11 shows AUC curves for the stacked ensemble model in our study, where (a) demonstrates the model’s performance in our own cyberbullying Twitter dataset and (b) demonstrates the model’s performance in terms of AUC for the mixed social platform dataset with 0.97 and 0.94, respectively.

4.6. Comparison of Proposed Models’ Complexity and Statistical Analysis

The proposed work utilizes three DL classifier models with a word2vec-based CBOW feature extractor. Table 5 presents the results of a study comparing different models in terms of accuracy and time complexity.
The first model, “BERT baseline,” achieved an accuracy of 92.1%. BERT (Bidirectional Encoder Representations from Transformers) is a widely used pre-trained language model known for its effectiveness in various natural language processing tasks. The time complexity for this model was 1 h and 6 min, indicating the amount of time it took to process the data. The second model, “Modified-BERT,” performed slightly better, with an accuracy of 92.84%. This suggests that modifications or enhancements were made to the original BERT model to improve its performance. The time complexity for this model was slightly lower than the baseline, requiring 1 h and 2 min to process the data. The third model, “Proposed stacked,” achieved the highest accuracy of 97.4% among the models compared. This suggests that the proposed stacked model, which likely combines multiple models or layers, yielded superior performance. Notably, the time complexity for this model was significantly lower than the previous two models, requiring only 3 min and 9 s to process the data. Similarly, the experimental results of the second dataset (Table 6) demonstrate that the modified-BERT slightly outperforms the baseline with 91.98% accuracy in 41 min and 23 s, while the proposed stacked achieves 90.97% accuracy in just 2 min and 45 s, making it a more efficient choice for certain applications.

4.7. Comparison with Literature

Table 7 presents a comparative analysis of different algorithms for cyberbullying detection on the Twitter dataset. The evaluation metrics include accuracy, precision, recall, and F1-score, which are commonly used to assess the performance of classification models. The results show the performance of various algorithms in terms of their ability to correctly classify instances of cyberbullying with the available methods in the literature that used the same dataset to ensure fairness.
Thus, the proposed method presents significant advancements in the field of cyberbullying detection on social media platforms (Twitter and Facebook). The study addresses the growing concern surrounding cyberbullying and emphasizes the importance of early detection and intervention to mitigate its harmful effects on individuals and society. The advancement of the proposed method lies in its innovative use of ensemble stacking learning and the effective feature extraction process. By achieving superior accuracy and efficiency in detecting cyberbullying, the study contributes significantly to the field of cyberbullying detection and reinforces the importance of combining multiple models for improved results. The feature extraction process plays a vital role in the proposed method’s success. By employing CBOW and Skip-gram to form the weights in the embedding layer, the model gains the ability to capture meaningful linguistic features from the datasets. The convolutional and pooling mechanism further reduces the dimensionality of features while preserving the position-invariant characteristics of offensive words. This approach enhances the model’s ability to accurately identify and classify cyberbullying content within the tweets.

5. Conclusions

The field of cyberbullying detection has seen significant advances in recent years, with ensemble learning playing a crucial role. The use of multiple deep learning methods, such as LSTM, Conv1DLSTM and CNN, has proven to be effective in detecting cyberbullying on social media platforms such as Twitter (currently known as X) and Facebook. In this study, we aim to evaluate our proposed method performance in two different datasets. The proposed stacked ensemble learning methods have shown promising results in terms of accuracy, precision, recall, F1-score and detection time, demonstrating their ability to identify and classify offensive language on social media. However, there is still much room for improvement in terms of developing a more robust and accurate ensemble learning approach for cyberbullying detection. The limitations of current methods, such as limited generalizability, highlight the need for further research in this field. To this end, future work should focus on incorporating additional feature extraction techniques and advanced deep-learning models to enhance the performance of cyberbullying detection systems. Lastly, the results of this research contribute to the growing body of knowledge on cyberbullying detection and highlight the potential of stacking ensemble learning methods to address this critical social issue.

Author Contributions

Conceptualization, A.M. and M.G.R.; methodology, A.M.; software, M.G.R.; validation, A.M., M.G.R. and A.A. (Alawi Alqushaibi); formal analysis, A.A. (Ayed Alwadain); investigation, A.M. and A.A. (Alawi Alqushaibi); resources, A.A.; data curation, A.M. and M.G.R.; writing—original draft preparation, A.M.; writing—review and editing, A.A. (Ayed Alwadain); visualization, A.M. and A.A. (Alawi Alqushaibi); project administration, A.M.; funding acquisition, A.M. All authors have read and agreed to the published version of the manuscript.

Funding

The authors extend their appreciation to the Deputyship for Research & Innovation, Ministry of Education in Saudi Arabia for funding this research work through the project no. (IFKSUOR3–057-1).

Data Availability Statement

The data source code for this study is publicly available in https://github.com/mogragab/cyber-bullying-detection (accessed on 16 August 2023)”.

Conflicts of Interest

The authors declare no conflict of interest.

References

  1. Balakrishnan, V. Cyberbull ying among young adults in Malaysia: The roles of gender, age and Internet frequency. Comput. Hum. Behav. 2015, 46, 149–157. [Google Scholar] [CrossRef]
  2. Bozzola, E.; Spina, G.; Agostiniani, R.; Barni, S.; Russo, R.; Scarpato, E.; Di Mauro, A.; Di Stefano, A.V.; Caruso, C.; Corsello, G. The use of social media in children and adolescents: Scoping review on the potential risks. Int. J. Environ. Res. Public Health 2022, 19, 9960. [Google Scholar] [CrossRef] [PubMed]
  3. Junke, X. Legal Regulation of Cyberbullying—From a Chinese perspective. In Proceedings of the 2020 IEEE International Conference on Dependable, Autonomic and Secure Computing, International Conference on Pervasive Intelligence and Computing, International Conference on Cloud and Big Data Computing, International Conference on Cyber Science and Technology Congress (DASC/PiCom/CBDCom/CyberSciTech), Calgary, AB, Canada, 17–22 August 2020; pp. 322–327. [Google Scholar]
  4. Vismara, M.; Girone, N.; Conti, D.; Nicolini, G.; Dell’Osso, B. The current status of Cyberbullying research: A short review of the literature. Curr. Opin. Behav. Sci. 2022, 46, 101152. [Google Scholar] [CrossRef]
  5. Subaramaniam, K.; Kolandaisamy, R.; Jalil, A.B.; Kolandaisamy, I. Cyberbullying challenges on society: A review. J. Posit. Sch. Psychol. 2022, 6, 2174–2184. [Google Scholar]
  6. Kee, D.M.H.; Al-Anesi, M.A.L.; Al-Anesi, S.A.L. Cyberbullying on Social Media under the Influence of COVID-19. Glob. Bus. Organ. Excell. 2022, 41, 11–22. [Google Scholar] [CrossRef]
  7. Arisanty, M.; Wiradharma, G. The motivation of flaming perpetrators as cyberbullying behavior in social media. J. Kaji. Komun. 2022, 10, 215–227. [Google Scholar] [CrossRef]
  8. Hair, J.F., Jr.; Sarstedt, M. Data, measurement, and causal inferences in machine learning: Opportunities and challenges for marketing. J. Mark. Theory Pract. 2021, 29, 65–77. [Google Scholar] [CrossRef]
  9. Bozyiğit, A.; Utku, S.; Nasibov, E. Cyberbullying detection: Utilizing social media features. Expert Syst. Appl. 2021, 179, 115001. [Google Scholar] [CrossRef]
  10. Cheng, L.; Guo, R.; Silva, Y.N.; Hall, D.; Liu, H. Modeling temporal patterns of cyberbullying detection with hierarchical attention networks. ACM/IMS Trans. Data Sci. 2021, 2, 1–23. [Google Scholar] [CrossRef]
  11. Mazari, A.C.; Boudoukhani, N.; Djeffal, A. BERT-based ensemble learning for multi-aspect hate speech detection. Clust. Comput. 2023, 1–15. [Google Scholar] [CrossRef]
  12. Singh, A.; Kaur, M. Cuckoo inspired stacking ensemble framework for content-based cybercrime detection in online social networks. Trans. Emerg. Telecommun. Technol. 2021, 32, e4074. [Google Scholar] [CrossRef]
  13. Dong, X.; Yu, Z.; Cao, W.; Shi, Y.; Ma, Q. A survey on ensemble learning. Front. Comput. Sci. 2020, 14, 241–258. [Google Scholar] [CrossRef]
  14. Baradaran, R.; Amirkhani, H. Ensemble learning-based approach for improving generalization capability of machine reading comprehension systems. Neurocomputing 2021, 466, 229–242. [Google Scholar] [CrossRef]
  15. Guo, X.; Gao, Y.; Zheng, D.; Ning, Y.; Zhao, Q. Study on short-term photovoltaic power prediction model based on the Stacking ensemble learning. Energy Rep. 2020, 6, 1424–1431. [Google Scholar] [CrossRef]
  16. Muneer, A.; Fati, S.M. A comparative analysis of machine learning techniques for cyberbullying detection on twitter. Future Internet 2020, 12, 187. [Google Scholar] [CrossRef]
  17. Koroteev, M. BERT: A review of applications in natural language processing and understanding. arXiv 2021, arXiv:2103.11943. [Google Scholar]
  18. Roshanzamir, A.; Aghajan, H.; Soleymani Baghshah, M. Transformer-based deep neural network language models for Alzheimer’s disease risk assessment from targeted speech. BMC Med. Inform. Decis. Mak. 2021, 21, 92. [Google Scholar] [CrossRef] [PubMed]
  19. Acheampong, F.A.; Nunoo-Mensah, H.; Chen, W. Transformer models for text-based emotion detection: A review of BERT-based approaches. Artif. Intell. Rev. 2021, 54, 5789–5829. [Google Scholar] [CrossRef]
  20. Gillioz, A.; Casas, J.; Mugellini, E.; Abou Khaled, O. Overview of the Transformer-based Models for NLP Tasks. In Proceedings of the 2020 15th Conference on Computer Science and Information Systems (FedCSIS), Sofia, Bulgaria, 6–9 September 2020; pp. 179–183. [Google Scholar]
  21. Van Hee, C.; Jacobs, G.; Emmery, C.; Desmet, B.; Lefever, E.; Verhoeven, B.; De Pauw, G.; Daelemans, W.; Hoste, V. Automatic detection of cyberbullying in social media text. PLoS ONE 2018, 13, e0203794. [Google Scholar] [CrossRef]
  22. Paul, S.; Saha, S.; Singh, J.P. COVID-19 and cyberbullying: Deep ensemble model to identify cyberbullying from code-switched languages during the pandemic. Multimed. Tools Appl. 2023, 82, 8773–8789. [Google Scholar] [CrossRef]
  23. Haidar, B.; Chamoun, M.; Serhrouchni, A. Multilingual cyberbullying detection system: Detecting cyberbullying in Arabic content. In Proceedings of the 2017 1st Cyber Security in Networking Conference (CSNet), Rio de Janeiro, Brazil, 18–20 October 2017; pp. 1–8. [Google Scholar]
  24. Yadav, J.; Kumar, D.; Chauhan, D. Cyberbullying detection using pre-trained bert model. In Proceedings of the 2020 International Conference on Electronics and Sustainable Communication Systems (ICESC), Coimbatore, India, 2–4 July 2020; pp. 1096–1100. [Google Scholar]
  25. Al-Ajlan, M.A.; Ykhlef, M. Optimized twitter cyberbullying detection based on deep learning. In Proceedings of the 2018 21st Saudi Computer Society National Computer Conference (NCC), Riyadh, Saudi Arabia, 25–26 April 2018; pp. 1–5. [Google Scholar]
  26. Banerjee, V.; Telavane, J.; Gaikwad, P.; Vartak, P. Detection of cyberbullying using deep neural network. In Proceedings of the 2019 5th International Conference on Advanced Computing & Communication Systems (ICACCS), Coimbatore, India, 15–16 March 2019; pp. 604–607. [Google Scholar]
  27. Wulczyn, E.; Thain, N.; Dixon, L. Ex machina: Personal attacks seen at scale. In Proceedings of the 26th International Conference on World Wide Web, Perth, Australia, 3–7 April 2017; pp. 1391–1399. [Google Scholar]
  28. Malpe, V.; Vaikole, S. A comprehensive study on cyberbullying detection using machine learning approach. Int. J. Futur. Gener. Commun. Netw. 2020, 13, 342–351. [Google Scholar]
  29. Aind, A.T.; Ramnaney, A.; Sethia, D. Q-bully: A reinforcement learning based cyberbullying detection framework. In Proceedings of the 2020 International Conference for Emerging Technology (INCET), Belgaum, India, 5–7 June 2020; pp. 1–6. [Google Scholar]
  30. Mahat, M. Detecting cyberbullying across multiple social media platforms using deep learning. In Proceedings of the 2021 International Conference on Advance Computing and Innovative Technologies in Engineering (ICACITE), Greater Noida, India, 4–5 March 2021; pp. 299–301. [Google Scholar]
  31. Yadav, Y.; Bajaj, P.; Gupta, R.K.; Sinha, R. A comparative study of deep learning methods for hate speech and offensive language detection in textual data. In Proceedings of the 2021 IEEE 18th India Council International Conference (INDICON), Guwahati, India, 19–21 December 2021; pp. 1–6. [Google Scholar]
  32. Zaidi, S.A.R. Suspicious Communication on Social Platforms. Available online: https://www.kaggle.com/datasets/syedabbasraza/suspicious-communication-on-social-platforms (accessed on 20 November 2022).
  33. Mikolov, T.; Chen, K.; Corrado, G.; Dean, J. Efficient estimation of word representations in vector space. arXiv 2013, arXiv:1301.3781. [Google Scholar]
  34. Wang, Q.; Xu, J.; Chen, H.; He, B. Two improved continuous bag-of-word models. In Proceedings of the 2017 International Joint Conference on Neural Networks (IJCNN), Anchorage, AK, USA, 14–19 May 2017; pp. 2851–2856. [Google Scholar]
  35. White, L. On the Surprising Capacity of Linear Combinations of Embeddings for Natural Language Processing. Ph.D. Thesis, The University of Western Australia, Perth, Australia, 2019. [Google Scholar]
  36. Muneer, A.; Taib, S.M.; Naseer, S.; Ali, R.F.; Aziz, I.A. Data-driven deep learning-based attention mechanism for remaining useful life prediction: Case study application to turbofan engine analysis. Electronics 2021, 10, 2453. [Google Scholar] [CrossRef]
  37. Naseer, S.; Fati, S.M.; Muneer, A.; Ali, R.F. iAceS-Deep: Sequence-based identification of acetyl serine sites in proteins using PseAAC and deep neural representations. IEEE Access 2022, 10, 12953–12965. [Google Scholar] [CrossRef]
  38. Graves, A. Long Short-Term Memory. Supervised Sequence Labelling with Recurrent Neural Networks; Springer: Berlin/Heidelberg, Germany, 2012; pp. 37–45. [Google Scholar]
  39. Alqushaibi, A.; Abdulkadir, S.J.; Rais, H.M.; Al-Tashi, Q.; Ragab, M.G.; Alhussian, H. Enhanced weight-optimized recurrent neural networks based on sine cosine algorithm for wave height prediction. J. Mar. Sci. Eng. 2021, 9, 524. [Google Scholar] [CrossRef]
  40. Cho, K.; Van Merriënboer, B.; Bahdanau, D.; Bengio, Y. On the properties of neural machine translation: Encoder-decoder approaches. arXiv 2014, arXiv:1409.1259. [Google Scholar]
  41. Durairajah, V.; Gobee, S.; Muneer, A. Automatic vision based classification system using DNN and SVM classifiers. In Proceedings of the 2018 3rd International Conference on Control, Robotics and Cybernetics (CRC), Penang, Malaysia, 18–20 December 2018; pp. 6–14. [Google Scholar]
  42. Muneer, A.; Fati, S.M. Efficient and automated herbs classification approach based on shape and texture features using deep learning. IEEE Access 2020, 8, 196747–196764. [Google Scholar] [CrossRef]
  43. Ragab, M.G.; Abdulkadir, S.J.; Aziz, N.; Al-Tashi, Q.; Alyousifi, Y.; Alhussian, H.; Alqushaibi, A. A novel one-dimensional cnn with exponential adaptive gradients for air pollution index prediction. Sustainability 2020, 12, 10090. [Google Scholar] [CrossRef]
  44. Naseer, S.; Ali, R.F.; Fati, S.M.; Muneer, A. iNitroY-Deep: Computational identification of Nitrotyrosine sites to supplement Carcinogenesis studies using Deep Learning. IEEE Access 2021, 9, 73624–73640. [Google Scholar] [CrossRef]
  45. Muneer, A.; Fati, S.M.; Akbar, N.A.; Agustriawan, D.; Wahyudi, S.T. iVaccine-Deep: Prediction of COVID-19 mRNA vaccine degradation using deep learning. J. King Saud Univ. Comput. Inf. Sci. 2022, 34, 7419–7432. [Google Scholar] [CrossRef]
  46. Zaheer, R.; Shaziya, H. A study of the optimization algorithms in deep learning. In Proceedings of the 2019 Third International Conference on Inventive Systems and Control (ICISC), Coimbatore, India, 10–11 January 2019; pp. 536–539. [Google Scholar]
  47. Fati, S.M.; Muneer, A.; Alwadain, A.; Balogun, A.O. Cyberbullying Detection on Twitter Using Deep Learning-Based Attention Mechanisms and Continuous Bag of Words Feature Extraction. Mathematics 2023, 11, 3567. [Google Scholar] [CrossRef]
  48. Sinha, A.; Gunwal, S.; Kumar, S. A Globally Convergent Gradient-based Bilevel Hyperparameter Optimization Method. arXiv 2022, arXiv:2208.12118. [Google Scholar]
  49. Saito, T.; Rehmsmeier, M. The precision-recall plot is more informative than the ROC plot when evaluating binary classifiers on imbalanced datasets. PLoS ONE 2015, 10, e0118432. [Google Scholar] [CrossRef]
  50. Narkhede, S. Understanding auc-roc curve. Towards Data Sci. 2018, 26, 220–227. [Google Scholar]
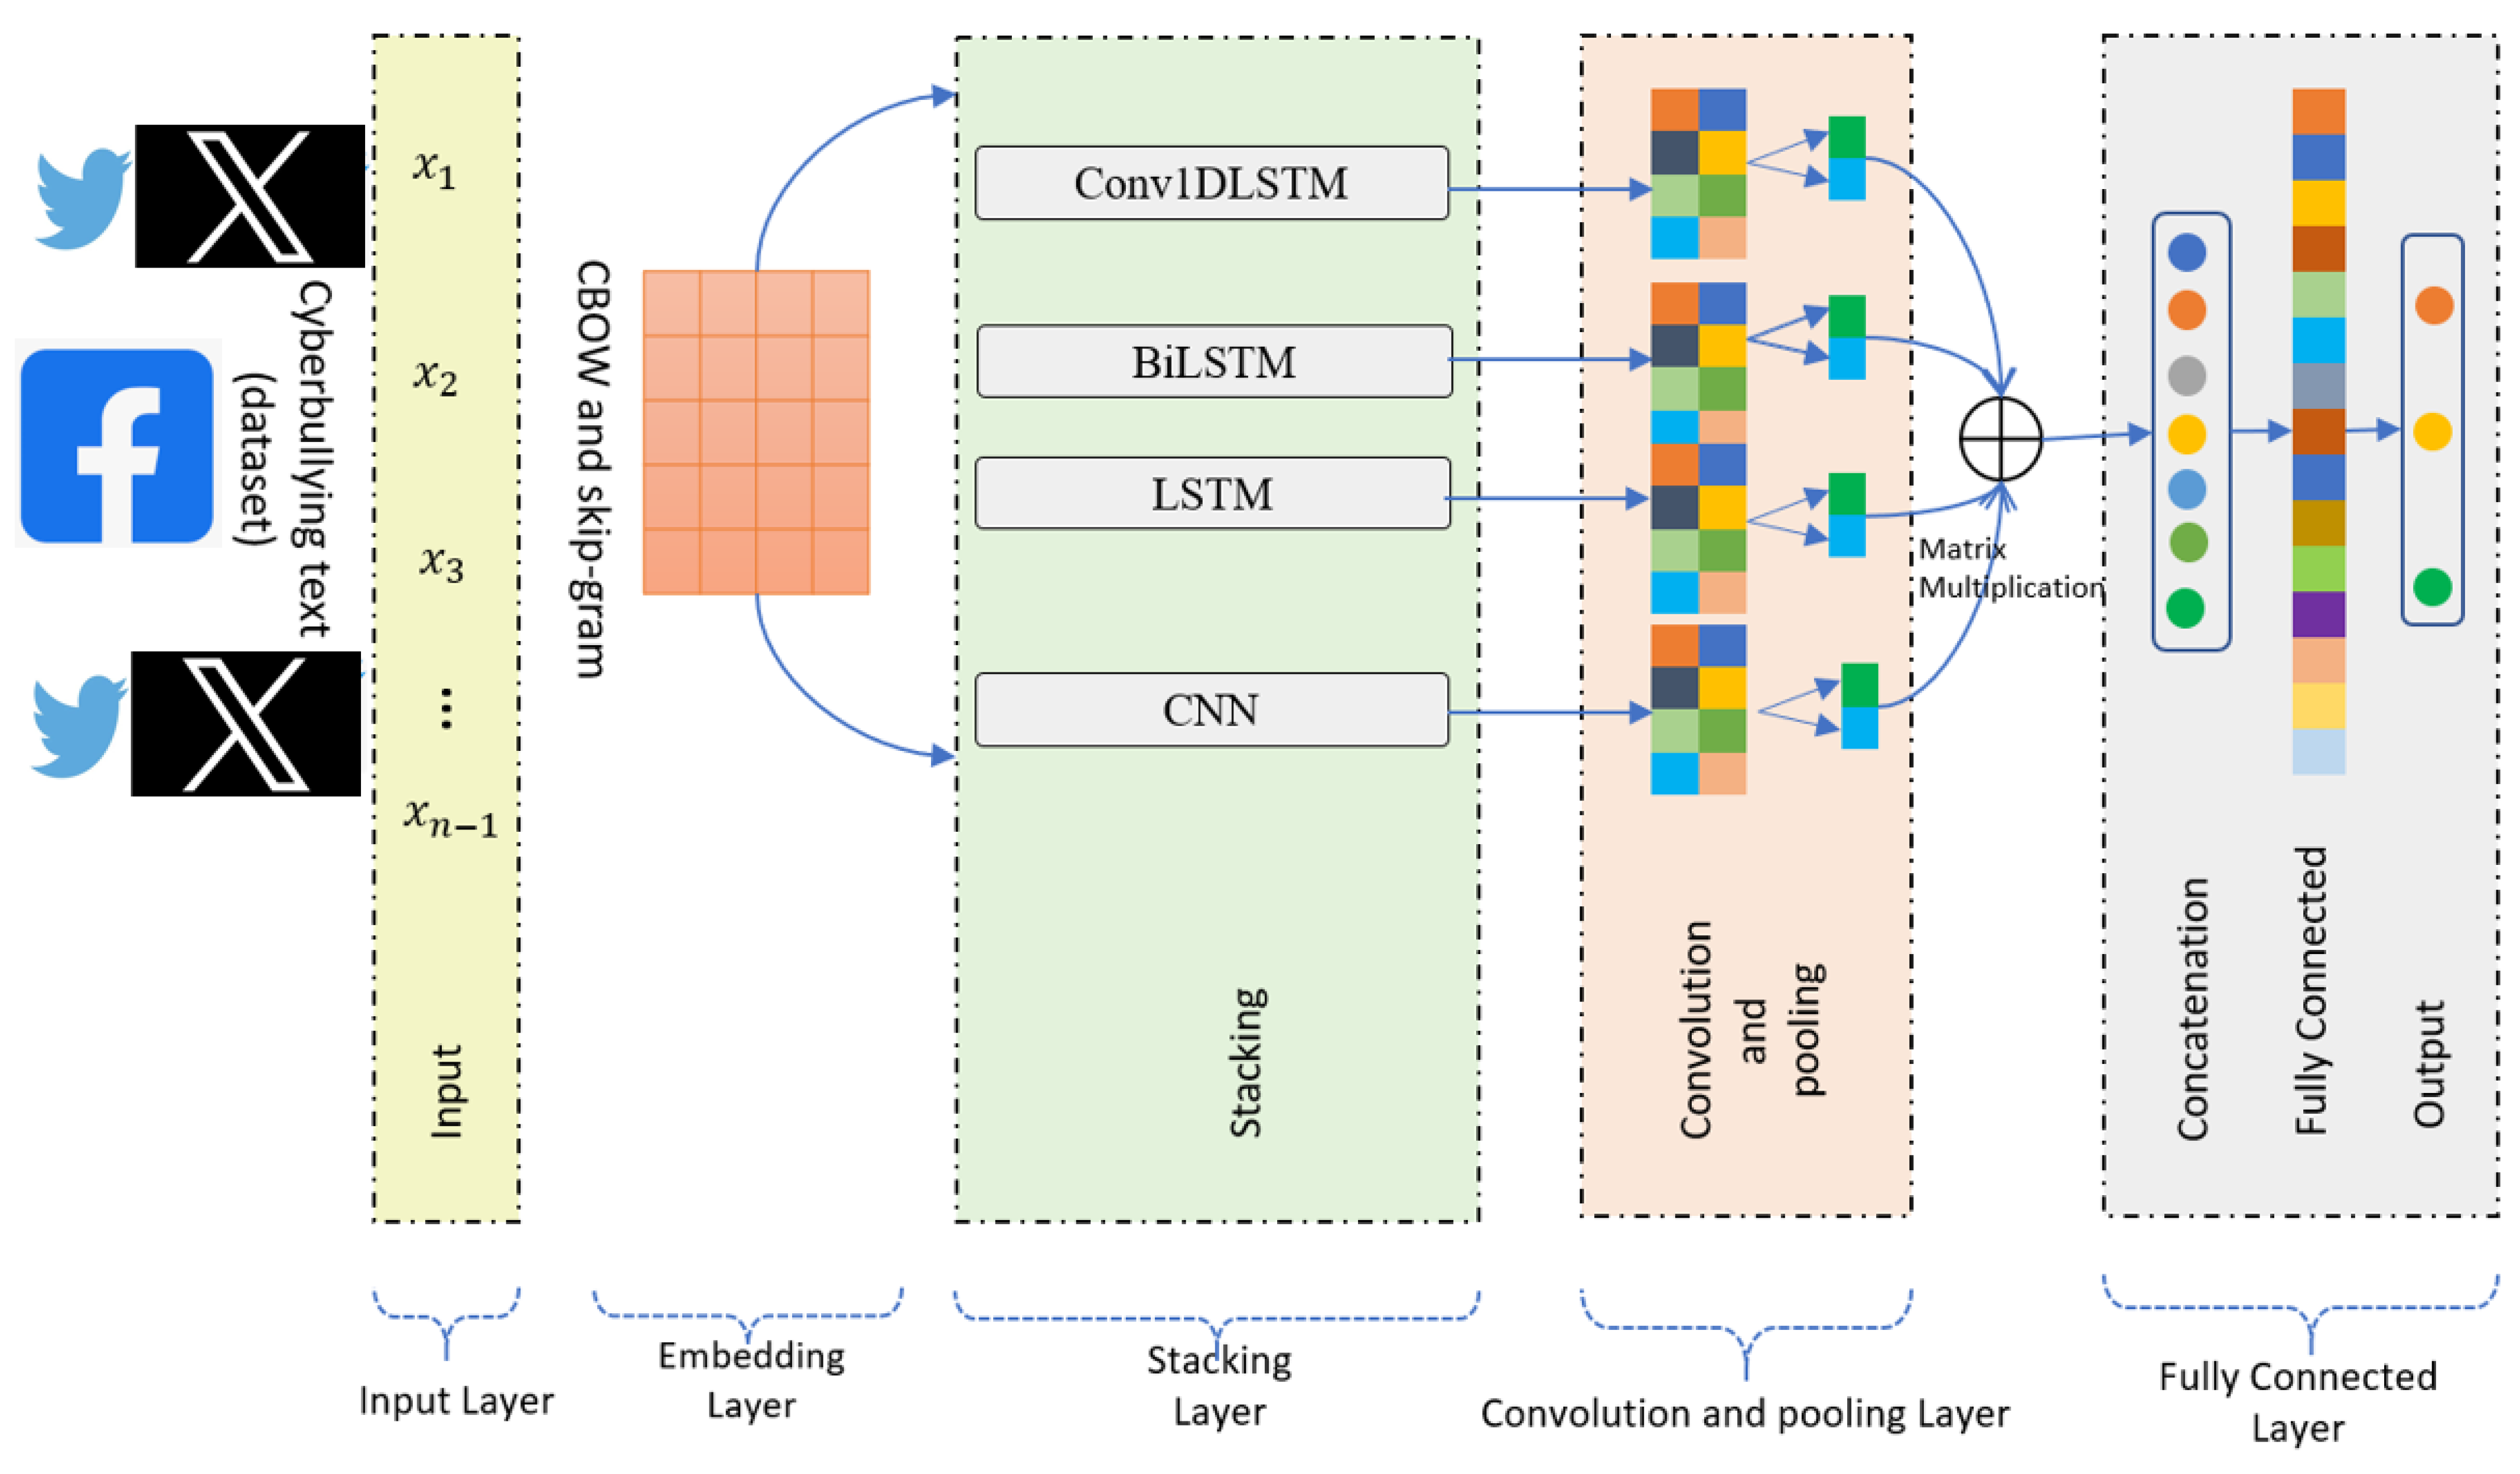
Figure 1. The proposed architecture of stacked ensemble learning model for cyberbullying detection on SM.
Information 14 00467 g001
Figure 2. Count of tweets with less than ten words (count vs. tweet length).
Information 14 00467 g002
Figure 3. Count of tweets with a higher number of words.
Information 14 00467 g003
Figure 4. The count of tweets exhibiting an increased word count is facilitated through the utilization of the CBOW and Skip-gram model architectures within the word2vec technique. This technique encompasses the implementation of both training models, wherein the fundamental concept revolves around leveraging a word’s presence to forecast its surrounding context, or conversely, employing the context to predict the current word.
Information 14 00467 g004
Figure 5. Convolutional layer to extract local features.
Information 14 00467 g005
Figure 6. Testing accuracy and loss of the proposed stacked ensemble model on the Twitter dataset.
Information 14 00467 g006
Figure 7. Loss and testing accuracy of the proposed stacked ensemble model on social platforms dataset (Twitter and Facebook).
Information 14 00467 g007
Figure 8. Summary of the proposed deep learning detectors for cyberbullying identification.
Information 14 00467 g008
Figure 9. Precision-recall curve for stacked ensemble model.
Information 14 00467 g009
Figure 10. Confusion matrix of DL predictors models.
Information 14 00467 g010
Figure 11. AUC curve of the proposed stacked ensemble model: (a) AUC curve for the Twitter dataset; and (b) AUC curve for the mixed social platform dataset (Twitter and Facebook).
Information 14 00467 g011
Table 1. Example of cyberbullying samples in the Twitter dataset.
IdCyberbullying Tweet SamplesPredLabel
1Fat people are dumpOffensive (cyberbullying)1
2WTF are you talking about Men? No men thats not a menage that’s just gay.Offensive (cyberbullying)1
3Fake friends are no different than shadows, they stick around during your brightest moments, but disappear during your darkest.Non-offensive (non-bullying)0
4You are big black s**t.Offensive (cyberbullying)1
5Today something is dope. Tomorrow that same thing is trash. Next month it is irrelevant. Next year it’s classic.Non-offensive (non-bullying)0
Table 2. Experimental parameters.
LayersLayer NameKernel × UnitOther Parameters
1Conv1D72 × 128Activation = ReLU, Strides = 3
2Batch Norm--
3Global Max Pool-Stride = 3
4Conv1D Activation = ReLU, Strides = 3
5Batch Norm -
6Max Pool Pool Size = 2, Stride = 2
7Conv1D3 × 512Activation = ReLU, Stride = 1
8Conv1D3 × 128Activation = ReLU, Stride = 1
9Flatten--
10Dense1 × 512
11Dense2Activation = SoftMax
Table 3. Comparison analysis between baseline and proposed models on the Twitter dataset.
No.AlgorithmAccuracy (%) Precision Recall F1-Score
1LSTM0.80110.81420.72810.8281
2Conv1DLSTM0.86490.8146 0.8919 0.8317
3CNN0.84960.88360.79080.8720
4BiLSTM0.77950.83730.81300.8041
5BERT0.9210.9150.9150.9149
6Tuned-BERT0.93840.920.910.92
7Stacked0.9740.9500.920.964
Table 4. Comparison analysis between baseline and proposed models on the Facebook dataset.
No.AlgorithmAccuracy (%) Precision Recall F1-Score
1BERT0.90420.90510.90340.9043
2Tuned-BERT0.91980.9262 0.9123 0.9191
3Stacked0.90970.91220.90820.9102
Table 5. Model complexity and statistical analysis on the Twitter dataset.
NoModelAccuracyTime Complexity
1BERT baseline 92.1%1 h 6 min
2Modified-BERT93.84%1 h 2 min
3Proposed stacked97.4%3 min 9 s
Table 6. Model complexity and statistical analysis on the Facebook dataset.
NoModelAccuracyTime Complexity
1BERT baseline 90.4244 min 25 s
2Modified-BERT91.98%41 min 23 s
3Proposed stacked90.97%2 min 45 s
Table 7. Comparison with the related literature.
DatasetAlgorithmAccuracyPrecisionRecallF1-Score
TwitterLogistic Regression [16]90.570.9510.9050.928
LGBM Classifier [16]90.550.96140.8950.927
Random Forest [16]89.80.9330.9130.923
SVM [16]67.130.9330.9130.923
Stacked (ours)97.40.9500.920.964
Disclaimer/Publisher’s Note: The statements, opinions and data contained in all publications are solely those of the individual author(s) and contributor(s) and not of MDPI and/or the editor(s). MDPI and/or the editor(s) disclaim responsibility for any injury to people or property resulting from any ideas, methods, instructions or products referred to in the content.