Article

Auditory Models for Formant Frequency Discrimination of Vowel Sounds

Department of Speech, Language, and Hearing Sciences, The University of Texas at Austin, Austin, TX 78712, USA
*
Author to whom correspondence should be addressed.
Information 2023, 14(8), 429; https://doi.org/10.3390/info14080429
Submission received: 6 June 2023 / Revised: 26 July 2023 / Accepted: 27 July 2023 / Published: 31 July 2023

Abstract

:
As formant frequencies of vowel sounds are critical acoustic cues for vowel perception, human listeners need to be sensitive to formant frequency change. Numerous studies have found that formant frequency discrimination is affected by many factors like formant frequency, speech level, and fundamental frequency. Theoretically, to perceive a formant frequency change, human listeners with normal hearing may need a relatively constant change in the excitation and loudness pattern, and this internal change in auditory processing is independent of vowel category. Thus, the present study examined whether such metrics could explain the effects of formant frequency and speech level on formant frequency discrimination thresholds. Moreover, a simulation model based on the auditory excitation-pattern and loudness-pattern models was developed to simulate the auditory processing of vowel signals and predict thresholds of vowel formant discrimination. The results showed that predicted thresholds based on auditory metrics incorporating auditory excitation or loudness patterns near the target formant showed high correlations and low root-mean-square errors with human behavioral thresholds in terms of the effects of formant frequency and speech level). In addition, the simulation model, which particularly simulates the spectral processing of acoustic signals in the human auditory system, may be used to evaluate the auditory perception of speech signals for listeners with hearing impairments and/or different language backgrounds.

1. Introduction

Vowel formants, referring to the spectral prominence of vowel sounds, are believed to provide primary acoustic information for vowel perception [1,2,3,4,5]. In particular, the first two formants, F1 and F2, play key roles in vowel identity. Therefore, to perceive vowels accurately, listeners need to have sufficient sensitivity to changes in formant frequency. Studies of vowel formant frequency discrimination have examined listeners’ abilities to detect differences in formant frequency. Several researchers have systematically investigated the formant frequency discrimination of vowel sounds in different listening conditions for normal-hearing and hearing-impaired listeners [6,7,8,9,10,11,12,13]. These studies have shown that formant frequency discrimination is significantly affected by several factors such as formant frequency, fundamental frequency, phonetic context, background noise, level of stimulus uncertainty, and speech level.
In the optimal listening condition, wherein isolated vowels were presented to normal-hearing listeners with extensive training for the task, thresholds of vowel formant discrimination were constant at 14 Hz for F1 and increased linearly at a rate of 10 Hz/1000 Hz with formant frequency for F2 [6]. In addition, the fundamental frequency of target speech also significantly affected vowel formant discrimination; for e.g., thresholds were higher for male speakers with higher fundamental frequencies (F0s) than male speakers with lower F0s [14]. Formant discrimination became more difficult with the complexity of phonetic contexts; for e.g., thresholds of formant discrimination increased from isolated vowels, single CVC syllables, and phrases to sentences [9]. In addition, the performance of vowel formant discrimination was degraded with increased stimulus uncertainty; for e.g., vowel stimulus differed trial by trial [15]. Another factor significantly influencing vowel formant discrimination was speech level. That is, formant discrimination in normal-hearing listeners became better as signal level increased from 70 to 85 dB SPL and then declined from 85 to 100 dB SPL [13]. In other words, there was a rollover effect of speech level on vowel formant discrimination for normal-hearing listeners, similar to the findings on speech recognition in other studies [16,17,18]. Among these factors, formant frequency and speech level were focused on in this study, and the goal was to examine whether the effects of the two factors could be explained by auditory models such as the excitation-pattern and loudness-pattern models [19].
Acoustically, a change in formant frequency results in a change in the spectral shapes of vowel sounds such that the internal representation of the vowel spectrum, including elements such as the excitation and loudness patterns, will change accordingly. Substantial changes in excitation and loudness patterns were observed in the regions near the shifted formant [1,2,7]. This was in agreement with a previous finding that although a change in formant frequency resulted in changes in the intensity of harmonics over a wide frequency range, thresholds for formant frequency discrimination were dependent upon the amplitude variation over only one to three harmonics near the shifted formant [20]. Kewley-Port and Zheng [2] used the excitation-pattern model [21] and the loudness-pattern model [22] to interpret the variability of formant frequency discrimination generated by fundamental frequency and formant frequency. Excitation and loudness patterns can be considered as internal representations of signal spectra at the cochlear and cortical levels, respectively. The results of Kewley-Port and Zheng’s study suggested that the discrimination of vowel formant frequency was based on the differences between the excitation or loudness patterns of the standard vowel and formant-shifted vowel [2]. Moreover, Lyzenga and Horst indicated that the excitation-pattern model [21] could explain the measured thresholds of frequency discrimination in harmonic complex and synthetic vowels [7,8]. Furthermore, the thresholds of vowel formant discrimination predicted from the excitation-pattern model were successfully matched with the behavioral thresholds of human listeners [1]. Thus, it is reasonable to hypothesize that changes in excitation and loudness patterns may serve as the bases for discriminating vowel formant frequency and that these changes may be constants, independent of stimulus parameters, e.g., formant frequency and speech level. The goal of this study, therefore, was to examine whether the effects of speech level and formant frequency on formant frequency discrimination found for normal-hearing listeners [13] could be accounted for by the excitation-pattern and loudness-pattern models. It is hypothesized that to perceive a formant frequency shift across different formant frequencies and speech levels, normal-hearing listeners need constant changes in the excitation or loudness patterns. This constant change in the excitation or loudness patterns was used to predict thresholds of vowel formant discrimination by simulating the experimental procedures of behavioral experiments [13]. As described above, there was a rollover effect of speech level on vowel formant discrimination for normal-hearing listeners. One interpretation for the level rollover effect was that the auditory filter bandwidth becomes broader with the signal level, resulting in the spectral smearing of formant peaks and then more difficulty in formant discrimination at high speech levels [13]. On the other hand, frequency selectivity (e.g., auditory filter bandwidth) is also dependent on signal frequency, possibly contributing to frequency-dependent formant discrimination. Thus, in this study, the excitation-pattern and loudness-pattern models that include level-dependent and frequency-dependent frequency selectivity were proposed to account for the variance of vowel formant discrimination by formant frequency and speech level.
Based on previous modeling work by Kewley-Port and colleagues that reported a constant change in excitation and loudness patterns to explain the variability of formant discrimination thresholds by formant frequency and fundamental frequency [1,2,20], another goal of this study was to develop a simulation model based on auditory models that was able to successfully predict vowel formant discrimination thresholds across different experimental conditions such as formant frequency and speech level. In particular, a simulation model based the excitation-pattern model was able to predict the formant frequency thresholds of F1 and F2 for four American English vowels, which were greatly matched with behavioral data [1]. In this paper, the protocol of this simulation model [1] is used to examine the effects of both formant frequency and speech level on formant discrimination. If successful, the simulation model could then be used and extended to estimate the thresholds of vowel formant discrimination for more complicated listening conditions (e.g., in noise) and for hearing-impaired listeners. In particular, as recent studies in our laboratory indicated the improved performance of vowel formant discrimination by spectral enhancement of F2 for listeners with hearing loss and aging populations [23], the simulation model would provide a tool to estimate whether a perceptual benefit can be achieved by manipulating a variety of acoustic features in spectral enhancement (e.g., how much enhancement scale on which formant peak may provide perceptual benefits) before behavioral measures on human participants are conducted.
A successful auditory model for vowel formant frequency discrimination must account for the major factors influencing threshold including formant frequency and speech level. The approach of this study was to predict formant frequency discrimination thresholds by using a single-valued auditory metric derived from the excitation-pattern or loudness-pattern model and then to examine the correlations and deviations between predicted and measured thresholds. Therefore, a simulation model based on the excitation-pattern and loudness-pattern metrics was used to predict the thresholds of formant frequency discrimination of F1 and F2 for four American English vowels at three speech levels: 75, 85, and 100 dB SPL. It was expected that the thresholds predicted from the excitation- and loudness-pattern metrics would show high correlations and low root-mean-square errors with behavioral data across vowel formants and speech levels that were reported in Liu’s study [13]. The selection of the data from Liu’s study [13] was primarily due to the study’s inclusion of two experimental factors, formant frequency (e.g., low F1 to high F2 frequency) and speech level, both of which significantly affected frequency selectivity and served as the primary factors in the present study. Auditory metrics based on the excitation-pattern and loudness models were compared and evaluated to determine the extent to which each auditory metric was successful in this study.
It should be also noted that this study was significantly expanded and different from Liu’s early modeling work [1] in several ways: first, two experimental factors—formant frequency and speech level—were examined in the present study while only formant frequency was investigated in the early study [1]; second, two auditory models—the excitation-pattern (simulating auditory peripheral processing) and loudness-pattern (simulating auditory peripheral and central processing) models—are used in this study while only the excitation-pattern model was included in the early work [1]; and third, three auditory metrics are used to predict the thresholds of vowel formant discrimination in human listeners while only one auditory metric was measured in Liu’s study [1].
Overall, the purpose of the present study was not only to examine the theoretical models accounting for the effects of formant frequency and speech level on vowel formant discrimination, but also to develop an auditory simulation model to predict thresholds of formant discrimination across the two experimental factors for normal-hearing listeners. The auditory models (i.e., the excitation-pattern and loudness models) in this study, if successful, would make contributions to predict vowel formant discrimination in more general experimental conditions such as when different vowels are presented at different speech levels and may be also extended to more individualized and complicated listening scenarios, e.g., in spectral shape discrimination for speech and nonspeech sounds for listeners with normal hearing and hearing impairment and for spectral shape discrimination in noise backgrounds.

2. Materials and Methods

In this section, the generation of standard vowels and vowels with formant shifts are described first, and then this description is followed by the data set of behavioral measures used to compare with the data predicted from the auditory models. Lastly, the details of two auditory models and how to use them to predict the thresholds of vowel formant discrimination are provided.

2.1. Stimuli

Four isolated steady-state American English vowels, /I, ε, Θ, Ã/, served as the stimuli; these were the same as those used in Liu’s study [15]. The durations of isolated vowels varied from 107 to 198 ms. Vowels embedded in /bVd/ syllables were originally recorded by a female talker with an average fundamental frequency (F0) of 160 Hz, and standard and formant-shifted vowels were synthesized using a modified version of STRAIGHT [24], which uses a pitch-adaptive method for speech analysis and synthesis. The procedure to shift vowel formant is briefly described here: first, a 3-D spectrogram (amplitude × frequency × time) was obtained from the analysis of STRAIGHT; second, at each time frame of the spectrogram (i.e., spectrum), the formant peak (e.g., F1 of F2) was shifted positively by a given percentage of the formant frequency. The positive shift in the selected formant frequency resulted in no changes in other formants, with only minor changes in the amplitudes of the valleys surrounding the formant that had been altered. The detailed synthesis procedures for vowels with formant shifts were fully described by Liu and Kewley-Port [12]. Isolated vowels were edited by deleting the formant transitions at the beginning and end of each syllable such that only the relatively steady-state vowel nucleus remained. The test sets with formant shifts for F1 or F2 for a specific vowel contained 24 modified vowels with formant shifts from 0.9% to 17% of the formant frequency in a linear step (i.e., a step size of 0.7%). All vowel stimuli were presented at three levels: 70, 85, and 100 dB SPL.

2.2. Threshold Data Sets

Liu [13] measured thresholds for formant frequency discrimination, specified as ΔF in Hz, for six young normal-hearing listeners, using a three-interval, two-alternative forced-choice adaptive (2AFC) procedure with a two-down, one-up tracking algorithm, estimating the frequency increment required for 71% correct responses. Overall, thresholds improved from 70 to 85 dB SPL and then were degraded from 85 to 100 dB SPL, indicating a rollover level effect primarily for the F2 frequencies (see Figure 1). In addition, thresholds of formant frequency discrimination increased with formant frequency at each speech level.

2.3. Auditory Models

This subsection describes a loudness-pattern model based on work by Moore and his colleagues, which was used to simulate the processing of vowel sounds in the auditory system and model the behavioral thresholds of formant frequency discrimination. Since the loudness model is derived from the excitation-pattern model, the excitation-pattern model is described first. Auditory metrics derived from the excitation-pattern model and loudness-pattern model are presented next, followed by an auditory simulation model used to predict thresholds of formant frequency discrimination while using the auditory metrics described below.
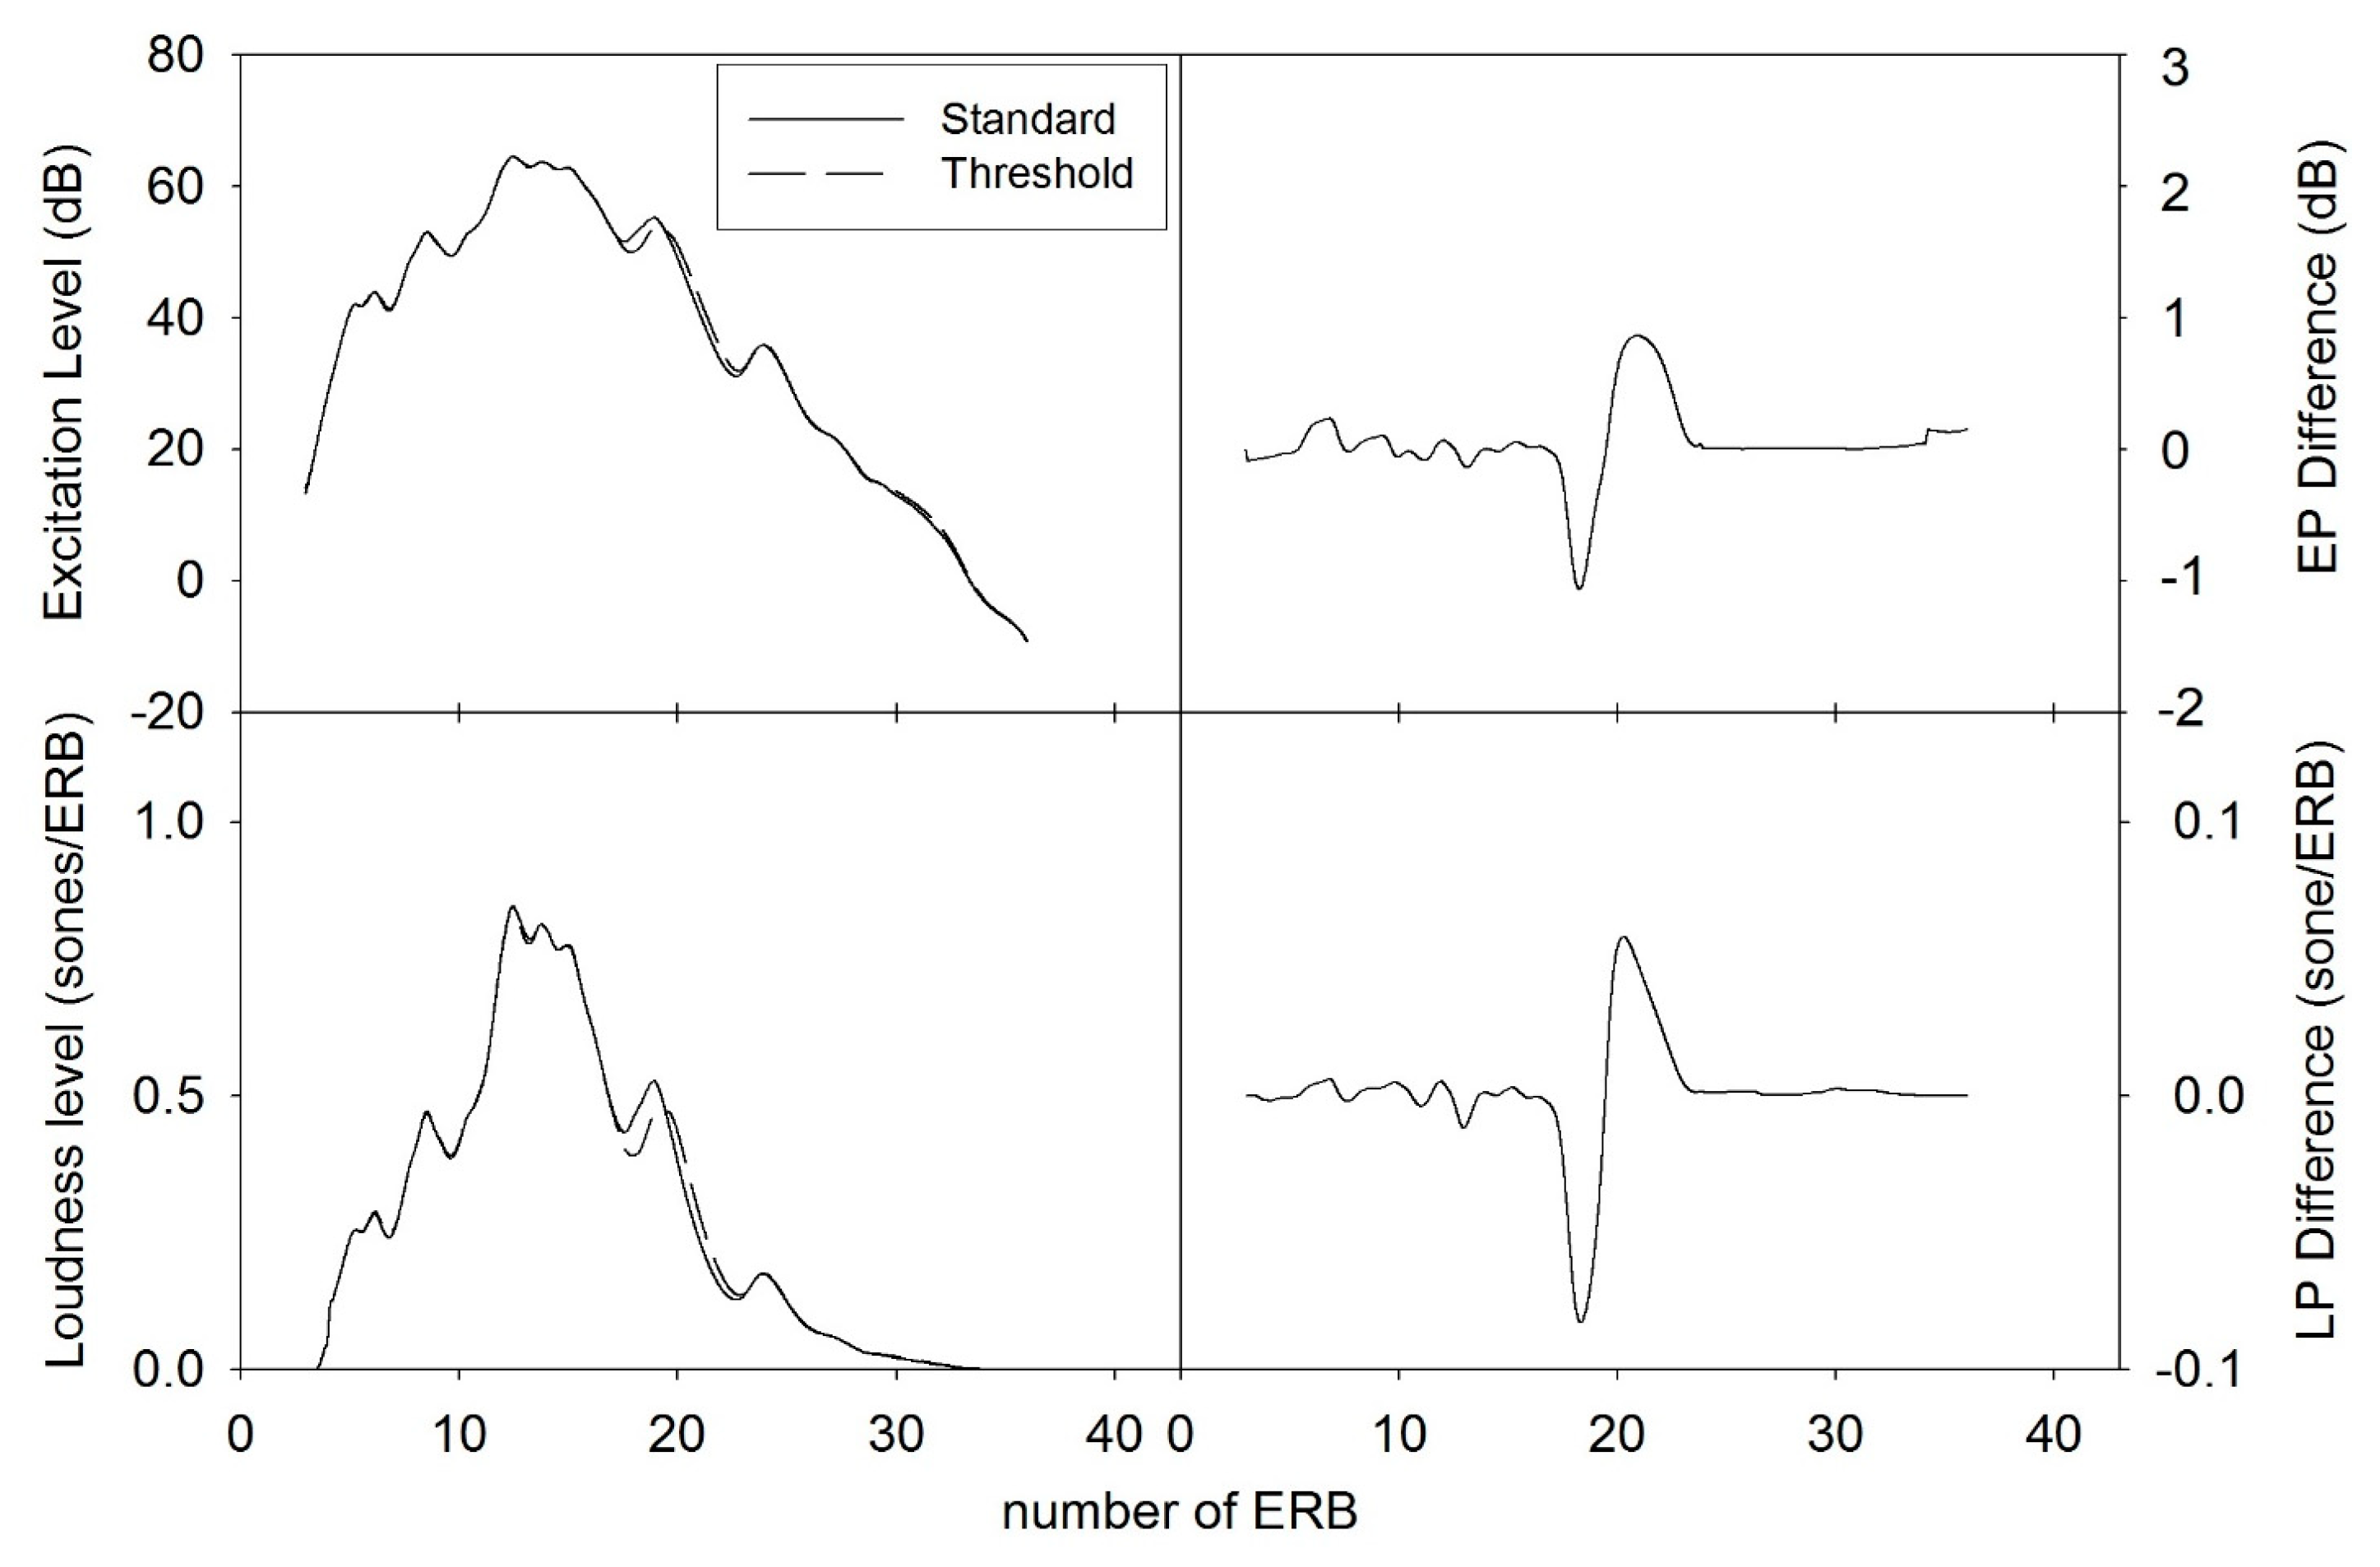
The excitation-pattern model in quiet conditions for young normal-hearing listeners, developed by Moore and Glasberg, contains several stages [21]. The first stage is transmission of the stimulus through the outer ear; a transfer function accounts for the stimulus transmission from free field or earphones to the eardrum. The transfer function for the inserted earphone (Etymotic Research, ER-2) was incorporated in the model for this study. The second stage is a transfer function to account for the transmission of the stimulus through the middle ear. Together, the outer and middle ears provide larger transmission for middle frequencies than for low and high frequencies. In the third stage, an excitation pattern E(f) is calculated. For a given stimulus, it is calculated using psychoacoustic estimates of auditory filter characteristics, and can be considered as the distribution of excitation levels along the basilar membrane or as a function of characteristic frequency [25]. The excitation pattern of the signal is calculated as the output of the auditory filters, i.e., excitation level as a function of the center frequency expressed by the ERB number (ERBN), following the procedure of Glasberg and Moore [21]. Excitation patterns for the standard /ε/ vowel and /ε/ vowel at the threshold of F2 discrimination at 70 dB SPL are shown in the upper left panel of Figure 2, in which formant peaks for F1, F2, and F3, as well as the formant shift for F2, are represented.
Following Moore and Glasberg’s loudness model [22,26], a specific loudness pattern is calculated from the excitation pattern (E(f)). The specific loudness, N’(f) in units of sones/ERBN, represents loudness density (loudness per ERBN) as a function of center frequency. The relationship between N’(f) and E(f) is based on the assumption that at low stimulus levels, the input–output function along the basilar membrane becomes steeper and approaches linearity in the regions close to and just above the threshold whereas at middle and high levels, the specific loudness produced by a given excitation pattern is proportional to the compressed internal effect evoked by the excitation [27,28]. For example, the loudness patterns of the standard /ε/ vowel and /ε/ vowel at the threshold of F2 discrimination for a speech level of 70 dB SPL are shown in the lower left panel of Figure 2. The final stage of the loudness model is to estimate the total loudness of the stimulus in sones by summing the area under the specific loudness pattern.

2.4. Modeling Formant Frequency Discrimination

In this subsection, how to use each of the two auditory models to predict the thresholds of vowel formant discrimination is described. First, the computation of the difference in excitation/loudness patterns between the standard vowel and formant-shifted vowel is clarified. Second, auditory metrics based on the excitation/loudness pattern differences are explained. Third, the auditory simulation model, using the auditory metrics to simulate the behavioral measures of formant discrimination and predict thresholds, is interpreted.
The present study hypothesized that thresholds of vowel formant frequency discrimination corresponded to relative constant changes in the excitation/loudness patterns resulting from a formant frequency shift. To model formant frequency discrimination, this constant change in the excitation/loudness patterns needs to be computed first to be used in a simulation model as a decision statistic to predict thresholds of formant frequency discrimination. Thus, three major steps were taken: computation of the mean change of excitation/loudness patterns between standard and just-noticeable-different vowels, selection of auditory metrics, and using the auditory simulation model to predict thresholds of formant frequency discrimination. These steps are described below in detail.

2.4.1. Computation of the Change in the Excitation/Loudness Patterns

Excitation and loudness patterns were computed for standard vowels and for vowels at average discrimination thresholds for six listeners using linear predicative coding (LPC; LPC order 16 and 1024-point analysis frame) as the input to the excitation-pattern model. LPC is a method in audio signal processing that is used to represent the spectral envelopes of acoustic signals by using the information from a linear predictive model [29]. The excitation patterns for the vowels were calculated as the output of each auditory filter as a function of center frequency in 0.1-ERBN steps. The excitation pattern was then transformed into the loudness pattern in units of sones/ERBN. To model the listeners’ performance in vowel formant frequency discrimination, a measure of the difference between excitation/loudness patterns was calculated by subtracting the excitation/loudness pattern of the standard vowel from the excitation/loudness pattern of the vowel at formant discrimination threshold. In the present work, these differences are called the excitation difference profile (EDP) and loudness difference profile (LDP). The EDP and LDP were obtained for each vowel formant at 70, 85, and 100 dB SPL. For example, the EDP and LDP values for the threshold of F2 discrimination for the /ε/ vowel at 70 dB SPL are shown in the two right panels of Figure 2.

2.4.2. Selection of Auditory Metrics for Formant Frequency Discrimination

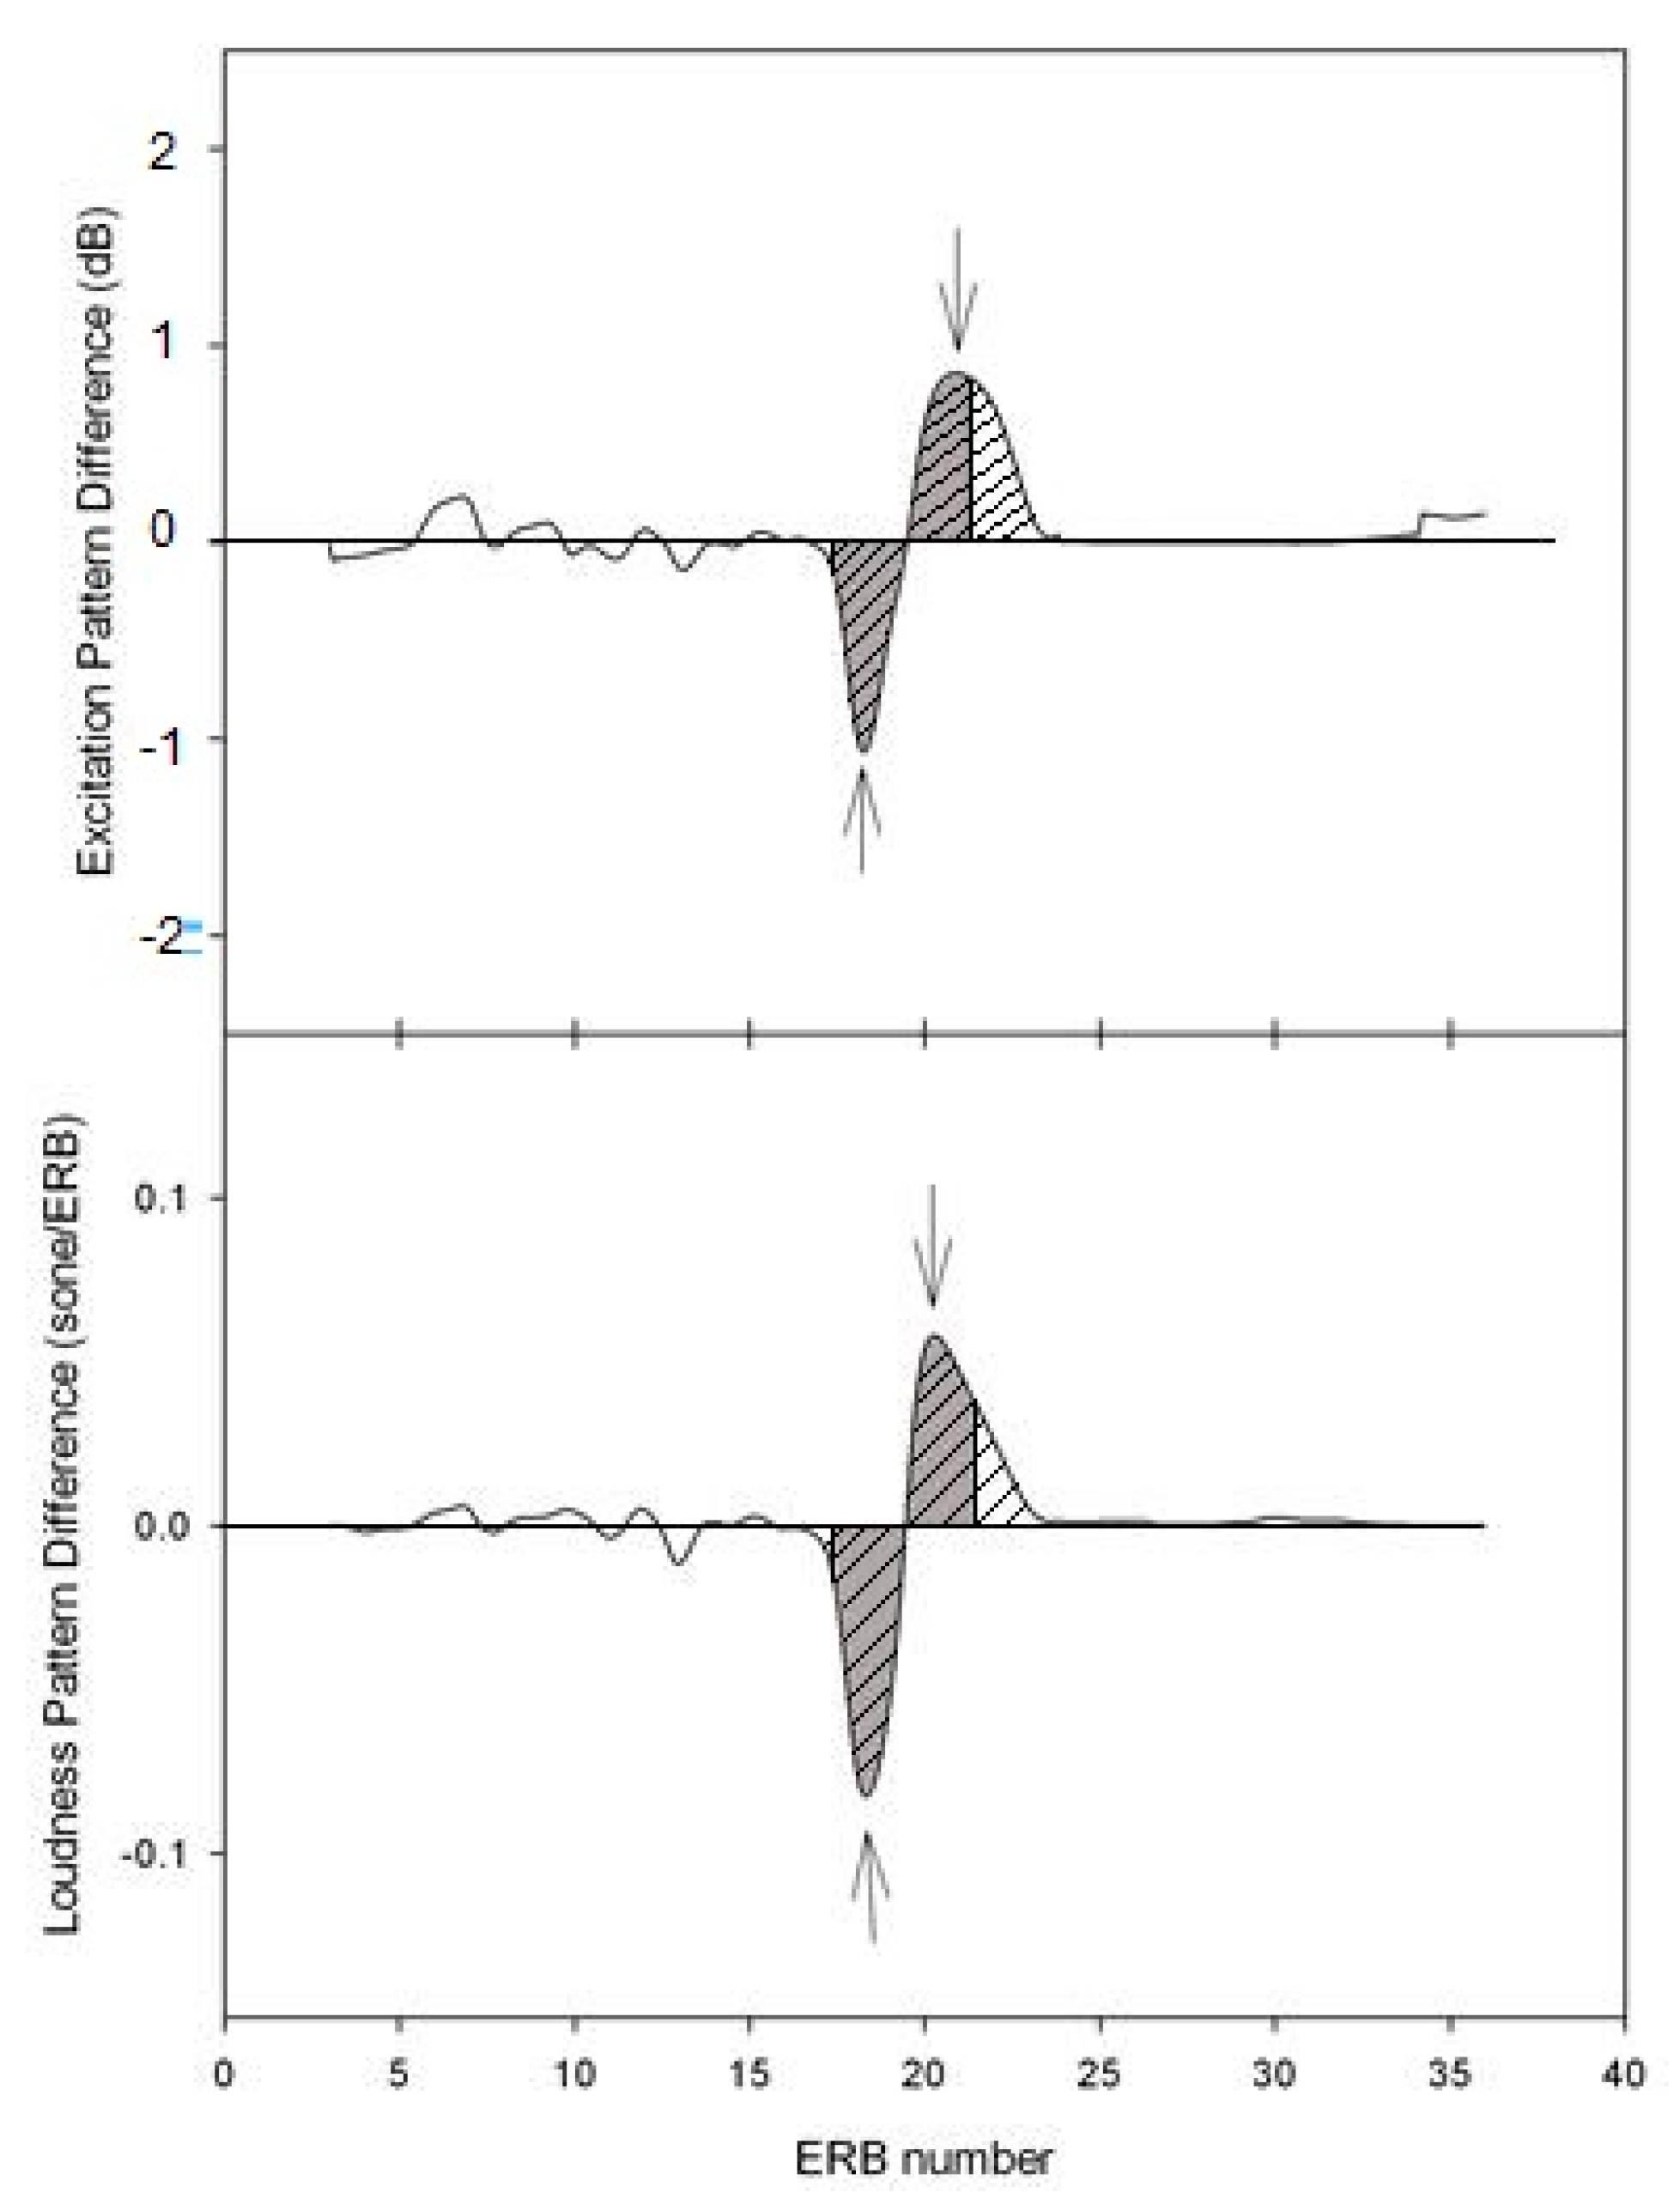
Several auditory metrics can be used to model vowel formant frequency discrimination based on the EDP and LDP. As previous modeling studies suggested that vowel formant discrimination primarily relied on the intensity change of harmonics near the shifted format peak [1,20], three metrics around the target formant were selected based on the characteristics of the EDP and LDP, i.e., the peak-to-valley contrast and the area integrated over specific frequency regions (4-ERBN area and 1-peak-1-valley area).
  • Peak-to-valley contrast
The peak-to-valley contrast was defined as the absolute difference between the positive and negative peaks in excitation levels or specific loudness near the formant frequency for the EDP and LDP. Computation of the peak-to-valley contrast is illustrated in Figure 3. The peak-to-valley contrast yields a value of 2.2 dB for the EDP and 0.051 sones/ERBN for the LDP.
b.
4-ERBN area
Two limited frequency ranges close to the target formant were selected: a 4-ERBN range and a range, constrained to the area occupied by one peak and one valley, called 1-peak-1-valley. For both the 4-ERBN and 1-peak-1-valley metrics, the absolute area under the curve within the specified frequency range in the EDP and LDP was calculated. Selection of the 4-ERBN area metric was based on the study of Kewley-Port and Zheng who, using the excitation pattern, demonstrated that the 4-ERBN metric could account for the effects of formant frequency and fundamental frequency on vowel formant frequency discrimination in quiet [1]. The 4-ERBN range was centered on the zero-crossing point near the formant frequency. To illustrate the 4-ERBN metric, again, consider the EDP and LDP represented by the solid curves for the /ε/ vowel in Figure 2. The zero-crossing point near the F2 of the /ε/ vowel corresponds to 21.3 ERBN. The absolute values of the 4-ERBN area, between 19.3 ERBN and 23.3 ERBN, were 2.16 dB-ERBN for the EDP (the dark-shaded area in the upper panel of Figure 3) and 0.011 sones for the LDP (the dark-shaded area in the lower panel of Figure 3).
c.
1-peak-1-valley area
The 1-peak-1-valley range was selected to start where the negative area started and to end where the positive area ended in the EDP/LDP, with the center formant frequency always being included. This is also illustrated in Figure 3. The 1-peak-1-valley area extended from 13.5 ERBN to 23.5 ERBN, and the absolute area under this range (the striped areas in the upper and lower panels of Figure 3) was 2.48 dB-ERBN for the EDP and 0.013 sones for the LDP. Since the 1-peak-1-valley range is generally wider than the 4-ERBN range, the 1-peak-1-valley metric has higher values than the 4-ERBN metric.
The three auditory (excitation or loudness) metrics were calculated for each vowel formant at each speech level. For each auditory metric, an average was then computed over vowel formants and speech levels as shown in Table 1. This average was used as the decision statistic in the simulation model described below for the prediction of thresholds for vowel formant frequency discrimination across vowel formants and speech levels. It should be noted that the auditory metrics were evaluated directly to interpret the variability of formant discrimination threshold caused by formant frequency in Kewley-Port and Zheng’s modeling study [1] whereas in the present study, they were used for threshold prediction.

2.4.3. Auditory Simulation Model to Predict Thresholds of Formant Frequency Discrimination

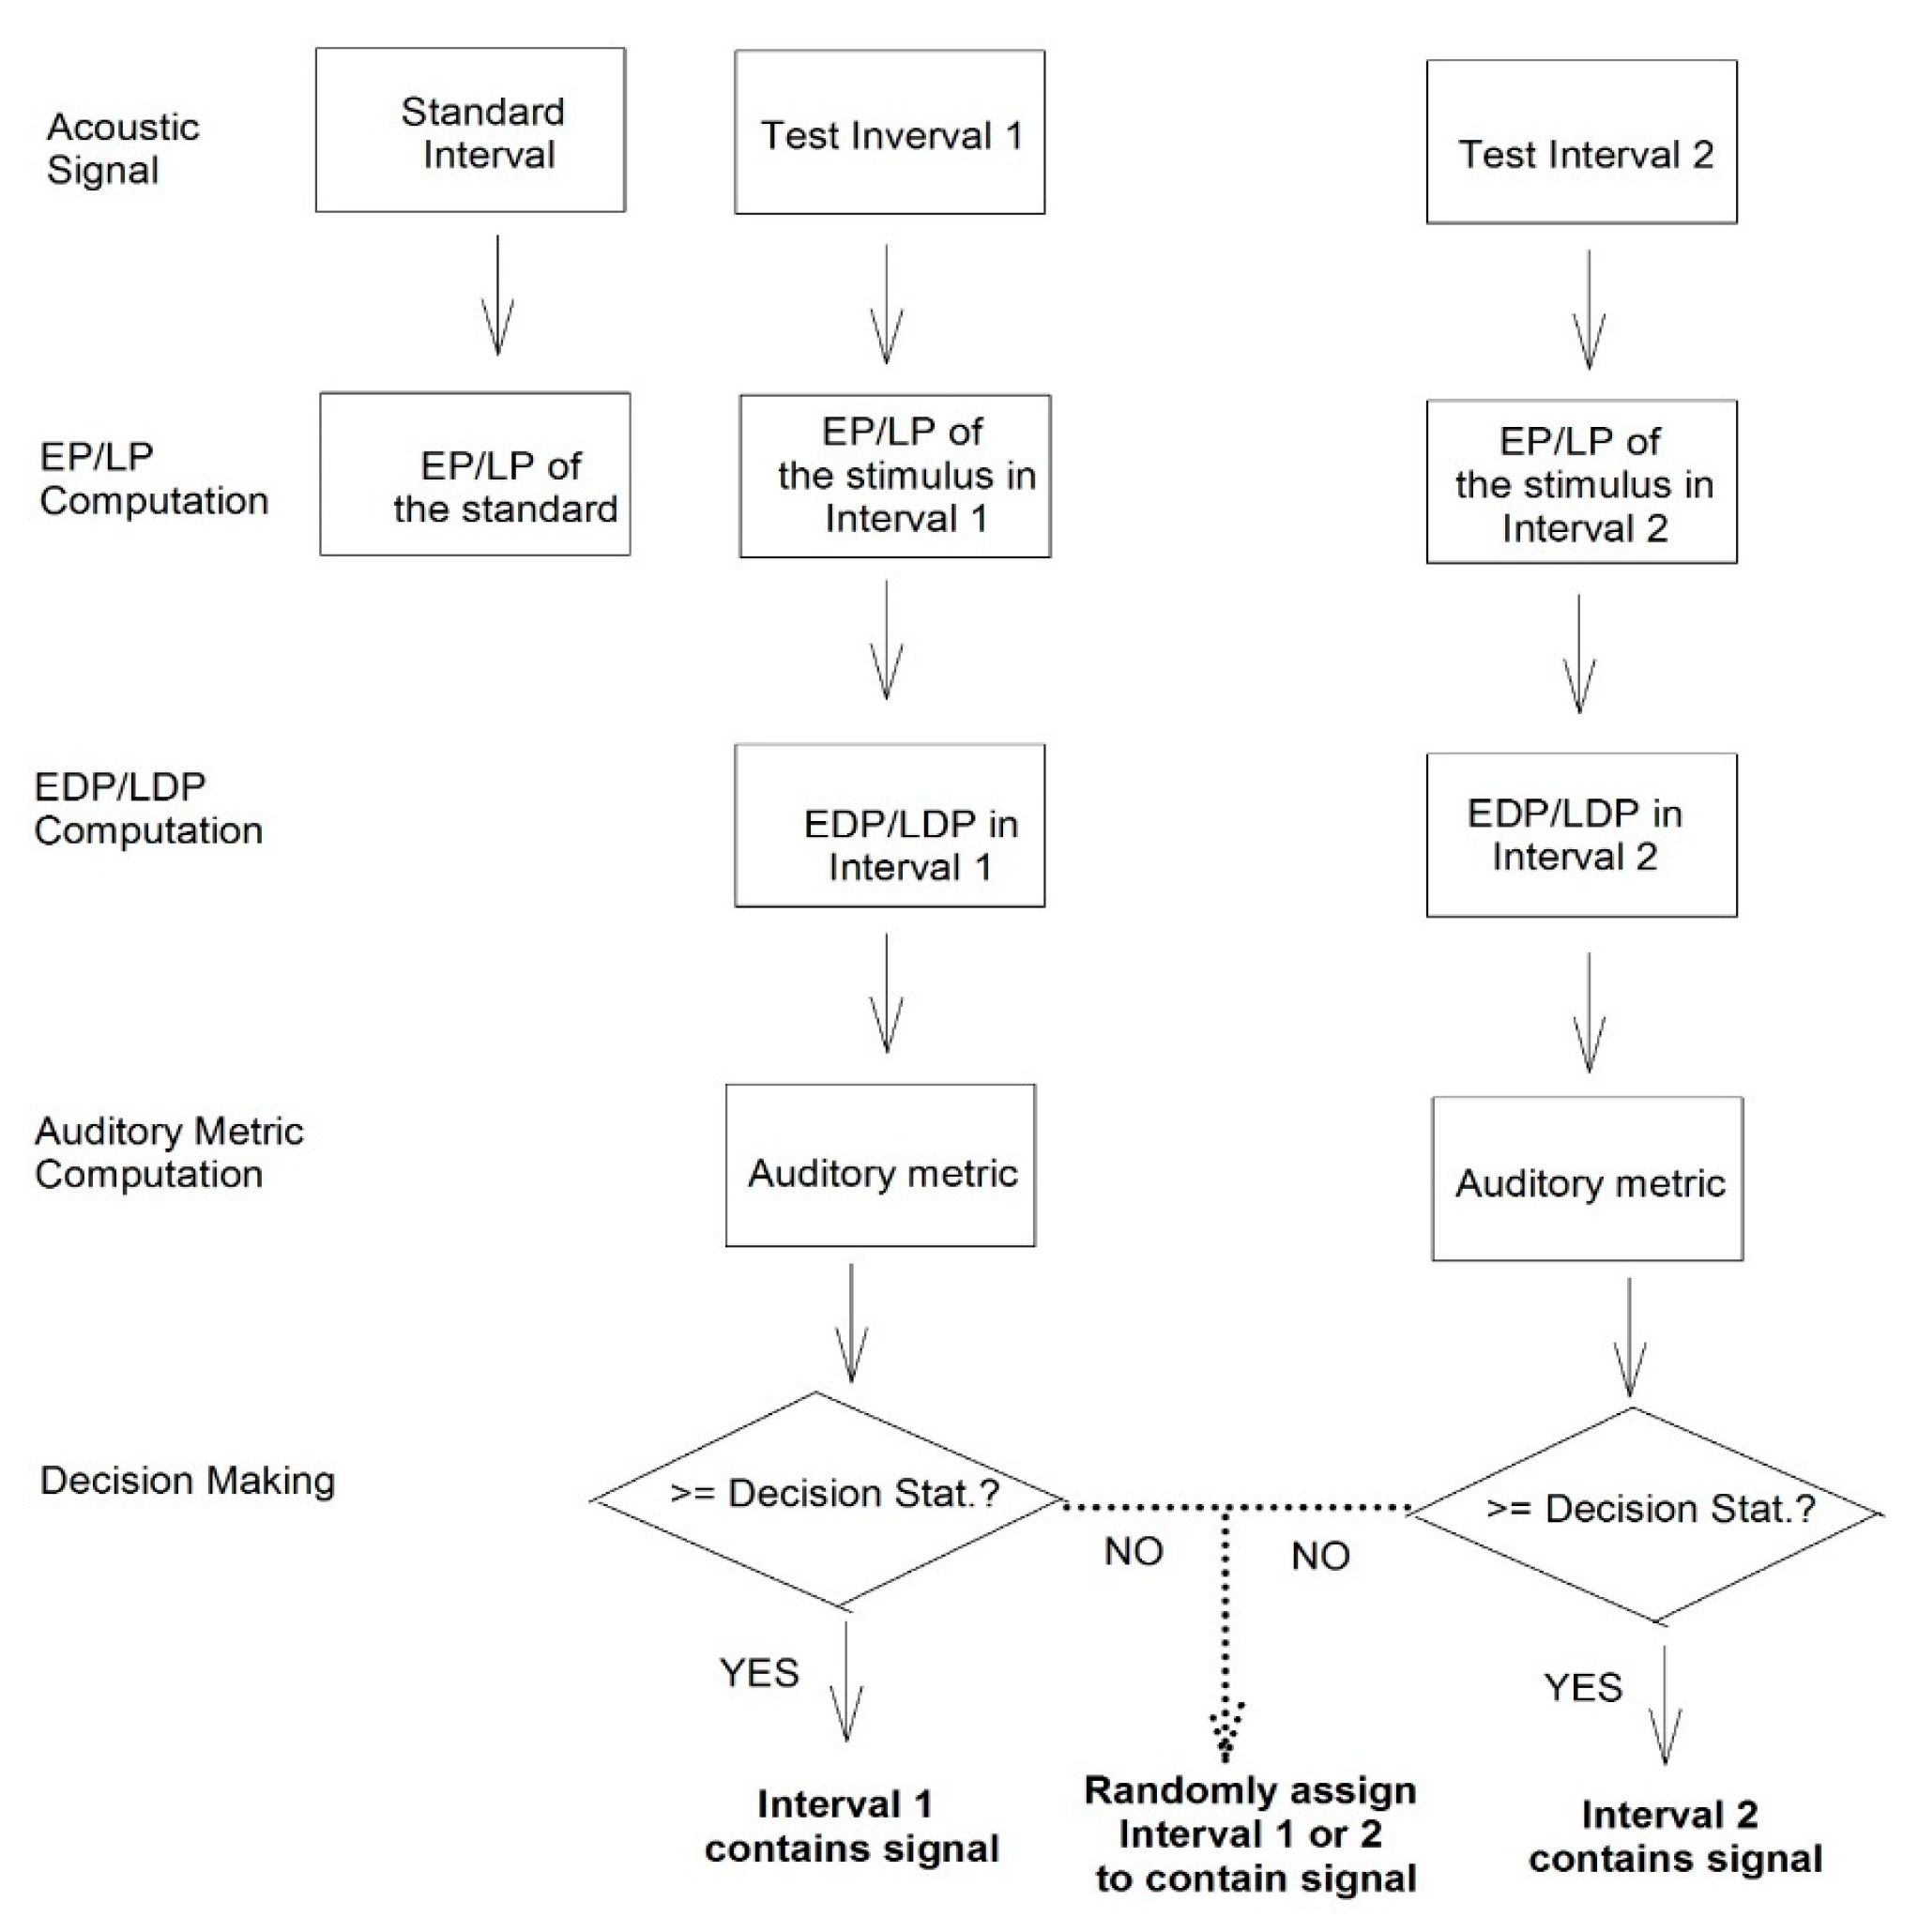
The auditory simulation model, executed in the MATLAB® software package, used a three-interval, two alternative forced-choice (2AFC) procedure with an adaptive algorithm, following a two-down and one-up rule. Stimulus generation, presentation, and adaptive tracking methods were identical to those in the behavioral experiment [13]. Altogether, Figure 4 illustrates the algorithm of the simulation model. It follows the structure of auditory models proposed by Dau and his colleagues [30,31,32,33]. Since not every change in vowel formant frequency can be perceptually detected, a change in the auditory metric has to be greater than or equal to a decision statistic to detect a formant frequency shift. For a given trial, three intervals were present with the first interval as the reminder containing the standard vowel, followed by two test intervals in which one contained the formant-shifted vowel and the other had the standard vowel. Excitation/loudness pattern was calculated for each of the three intervals. For each of the two test intervals, the EDP or LDP was then computed by subtracting the excitation/loudness pattern of the reminder interval from the excitation/loudness pattern of the test interval. The next step was to calculate the auditory metric from the EDP or LDP as described above. The signal interval was chosen as the test interval that generated the auditory metric greater than or equal to the decision statistic obtained above (see Section 2.4.2). If both test intervals produced an auditory metric result smaller than the decision statistic, the signal interval was randomly selected from the two test intervals, simulating the behavioral tests in which human listeners were asked to guess, if they were not sure, which interval was different from the reminder interval. For a given block with 60 trials, formant shift started at 10% with a step size of 0.7%., and the threshold was computed as the last even number of reversals excluding the first three reversals. The predicted threshold for each of the 24 conditions (8 vowel formants × 3 speech levels) was computed by averaging the thresholds obtained from three 60-trial blocks. Six sets of thresholds were obtained—one based on each of the six auditory metrics (three metrics × two auditory models) reported above.

3. Results

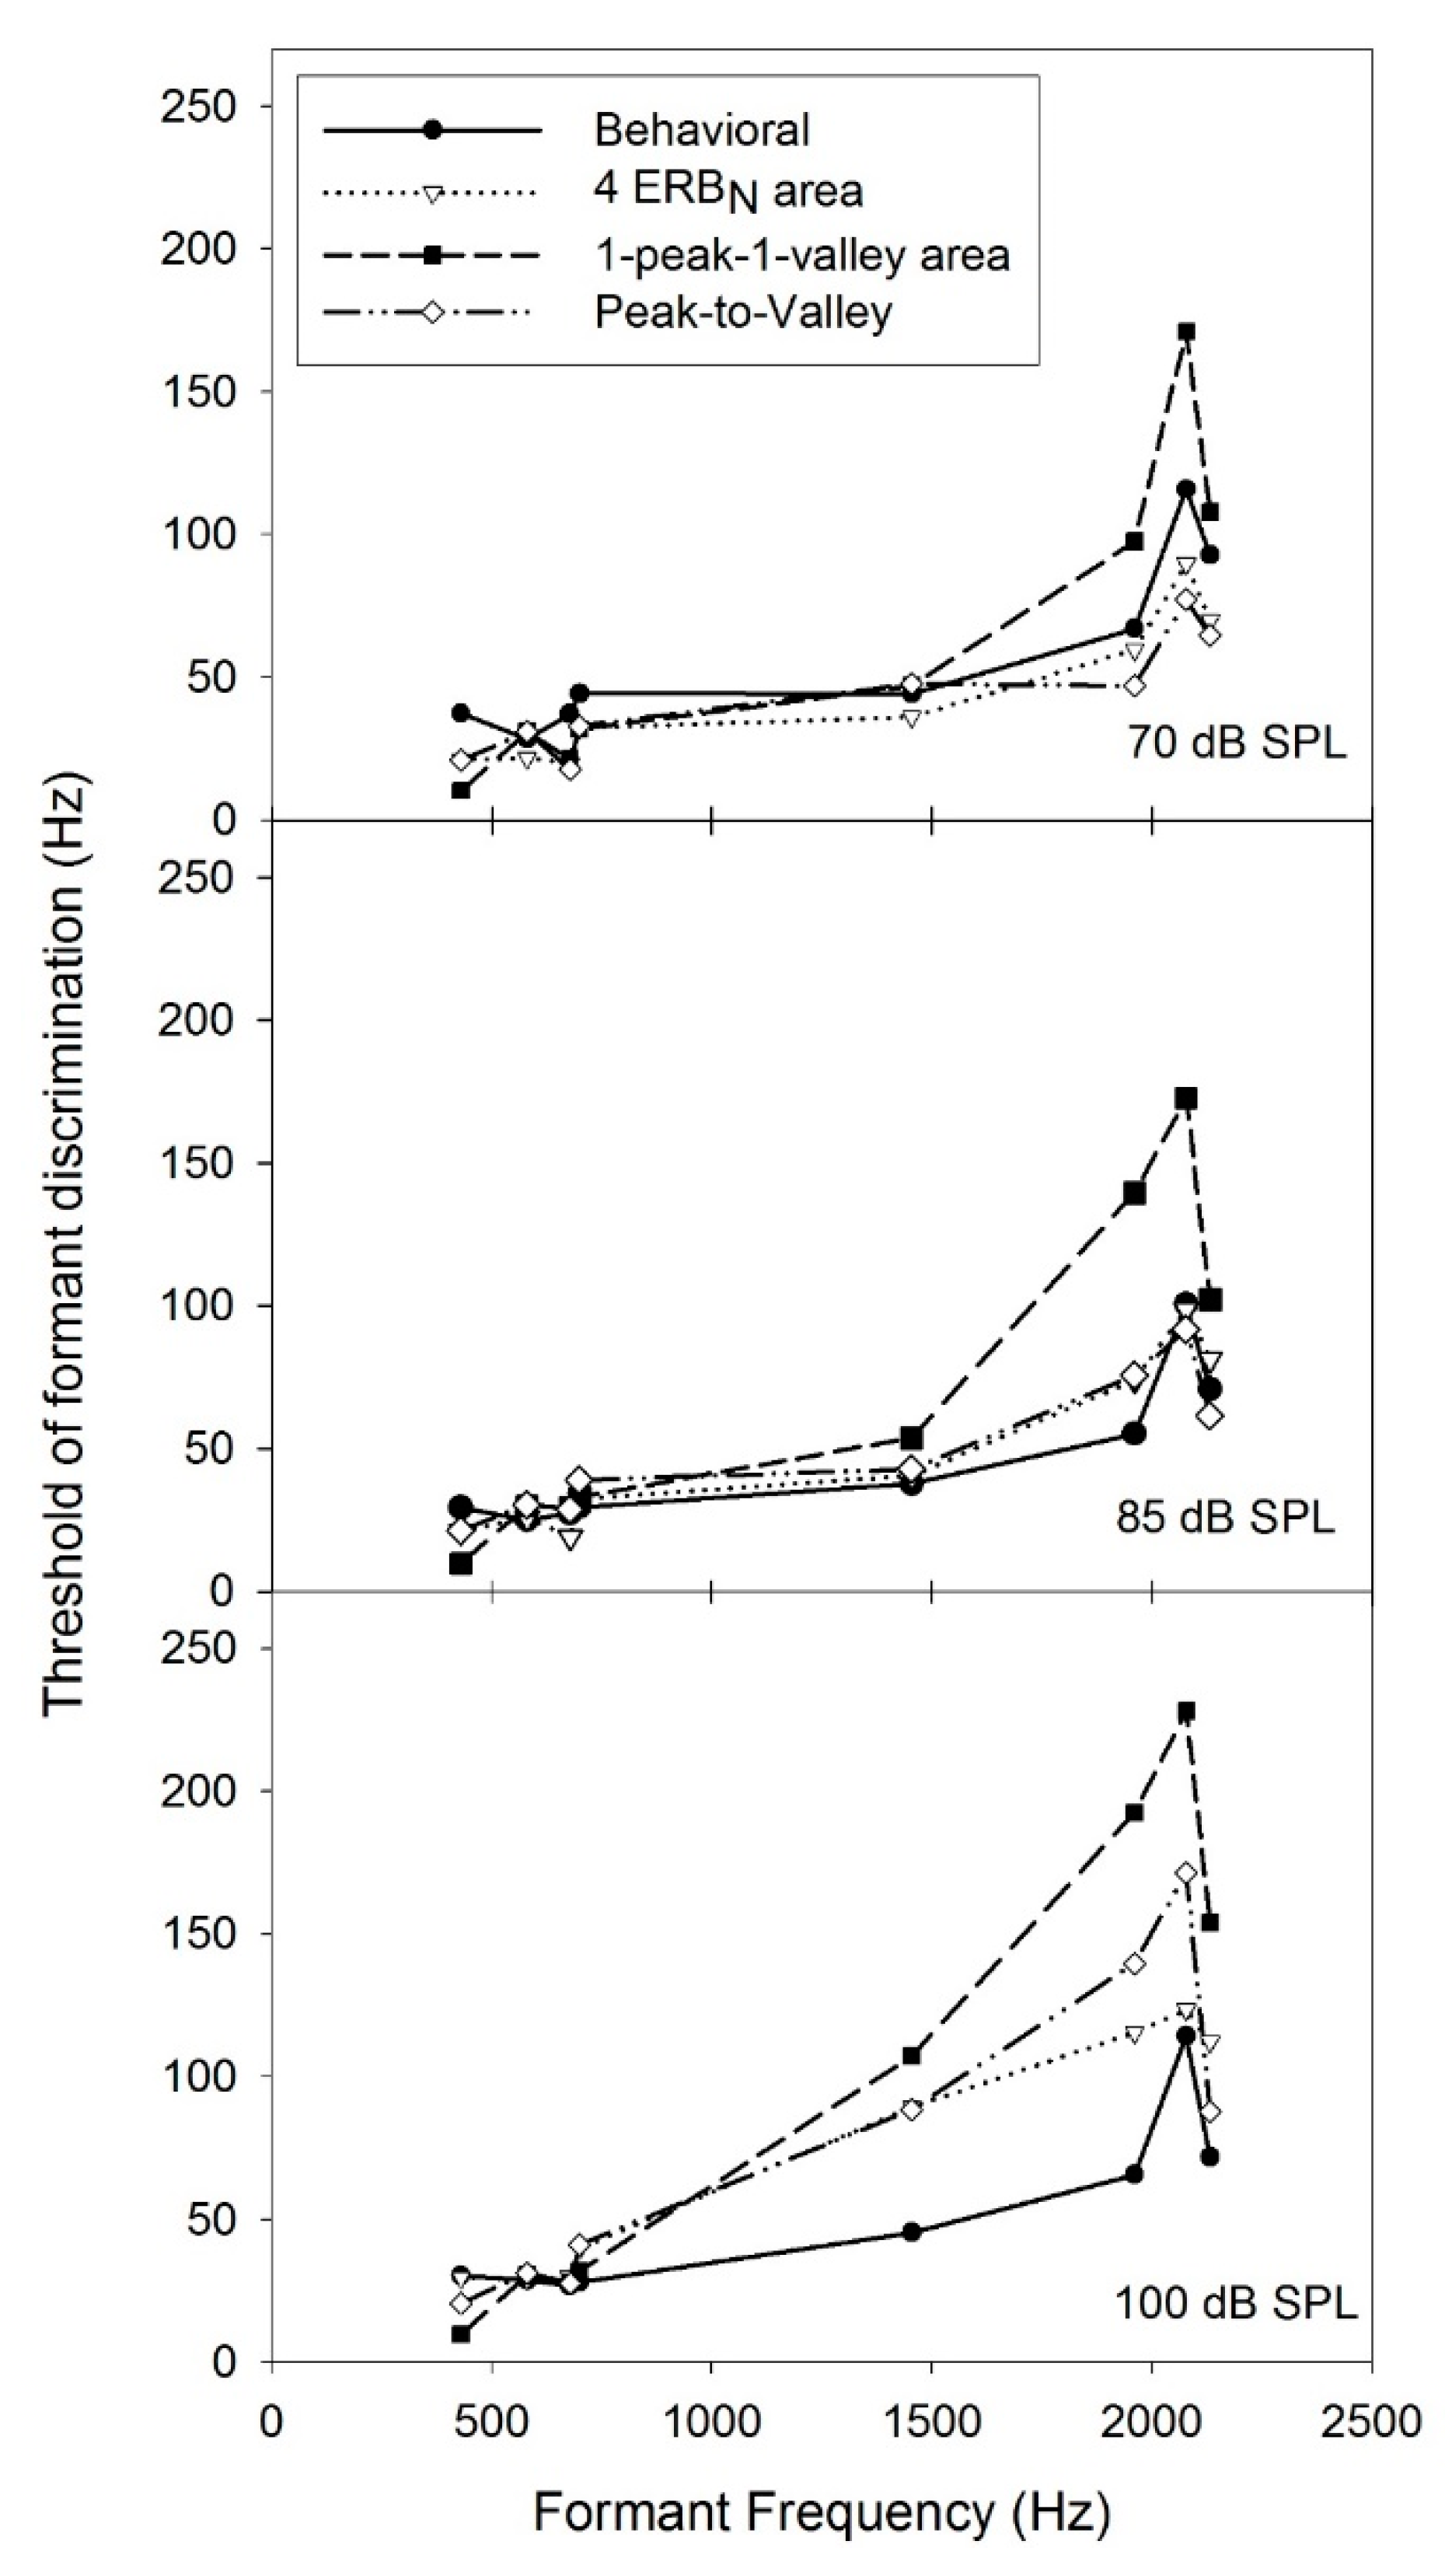
Figure 5 and Figure 6 illustrate the thresholds predicted from the three auditory metrics at each speech level for the excitation-pattern and loudness-pattern models, respectively. The predicted thresholds showed similar frequency-dependent patterns as observed for the measured thresholds for all the three speech levels. Additional analysis indicated that the predicted thresholds had high correlations (see Table 2: Pearson linear correlation r > 0.90 and 95% confidence intervals for all the auditory metrics; all ps < 0.05) with the measured thresholds as a function of formant frequency for each of the three speech levels. Another analysis to evaluate the fit of the prediction to the behavioral thresholds required us to calculate the root-mean-square-errors (RMSEs), the square roots of the means of the squares of the residuals between predicted and measured thresholds. As shown in Table 3, the RMSEs ranged from 8.3 to 53.1 Hz across the six auditory metrics and three speech levels.
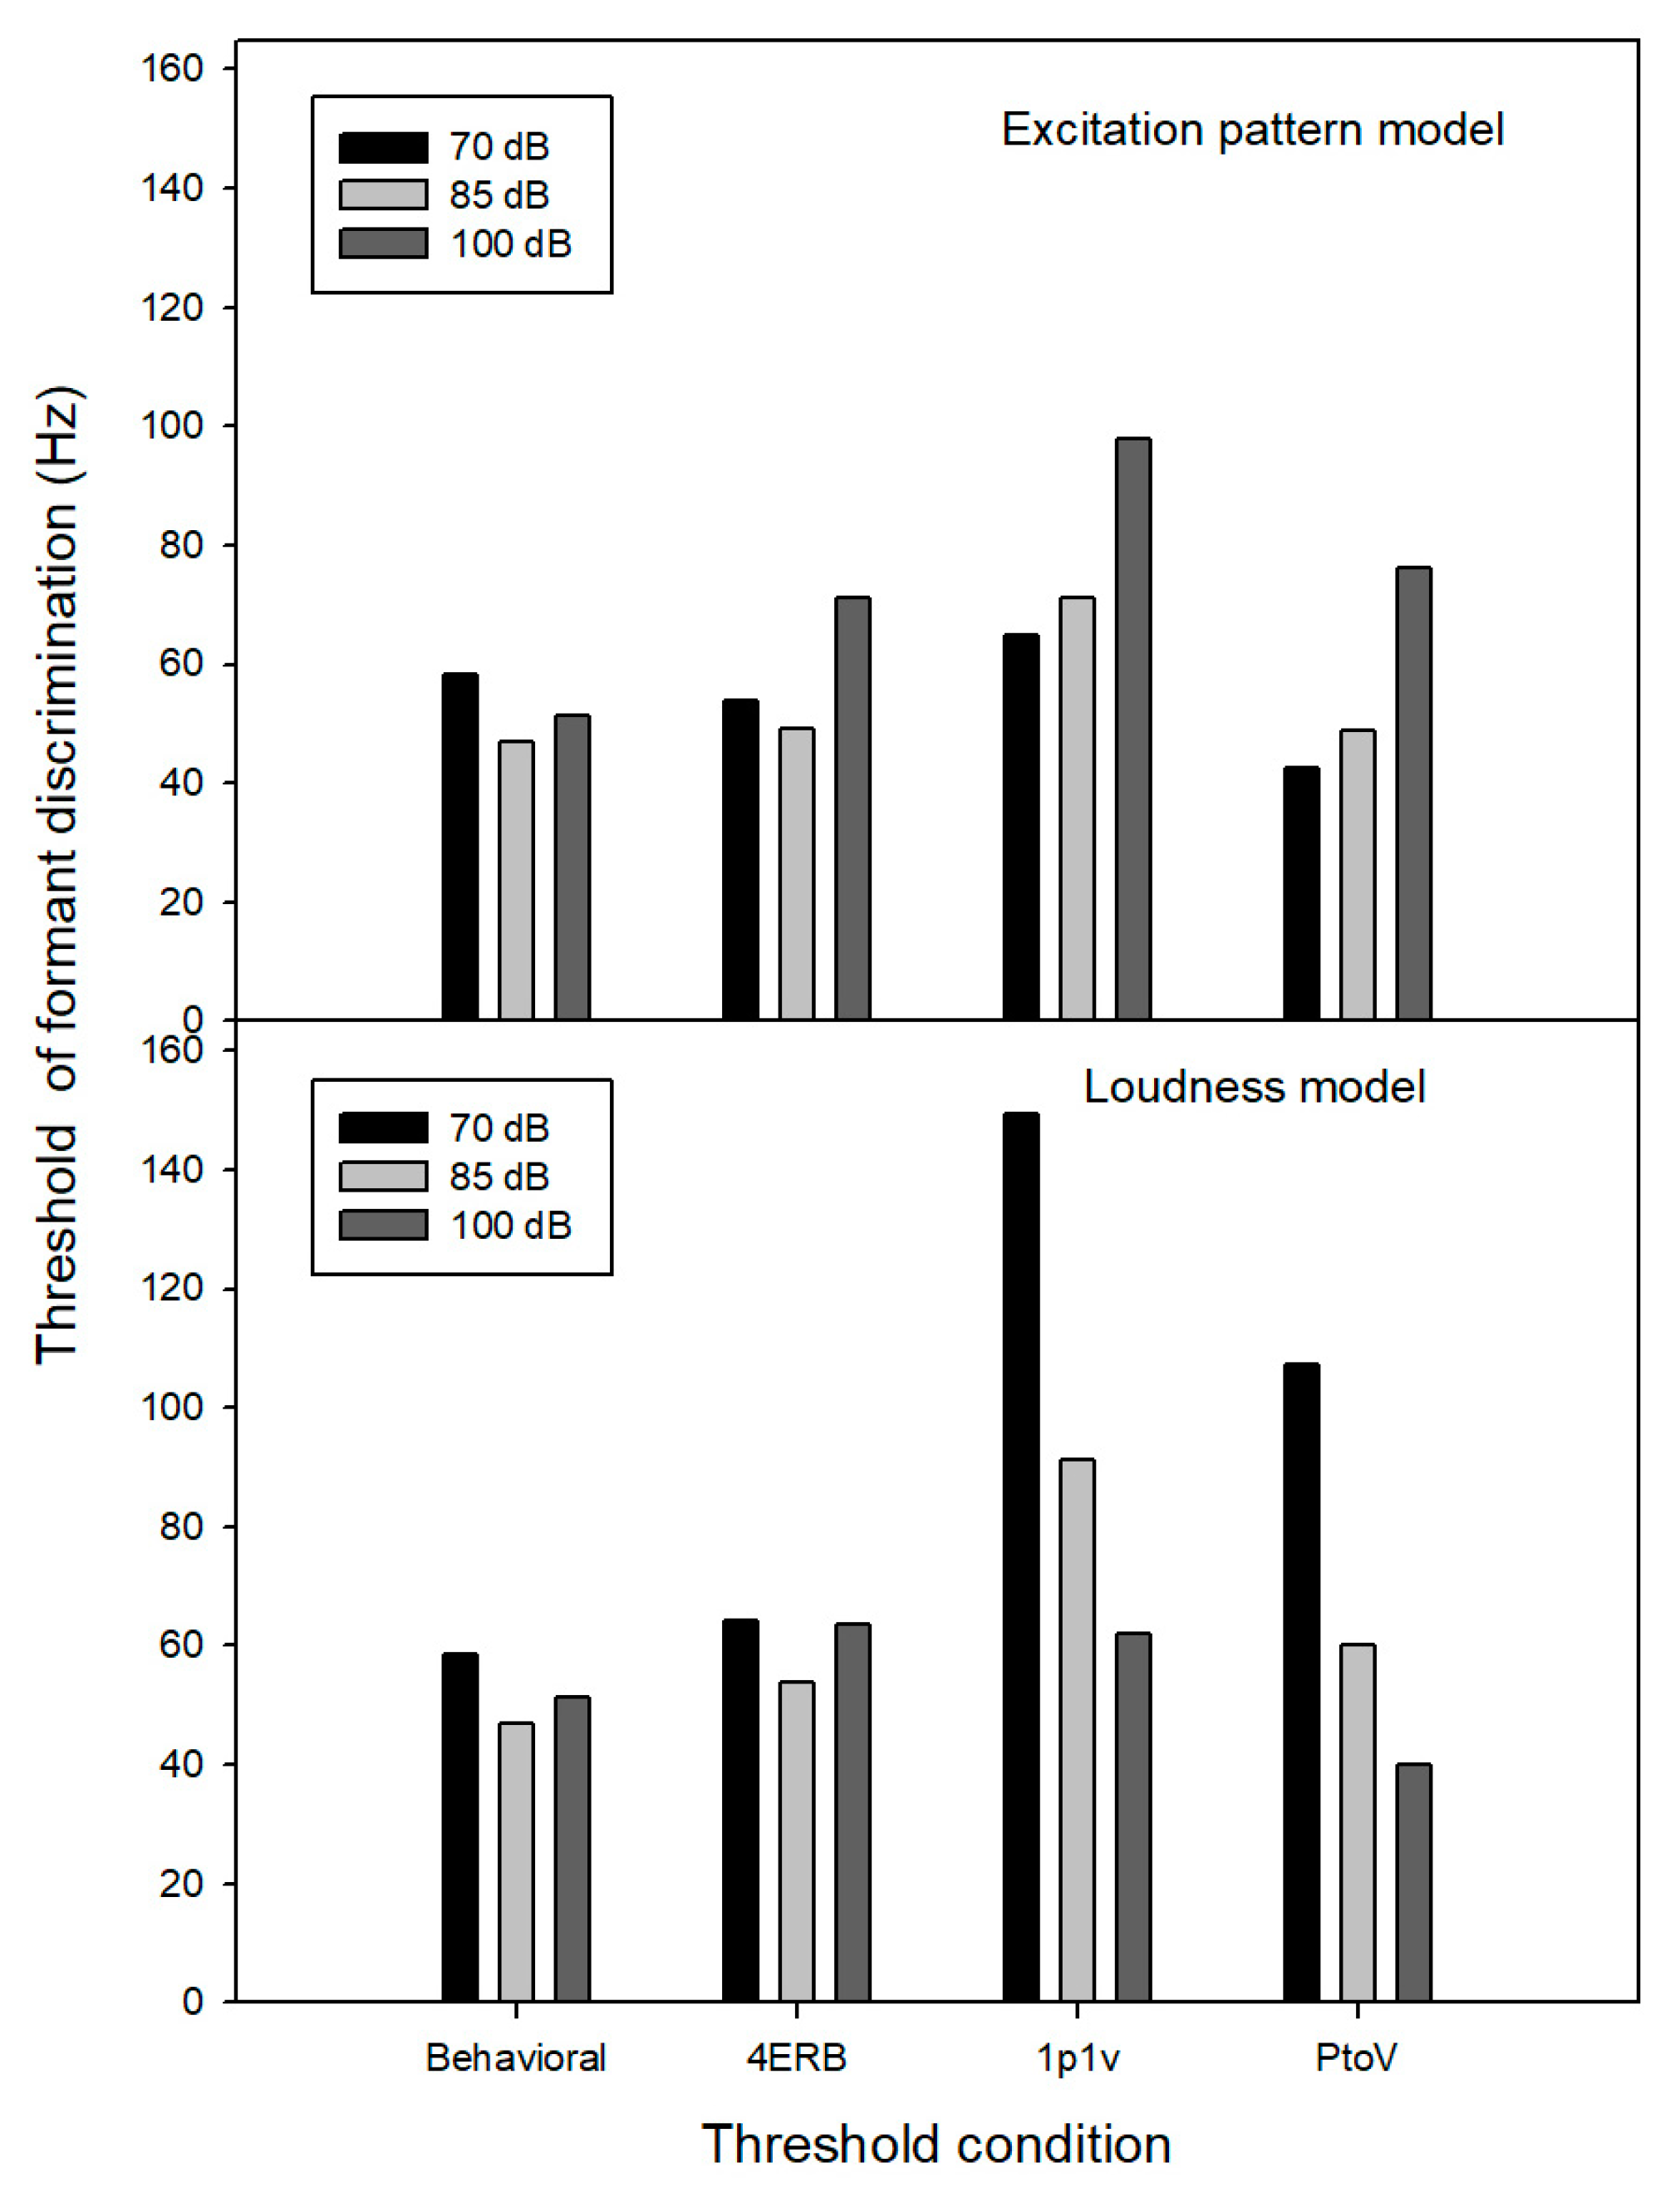
In addition to formant frequency, another factor influencing formant discrimination, speech level, was also examined. The average thresholds of formant discrimination over the eight formant frequencies were plotted for the behavioral data and the six sets of predictions (three from the excitation-pattern model and three from the loudness model) for the three speech levels—70, 85, and 100 dB SPL—in Figure 7. The rollover effect of speech level (i.e., thresholds became better from 70 to 85 dB SPL and then worse from 85 to 100 dB SPL) was presented for the predicted thresholds only from the 4-ERBN metrics, but not from the predicted thresholds from the other two auditory metrics.
Overall, for all auditory metrics, the thresholds for formant frequency discrimination predicted from the excitation-pattern and loudness-pattern using the 4-ERBN metric showed the best fits to behavioral thresholds in two ways: first, there were smaller RMSEs compared to thresholds predicted from the excitation-pattern and loudness-pattern 1-peak-1-valley metric (see Table 3) when the effect of formant frequency was considered; and second, there was a matched rollover effect of speech levels with the behavioral thresholds (see Figure 7) without the rollover pattern for the thresholds predicted from the other two auditory metrics. The results of these simulations indicate that the variability in thresholds of formant frequency discrimination that is associated with formant frequency and speech level can be well explained by a constant change in excitation/loudness pattern near the target formant.

4. Discussion

In this section, first, the three auditory metrics used to interpret vowel formant frequency discrimination are compared and discussed. Second, we discuss how the current auditory models can be used to interpret vowel formant discrimination in more ordinary listening conditions. Lastly, how the auditory models can be extended to predict the performance of spectral shape discrimination related to speech enhancement is discussed, as is how the auditory simulation model can be used with deep learning models to enhance auditory perception.

4.1. Auditory Metrics for Vowel Formant Frequency Discrimination

The auditory metrics derived from the excitation and loudness patterns for comparing vowel formants and speech levels were evaluated based on the hypothesis that thresholds for vowel formant frequency discrimination can be accounted for by a constant auditory measure. To evaluate the success of these auditory metrics, an auditory simulation model, using a single-valued auditory metric as the decision statistic, was used to predict thresholds of formant frequency discrimination and to examine whether those predicted thresholds could match thresholds obtained from human listeners. As shown in Figure 5 and Figure 6, thresholds predicted from the auditory metrics showed patterns very similar to those of the measured thresholds as a function of formant frequency at each speech level (all r > 0.90, see Table 2). Of these auditory metrics, the 4-ERBN and peak-to-valley contrast metrics appeared to be more successful at predicting formant thresholds, with their smaller deviations to behavioral thresholds than the 1-peak-1-valley metric. Plus, the rollover effect of speech level was found from the prediction by the 4-ERBN metric. These results suggest that changes in the salient regions near the target formant, particularly the area covering four auditory critical bandwidths (i.e., 4-ERBN), play a critical role in vowel formant frequency discrimination, consistent with Sommers and Kewley-Port’s finding that amplitude changes in one to three harmonics near the target formant determined discrimination of vowel formant frequency [20]. In addition, Kewley-Port and Zheng found that the excitation-pattern and loudness-pattern models successfully explained the effects of formant frequency and fundamental frequency on vowel formant frequency discrimination [2], while Liu reported that a simulation model based on the 4-ERBN metric with the excitation-pattern model had had a successful prediction of thresholds of formant discrimination across vowel formant frequency [1]. Taken together, these modeling studies indicate that listeners detect relatively constant changes in excitation/loudness patterns to discriminate vowel formant frequency, although formant frequency discrimination thresholds change with acoustic features of vowel sounds such as fundamental frequency, formant frequency, and speech level.
The deviation between the measured and predicted thresholds may be accounted for by several possibilities. First, the calculation of exaction and loudness patterns was simplified in the present study by using models based on average auditory filter bandwidth estimates and average loudness growth functions obtained from young normal-hearing listeners. Moore suggested that there was substantial variability in frequency selectivity in young normal-hearing listeners [34]. Individual differences in frequency selectivity and loudness growth across frequencies were not considered in the present study. This may limit the individualization of the simulation model, particularly when the individual variability of auditory filter bandwidth may need to be considered. Second, the complex acoustic features of vowel signals were simplified in the present modeling study. That is, only an average spectrum was used to acoustically represent the studied vowel, and the corresponding excitation and loudness patterns did not include the temporal properties of vowels. In particular, vowel duration varied from 107 to 198 ms in the present study, but this was not included in the current modeling work. For more dynamic stimuli, the successful prediction of formant frequency discrimination thresholds will need to include the temporal features of speech stimuli with the excitation-pattern and loudness-pattern models updated by Glasberg and Moore [35]. The effect of vowel duration on vowel formant discrimination in human listeners needs further investigation. Moreover, great variability in signal duration across speech sounds may require the estimation procedure to incorporate duration-specific parameters. Despite these limitations, the variance in formant frequency discrimination thresholds associated with formant frequency and speech level was explained reasonably well by the excitation-pattern and loudness-pattern models, given that the vowel stimuli in this study were steady-state vowels with little temporal variation.

4.2. Modeling Vowel Formant Frequency Discrimination in Ordinary Listening Conditions

A difference in the excitation/loudness patterns, specified as the excitation/loudness difference profile produced by a formant shift, is assumed to result from an internal comparison between the standard and formant-shifted vowel that needs to be processed in the cochlea and then in the central auditory system. Thus, formant frequency discrimination may be influenced by factors in the central processing of vowel signals. In fact, previous research identified several other factors besides formant frequency and speech level that may affect vowel formant frequency discrimination, such as subject training and phonetic context [9,10,12]. For a given formant shift, presumably neither phonetic context nor subject training can directly affect the excitation/loudness difference profile. However, both of them have significant effects on the thresholds of formant frequency discrimination. For example, thresholds of vowel formant frequency discrimination are increased by longer phonetic context [9,10], and listeners with extensive training have shown significantly better performance than naïve listeners [12]. Moreover, American English native listeners showed better performance with regards to formant discrimination for both English and Chinese vowels than Mandarin Chinese native listeners, possibly due to more crowded vowel space for English than for Chinese [36]. These findings suggest that processes beyond the comparison of excitation/loudness patterns are involved in the discrimination of vowel formants and that some factors, like vowel density and perceptual training, may increase listeners’ sensitivity to excitation/loudness difference profiles.
In the present study, isolated vowels were used as stimuli in order to remove the effects of phonetic context, and a minimal stimulus uncertainty task was used to reduce the effects of short-term memory, while the use of a fixed standard vowel during the adaptive procedure may have led to perceptual adaptation in the listeners. The results of the present research indicate that vowel formant frequency discrimination for isolated vowels in quiet can be predicted well by the excitation and loudness difference closely surrounding the formant for F1 and F2 formant frequencies and for three speech levels. To generalize the model of vowel formant frequency discrimination to ordinary listening conditions, both temporal features of vowels as well as cognitive factors that play a role in ordinary communication with phrases and sentences should be included in future modeling.

4.3. Applications of Auditory Models for Vowel Formant Discrimination

As recent studies in our laboratory reported significant improvements in the processing of formant peaks of vowel stimuli in listeners with normal and impaired hearing due to spectral enhancement [23], the auditory models applied in this study may be used to predict the benefit in speech perception, if any, of the spectral enhancement of formant peaks. That is, if the excitation-pattern and loudness-pattern models could successfully provide the internal presentation of spectral features of speech stimuli in quiet and noise conditions for normal-hearing and hearing-impaired listeners, these auditory models may be able to predict whether a given spectral enhancement (e.g., a 6-dB F2 enhancement) is able to benefit a given listener with normal hearing or hearing loss in different listening conditions.
Furthermore, although one primary goal of the present study was to use the auditory simulation models to find common perceptual strategies for vowel formant discrimination in normal-hearing listeners, it should be noted that human listeners generally showed remarkable individual variability in auditory tasks including formant discrimination [12,13], possibly to individual differences in the auditory processing of acoustic cues. Thus, to simulate individual performance in formant discrimination and spectral shape discrimination, several parameters in the two auditory models may need to be individualized, such as auditory filter bandwidth and loudness growth function. If the individualization of these auditory simulation models succeeds, deep learning models can be used to optimize the perceptual strategies in different listening environments for individual listeners. For example, these auditory simulation models can be used to predict the availability of spectral cues (e.g., formant peaks) while deep learning models could improve signal-to-noise ratios (SNRs) by using noise reduction and/or speech enhancement. In particular, such improvements in SNRs can be conducted at an individual level based on each listener’s hearing status and auditory processing capacity. Eventually, a customized hearing solution can be provided to each individual.

5. Conclusions

The main purpose of this study was to investigate whether an excitation-pattern model [19] and/or a loudness model [20,24] could account for vowel formant frequency discrimination. A change in formant frequency produces intensity changes for the harmonic components near the formant, resulting in changes in the excitation and loudness patterns. The auditory metrics based on the excitation-pattern and loudness-pattern models were investigated. The absolute area of the excitation/loudness difference profile within a 4-ERB region and the peak-to-valley contrast in the excitation/loudness difference profile near the target formant were successful in predicting formant frequency thresholds with high correlations to, and small deviations from, the measured thresholds. These results indicate that normal-hearing listeners may use relatively constant changes in excitation/loudness patterns to discriminate shifts in vowel formant frequencies in a quiet listening condition regardless of formant frequency and speech level. In other words, normal-hearing listeners may need relatively constant changes in the internal spectral presentation to discriminate the spectral shape changes of sounds, which, potentially, can be used to simulate the spectral processing that occurs in hearing-impaired listeners.

Author Contributions

Conceptualization, C.L.; methodology and computation: C.X. and C.L.; data analysis: C.X. and C.L.; writing: C.X. and C.L. All authors have read and agreed to the published version of the manuscript.

Funding

This research received no external funding.

Informed Consent Statement

Not applicable.

Data Availability Statement

The data presented in this study are available on request from the corresponding author.

Acknowledgments

Special thanks are given to Rahul Shrivastav and Shawn Goodman for helping with programming the excitation-pattern and loudness-pattern models in MATLAB®.

Conflicts of Interest

The authors declare no conflict of interest.

References

  1. Liu, C. Auditory model of intensity discrimination and vowel formant discrimination: Effect of signal frequency. In Proceedings of the 2009 3rd International Conference on Bioinformatics and Biomedical Engineering, Beijing, China, 11–13 June 2009; pp. 1–4. [Google Scholar]
  2. Kewley-Port, D.; Zheng, Y. Auditory models of formant frequency discrimination for isolated vowels. J. Acoust. Soc. Am. 1998, 103, 1654–1666. [Google Scholar] [CrossRef]
  3. Miller, J.D. Auditory-perceptual interpretation of the vowel. J. Acoust. Soc. Am. 1989, 85, 2114–2134. [Google Scholar] [CrossRef]
  4. Nearey, T.M. Static, dynamic, and relational properties in vowel perception. J. Acoust. Soc. Am. 1989, 85, 2088–2113. [Google Scholar] [CrossRef]
  5. Hillenbrand, J.; Getty, L.A.; Clark, M.J.; Wheeler, K. Acoustic characteristics of American English vowels. J. Acoust. Soc. Am. 1995, 97, 3099–3111. [Google Scholar] [CrossRef]
  6. Kewley-Port, D.; Watson, C.S. Formant frequency discrimination for isolated English vowels. J. Acoust. Soc. Am. 1994, 95, 485–496. [Google Scholar] [CrossRef]
  7. Lyzenga, J.; Horst, J.W. Frequency discrimination of stylized synthetic vowels with a single formant. J. Acoust. Soc. Am. 1997, 102, 1755–1767. [Google Scholar] [CrossRef]
  8. Lyzenga, J.; Horst, J.W. Frequency discrimination of stylized synthetic vowels with two formants. J. Acoust. Soc. Am. 1998, 104, 2956–2966. [Google Scholar] [CrossRef]
  9. Kewley-Port, D.; Zheng, Y. Vowel formant discrimination: Towards more ordinary listening conditions. J. Acoust. Soc. Am. 1999, 106, 2945–2958. [Google Scholar] [CrossRef]
  10. Kewley-Port, D. Vowel formant discrimination II: Effects of stimulus uncertainty, consonantal context, and training. J. Acoust. Soc. Am. 2001, 110, 2141–2155. [Google Scholar] [CrossRef]
  11. Richie, R.; Kewley-Port, D.; Coughlin, M. Discrimination and identification of vowels by young, hearing-impaired adults. J. Acoust. Soc. Am. 2003, 114, 2923–2933. [Google Scholar] [CrossRef]
  12. Liu, C.; Kewley-Port, D. Factors affecting vowel formant discrimination by hearing-impaired listeners. J. Acoust. Soc. Am. 2007, 122, 2855–2864. [Google Scholar] [CrossRef] [Green Version]
  13. Liu, C. Rollover effect of signal level on vowel formant discrimination. J. Acoust. Soc. Am. 2008, 123, EL52–EL58. [Google Scholar] [CrossRef]
  14. Kewley-Port, D.; Li, X.; Zheng, Y.; Neel, A.T. Fundamental frequency effects on thresholds of vowel formant discrimination. J. Acoust. Soc. Am. 1996, 100, 2462–2470. [Google Scholar] [CrossRef]
  15. Kewley-Port, D. Thresholds of formant-frequency discrimination of vowels in consonantal context. J. Acoust. Soc. Am. 1995, 97, 3139–3146. [Google Scholar] [CrossRef]
  16. Miranda, T.; Pichora-Fuller, M. Temporally jittered speech produces performance intensity, phonetically balanced rollover in young normal-hearing listeners. J. Am. Acad. Audiol. 2002, 13, 50–58. [Google Scholar] [CrossRef]
  17. Molis, M.; Summers, V. Effects of high presentation levels on recognitions of low- and high frequency speech. Acoust. Res. Lett. Online 2003, 4, 124–128. [Google Scholar] [CrossRef]
  18. Studebaker, G.; Sherbecoe, R.; McDaniel, D.; Gwaltney, C. Monosyllabic word recognition at higher-than-normal speech and noise levels. J. Acoust. Soc. Am. 1999, 105, 2431–2444. [Google Scholar] [CrossRef]
  19. Glasberg, B.R.; Moore, B.C. Derivation of auditory filter shapes from notched-noise data. Hear. Res. 1990, 47, 103–138. [Google Scholar] [CrossRef]
  20. Sommers, M.S.; Kewley-Port, D. Modeling formant frequency discrimination of female vowels. J. Acoust. Soc. Am. 1996, 99, 3770–3781. [Google Scholar] [CrossRef]
  21. Moore, B.C.; Glasberg, B.R. Formulae describing frequency selectivity as a function of frequency and level, and their use in calculating excitation patterns. Hear. Res. 1987, 28, 209–225. [Google Scholar] [CrossRef]
  22. Moore, B.C.; Glasberg, B.R. A revision of Zwicker’s loudness model. Acta Acust. United Acust. 1996, 82, 335–345. [Google Scholar]
  23. Woodall, A.; Liu, C. Effects of signal level and spectral contrast on vowel formant discrimination. Am. J. Audiol. 2013, 22, 94–104. [Google Scholar] [CrossRef]
  24. Kawahara, H.; Masuda-Katsuse, I.; De Cheveigne, A. Restructuring speech representations using a pitch-adaptive time–frequency smoothing and an instantaneous-frequency-based F0 extraction: Possible role of a repetitive structure in sounds. Speech Commun. 1999, 27, 187–207. [Google Scholar] [CrossRef]
  25. Moore, B.C.; Glasberg, B.R. Suggested formulae for calculating auditory-filter bandwidths and excitation patterns. J. Acoust. Soc. Am. 1983, 74, 750–753. [Google Scholar] [CrossRef]
  26. Moore, B.C.; Glasberg, B.R. A revised model of loudness perception applied to cochlear hearing loss. Hear. Res. 2004, 188, 70–88. [Google Scholar] [CrossRef]
  27. Stevens, S.S. On the psychophysical law. Psychol. Rev. 1957, 64, 153–181. [Google Scholar] [CrossRef]
  28. Zwicker, E.; Scharf, B. A model of loudness summation. Psychol. Rev. 1965, 72, 3–26. [Google Scholar] [CrossRef]
  29. Deng, L.; O’Shaughnessy, D. Speech Processing: A Dynamic and Optimization-Oriented Approach; Routledge: London, UK, 2003. [Google Scholar]
  30. Dau, T.; Püschel, D.; Kohlrausch, A. A quantitative model of the “effective” signal processing in the auditory system. I. Model structure. J. Acoust. Soc. Am. 1996, 99, 3615–3622. [Google Scholar] [CrossRef]
  31. Dau, T.; Püschel, D.; Kohlrausch, A. A quantitative model of the “effective” signal processing in the auditory system. II. Simulations and measurements. J. Acoust. Soc. Am. 1996, 99, 3623–3631. [Google Scholar] [CrossRef]
  32. Dau, T.; Kollmeier, B.; Kohlrausch, A. Modeling auditory processing of amplitude modulation. I. Detection and masking with narrow-band carriers. J. Acoust. Soc. Am. 1997, 102, 2892–2905. [Google Scholar] [CrossRef]
  33. Dau, T.; Kollmeier, B.; Kohlrausch, A. Modeling auditory processing of amplitude modulation. II. Spectral and temporal integration. J. Acoust. Soc. Am. 1997, 102, 2906–2919. [Google Scholar] [CrossRef]
  34. Moore, B.C. Distribution of auditory-filter bandwidths at 2 kHz in young normal listeners. J. Acoust. Soc. Am. 1987, 81, 1633–1635. [Google Scholar] [CrossRef] [PubMed]
  35. Glasberg, B.R.; Moore, B.C. Development and evaluation of a model for predicting the audibility of time-varying sounds in the presence of background sounds. J. Audio Eng. Soc. 2005, 53, 906–918. [Google Scholar]
  36. Liu, C.; Tao, S.; Wang, W.; Dong, Q. Formant discrimination of speech and non-speech sounds for English and Chinese listeners. J. Acoust. Soc. Am. 2012, 132, EL189–EL195. [Google Scholar] [CrossRef] [PubMed]
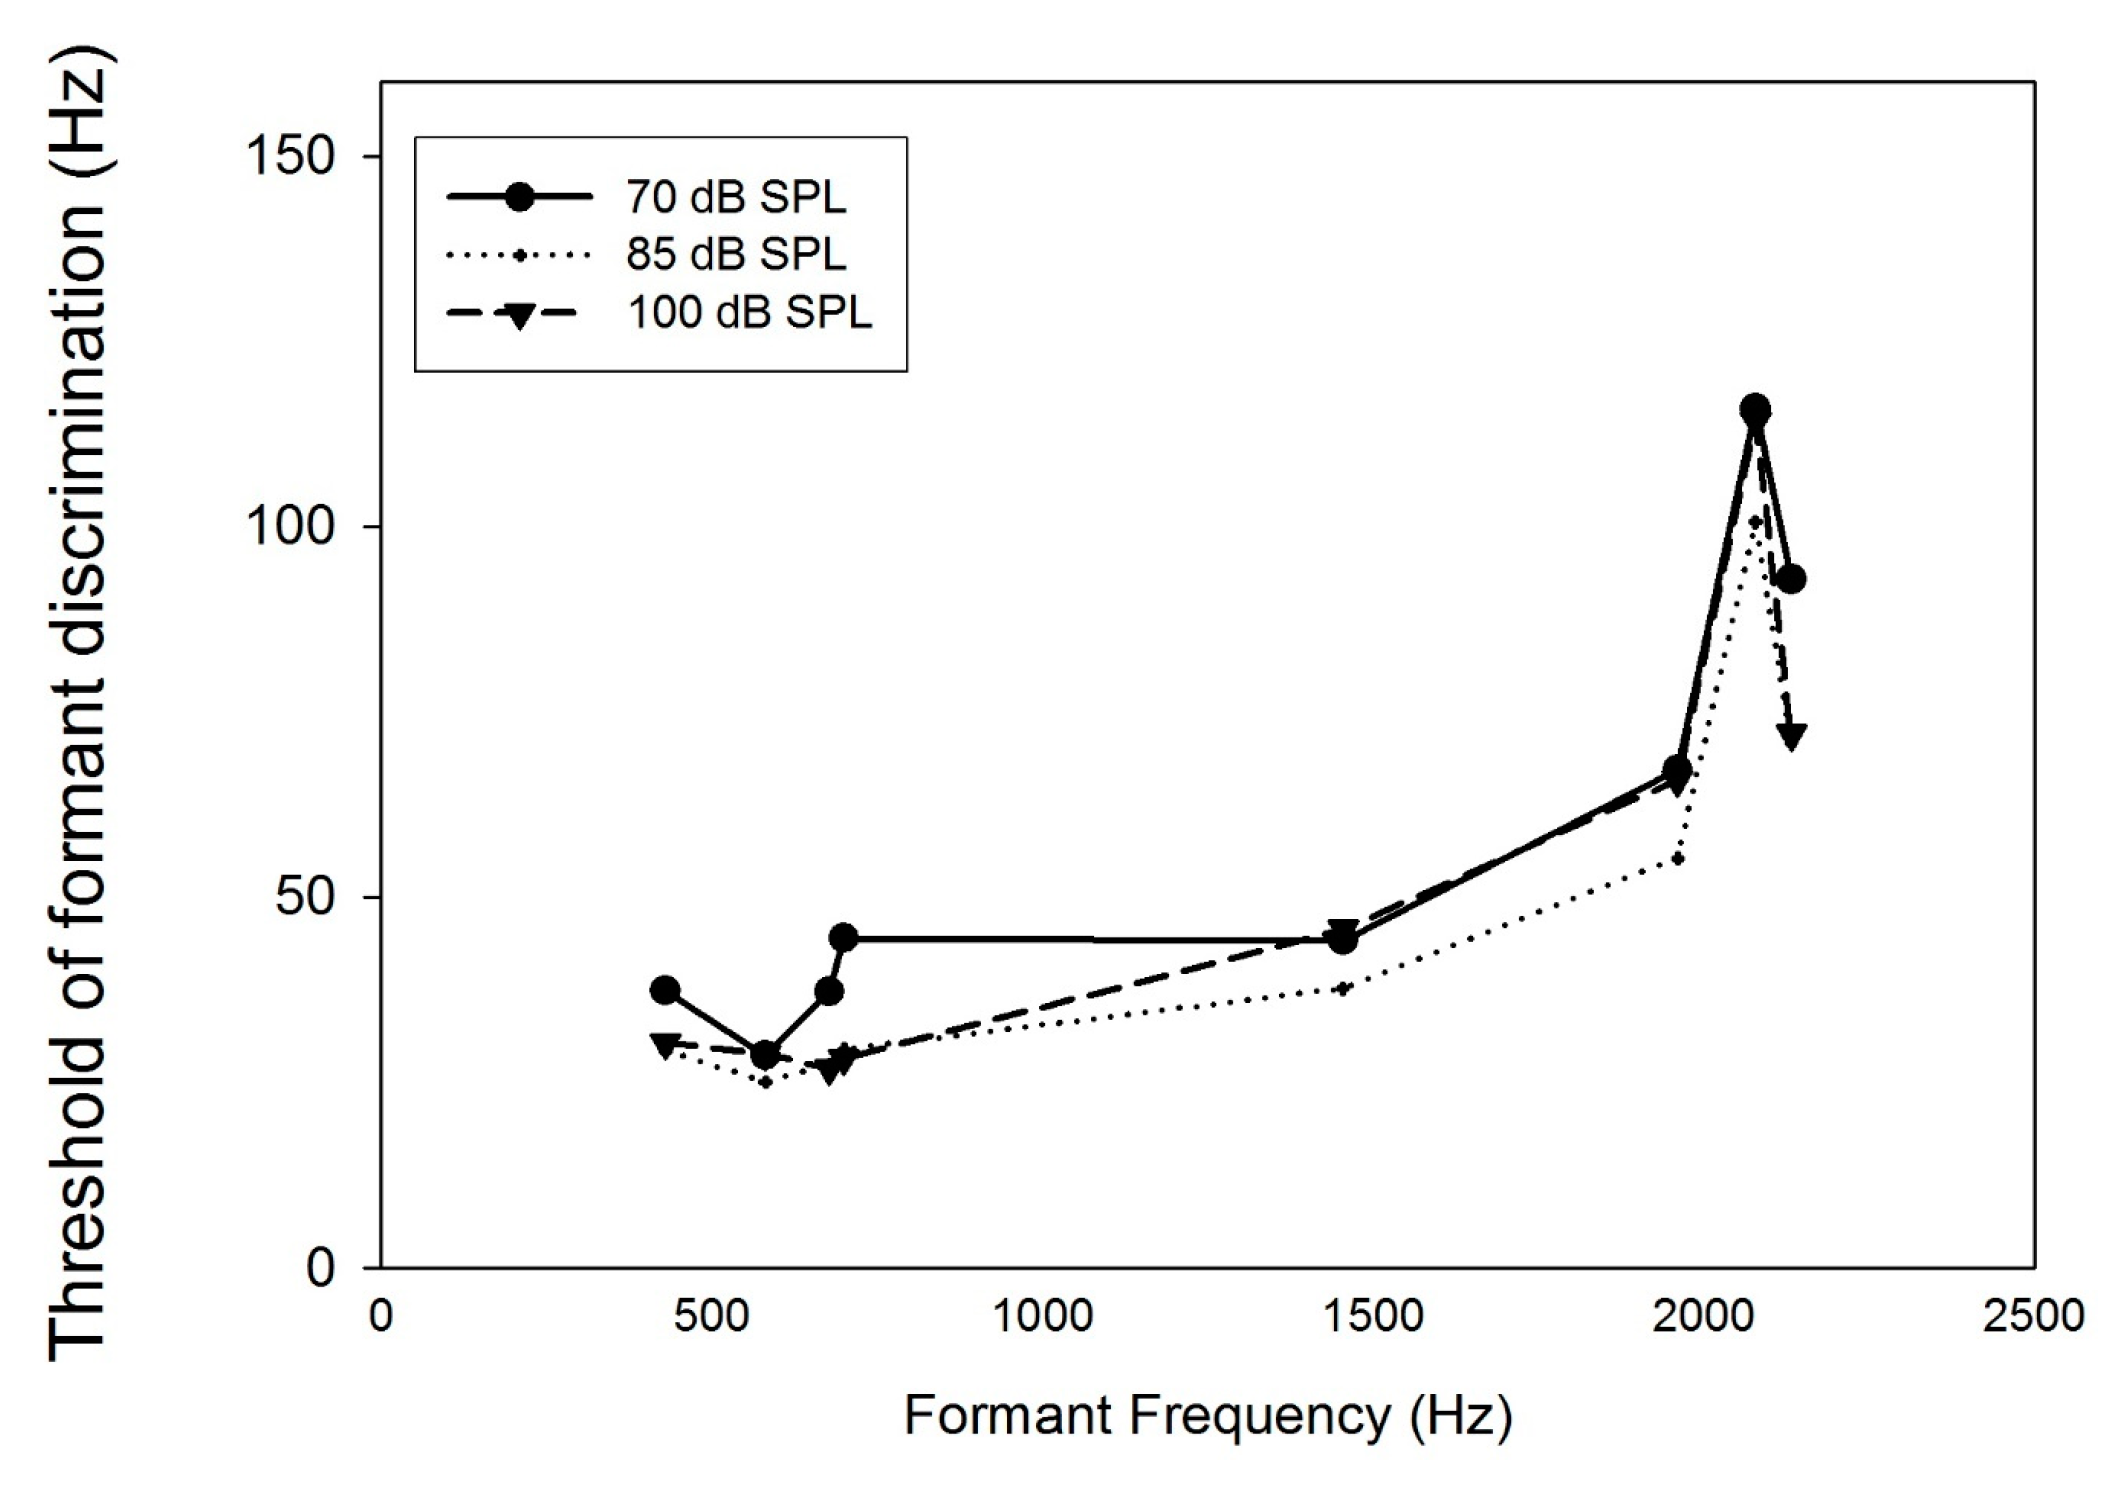
Figure 1. Thresholds for vowel formant frequency discrimination (ΔF) in Hz as a function of formant frequency for speech level at 70, 85, and 100 dB SPL.
Information 14 00429 g001
Figure 2. The two left panels illustrate the excitation patterns (EP; upper left) and specific loudness patterns (LP; lower left) for the standard /ε/ vowel (solid line) and the /ε/ vowel at the ΔF threshold for F2 (dashed line) while the two right panels show the excitation difference profile (upper right) and loudness difference profile (lower right) for the /ε/ vowel, which were obtained by subtracting the EP/LP of the standard /ε/ vowel (solid lines in the left panels) from the EP/LP of the /ε/ vowel at threshold (dashed lines in the left panels).
Information 14 00429 g002
Figure 3. Excitation difference profile (upper panel) and loudness difference profile (lower panel) for the F2 of the /ε/ vowels showing the three auditory metrics: peak-to-valley contrast (the arrows point to the valley and peak), 4-ERBN area (shaded area), and 1-peak-1-valley area (striped area).
Information 14 00429 g003
Figure 4. The block diagram illustrates the simulation model used to predict the thresholds of vowel formant frequency discrimination. EP and LP stand for ‘excitation pattern’ and ‘loudness pattern’, respectively, while EDP and LDP refer to ‘excitation difference profile’ and ‘loudness difference profile’, respectively. See texts for details.
Information 14 00429 g004
Figure 5. Thresholds, predicted from three metrics, of the excitation difference profiles and thresholds obtained from human listeners in Hz as functions of formant frequency for speech level at 70, 85, and 100 dB SPL.
Information 14 00429 g005
Figure 6. Thresholds, predicted from three metrics, of the loudness difference profiles and thresholds obtained from human listeners in Hz as functions of formant frequency for speech level at 70, 85, and 100 dB SPL.
Information 14 00429 g006
Figure 7. Average thresholds of formant discrimination over the eight formant frequencies for the behavioral measures and the six sets of predictions (three from the excitation pattern in the top panel and three from the loudness model in the bottom panel) at 70, 85, and 100 dB SPL.
Information 14 00429 g007
Table 1. The mean values of auditory metrics derived from the excitation-pattern and loudness-pattern models, averaged over vowel formants and speech levels.
Excitation Pattern Loudness Pattern
4-ERB (dB)1p1v (dB)PtoV (dB)4-ERB (sones)1p1v
(sones)
PtoV (sone/ERB)
1.8993.3111.4120.3080.483 0.241
Table 2. Correlations (Rs) and the 95% confidence interval (CI) of the correlations between the predicted thresholds and behavioral thresholds across the formant frequency for 70, 85, and 100 dB SPL for the auditory metrics derived from the excitation-pattern and loudness-pattern models.
Speech Level (dB)7085100
Corr.95% CICorr.95% CICorr.95% CI
4-ERB0.950.90–1.000.950.79–0.990.920.48–0.98
Excitation Pattern1p1v0.970.82–0.990.980.62–0.990.980.68–0.99
PtoV0.960.62–0.990.940.62–0.990.970.63–0.99
4-ERB0.980.87–1.000.950.76–0.990.940.68–0.99
Loudness Pattern1p1v0.970.61–0.990.960.66–0.990.910.46–0.98
PtoV0.960.84–0.990.940.62–0.990.960.41–0.98
Table 3. Root-mean-square errors (RMSEs) between the predicted thresholds and behavioral thresholds across the formant frequency for 70, 85, and 100 dB SPL for the auditory metrics derived from the excitation-pattern (top half) and loudness-pattern (bottom half) models.
MetricsSpeech Level (dB SPL)
7085100
4-ERB128.311.5
Excitation Pattern1p1v17.834.530
PtoV16.310.610.9
4-ERB20.116.520.3
Loudness Pattern1p1v53.122.116.7
PtoV24.314.116.8
Disclaimer/Publisher’s Note: The statements, opinions and data contained in all publications are solely those of the individual author(s) and contributor(s) and not of MDPI and/or the editor(s). MDPI and/or the editor(s) disclaim responsibility for any injury to people or property resulting from any ideas, methods, instructions or products referred to in the content.