

Assessing the Credit Risk of Crypto-Assets Using Daily Range Volatility Models


Abstract
1. Introduction
2. Literature Review
2.1. Credit Risk of Crypto-Assets
2.2. Credit Risk of Crypto Exchanges
2.3. Daily Range
3. Materials and Methods
- Establish a conditional model for the price differences, without log transformation, , where , and and are the conditional mean and standard deviation, respectively.
- Simulate a large number N of price trajectories up to time , utilizing the estimated time-series model from step 1. We will consider the 1-day-ahead, 30-day-ahead, and 365-day0ahead probability of death for each crypto-asset, that is , respectively.
- The probability of default for a crypto-asset is computed as , where n is the number of times among N simulations when the simulated price touches or crosses the zero barrier for a specified time interval , and .
4. Results
4.1. Data
4.2. Forecasting Analysis
- A total of 1165 young coins with a total of 537,693 observations, listed in Table A1, Table A2, Table A3 in Appendix B, were used to forecast the 1-day- and 30-day-ahead probabilities of death.
- A total of 838 old coins with a total of 987,018 observations, listed in Table A4 and Table A5 in Appendix B, were used to forecast the 1-day-, 30-day-, and 365-day-ahead probabilities of death.
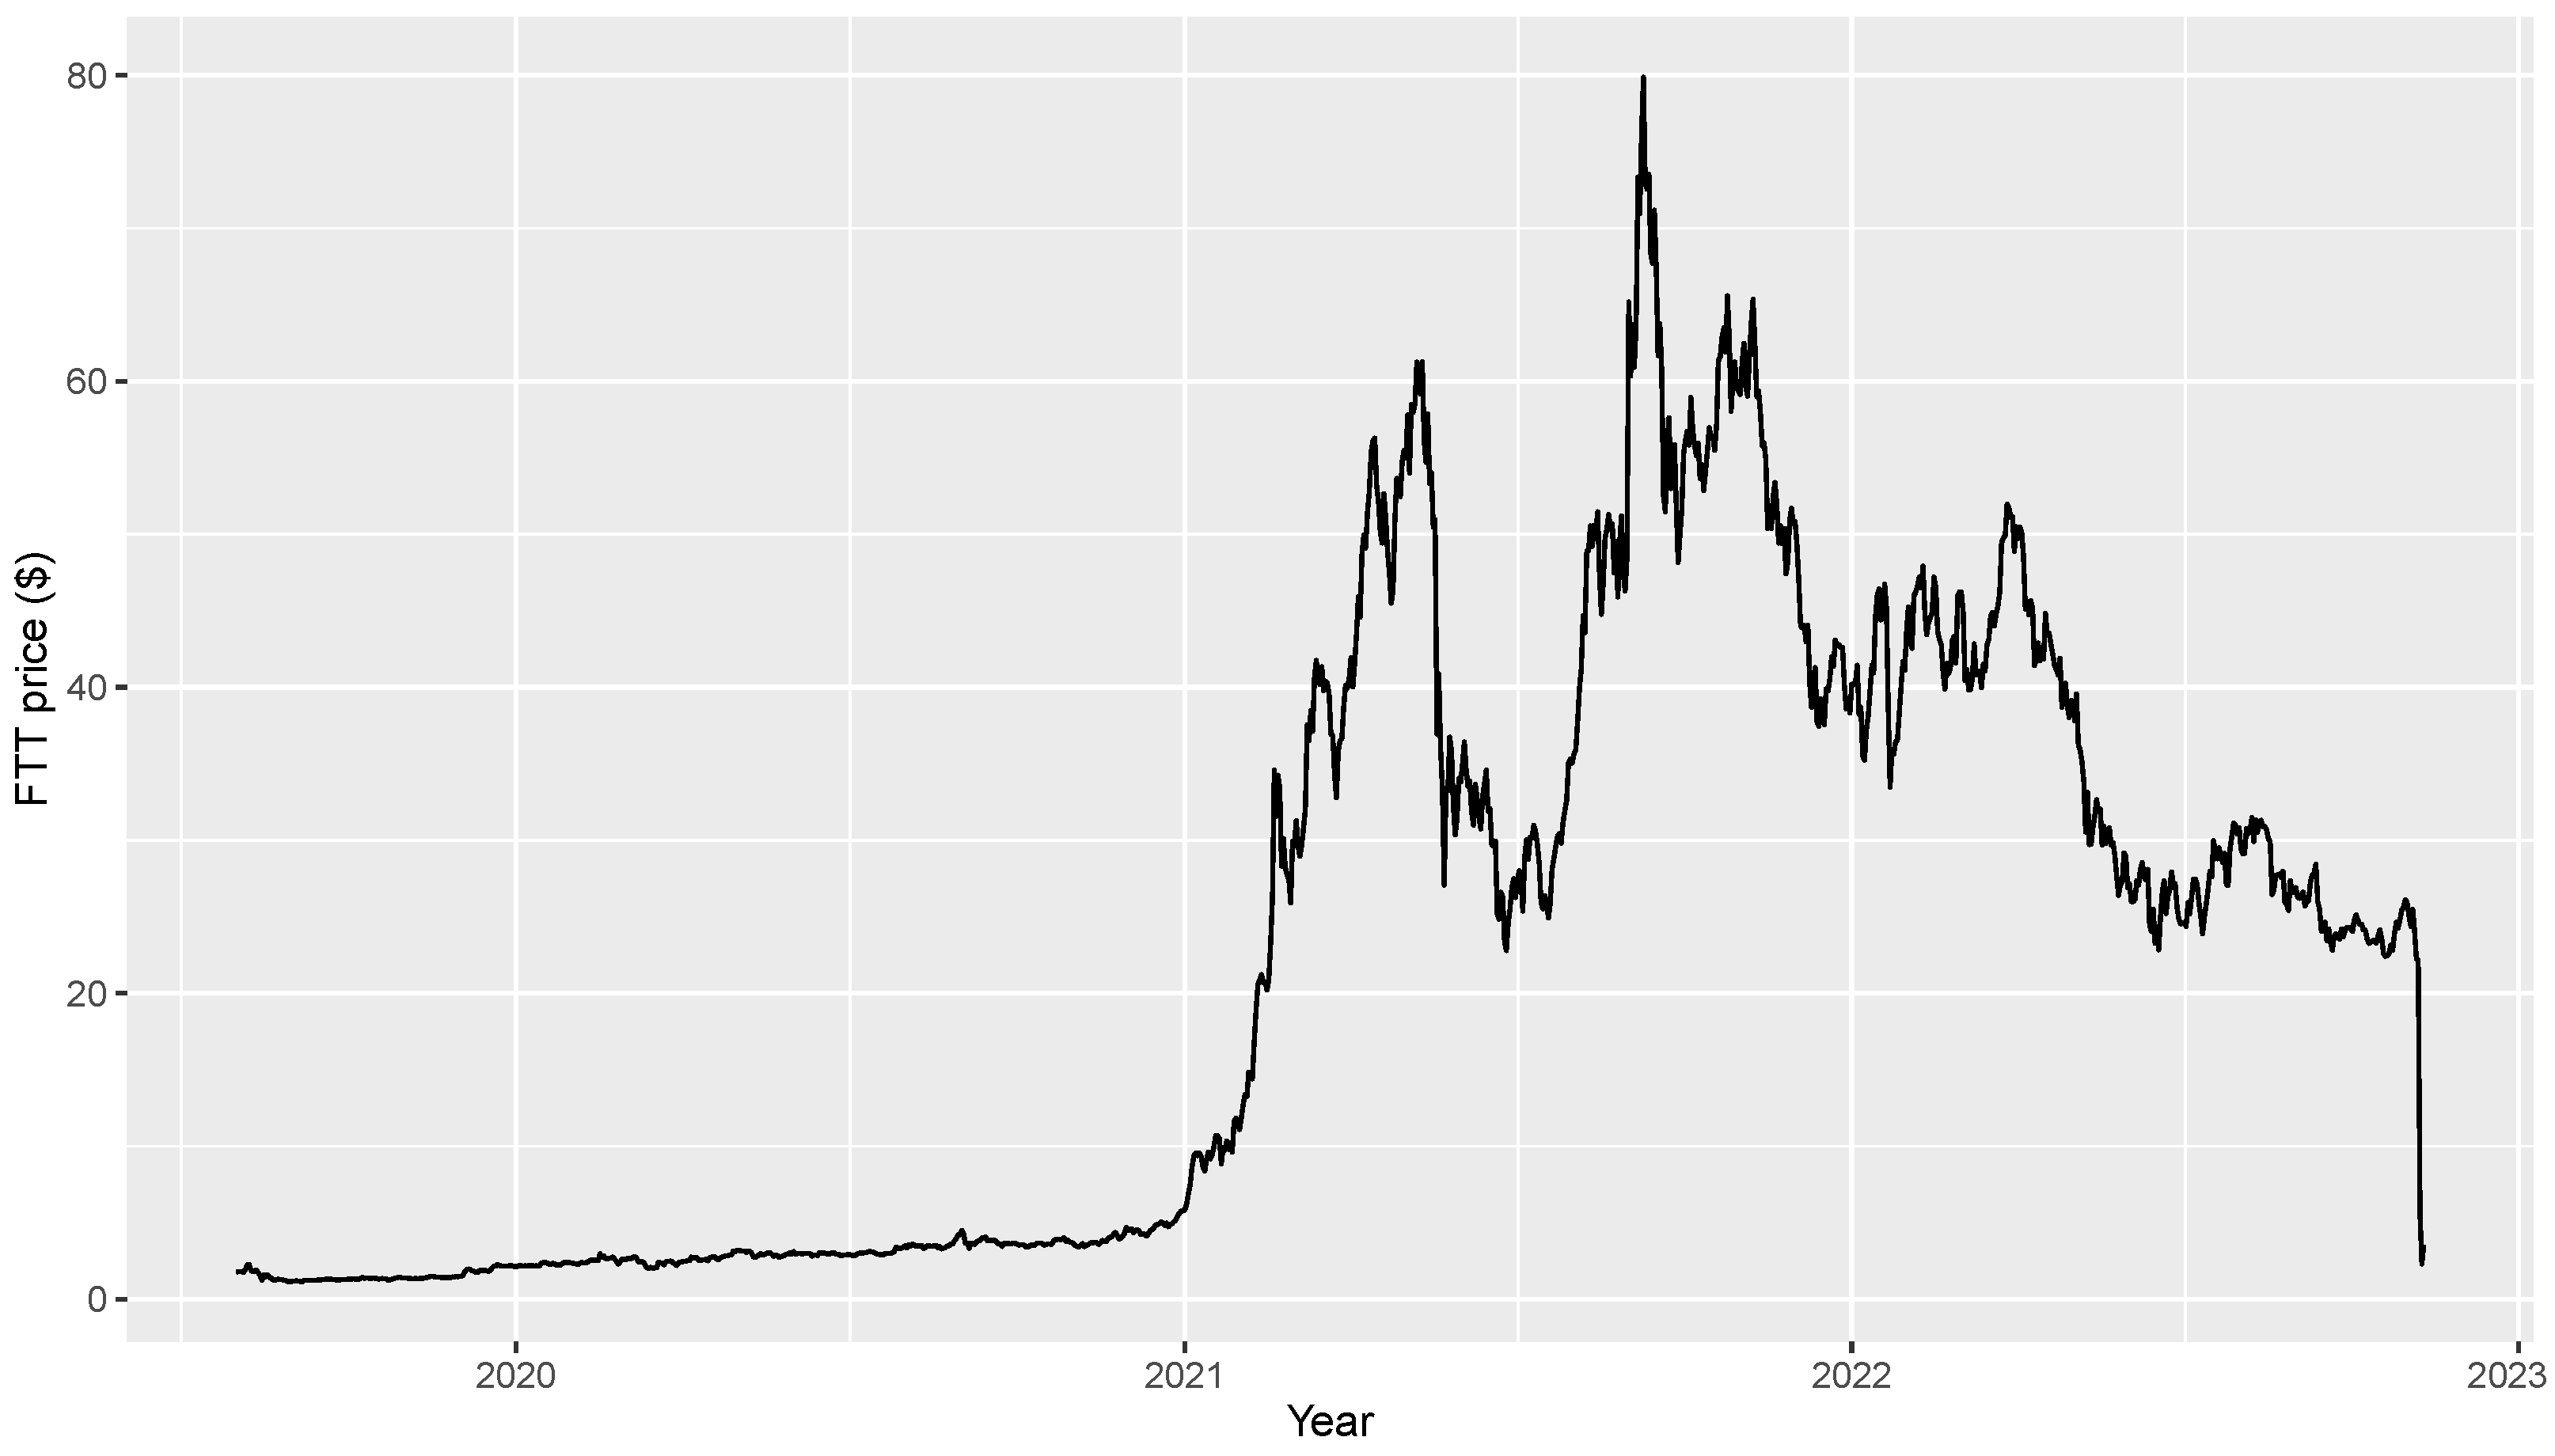
5. A Robustness Check: Forecasting the 1-Year-Ahead PD of the Crypto Trading Platform FTX
6. Discussion and Conclusions
Funding
Conflicts of Interest
Appendix A. Daily Number of Total Available Coins and of Dead Coins


Appendix B. Lists of Young and Old Coins

| 1 | Bitcoin SV | 101 | Band Protocol | 201 | TROY | 301 | ETERNAL TOKEN |
| 2 | Crypto.com Coin | 102 | PLATINCOIN | 202 | Anchor | 302 | Pirate Chain |
| 3 | Acash Coin | 103 | UNI COIN | 203 | ShareToken | 303 | USDQ |
| 4 | UNUS SED LEO | 104 | Qubitica | 204 | QuarkChain | 304 | Electronic Energy Coin |
| 5 | USD Coin | 105 | MX Token | 205 | Content Value Network | 305 | VNDC |
| 6 | HEX | 106 | Ocean Protocol | 206 | Gemini Dollar | 306 | Egretia |
| 7 | Cosmos | 107 | BitMax Token | 207 | FLETA | 307 | Bitcoin Rhodium |
| 8 | VeChain | 108 | Origin Protocol | 208 | Cred | 308 | IPChain |
| 9 | HedgeTrade | 109 | XeniosCoin | 209 | Metadium | 309 | Digital Asset Guarantee Token |
| 10 | INO COIN | 110 | Project Pai | 210 | Cocos-BCX | 310 | BQT |
| 11 | OKB | 111 | WINk | 211 | MEXC Token | 311 | LINKA |
| 12 | FTX Token | 112 | Function X | 212 | Sport and Leisure | 312 | UGAS |
| 13 | VestChain | 113 | Fetch.ai | 213 | Nectar | 313 | Pundi X NEM |
| 14 | Paxos Standard | 114 | 1irstcoin | 214 | Morpheus.Network | 314 | Yap Stone |
| 15 | MimbleWimbleCoin | 115 | Wirex Token | 215 | Dimension Chain | 315 | Ondori |
| 16 | PlayFuel | 116 | Grin | 216 | Kleros | 316 | Lykke |
| 17 | Hedera Hashgraph | 117 | Aurora | 217 | Hxro | 317 | BOX Token |
| 18 | Algorand | 118 | Karatgold Coin | 218 | StakeCubeCoin | 318 | Sense |
| 19 | Largo Coin | 119 | SynchroBitcoin | 219 | Dusk Network | 319 | Newscrypto |
| 20 | Binance USD | 120 | DAD | 220 | Wixlar | 320 | CUTcoin |
| 21 | Hyperion | 121 | Ecoreal Estate | 221 | Diamond Platform Token | 321 | 1SG |
| 22 | The Midas Touch Gold | 122 | AgaveCoin | 222 | Aencoin | 322 | Global Social Chain |
| 23 | Insight Chain | 123 | Folgory Coin | 223 | Aladdin | 323 | Agrocoin |
| 24 | ThoreCoin | 124 | BOSAGORA | 224 | VITE | 324 | MVL |
| 25 | TAGZ5 | 125 | Tachyon Protocol | 225 | VNX Exchange | 325 | Robotina |
| 26 | Elamachain | 126 | Ultiledger | 226 | AMO Coin | 326 | Nyzo |
| 27 | MINDOL | 127 | Nash Exchange | 227 | XMax | 327 | Akropolis |
| 28 | Dai | 128 | NEXT | 228 | FNB Protocol | 328 | Trade Token X |
| 29 | Baer Chain | 129 | Loki | 229 | Aergo | 329 | VeriDocGlobal |
| 30 | HUSD | 130 | BigONE Token | 230 | CoinEx Token | 330 | Verasity |
| 31 | Flexacoin | 131 | WOM Protocol | 231 | QuickX Protocol | 331 | BitCapitalVendor |
| 32 | Velas | 132 | BitKan | 232 | Moss Coin | 332 | Kryll |
| 33 | Metaverse Dualchain Network Architecture | 133 | CONTRACOIN | 233 | Safe | 333 | EURBASE |
| 34 | ZB Token | 134 | Rocket Pool | 234 | Perlin | 334 | Cryptocean |
| 35 | GlitzKoin | 135 | IDEX | 235 | LiquidApps | 335 | GoCrypto Token |
| 36 | botXcoin | 136 | Egoras | 236 | OTOCASH | 336 | Sentivate |
| 37 | Divi | 137 | LuckySevenToken | 237 | Sentinel Protocol | 337 | Ternio |
| 38 | Terra | 138 | Jewel | 238 | LCX | 338 | CryptoVerificationCoin |
| 39 | DxChain Token | 139 | Celer Network | 239 | Tellor | 339 | VeriBlock |
| 40 | Quant | 140 | Bonorum | 240 | MixMarvel | 340 | VINchain |
| 41 | Seele-N | 141 | Kusama | 241 | CoinMetro Token | 341 | PCHAIN |
| 42 | Counos Coin | 142 | General Attention Currency | 242 | Levolution | 342 | Cardstack |
| 43 | Nervos Network | 143 | Everipedia | 243 | Endor Protocol | 343 | Tokoin |
| 44 | Matic Network | 144 | CryptalDash | 244 | IONChain | 344 | AmonD |
| 45 | Blockstack | 145 | Bitcoin 2 | 245 | HyperDAO | 345 | MargiX |
| 46 | Energi | 146 | Apollo Currency | 246 | #MetaHash | 346 | S4FE |
| 47 | Chiliz | 147 | BORA | 247 | Digix Gold Token | 347 | SnapCoin |
| 48 | QCash | 148 | Cryptoindex.com 100 | 248 | Effect.AI | 348 | EOSDT |
| 49 | BitTorrent | 149 | GoChain | 249 | Darico Ecosystem Coin | 349 | ZVCHAIN |
| 50 | ABBC Coin | 150 | MovieBloc | 250 | GreenPower | 350 | FansTime |
| 51 | Unibright | 151 | TOP | 251 | PlayChip | 351 | EOS Force |
| 52 | NewYork Exchange | 152 | Bit-Z Token | 252 | Cosmo Coin | 352 | ContentBox |
| 53 | Beldex | 153 | IRISnet | 253 | Atomic Wallet Coin | 353 | Maincoin |
| 54 | ExtStock Token | 154 | Machine Xchange Coin | 254 | IQeon | 354 | BaaSid |
| 55 | Celsius | 155 | CWV Chain | 255 | HYCON | 355 | Constant |
| 56 | Bitbook Gambling | 156 | NKN | 256 | LNX Protocol | 356 | USDx stablecoin |
| 57 | SOLVE | 157 | ZEON | 257 | Prometeus | 357 | PumaPay |
| 58 | Sologenic | 158 | Neutrino Dollar | 258 | V-ID | 358 | NIX |
| 59 | Tratin | 159 | WazirX | 259 | suterusu | 359 | JD Coin |
| 60 | RSK Infrastructure Framework | 160 | Nimiq | 260 | T.OS | 360 | FarmaTrust |
| 61 | v.systems | 161 | BHPCoin | 261 | XYO | 361 | Futurepia |
| 62 | PAX Gold | 162 | Fantom | 262 | ChronoCoin | 362 | Themis |
| 63 | BitcoinHD | 163 | Newton | 263 | YOU COIN | 363 | IntelliShare |
| 64 | Elrond | 164 | The Force Protocol | 264 | Telos | 364 | Content Neutrality Network |
| 65 | Bloomzed Token | 165 | COTI | 265 | Contents Protocol | 365 | BitMart Token |
| 66 | THORChain | 166 | ILCoin | 266 | EveryCoin | 366 | Vipstar Coin |
| 67 | Joule | 167 | Ethereum Meta | 267 | Ferrum Network | 367 | Humanscape |
| 68 | Xensor | 168 | TrustVerse | 268 | LINA | 368 | CanonChain |
| 69 | CRYPTOBUCKS | 169 | sUSD | 269 | Origo | 369 | Litex |
| 70 | STEM CELL COIN | 170 | VideoCoin | 270 | Atlas Protocol | 370 | Waves Enterprise |
| 71 | APIX | 171 | Ankr | 271 | VIDY | 371 | Spectre.ai Utility Token |
| 72 | Tap | 172 | Chimpion | 272 | Ampleforth | 372 | Esportbits |
| 73 | Bankera | 173 | Rakon | 273 | GNY | 373 | Beaxy |
| 74 | Breezecoin | 174 | Travala.com | 274 | ChainX | 374 | SINOVATE |
| 75 | FABRK | 175 | ThoreNext | 275 | DAPS Coin | 375 | SIX |
| 76 | Bitball Treasure | 176 | BitForex Token | 276 | Zano | 376 | Phantasma |
| 77 | BHEX Token | 177 | Wrapped Bitcoin | 277 | 0Chain | 377 | BetProtocol |
| 78 | Theta Fuel | 178 | ZBG Token | 278 | GAPS | 378 | pEOS |
| 79 | Gatechain Token | 179 | Orchid | 279 | DigitalBits | 379 | MIR COIN |
| 80 | STASIS EURO | 180 | TTC | 280 | HitChain | 380 | Winding Tree |
| 81 | Kava | 181 | LTO Network | 281 | WeShow Token | 381 | Grid+ |
| 82 | BTU Protocol | 182 | MicroBitcoin | 282 | apM Coin | 382 | BlockStamp |
| 83 | Thunder Token | 183 | Contentos | 283 | Sakura Bloom | 383 | BOLT |
| 84 | Beam | 184 | Lambda | 284 | Clipper Coin | 384 | INLOCK |
| 85 | Swipe | 185 | Constellation | 285 | FOAM | 385 | CEEK VR |
| 86 | Reserve Rights | 186 | Ultra | 286 | qiibee | 386 | Nuggets |
| 87 | Digitex Futures | 187 | FIBOS | 287 | Nestree | 387 | Lition |
| 88 | Orbs | 188 | DREP | 288 | SymVerse | 388 | Rublix |
| 89 | Buggyra Coin Zero | 189 | Invictus Hyperion Fund | 289 | ROOBEE | 389 | Spendcoin |
| 90 | IoTeX | 190 | CONUN | 290 | CryptoFranc | 390 | Bitrue Coin |
| 91 | inSure | 191 | Standard Tokenization Protocol | 291 | DDKoin | 391 | HoryouToken |
| 92 | Davinci Coin | 192 | Mainframe | 292 | Zel | 392 | RealTract |
| 93 | USDK | 193 | Chromia | 293 | Metronome | 393 | BidiPass |
| 94 | Super Zero Protocol | 194 | ARPA Chain | 294 | NPCoin | 394 | PlayCoin [ERC20] |
| 95 | Huobi Pool Token | 195 | REPO | 295 | ProximaX | 395 | MultiVAC |
| 96 | Harmony | 196 | Carry | 296 | NOIA Network | 396 | Artfinity |
| 97 | Poseidon Network | 197 | Valor Token | 297 | Eminer | 397 | EXMO Coin |
| 98 | Handshake | 198 | Zenon | 298 | Observer | 398 | Credit Tag Chain |
| 99 | 12Ships | 199 | Elitium | 299 | Baz Token | 399 | Wowbit |
| 100 | Vitae | 200 | Emirex Token | 300 | KARMA | 400 | RSK Smart Bitcoin |
| 401 | PegNet | 501 | ZeuxCoin | 601 | SPINDLE | 701 | Raise |
| 402 | Trias | 502 | TurtleCoin | 602 | Proton Token | 702 | Arbidex |
| 403 | PIBBLE | 503 | WPP TOKEN | 603 | Swap | 703 | W Green Pay |
| 404 | PLANET | 504 | Linkey | 604 | Olive | 704 | Digital Insurance Token |
| 405 | Snetwork | 505 | Noku | 605 | ImageCoin | 705 | Essentia |
| 406 | Cryptaur | 506 | Coineal Token | 606 | Infinitus Token | 706 | BioCoin |
| 407 | Aryacoin | 507 | Hashgard | 607 | ATMChain | 707 | Zen Protocol |
| 408 | Safe Haven | 508 | Fast Access Blockchain | 608 | WinStars.live | 708 | ZUM TOKEN |
| 409 | Rotharium | 509 | MEET.ONE | 609 | Alpha Token | 709 | Celeum |
| 410 | Traceability Chain | 510 | DACSEE | 610 | Grimm | 710 | MTC Mesh Network |
| 411 | Abyss Token | 511 | Kambria | 611 | TouchCon | 711 | TrueFeedBack |
| 412 | Naka Bodhi Token | 512 | ADAMANT Messenger | 612 | Lobstex | 712 | ZCore |
| 413 | Eterbase Coin | 513 | Merculet | 613 | Bitblocks | 713 | Agrolot |
| 414 | CashBet Coin | 514 | SBank | 614 | Sapien | 714 | Jobchain |
| 415 | Azbit | 515 | QChi | 615 | NOW Token | 715 | Global Awards Token |
| 416 | ZumCoin | 516 | YGGDRASH | 616 | GAMB | 716 | FidentiaX |
| 417 | MenaPay | 517 | Ouroboros | 617 | Xriba | 717 | Nerva |
| 418 | Fatcoin | 518 | Insureum | 618 | Alphacat | 718 | Scorum Coins |
| 419 | Netbox Coin | 519 | Sparkpoint | 619 | BitNewChain | 719 | Patron |
| 420 | VNT Chain | 520 | LHT | 620 | FLIP | 720 | TCASH |
| 421 | Cajutel | 521 | MassGrid | 621 | Nebula AI | 721 | ALL BEST ICO |
| 422 | Vexanium | 522 | QuadrantProtocol | 622 | OVCODE | 722 | wave edu coin |
| 423 | Callisto Network | 523 | KuboCoin | 623 | Plair | 723 | Membrana |
| 424 | Smartlands | 524 | Hashshare | 624 | Auxilium | 724 | PlayGame |
| 425 | TERA | 525 | Ivy | 625 | RED | 725 | Rapidz |
| 426 | GoWithMi | 526 | Banano | 626 | EUNO | 726 | Eristica |
| 427 | Egoras Dollar | 527 | DABANKING | 627 | NeuroChain | 727 | CryptoPing |
| 428 | Tolar | 528 | Ubex | 628 | Rivetz | 728 | x42 Protocol |
| 429 | Vetri | 529 | Bitsdaq | 629 | Coinsuper Ecosystem Network | 729 | Cubiex |
| 430 | WinCash | 530 | VegaWallet Token | 630 | BZEdge | 730 | OSA Token |
| 431 | 1World | 531 | Ecobit | 631 | Bancacy | 731 | EvenCoin |
| 432 | Airbloc | 532 | Liquidity Network | 632 | CrypticCoin | 732 | CREDIT |
| 433 | Pigeoncoin | 533 | Eden | 633 | Evedo | 733 | Coinlancer |
| 434 | OneLedger | 534 | Beetle Coin | 634 | Niobium Coin | 734 | EXMR FDN |
| 435 | DEX | 535 | Merebel | 635 | LocalCoinSwap | 735 | TrueDeck |
| 436 | Pivot Token | 536 | Open Platform | 636 | EBCoin | 736 | AC3 |
| 437 | Kuai Token | 537 | Locus Chain | 637 | Moneytoken | 737 | DAV Coin |
| 438 | Mcashchain | 538 | TEAM (TokenStars) | 638 | CoinUs | 738 | Jarvis+ |
| 439 | Leverj | 539 | Proxeus | 639 | Enecuum | 739 | 3DCoin |
| 440 | Databroker | 540 | BonusCloud | 640 | Noir | 740 | Silent Notary |
| 441 | Unification | 541 | Business Credit Substitute | 641 | BeatzCoin | 741 | IP Exchange |
| 442 | Blue Whale EXchange | 542 | MalwareChain | 642 | Quasarcoin | 742 | Moneynet |
| 443 | Color Platform | 543 | IQ.cash | 643 | Graviocoin | 743 | OWNDATA |
| 444 | Flowchain | 544 | Digital Gold | 644 | Max Property Group | 744 | uPlexa |
| 445 | CoinDeal Token | 545 | Brickblock | 645 | Ethereum Gold | 745 | StarCoin |
| 446 | PlatonCoin | 546 | MARK.SPACE | 646 | TigerCash | 746 | Mithril Ore |
| 447 | Krios | 547 | Conceal | 647 | DPRating | 747 | Ryo Currency |
| 448 | Nasdacoin | 548 | SafeCoin | 648 | Almeela | 748 | StarterCoin |
| 449 | LikeCoin | 549 | Spiking | 649 | Nexxo | 749 | CryptoBonusMiles |
| 450 | Okschain | 550 | COVA | 650 | smARTOFGIVING | 750 | MMOCoin |
| 451 | Bitex Global XBX Coin | 551 | PUBLISH | 651 | On.Live | 751 | FSBT API Token |
| 452 | Colu Local Network | 552 | Sessia | 652 | XcelToken Plus | 752 | PAL Network |
| 453 | Caspian | 553 | DOS Network | 653 | 0xcert | 753 | Shadow Token |
| 454 | BOOM | 554 | NeoWorld Cash | 654 | Block-Logic | 754 | Scanetchain |
| 455 | Raven Protocol | 555 | ESBC | 655 | Actinium | 755 | BlitzPredict |
| 456 | DECOIN | 556 | BitBall | 656 | MineBee | 756 | Truegame |
| 457 | Gleec | 557 | Gold Bits Coin | 657 | eXPerience Chain | 757 | EurocoinToken |
| 458 | Amoveo | 558 | CoTrader | 658 | TurtleNetwork | 758 | Typerium |
| 459 | Teloscoin | 559 | Coinsbit Token | 659 | HashCoin | 759 | Ether-1 |
| 460 | Zipper | 560 | Lisk Machine Learning | 660 | VeriSafe | 760 | TrakInvest |
| 461 | Quanta Utility Token | 561 | USDX | 661 | ZENZO | 761 | GoNetwork |
| 462 | IG Gold | 562 | SureRemit | 662 | Paytomat | 762 | Blockparty (BOXX Token) |
| 463 | ROAD | 563 | SnowGem | 663 | Seal Network | 763 | OptiToken |
| 464 | Midas | 564 | 0xBitcoin | 664 | SnodeCoin | 764 | Bigbom |
| 465 | Cloudbric | 565 | Rate3 | 665 | Bittwatt | 765 | Bethereum |
| 466 | Stronghold Token | 566 | Faceter | 666 | SpectrumCash | 766 | Sharpay |
| 467 | X-CASH | 567 | FREE Coin | 667 | WebDollar | 767 | Amino Network |
| 468 | Iconiq Lab Token | 568 | Qwertycoin | 668 | TV-TWO | 768 | PTON |
| 469 | Blockchain Certified Data Token | 569 | Gene Source Code Chain | 669 | Master Contract Token | 769 | MFCoin |
| 470 | Fountain | 570 | Golos Blockchain | 670 | BetterBetting | 770 | DeVault |
| 471 | MB8 Coin | 571 | ICE ROCK MINING | 671 | BitScreener Token | 771 | GoldFund |
| 472 | Origin Sport | 572 | REAL | 672 | Smartshare | 772 | Leadcoin |
| 473 | Tixl | 573 | PAYCENT | 673 | Vodi X | 773 | Carboneum [C8] Token |
| 474 | ParkinGo | 574 | StableUSD | 674 | Naviaddress | 774 | iDealCash |
| 475 | Ether Zero | 575 | NEXT.coin | 675 | FortKnoxster | 775 | Alt.Estate token |
| 476 | Asian Fintech | 576 | UpToken | 676 | HorusPay | 776 | EnergiToken |
| 477 | Bitcoin Confidential | 577 | SafeInsure | 677 | Ulord | 777 | MorCrypto Coin |
| 478 | DreamTeam Token | 578 | Eureka Coin | 678 | Q DAO Governance token v1.0 | 778 | Hyper Speed Network |
| 479 | nOS | 579 | DEEX | 679 | ODUWA | 779 | eSDChain |
| 480 | HashBX | 580 | ZPER | 680 | RedFOX Labs | 780 | DogeCash |
| 481 | TEMCO | 581 | Bob’s Repair | 681 | XPA | 781 | Daneel |
| 482 | Axe | 582 | Tarush | 682 | Birake | 782 | Gravity |
| 483 | BOMB | 583 | Mallcoin | 683 | savedroid | 783 | Kuende |
| 484 | HyperExchange | 584 | MIB Coin | 684 | TOKPIE | 784 | Kuverit |
| 485 | AIDUS TOKEN | 585 | Skychain | 685 | Halo Platform | 785 | Decentralized Machine Learning |
| 486 | Amon | 586 | Qredit | 686 | DeltaChain | 786 | Winco |
| 487 | Education Ecosystem | 587 | Project WITH | 687 | Mindexcoin | 787 | Monarch |
| 488 | X8X Token | 588 | Zippie | 688 | View | 788 | DOWCOIN |
| 489 | TRONCLASSIC | 589 | FYDcoin | 689 | Swace | 789 | Relex |
| 490 | Footballcoin | 590 | Howdoo | 690 | Ubcoin Market | 790 | Bitcoin CZ |
| 491 | Block-Chain.com | 591 | MidasProtocol | 691 | OLXA | 791 | Omnitude |
| 492 | SafeCapital | 592 | Shivom | 692 | Maximine Coin | 792 | Bee Token |
| 493 | POPCHAIN | 593 | Cashbery Coin | 693 | Webflix Token | 793 | RightMesh |
| 494 | Vision Industry Token | 594 | Lunes | 694 | Trittium | 794 | Catex Token |
| 495 | Opacity | 595 | Bitcoin Free Cash | 695 | Thrive Token | 795 | Bridge Protocol |
| 496 | Titan Coin | 596 | Honest | 696 | Bitcoin Incognito | 796 | Birdchain |
| 497 | Blocktrade Token | 597 | Safex Cash | 697 | Bitfex | 797 | BLOC.MONEY |
| 498 | Semux | 598 | GMB | 698 | FNKOS | 798 | Business Credit Alliance Chain |
| 499 | Uptrennd | 599 | PIXEL | 699 | Rapids | 799 | Alchemint Standards |
| 500 | Veil | 600 | Vezt | 700 | ebakus | 800 | Dynamite |
| 801 | Mainstream For The Underground | 901 | Blockburn | 1001 | BitRent | 1101 | Dash Green |
| 802 | WandX | 902 | LOCIcoin | 1002 | Decentralized Asset Trading Platform | 1102 | Joint Ventures |
| 803 | Blockpass | 903 | OPCoinX | 1003 | ROIyal Coin | 1103 | WXCOINS |
| 804 | ZMINE | 904 | BitCoen | 1004 | ShareX | 1104 | e-Chat |
| 805 | CryptoAds Marketplace | 905 | FUZE Token | 1005 | RefToken | 1105 | iBTC |
| 806 | CROAT | 906 | Commercium | 1006 | SHPING | 1106 | VikkyToken |
| 807 | BoatPilot Token | 907 | Hurify | 1007 | ETHplode | 1107 | CPUchain |
| 808 | Storiqa | 908 | Impleum | 1008 | Bitcoin Classic | 1108 | MiloCoin |
| 809 | Rupiah Token | 909 | Transcodium | 1009 | Bitcoin Adult | 1109 | BunnyToken |
| 810 | Ifoods Chain | 910 | Knekted | 1010 | GenesisX | 1110 | Electrum Dark |
| 811 | AiLink Token | 911 | No BS Crypto | 1011 | Intelligent Trading Foundation | 1111 | Playgroundz |
| 812 | Parachute | 912 | BlockMesh | 1012 | Zenswap Network Token | 1112 | Kora Network Token |
| 813 | Swapcoinz | 913 | PluraCoin | 1013 | Signatum | 1113 | Ragnarok |
| 814 | ONOToken | 914 | Aigang | 1014 | MetaMorph | 1114 | Escroco Emerald |
| 815 | Helium Chain | 915 | Arqma | 1015 | ShowHand | 1115 | Helper Search Token |
| 816 | Fire Lotto | 916 | Regalcoin | 1016 | 4NEW | 1116 | Fivebalance |
| 817 | The Currency Analytics | 917 | Thar Token | 1017 | GoldenPyrex | 1117 | 1X2 COIN |
| 818 | Matrexcoin | 918 | Mobile Crypto Pay Coin | 1018 | RPICoin | 1118 | Crystal Clear |
| 819 | BitClave | 919 | XMCT | 1019 | EOS TRUST | 1119 | Xenoverse |
| 820 | Zennies | 920 | Xuez | 1020 | Gold Poker | 1120 | VectorAI |
| 821 | BBSCoin | 921 | Ethouse | 1021 | Neural Protocol | 1121 | Bitcoinus |
| 822 | Civitas | 922 | Kind Ads Token | 1022 | EtherInc | 1122 | PAXEX |
| 823 | Aston | 923 | CommunityGeneration | 1023 | Sola Token | 1123 | MNPCoin |
| 824 | Bitnation | 924 | Agora | 1024 | SkyHub Coin | 1124 | Apollon |
| 825 | SRCOIN | 925 | nDEX | 1025 | Global Crypto Alliance | 1125 | Project Coin |
| 826 | PYRO Network | 926 | BTC Lite | 1026 | Level Up Coin | 1126 | Crystal Token |
| 827 | Veles | 927 | PUBLYTO Token | 1027 | Havy | 1127 | Veltor |
| 828 | BEAT | 928 | EtherSportz | 1028 | QUINADS | 1128 | Decentralized Crypto Token |
| 829 | Streamit Coin | 929 | Freyrchain | 1029 | EUNOMIA | 1129 | Fintab |
| 830 | Oxycoin | 930 | NetKoin | 1030 | EagleX | 1130 | Flit Token |
| 831 | HeartBout | 931 | REBL | 1031 | Asura Coin | 1131 | MoX |
| 832 | Atonomi | 932 | Vivid Coin | 1032 | Castle | 1132 | LiteCoin Ultra |
| 833 | SwiftCash | 933 | EveriToken | 1033 | Tourist Token | 1133 | Qbic |
| 834 | PDATA | 934 | UChain | 1034 | Gexan | 1134 | PAWS Fund |
| 835 | Artis Turba | 935 | Bitsum | 1035 | UOS Network | 1135 | Bitvolt |
| 836 | Rentberry | 936 | Cheesecoin | 1036 | Authorship | 1136 | Cannation |
| 837 | Plus-Coin | 937 | APR Coin | 1037 | WITChain | 1137 | BROTHER |
| 838 | Bitcoin Token | 938 | Soverain | 1038 | Netrum | 1138 | Silverway |
| 839 | ProxyNode | 939 | HyperQuant | 1039 | Eva Cash | 1139 | Staker |
| 840 | Signals Network | 940 | Bitcoin Zero | 1040 | YoloCash | 1140 | Cointorox |
| 841 | Giant | 941 | Narrative | 1041 | Cyber Movie Chain | 1141 | Secrets of Zurich |
| 842 | RoBET | 942 | HOLD | 1042 | TRAXIA | 1142 | Zoomba |
| 843 | XDNA | 943 | Italo | 1043 | Beacon | 1143 | Orbis Token |
| 844 | TENA | 944 | Gossip Coin | 1044 | KWHCoin | 1144 | Dinero |
| 845 | EtherGem | 945 | BLAST | 1045 | InterCrone | 1145 | Helpico |
| 846 | Vanta Network | 946 | ZeusNetwork | 1046 | ALAX | 1146 | X12 Coin |
| 847 | Linfinity | 947 | Japan Content Token | 1047 | Phonecoin | 1147 | Concoin |
| 848 | StrongHands Masternode | 948 | HYPNOXYS | 1048 | GINcoin | 1148 | LitecoinToken |
| 849 | Voise | 949 | Biotron | 1049 | Spectrum | 1149 | Xchange |
| 850 | Kalkulus | 950 | UNICORN Token | 1050 | Octoin Coin | 1150 | iBank |
| 851 | CryptoSoul | 951 | BUDDY | 1051 | Save Environment Token | 1151 | Benz |
| 852 | WOLLO | 952 | Guider | 1052 | Magic Cube Coin | 1152 | Abulaba |
| 853 | Cashpayz Token | 953 | InternationalCryptoX | 1053 | AceD | 1153 | Dystem |
| 854 | InterValue | 954 | InvestFeed | 1054 | CustomContractNetwork | 1154 | Storeum |
| 855 | WIZBL | 955 | BitStash | 1055 | ConnectJob | 1155 | QYNO |
| 856 | Ethereum Gold Project | 956 | IOTW | 1056 | Stakinglab | 1156 | Coin-999 |
| 857 | Asgard | 957 | Stipend | 1057 | wys Token | 1157 | Posscoin |
| 858 | VULCANO | 958 | CyberMusic | 1058 | Bulleon | 1158 | LRM Coin |
| 859 | Wavesbet | 959 | Herbalist Token | 1059 | GoPower | 1159 | Elliot Coin |
| 860 | HeroNode | 960 | Thingschain | 1060 | SONDER | 1160 | UltraNote Coin |
| 861 | Gentarium | 961 | Arion | 1061 | Provoco Token | 1161 | Newton Coin Project |
| 862 | Webcoin | 962 | WABnetwork | 1062 | Cryptrust | 1162 | HarmonyCoin |
| 863 | SignatureChain | 963 | EZOOW | 1063 | Atheios | 1163 | TerraKRW |
| 864 | Bitcoin Fast | 964 | Arepacoin | 1064 | ArbitrageCT | 1164 | Bitpanda Ecosystem Token |
| 865 | Fiii | 965 | Waletoken | 1065 | INDINODE | 1165 | EmberCoin |
| 866 | CrowdWiz | 966 | Datarius Credit | 1066 | TokenDesk | ||
| 867 | Fox Trading | 967 | TrustNote | 1067 | EnterCoin | ||
| 868 | Verify | 968 | Data Transaction Token | 1068 | P2P Global Network | ||
| 869 | Klimatas | 969 | CYBR Token | 1069 | FidexToken | ||
| 870 | PRASM | 970 | FantasyGold | 1070 | ICOBID | ||
| 871 | MODEL-X-coin | 971 | IGToken | 1071 | Fantasy Sports | ||
| 872 | Menlo One | 972 | Coinchase Token | 1072 | Simmitri | ||
| 873 | Arionum | 973 | Micromines | 1073 | CryptoFlow | ||
| 874 | BlockCAT | 974 | Exosis | 1074 | JavaScript Token | ||
| 875 | Version | 975 | SteepCoin | 1075 | ARAW | ||
| 876 | KAASO | 976 | TOKYO | 1076 | EthereumX | ||
| 877 | CyberFM | 977 | Galilel | 1077 | FUTURAX | ||
| 878 | Ethersocial | 978 | MesChain | 1078 | Nyerium | ||
| 879 | Neutral Dollar | 979 | Bitcoiin | 1079 | Natmin Pure Escrow | ||
| 880 | Paymon | 980 | PRiVCY | 1080 | BitMoney | ||
| 881 | Taklimakan Network | 981 | CFun | 1081 | Quantis Network | ||
| 882 | HashNet BitEco | 982 | Zealium | 1082 | onLEXpa | ||
| 883 | Netko | 983 | Connect Coin | 1083 | Akroma | ||
| 884 | ZINC | 984 | GoHelpFund | 1084 | Carebit | ||
| 885 | Asian Dragon | 985 | xEURO | 1085 | TravelNote | ||
| 886 | IFX24 | 986 | BitStation | 1086 | CCUniverse | ||
| 887 | KanadeCoin | 987 | Italian Lira | 1087 | Alpha Coin | ||
| 888 | Elementeum | 988 | Iungo | 1088 | TrueVett | ||
| 889 | LALA World | 989 | MESG | 1089 | Couchain | ||
| 890 | SiaCashCoin | 990 | Parkgene | 1090 | Absolute | ||
| 891 | CYCLEAN | 991 | BitNautic Token | 1091 | MASTERNET | ||
| 892 | Bitether | 992 | SCRIV NETWORK | 1092 | Luna Coin | ||
| 893 | INMAX | 993 | FundRequest | 1093 | BitGuild PLAT | ||
| 894 | Thore Cash | 994 | JSECOIN | 1094 | XOVBank | ||
| 895 | Guaranteed Ethurance Token Extra | 995 | AirWire | 1095 | Peerguess | ||
| 896 | Niobio Cash | 996 | Kabberry Coin | 1096 | EVOS | ||
| 897 | Social Activity Token | 997 | Digiwage | 1097 | Eurocoin | ||
| 898 | Iridium | 998 | Ether Kingdoms Token | 1098 | ICOCalendar.Today | ||
| 899 | SF Capital | 999 | BitRewards | 1099 | Dragon Option | ||
| 900 | Elysian | 1000 | BitcoiNote | 1100 | Crowdholding |
| 1 | Bitcoin | 106 | DeviantCoin | 211 | Peercoin | 316 | Insights Network |
| 2 | Ethereum | 107 | Storj | 212 | Namecoin | 317 | Sentinel |
| 3 | Tether | 108 | Polymath | 213 | Quark | 318 | Aeron |
| 4 | XRP | 109 | Fusion | 214 | MOAC | 319 | ChatCoin |
| 5 | Bitcoin Cash | 110 | Waltonchain | 215 | Quantum Resistant Ledger | 320 | Red Pulse Phoenix |
| 6 | Litecoin | 111 | PIVX | 216 | Stakenet | 321 | Blockmason Credit Protocol |
| 7 | Binance Coin | 112 | Cortex | 217 | Steem Dollars | 322 | Hydro Protocol |
| 8 | EOS | 113 | Storm | 218 | Kcash | 323 | Tidex Token |
| 9 | Cardano | 114 | FunFair | 219 | United Traders Token | 324 | Litecoin Cash |
| 10 | Tezos | 115 | Enigma | 220 | All Sports | 325 | Refereum |
| 11 | Chainlink | 116 | CasinoCoin | 221 | EDUCare | 326 | Counterparty |
| 12 | Stellar | 117 | Dent | 222 | CargoX | 327 | MintCoin |
| 13 | Monero | 118 | XinFin Network | 223 | Genesis Vision | 328 | MediShares |
| 14 | TRON | 119 | Hellenic Coin | 224 | BnkToTheFuture | 329 | Incent |
| 15 | Huobi Token | 120 | TrueChain | 225 | Neumark | 330 | PolySwarm |
| 16 | Ethereum Classic | 121 | Loom Network | 226 | SIRIN LABS Token | 331 | Nucleus Vision |
| 17 | Neo | 122 | Metal | 227 | Tokenomy | 332 | Blackmoon |
| 18 | Dash | 123 | Acute Angle Cloud | 228 | TE-FOOD | 333 | NAGA |
| 19 | IOTA | 124 | Civic | 229 | ALQO | 334 | Lamden |
| 20 | Maker | 125 | Syscoin | 230 | PressOne | 335 | Global Cryptocurrency |
| 21 | Zcash | 126 | Aidos Kuneen | 231 | Mithril | 336 | Lympo |
| 22 | NEM | 127 | Dynamic Trading Rights | 232 | Ambrosus | 337 | Spectrecoin |
| 23 | Ontology | 128 | Populous | 233 | Dero | 338 | Penta |
| 24 | Basic Attention Token | 129 | Nebulas | 234 | Everex | 339 | Emercoin |
| 25 | Dogecoin | 130 | Ignis | 235 | SALT | 340 | Feathercoin |
| 26 | Synthetix Network Token | 131 | OriginTrail | 236 | Lightning Bitcoin | 341 | BOScoin |
| 27 | DigiByte | 132 | CRYPTO20 | 237 | UnlimitedIP | 342 | Lunyr |
| 28 | 0x | 133 | Gas | 238 | Molecular Future | 343 | Switcheo |
| 29 | Kyber Network | 134 | Groestlcoin | 239 | Wings | 344 | ColossusXT |
| 30 | OMG Network | 135 | SingularityNET | 240 | Pillar | 345 | NaPoleonX |
| 31 | Zilliqa | 136 | Uquid Coin | 241 | Ruff | 346 | BitGreen |
| 32 | THETA | 137 | Tierion | 242 | WePower | 347 | Blockport |
| 33 | BitBay | 138 | Vertcoin | 243 | U Network | 348 | DeepBrain Chain |
| 34 | Augur | 139 | Obyte | 244 | Revain | 349 | LinkEye |
| 35 | Decred | 140 | Melon | 245 | High Performance Blockchain | 350 | BitTube |
| 36 | ICON | 141 | Factom | 246 | INT Chain | 351 | Hydro |
| 37 | Aave | 142 | Dragon Coins | 247 | Ergo | 352 | Boolberry |
| 38 | Qtum | 143 | Cindicator | 248 | Wagerr | 353 | Mobius |
| 39 | Nano | 144 | Request | 249 | Metrix Coin | 354 | Skrumble Network |
| 40 | Siacoin | 145 | Envion | 250 | YOYOW | 355 | Odyssey |
| 41 | Lisk | 146 | Nexus | 251 | Blox | 356 | Myriad |
| 42 | Bitcoin Gold | 147 | Telcoin | 252 | SmartMesh | 357 | PotCoin |
| 43 | Enjin Coin | 148 | Voyager Token | 253 | Gulden | 358 | FintruX Network |
| 44 | Ravencoin | 149 | Utrust | 254 | ECC | 359 | Cube |
| 45 | TrueUSD | 150 | LBRY Credits | 255 | HTMLCOIN | 360 | Apex |
| 46 | Verge | 151 | Einsteinium | 256 | BABB | 361 | carVertical |
| 47 | Waves | 152 | Unobtanium | 257 | Viacoin | 362 | Paypex |
| 48 | MonaCoin | 153 | Quantstamp | 258 | Dock | 363 | YEE |
| 49 | Bitcoin Diamond | 154 | QASH | 259 | district0x | 364 | CanYaCoin |
| 50 | Advanced Internet Blocks | 155 | Tael | 260 | TokenClub | 365 | BlackCoin |
| 51 | Ren | 156 | Bread | 261 | AppCoins | 366 | Radium |
| 52 | Nexo | 157 | Nxt | 262 | Polybius | 367 | Loopring [NEO] |
| 53 | Loopring | 158 | Raiden Network Token | 263 | Ubiq | 368 | OKCash |
| 54 | Holo | 159 | Arcblock | 264 | doc.com Token | 369 | Cryptopay |
| 55 | SwissBorg | 160 | B2BX | 265 | Peculium | 370 | GridCoin |
| 56 | Cryptonex | 161 | Spectre.ai Dividend Token | 266 | SmartCash | 371 | Scry.info |
| 57 | IOST | 162 | Electra | 267 | OneRoot Network | 372 | Pluton |
| 58 | Status | 163 | MediBloc | 268 | GameCredits | 373 | AI Doctor |
| 59 | Komodo | 164 | NavCoin | 269 | Dentacoin | 374 | Crown |
| 60 | Mixin | 165 | PeepCoin | 270 | LockTrip | 375 | TokenPay |
| 61 | Steem | 166 | Haven Protocol | 271 | FLO | 376 | Change |
| 62 | MCO | 167 | AdEx | 272 | GET Protocol | 377 | bitUSD |
| 63 | Bytom | 168 | Asch | 273 | SwftCoin | 378 | Bloom |
| 64 | KuCoin Shares | 169 | RChain | 274 | bitCNY | 379 | Ixcoin |
| 65 | Centrality | 170 | Burst | 275 | SyncFab | 380 | Sumokoin |
| 66 | Horizen | 171 | Aeon | 276 | Universa | 381 | Unikoin Gold |
| 67 | WAX | 172 | Safex Token | 277 | Cashaa | 382 | Curecoin |
| 68 | BitShares | 173 | CyberMiles | 278 | Genaro Network | 383 | DAOBet |
| 69 | Numeraire | 174 | Time New Bank | 279 | DAOstack | 384 | WeOwn |
| 70 | Electroneum | 175 | ShipChain | 280 | Bitcoin Atom | 385 | Chrono.tech |
| 71 | Decentraland | 176 | Bibox Token | 281 | POA | 386 | THEKEY |
| 72 | Bancor | 177 | DMarket | 282 | Matrix AI Network | 387 | Mysterium |
| 73 | aelf | 178 | IoT Chain | 283 | QLC Chain | 388 | Stealth |
| 74 | Golem | 179 | Neblio | 284 | BLOCKv | 389 | Restart Energy MWAT |
| 75 | Ardor | 180 | SaluS | 285 | SONM | 390 | AMLT |
| 76 | Stratis | 181 | Moeda Loyalty Points | 286 | Etherparty | 391 | VeriCoin |
| 77 | HyperCash | 182 | Skycoin | 287 | Jibrel Network | 392 | ZClassic |
| 78 | iExec RLC | 183 | Santiment Network Token | 288 | Auctus | 393 | Denarius |
| 79 | MaidSafeCoin | 184 | DigixDAO | 289 | ZrCoin | 394 | Primas |
| 80 | ERC20 | 185 | FirstBlood | 290 | Covesting | 395 | Bean Cash |
| 81 | Aion | 186 | Kin | 291 | Agrello | 396 | Banca |
| 82 | Aeternity | 187 | LATOKEN | 292 | OAX | 397 | DAEX |
| 83 | Zcoin | 188 | Bezant | 293 | Presearch | 398 | CoinPoker |
| 84 | WhiteCoin | 189 | Veritaseum | 294 | Hi Mutual Society | 399 | PayBX |
| 85 | CyberVein | 190 | Metaverse ETP | 295 | Morpheus Labs | 400 | Peerplays |
| 86 | Bytecoin | 191 | Propy | 296 | Etheroll | 401 | I/O Coin |
| 87 | Power Ledger | 192 | Gifto | 297 | VIBE | 402 | Bismuth |
| 88 | WaykiChain | 193 | AirSwap | 298 | Measurable Data Token | 403 | e-Gulden |
| 89 | Aragon | 194 | Mooncoin | 299 | Selfkey | 404 | Remme |
| 90 | NULS | 195 | Bluzelle | 300 | DigitalNote | 405 | Diamond |
| 91 | Streamr | 196 | Blocknet | 301 | Hiveterminal Token | 406 | SpaceChain |
| 92 | ReddCoin | 197 | Achain | 302 | SunContract | 407 | ATC Coin |
| 93 | Ripio Credit Network | 198 | ODEM | 303 | TrueFlip | 408 | indaHash |
| 94 | Crypterium | 199 | OST | 304 | Edge | 409 | Clams |
| 95 | Dragonchain | 200 | Polis | 305 | Viberate | 410 | ATLANT |
| 96 | GXChain | 201 | SingularDTV | 306 | Everus | 411 | Rise |
| 97 | Ark | 202 | Monolith | 307 | Bitcore | 412 | Pascal |
| 98 | Pundi X | 203 | Credits | 308 | Xaurum | 413 | Rubycoin |
| 99 | Insolar | 204 | EDC Blockchain | 309 | Monetha | 414 | COS |
| 100 | PRIZM | 205 | Po.et | 310 | Phore | 415 | GoldMint |
| 101 | Gnosis | 206 | TenX | 311 | QunQun | 416 | Substratum |
| 102 | TomoChain | 207 | Game.com | 312 | DATA | 417 | Swarm |
| 103 | Eidoo | 208 | TaaS | 313 | Tripio | 418 | NewYorkCoin |
| 104 | Elastos | 209 | Particl | 314 | Credo | 419 | Adshares |
| 105 | Wanchain | 210 | Monero Classic | 315 | Flash | 420 | Flixxo |
| 421 | Bottos | 526 | DECENT | 631 | Dether | 736 | BERNcash |
| 422 | CommerceBlock | 527 | ION | 632 | Primalbase Token | 737 | VoteCoin |
| 423 | Dynamic | 528 | Waves Community Token | 633 | PiplCoin | 738 | Aricoin |
| 424 | AquariusCoin | 529 | Playkey | 634 | Bitcloud | 739 | GuccioneCoin |
| 425 | IHT Real Estate Protocol | 530 | Sentient Coin | 635 | Ties.DB | 740 | Zurcoin |
| 426 | Dinastycoin | 531 | Karbo | 636 | bitEUR | 741 | PureVidz |
| 427 | CPChain | 532 | Internet of People | 637 | Indorse Token | 742 | Adzcoin |
| 428 | Nexty | 533 | Neutron | 638 | Energo | 743 | ELTCOIN |
| 429 | Aventus | 534 | Minereum | 639 | RealChain | 744 | SmartCoin |
| 430 | Sharder | 535 | Ink Protocol | 640 | Tokenbox | 745 | Bela |
| 431 | HalalChain | 536 | CryCash | 641 | Chronologic | 746 | EDRCoin |
| 432 | BANKEX | 537 | BUZZCoin | 642 | Limitless VIP | 747 | Blocklancer |
| 433 | 42-coin | 538 | SIBCoin | 643 | Maxcoin | 748 | MarteXcoin |
| 434 | Pandacoin | 539 | DecentBet | 644 | Emerald Crypto | 749 | SparksPay |
| 435 | Omni | 540 | TraDove B2BCoin | 645 | Lampix | 750 | PayCoin |
| 436 | NuBits | 541 | AllSafe | 646 | PutinCoin | 751 | ClearPoll |
| 437 | Primecoin | 542 | XEL | 647 | AdHive | 752 | Ellaism |
| 438 | Ormeus Coin | 543 | AudioCoin | 648 | Pesetacoin | 753 | Digital Money Bits |
| 439 | MonetaryUnit | 544 | Pirl | 649 | Dropil | 754 | Acoin |
| 440 | Hush | 545 | Trinity Network Credit | 650 | Emphy | 755 | Theresa May Coin |
| 441 | Medicalchain | 546 | ProChain | 651 | KZ Cash | 756 | BTCtalkcoin |
| 442 | Hubii Network | 547 | Sentinel Chain | 652 | BitBar | 757 | GeyserCoin |
| 443 | Datum | 548 | Zeepin | 653 | BitSend | 758 | Nitro |
| 444 | Humaniq | 549 | GlobalBoost-Y | 654 | LEOcoin | 759 | Citadel |
| 445 | Lendingblock | 550 | The ChampCoin | 655 | Bonpay | 760 | YENTEN |
| 446 | KickToken | 551 | Zap | 656 | ACE (TokenStars) | 761 | STRAKS |
| 447 | PAC Global | 552 | Trollcoin | 657 | Gems | 762 | MojoCoin |
| 448 | EXRNchain | 553 | Datawallet | 658 | Bata | 763 | Blakecoin |
| 449 | PetroDollar | 554 | Espers | 659 | Rupee | 764 | Coin2.1 |
| 450 | Nework | 555 | BitDegree | 660 | Adelphoi | 765 | Elementrem |
| 451 | NativeCoin | 556 | Qbao | 661 | PWR Coin | 766 | MedicCoin |
| 452 | Zero | 557 | OBITS | 662 | Carboncoin | 767 | ICO OpenLedger |
| 453 | SoMee.Social | 558 | Patientory | 663 | Unify | 768 | GoldBlocks |
| 454 | ToaCoin | 559 | Freicoin | 664 | InsaneCoin | 769 | FuzzBalls |
| 455 | SolarCoin | 560 | DATx | 665 | Bitradio | 770 | Titcoin |
| 456 | GeoCoin | 561 | adToken | 666 | Energycoin | 771 | Jupiter |
| 457 | Upfiring | 562 | Starbase | 667 | Profile Utility Token | 772 | Dreamcoin |
| 458 | Cappasity | 563 | HEROcoin | 668 | Digitalcoin | 773 | NevaCoin |
| 459 | DeepOnion | 564 | HOQU | 669 | TrumpCoin | 774 | Ratecoin |
| 460 | Edgeless | 565 | LIFE | 670 | Aditus | 775 | ParkByte |
| 461 | eosDAC | 566 | Electrify.Asia | 671 | Bitcoin Interest | 776 | Dalecoin |
| 462 | Snovian.Space | 567 | HempCoin | 672 | Cobinhood | 777 | Spectiv |
| 463 | NoLimitCoin | 568 | ExclusiveCoin | 673 | Litecoin Plus | 778 | Datacoin |
| 464 | Matryx | 569 | Zilla | 674 | Elcoin | 779 | BoostCoin |
| 465 | CloakCoin | 570 | Memetic / PepeCoin | 675 | Photon | 780 | Open Trading Network |
| 466 | Terracoin | 571 | Solaris | 676 | Lethean | 781 | Desire |
| 467 | SpankChain | 572 | VouchForMe | 677 | Zetacoin | 782 | X-Coin |
| 468 | Bitswift | 573 | Friendz | 678 | Synergy | 783 | PostCoin |
| 469 | Experty | 574 | Zeitcoin | 679 | Kobocoin | 784 | Galactrum |
| 470 | iEthereum | 575 | Swarm City | 680 | MicroMoney | 785 | bitJob |
| 471 | PayPie | 576 | LanaCoin | 681 | Global Currency Reserve | 786 | Ccore |
| 472 | SHIELD | 577 | Sociall | 682 | Eroscoin | 787 | Quebecoin |
| 473 | UNIVERSAL CASH | 578 | EverGreenCoin | 683 | Capricoin | 788 | BriaCoin |
| 474 | CannabisCoin | 579 | IDEX Membership | 684 | MktCoin | 789 | SpreadCoin |
| 475 | NuShares | 580 | Zeusshield | 685 | PoSW Coin | 790 | Centurion |
| 476 | DomRaider | 581 | DopeCoin | 686 | Cryptonite | 791 | Zayedcoin |
| 477 | Neurotoken | 582 | FujiCoin | 687 | Opal | 792 | Independent Money System |
| 478 | STK | 583 | EncryptoTel [WAVES] | 688 | SounDAC | 793 | ARbit |
| 479 | Delphy | 584 | KekCoin | 689 | Universe | 794 | Litecred |
| 480 | Sphere | 585 | IXT | 690 | CDX Network | 795 | Nekonium |
| 481 | MobileGo | 586 | CoinFi | 691 | Paragon | 796 | Rupaya |
| 482 | Pinkcoin | 587 | VeriumReserve | 692 | Bitstar | 797 | Bitcoin 21 |
| 483 | Zebi Token | 588 | Motocoin | 693 | ATBCoin | 798 | Californium |
| 484 | Infinitecoin | 589 | Ignition | 694 | Kurrent | 799 | Comet |
| 485 | LUXCoin | 590 | FedoraCoin | 695 | Deutsche eMark | 800 | Phantomx |
| 486 | Manna | 591 | FlypMe | 696 | Suretly | 801 | AmsterdamCoin |
| 487 | BitCrystals | 592 | JET8 | 697 | bitBTC | 802 | High Voltage |
| 488 | HEAT | 593 | CaixaPay | 698 | Rimbit | 803 | MustangCoin |
| 489 | Internxt | 594 | Ultimate Secure Cash | 699 | GCN Coin | 804 | Dollar International |
| 490 | Pylon Network | 595 | Pakcoin | 700 | BlueCoin | 805 | Dollarcoin |
| 491 | Dovu | 596 | Devery | 701 | FirstCoin | 806 | CrevaCoin |
| 492 | BitcoinZ | 597 | Bitzeny | 702 | Evil Coin | 807 | BowsCoin |
| 493 | StrongHands | 598 | Swing | 703 | ParallelCoin | 808 | Coinonat |
| 494 | Dimecoin | 599 | MinexCoin | 704 | BitWhite | 809 | DNotes |
| 495 | WeTrust | 600 | Masari | 705 | Autonio | 810 | LiteBitcoin |
| 496 | Bitcoin Plus | 601 | EventChain | 706 | TransferCoin | 811 | BitCoal |
| 497 | adbank | 602 | Bounty0x | 707 | TajCoin | 812 | SONO |
| 498 | EchoLink | 603 | NANJCOIN | 708 | 2GIVE | 813 | SpeedCash |
| 499 | ATN | 604 | DIMCOIN | 709 | Golos | 814 | PlatinumBAR |
| 500 | Megacoin | 605 | Monkey Project | 710 | GlobalToken | 815 | Experience Points |
| 501 | Auroracoin | 606 | Veros | 711 | TagCoin | 816 | HollyWoodCoin |
| 502 | EncrypGen | 607 | Maverick Chain | 712 | SkinCoin | 817 | Prime-XI |
| 503 | Phoenixcoin | 608 | GoByte | 713 | Anoncoin | 818 | Cabbage |
| 504 | FuzeX | 609 | HelloGold | 714 | DraftCoin | 819 | BenjiRolls |
| 505 | Ink | 610 | GravityCoin | 715 | Cryptojacks | 820 | PosEx |
| 506 | PHI Token | 611 | Goldcoin | 716 | vSlice | 821 | Wild Beast Block |
| 507 | Bitcoin Private | 612 | Jetcoin | 717 | Bitcoin Red | 822 | Iconic |
| 508 | AICHAIN | 613 | MyWish | 718 | Advanced Technology Coin | 823 | PLNcoin |
| 509 | Scala | 614 | Crowd Machine | 719 | SuperCoin | 824 | SocialCoin |
| 510 | Stox | 615 | Startcoin | 720 | XGOX | 825 | SportyCo |
| 511 | Maecenas | 616 | LiteDoge | 721 | Blocktix | 826 | Project-X |
| 512 | Bulwark | 617 | Bezop | 722 | Worldcore | 827 | PonziCoin |
| 513 | SmileyCoin | 618 | InvestDigital | 723 | More Coin | 828 | Save and Gain |
| 514 | OracleChain | 619 | Bolivarcoin | 724 | iTicoin | 829 | Argus |
| 515 | AidCoin | 620 | Graft | 725 | Garlicoin | 830 | SongCoin |
| 516 | eBitcoin | 621 | MyBit | 726 | InflationCoin | 831 | CoinMeet |
| 517 | BiblePay | 622 | Equal | 727 | SophiaTX | 832 | Agoras Tokens |
| 518 | Shift | 623 | Privatix | 728 | SelfSell | 833 | Sexcoin |
| 519 | Orbitcoin | 624 | Matchpool | 729 | ChessCoin | 834 | RabbitCoin |
| 520 | Novacoin | 625 | eBoost | 730 | Eternity | 835 | Quotient |
| 521 | Expanse | 626 | Utrum | 731 | Moin | 836 | Bubble |
| 522 | CVCoin | 627 | imbrex | 732 | PopularCoin | 837 | Axiom |
| 523 | Blue Protocol | 628 | Yocoin | 733 | Payfair | 838 | Francs |
| 524 | TrezarCoin | 629 | BoutsPro | 734 | Rubies | ||
| 525 | HiCoin | 630 | CryptoCarbon | 735 | bitGold |
References
- Nishant, N. Crypto firm FTX Trading’s Valuation Rises to 18 bln after 900 mln Investment. Available online: https://www.reuters.com/technology/crypto-firm-ftx-trading-raises-900-mln-18-bln-valuation-2021-07-20/ (accessed on 1 December 2022).
- Allison, I. Divisions in Sam Bankman-Fried’s Crypto Empire Blur on His Trading Titan Alameda’s Balance Sheet. Available online: https://www.coindesk.com/business/2022/11/02/divisions-in-sam-bankman-frieds-crypto-empire-blur-on-his-trading-titan-alamedas-balance-sheet/ (accessed on 1 December 2022).
- Wilson, T.; Berwick, A. Crypto Exchange FTX Saw Six bln in Withdrawals in 72 h. Available online: https://www.reuters.com/business/finance/crypto-exchange-ftx-saw-6-bln-withdrawals-72-hours-ceo-message-staff-2022-11-08/ (accessed on 1 December 2022).
- Hill, J. Bankman-Fried Resigns From FTX, Puts Empire in Bankruptcy. Available online: https://www.bloomberg.com/news/articles/2022-11-11/ftx-com-goes-bankrupt-in-stunning-reversal-for-crypto-exchange (accessed on 1 December 2022).
- Guarino, M. FTX Crypto Collapse: Ex-CEO Sam Bankman-Fried Denies ’Improper Use’ of Customer Funds. Available online: https://www.goodmorningamerica.com/news/story/ftx-crypto-collapse-ceo-sam-bankman-fried-denies-94215046 (accessed on 1 December 2022).
- Fantazzini, D.; Zimin, S. A multivariate approach for the simultaneous modelling of market risk and credit risk for cryptocurrencies. J. Ind. Bus. Econ. 2020, 47, 19–69. [Google Scholar] [CrossRef]
- Feder, A.; Gandal, N.; Hamrick, J.T.; Moore, T.; Vasek, M. The rise and fall of cryptocurrencies. In Proceedings of the 17th Workshop on the Economics of Information Security (WEIS), Innsbruck, Austria, 18–19 June 2018. [Google Scholar]
- Grobys, K.; Sapkota, N. Predicting cryptocurrency defaults. Appl. Econ. 2020, 52, 5060–5076. [Google Scholar] [CrossRef]
- Schmitz, T.; Hoffmann, I. Re-evaluating cryptocurrencies’ contribution to portfolio diversification—A portfolio analysis with special focus on german investors. arXiv 2020, arXiv:2006.06237. [Google Scholar] [CrossRef]
- Gandal, N.; Hamrick, J.; Moore, T.; Vasek, M. The rise and fall of cryptocurrency coins and tokens. Decis. Econ. Financ. 2021, 44, 981–1014. [Google Scholar] [CrossRef]
- Fantazzini, D. Crypto-Coins and Credit Risk: Modelling and Forecasting Their Probability of Death. J. Risk Financ. Manag. 2022, 15, 304. [Google Scholar] [CrossRef]
- Lyócsa, Š.; Molnár, P.; Vỳrost, T. Stock market volatility forecasting: Do we need high-frequency data? Int. J. Forecast. 2021, 37, 1092–1110. [Google Scholar] [CrossRef]
- Yu, L.; Huang, Z. Do High-Frequency Data Improve Multivariate Volatility Forecasting for Investors with Different Investment Horizons? Technical Report No. E2022018; China Center for Economic Research: Beijing, China, 2022. [Google Scholar]
- Fantazzini, D.; De Giuli, M.E.; Maggi, M.A. A new approach for firm value and default probability estimation beyond Merton models. Comput. Econ. 2008, 31, 161–180. [Google Scholar]
- Su, E.D.; Huang, S.M. Comparing firm failure predictions between logit, KMV, and ZPP models: Evidence from Taiwan’s electronics industry. Asia-Pac. Financ. Mark. 2010, 17, 209–239. [Google Scholar] [CrossRef]
- Li, L.; Yang, J.; Zou, X. A study of credit risk of Chinese listed companies: ZPP versus KMV. Appl. Econ. 2016, 48, 2697–2710. [Google Scholar] [CrossRef]
- Dalla Valle, L.; De Giuli, M.E.; Tarantola, C.; Manelli, C. Default probability estimation via pair copula constructions. Eur. J. Oper. Res. 2016, 249, 298–311. [Google Scholar] [CrossRef]
- Jing, J.; Yan, W.; Deng, X. A hybrid model to estimate corporate default probabilities in China based on zero-price probability model and long short-term memory. Appl. Econ. Lett. 2021, 28, 413–420. [Google Scholar] [CrossRef]
- Moore, T.; Christin, N. Beware the middleman: Empirical analysis of Bitcoin-exchange risk. In Financial Cryptography and Data Security, Proceedings of the 17th International Conference, Okinawa, Japan, 1–5 April 2013; Springer: Berlin/Heidelberg, Germany, 2013; pp. 25–33. [Google Scholar]
- Moore, T.; Christin, N.; Szurdi, J. Revisiting the risks of bitcoin currency exchange closure. ACM Trans. Internet Technol. 2018, 18, 1–18. [Google Scholar] [CrossRef]
- Fantazzini, D. Quantitative Finance with R and Cryptocurrencies; Amazon KDP: Seattle, WA, USA, 2019; ISBN -13: 978–1090685315. [Google Scholar]
- Fantazzini, D.; Calabrese, R. Crypto Exchanges and Credit Risk: Modeling and Forecasting the Probability of Closure. J. Risk Financ. Manag. 2021, 14, 516. [Google Scholar] [CrossRef]
- Milunovich, G.; Lee, S.A. Cryptocurrency exchanges: Predicting which markets will remain active. J. Forecast. 2022, 41, 945–955. [Google Scholar] [CrossRef]
- Nison, S. Beyond Candlesticks: New Japanese Charting Techniques Revealed; John Wiley & Sons: Hoboken, NJ, USA, 1994; Volume 56. [Google Scholar]
- Mandelbrot, B.B. When can price be arbitraged efficiently? A limit to the validity of the random walk and martingale models. Rev. Econ. Stat. 1971, 53, 225–236. [Google Scholar] [CrossRef]
- Parkinson, M. The extreme value method for estimating the variance of the rate of return. J. Bus. 1980, 53, 61–65. [Google Scholar] [CrossRef]
- Chou, R.Y.; Chou, H.; Liu, N. Range volatility: A review of models and empirical studies. In Handbook of Financial Econometrics and Statistics; Lee, C., Lee, J., Eds.; Springer: New York, NY, USA, 2015; pp. 2029–2050. [Google Scholar]
- Patton, A.J. Volatility forecast comparison using imperfect volatility proxies. J. Econom. 2011, 160, 246–256. [Google Scholar] [CrossRef]
- Molnár, P. Properties of range-based volatility estimators. Int. Rev. Financ. Anal. 2012, 23, 20–29. [Google Scholar] [CrossRef]
- Fiszeder, P.; Fałdziński, M.; Molnár, P. Range-based DCC models for covariance and value-at-risk forecasting. J. Empir. Financ. 2019, 54, 58–76. [Google Scholar] [CrossRef]
- Garman, M.B.; Klass, M.J. On the estimation of security price volatilities from historical data. J. Bus. 1980, 53, 67–78. [Google Scholar] [CrossRef]
- Stankovic, S. Almost Every Crypto Asset Is Down over 90% from Peak. Available online: https://cryptobriefing.com/almost-every-crypto-asset-is-down-over-90-from-peak/ (accessed on 1 December 2022).
- Kharif, O. Crypto Slump Leaves 12,100 Coins Trapped in Zombie Trading Limbo. Available online: https://www.bloomberg.com/news/articles/2022-10-03/more-than-12-000-crypto-coins-become-zombies-in-digital-asset-slump (accessed on 1 December 2022).
- Yang, D.; Zhang, Q. Drift-independent volatility estimation based on high, low, open, and close prices. J. Bus. 2000, 73, 477–492. [Google Scholar] [CrossRef]
- Tovanich, N.; Soulié, N.; Heulot, N.; Isenberg, P. The evolution of mining pools and miners’ behaviors in the Bitcoin blockchain. IEEE Trans. Netw. Serv. Manag. 2022, 19, 3633–3644. [Google Scholar] [CrossRef]
- Marcobello, M. Who Are Bitcoin Whales and How Do They Trade? Available online: https://decrypt.co/78416/who-are-bitcoin-whales-how-do-they-trade (accessed on 1 December 2022).
- Corsi, F. A simple approximate long-memory model of realized volatility. J. Financ. Econom. 2009, 7, 174–196. [Google Scholar] [CrossRef]
- Andersen, T.G.; Bollerslev, T.; Diebold, F.X.; Labys, P. Modeling and forecasting realized volatility. Econometrica 2003, 71, 579–625. [Google Scholar] [CrossRef]
- Chou, R.Y. Forecasting financial volatilities with extreme values: The conditional autoregressive range (CARR) model. J. Money Credit. Bank. 2005, 37, 561–582. [Google Scholar] [CrossRef]
- Green, K.C.; Armstrong, J.S. Simple versus complex forecasting: The evidence. J. Bus. Res. 2015, 68, 1678–1685. [Google Scholar] [CrossRef]
- Izzeldin, M.; Hassan, M.K.; Pappas, V.; Tsionas, M. Forecasting realised volatility using ARFIMA and HAR models. Quant. Financ. 2019, 19, 1627–1638. [Google Scholar] [CrossRef]
- McCullagh, P.; Nelder, J.A. Generalized Linear Model; Chapman Hall: London, UK, 1989. [Google Scholar]
- Fuertes, A.M.; Kalotychou, E. Early warning systems for sovereign debt crises: The role of heterogeneity. Comput. Stat. Data Anal. 2006, 51, 1420–1441. [Google Scholar] [CrossRef]
- Rodriguez, A.; Rodriguez, P.N. Understanding and predicting sovereign debt rescheduling: A comparison of the areas under receiver operating characteristic curves. J. Forecast. 2006, 25, 459–479. [Google Scholar] [CrossRef]
- Fantazzini, D.; Figini, S. Default forecasting for small-medium enterprises: Does heterogeneity matter? Int. J. Risk Assess. Manag. 2008, 11, 138–163. [Google Scholar] [CrossRef]
- Fantazzini, D.; Figini, S. Random survival forests models for SME credit risk measurement. Methodol. Comput. Appl. Probab. 2009, 11, 29–45. [Google Scholar] [CrossRef]
- Koenker, R.; Yoon, J. Parametric links for binary choice models: A Fisherian–Bayesian colloquy. J. Econom. 2009, 152, 120–130. [Google Scholar] [CrossRef]
- Gunduz, N.; Fokoué, E. On the predictive properties of binary link functions. Commun. Fac. Sci. Univ. Ank. Ser. Math. Stat. 2017, 66, 1–18. [Google Scholar]
- Ho, T.K. Random decision forests. In Proceedings of the 3rd International Conference on Document Analysis and Recognition, Montreal, QC, Canada, 14–16 August 1995; Volume 1, pp. 278–282. [Google Scholar]
- Breiman, L. Random forests. Mach. Learn. 2001, 45, 5–32. [Google Scholar] [CrossRef]
- Hastie, T.; Tibshirani, R.; Friedman, J. The elements of Statistical Learning: Data Mining, Inference, and Prediction; Springer: Berlin/Heidelberg, Germany, 2009. [Google Scholar]
- Barboza, F.; Kimura, H.; Altman, E. Machine learning models and bankruptcy prediction. Expert Syst. Appl. 2017, 83, 405–417. [Google Scholar] [CrossRef]
- Moscatelli, M.; Parlapiano, F.; Narizzano, S.; Viggiano, G. Corporate default forecasting with machine learning. Expert Syst. Appl. 2020, 161, 113567. [Google Scholar] [CrossRef]
- Aas, K.; Haff, I.H. The generalized hyperbolic skew student’st-distribution. J. Financ. Econom. 2006, 4, 275–309. [Google Scholar]
- Ardia, D.; Bluteau, K.; Ruede, M. Regime changes in Bitcoin GARCH volatility dynamics. Financ. Res. Lett. 2019, 29, 266–271. [Google Scholar] [CrossRef]
- Maciel, L. Cryptocurrencies value-at-risk and expected shortfall: Do regime-switching volatility models improve forecasting? Int. J. Financ. Econ. 2021, 26, 4840–4855. [Google Scholar] [CrossRef]
- Sammut, C.; Webb, G. Encyclopedia of Machine Learning; Springer: Berlin/Heidelberg, Germany, 2011. [Google Scholar]
- Krzanowski, W.; Hand, D. ROC Curves for Continuous Data; CRC Press: London, UK, 2009. [Google Scholar]
- Hansen, P.; Lunde, A.; Nason, J. The model confidence set. Econometrica 2011, 79, 453–497. [Google Scholar] [CrossRef]
- Fantazzini, D.; Maggi, M. Proposed coal power plants and coal-to-liquids plants in the US: Which ones survive and why? Energy Strategy Rev. 2015, 7, 9–17. [Google Scholar] [CrossRef]
- Brier, G. Verification of forecasts expressed in terms of probability. Mon. Weather. Rev. 1950, 78, 1–3. [Google Scholar] [CrossRef]
- Smith, J.; Taylor, N.; Yadav, S. Comparing the bias and misspecification in ARFIMA models. J. Time Ser. Anal. 1997, 18, 507–527. [Google Scholar] [CrossRef]
- Bisaglia, L.; Guegan, D. A comparison of techniques of estimation in long-memory processes. Comput. Stat. Data Anal. 1998, 27, 61–81. [Google Scholar] [CrossRef]
- Reisen, V.A.; Lopes, S. Some simulations and applications of forecasting long-memory time-series models. J. Stat. Plan. Inference 1999, 80, 269–287. [Google Scholar] [CrossRef]
- Reisen, V.A.; Abraham, B.; Toscano, E.M. Parametric and semiparametric estimations of stationary univariate ARFIMA models. Braz. J. Probab. Stat. 2000, 14, 185–206. [Google Scholar]
- Reisen, V.; Abraham, B.; Lopes, S. Estimation of parameters in ARFIMA processes: A simulation study. Commun. Stat. Simul. Comput. 2001, 30, 787–803. [Google Scholar] [CrossRef]
- Sowell, F. Maximum likelihood estimation of stationary univariate fractionally integrated time series models. J. Econom. 1992, 53, 165–188. [Google Scholar] [CrossRef]
- McNeil, A.J.; Frey, R.; Embrechts, P. Quantitative Risk management: Concepts, Techniques and Tools-Revised Edition; Princeton University Press: Princeton, NJ, USA, 2015. [Google Scholar]
- De Prado, M.L. Advances in Financial Machine Learning; John Wiley & Sons: Hoboken, NJ, USA, 2018. [Google Scholar]
- Hyndman, R.; Athanasopoulos, G. Forecasting: Principles and Practice; OTexts: Melbourne, Australia, 2018. [Google Scholar]
- Joseph, M. Modern Time Series Forecasting with Python: Explore Industry-Ready Time Series Forecasting Using Modern Machine Learning and Deep Learning; Packt Publishing Ltd.: Birmingem, UK, 2022. [Google Scholar]
- Nikolaev, D.; Petrova, M. Application of Simple Convolutional Neural Networks in Equity Price Estimation. In Proceedings of the 2021 IEEE 8th International Conference on Problems of Infocommunications, Science and Technology (PIC S&T), Kharkiv, Ukraine, 5–7 October 2021; pp. 147–150. [Google Scholar]
- Singh, S.K.; Singh, S.S.; Singh, V.L. Predicting adoption of next generation digital technology utilizing the adoption-diffusion model fit: The case of mobile payments interface in an emerging economy. Access J. 2023, 4, 130–148. [Google Scholar] [CrossRef]


| YOUNG COINS (%) | |
|---|---|
| p-value J.B. | p-value K.S. |
| 0.09 | 0.17 |
| p-value J.B. | p-value K.S. |
| 60.86 | 71.93 |
| p-value J.B. | p-value K.S. |
| 1.97 | 27.73 |
| OLD COINS (%) | |
| p-value J.B. | p-value K.S. |
| 0.00 | 0.00 |
| p-value J.B. | p-value K.S. |
| 53.70 | 68.85 |
| p-value J.B. | p-value K.S. |
| 0.12 | 16.47 |
| Young Coins: 1-Day-Ahead Probability of Death | ||||||||||
|---|---|---|---|---|---|---|---|---|---|---|
| Models | AUC (Restrictive) | AUC (Simple) | AUC (1 Cent) | Brier Score (Restrictive) | Brier Score (Simple) | Brier Score (1 Cent) | MCS (Restrictive) | MCS (Simple) | MCS (1 Cent) | % Not Converged |
| Logit (expanding window) | 0.79 | 0.73 | 0.60 | 0.048 | 0.137 | 0.242 | not included | not included | not included | 0.00 |
| Probit (expanding window) | 0.75 | 0.70 | 0.59 | 0.049 | 0.140 | 0.244 | not included | not included | not included | 0.00 |
| Cauchit (expanding window) | 0.86 | 0.80 | 0.64 | 0.044 | 0.121 | 0.235 | included | included | included | 0.00 |
| Random Forest (expanding window) | 0.78 | 0.78 | 0.72 | 0.047 | 0.120 | 0.275 | not included | included | not included | 0.00 |
| Logit (fixed window) | 0.84 | 0.77 | 0.58 | 0.046 | 0.127 | 0.285 | not included | not included | not included | 0.00 |
| Probit (fixed window) | 0.83 | 0.74 | 0.58 | 0.047 | 0.133 | 0.286 | not included | not included | not included | 0.00 |
| Cauchit (fixed window) | 0.86 | 0.80 | 0.64 | 0.044 | 0.120 | 0.264 | not included | Included | not included | 0.00 |
| Random Forest (fixed window) | 0.74 | 0.75 | 0.65 | 0.056 | 0.147 | 0.354 | not included | not included | not included | 0.00 |
| ZPP—Random walk | 0.79 | 0.75 | 0.77 | 0.093 | 0.178 | 0.338 | not included | not included | not included | 0.00 |
| ZPP—Normal GARCH(1,1) | 0.74 | 0.69 | 0.65 | 0.068 | 0.184 | 0.387 | not included | not included | not included | 1.70 |
| ZPP—Student’st GARCH(1,1) | 0.60 | 0.57 | 0.66 | 0.057 | 0.182 | 0.398 | not included | not included | not included | 0.90 |
| ZPP—GH Skew-Student GARCH(1,1) | 0.62 | 0.59 | 0.44 | 0.057 | 0.187 | 0.407 | not included | not included | not included | 43.17 |
| ZPP—MSGARCH(1,1) | 0.73 | 0.70 | 0.83 | 0.054 | 0.182 | 0.379 | not included | not included | not included | 0.81 |
| ZPP—D.R.(Garman and Klass)RW | 0.58 | 0.55 | 0.59 | 0.056 | 0.197 | 0.416 | not included | not included | not included | 0.00 |
| ZPP—D.R.(Garman and Klass)HAR | 0.75 | 0.72 | 0.73 | 0.084 | 0.176 | 0.344 | not included | not included | not included | 7.40 |
| ZPP—D.R.(Garman and Klass)ARFIMA | 0.75 | 0.70 | 0.74 | 0.081 | 0.173 | 0.342 | not included | not included | not included | 67.62 |
| ZPP—D.R.(Garman and Klass)CARR | 0.70 | 0.66 | 0.64 | 0.058 | 0.188 | 0.397 | not included | not included | not included | 9.88 |
| ZPP—D.R.(Yang and Zhang)RW | 0.64 | 0.61 | 0.64 | 0.083 | 0.218 | 0.414 | not included | not included | not included | 0.00 |
| ZPP—D.R.(Yang and Zhang)HAR | 0.75 | 0.71 | 0.73 | 0.087 | 0.177 | 0.345 | not included | not included | not included | 0.00 |
| ZPP—D.R.(Yang and Zhang)ARFIMA | 0.76 | 0.69 | 0.74 | 0.084 | 0.176 | 0.347 | not included | not included | not included | 69.29 |
| ZPP—D.R.(Yang and Zhang)CARR | 0.72 | 0.66 | 0.66 | 0.080 | 0.204 | 0.396 | not included | not included | not included | 7.39 |
| Young Coins: 30-Day-Ahead Probability of Death | ||||||||||
| Models | AUC (Restrictive) | AUC (Simple) | AUC (1 Cent) | Brier Score (Restrictive) | Brier Score (Simple) | Brier Score (1 Cent) | MCS (Restrictive) | MCS (Simple) | MCS (1 Cent) | % Not Converged |
| Logit (expanding window) | 0.71 | 0.63 | 0.60 | 0.052 | 0.155 | 0.241 | not included | not included | not included | 0.00 |
| Probit (expanding window) | 0.69 | 0.61 | 0.59 | 0.052 | 0.157 | 0.243 | not included | not included | not included | 0.00 |
| Cauchit (expanding window) | 0.82 | 0.74 | 0.63 | 0.048 | 0.140 | 0.236 | included | not included | not included | 0.00 |
| Random Forest (expanding window) | 0.65 | 0.65 | 0.64 | 0.064 | 0.175 | 0.328 | not included | not included | not included | 0.00 |
| Logit (fixed window) | 0.71 | 0.66 | 0.57 | 0.055 | 0.150 | 0.284 | not included | not included | not included | 0.00 |
| Probit (fixed window) | 0.69 | 0.66 | 0.57 | 0.057 | 0.151 | 0.285 | not included | not included | not included | 0.00 |
| Cauchit (fixed window) | 0.82 | 0.76 | 0.60 | 0.049 | 0.136 | 0.272 | not included | included | not included | 0.00 |
| Random Forest (fixed window) | 0.64 | 0.65 | 0.61 | 0.068 | 0.180 | 0.368 | not included | not included | not included | 0.00 |
| ZPP—Random walk | 0.73 | 0.71 | 0.76 | 0.390 | 0.328 | 0.248 | not included | not included | not included | 0.00 |
| ZPP—Normal GARCH(1,1) | 0.69 | 0.66 | 0.65 | 0.281 | 0.290 | 0.332 | not included | not included | not included | 1.70 |
| ZPP—Student’st GARCH(1,1) | 0.67 | 0.63 | 0.55 | 0.189 | 0.233 | 0.387 | not included | not included | not included | 0.90 |
| ZPP—GH Skewed Student GARCH(1,1) | 0.69 | 0.64 | 0.50 | 0.154 | 0.211 | 0.373 | not included | not included | not included | 43.17 |
| ZPP—MSGARCH(1,1) | 0.72 | 0.70 | 0.85 | 0.150 | 0.178 | 0.189 | not included | not included | Included | 0.81 |
| ZPP—D.R.(Garman and Klass)RW | 0.59 | 0.56 | 0.60 | 0.095 | 0.194 | 0.347 | not included | not included | not included | 0.00 |
| ZPP—D.R.(Garman and Klass)HAR | 0.75 | 0.72 | 0.72 | 0.264 | 0.239 | 0.217 | not included | not included | not included | 7.40 |
| ZPP—D.R.(Garman and Klass)ARFIMA | 0.75 | 0.70 | 0.74 | 0.261 | 0.240 | 0.226 | not included | not included | not included | 67.62 |
| ZPP—D.R.(Garman and Klass)CARR | 0.68 | 0.65 | 0.56 | 0.196 | 0.217 | 0.307 | not included | not included | not included | 9.88 |
| ZPP—D.R.(Yang and Zhang)RW | 0.73 | 0.69 | 0.73 | 0.473 | 0.425 | 0.391 | not included | not included | not included | 0.00 |
| ZPP—D.R.(Yang and Zhang)HAR | 0.73 | 0.71 | 0.74 | 0.418 | 0.348 | 0.253 | not included | not included | not included | 0.00 |
| ZPP—D.R.(Yang and Zhang)ARFIMA | 0.72 | 0.69 | 0.76 | 0.414 | 0.344 | 0.253 | not included | not included | not included | 69.29 |
| ZPP—D.R.(Yang and Zhang)CARR | 0.74 | 0.70 | 0.69 | 0.470 | 0.404 | 0.360 | not included | not included | not included | 7.39 |
| Old Coins: 1-Day-Ahead Probability of Death | ||||||||||
|---|---|---|---|---|---|---|---|---|---|---|
| Models | AUC (Restrictive) | AUC (Simple) | AUC (1 Cent) | Brier Score (Restrictive) | Brier Score (Simple) | Brier Score (1 Cent) | MCS (Restrictive) | MCS (Simple) | MCS (1 Cent) | % Not Converged |
| Logit (expanding window) | 0.74 | 0.74 | 0.69 | 0.060 | 0.212 | 0.165 | not included | not included | not included | 0.00 |
| Probit (expanding window) | 0.73 | 0.71 | 0.67 | 0.073 | 0.232 | 0.171 | not included | not included | not included | 0.00 |
| Cauchit (expanding window) | 0.76 | 0.86 | 0.74 | 0.051 | 0.128 | 0.138 | not included | not included | not included | 0.00 |
| Random Forest (expanding window) | 0.96 | 0.97 | 0.95 | 0.015 | 0.045 | 0.051 | included | included | included | 0.00 |
| Logit (fixed window) | 0.77 | 0.75 | 0.75 | 0.049 | 0.198 | 0.156 | not included | not included | not included | 0.00 |
| Probit (fixed window) | 0.76 | 0.74 | 0.74 | 0.054 | 0.206 | 0.168 | not included | not included | not included | 0.00 |
| Cauchit (fixed window) | 0.77 | 0.85 | 0.76 | 0.050 | 0.131 | 0.125 | not included | not included | not included | 0.00 |
| Random Forest (fixed window) | 0.78 | 0.84 | 0.77 | 0.041 | 0.133 | 0.100 | not included | not included | not included | 0.00 |
| ZPP—Random walk | 0.76 | 0.75 | 0.71 | 0.090 | 0.227 | 0.136 | not included | not included | not included | 0.00 |
| ZPP—Normal GARCH(1,1) | 0.64 | 0.59 | 0.64 | 0.062 | 0.294 | 0.140 | not included | not included | not included | 1.22 |
| ZPP—Student’st GARCH(1,1) | 0.57 | 0.54 | 0.63 | 0.056 | 0.284 | 0.145 | not included | not included | not included | 1.92 |
| ZPP—GH Skewed Student GARCH(1,1) | 0.57 | 0.55 | 0.42 | 0.057 | 0.290 | 0.147 | not included | not included | not included | 42.70 |
| ZPP—MSGARCH(1,1) | 0.69 | 0.68 | 0.70 | 0.053 | 0.282 | 0.139 | not included | not included | not included | 0.67 |
| ZPP—D.R.(Garman and Klass)RW | 0.51 | 0.50 | 0.58 | 0.057 | 0.311 | 0.152 | not included | not included | not included | 0.00 |
| ZPP—D.R.(Garman and Klass)HAR | 0.70 | 0.75 | 0.72 | 0.074 | 0.247 | 0.128 | not included | not included | not included | 12.06 |
| ZPP—D.R.(Garman and Klass)ARFIMA | 0.74 | 0.74 | 0.72 | 0.072 | 0.252 | 0.127 | not included | not included | not included | 74.30 |
| ZPP—D.R.(Garman and Klass)CARR | 0.64 | 0.60 | 0.66 | 0.056 | 0.305 | 0.148 | not included | not included | not included | 11.86 |
| ZPP—D.R.(Yang and Zhang)RW | 0.57 | 0.53 | 0.62 | 0.061 | 0.313 | 0.153 | not included | not included | not included | 0.00 |
| ZPP—D.R.(Yang and Zhang)HAR | 0.71 | 0.73 | 0.74 | 0.073 | 0.250 | 0.128 | not included | not included | not included | 0.00 |
| ZPP—D.R.(Yang and Zhang)ARFIMA | 0.76 | 0.73 | 0.75 | 0.073 | 0.254 | 0.127 | not included | not included | not included | 75.17 |
| ZPP—D.R.(Yang and Zhang)CARR | 0.64 | 0.59 | 0.67 | 0.060 | 0.307 | 0.148 | not included | not included | not included | 13.97 |
| Old Coins: 30-Day-ahead Probability of Death | ||||||||||
| Models | AUC (Restrictive) | AUC (Simple) | AUC (1 Cent) | Brier Score (Restrictive) | Brier Score (Simple) | Brier Score (1 Cent) | MCS (Restrictive) | MCS (Simple) | MCS (1 Cent) | % Not Converged |
| Logit (expanding window) | 0.71 | 0.73 | 0.68 | 0.051 | 0.188 | 0.164 | not included | not included | not included | 0.00 |
| Probit (expanding window) | 0.70 | 0.68 | 0.67 | 0.051 | 0.199 | 0.170 | not included | not included | not included | 0.00 |
| Cauchit (expanding window) | 0.74 | 0.77 | 0.74 | 0.049 | 0.181 | 0.138 | not included | not included | not included | 0.00 |
| Random Forest (expanding window) | 0.76 | 0.80 | 0.77 | 0.047 | 0.172 | 0.117 | included | included | included | 0.00 |
| Logit (fixed window) | 0.74 | 0.77 | 0.74 | 0.049 | 0.181 | 0.158 | not included | not included | not included | 0.00 |
| Probit (fixed window) | 0.73 | 0.77 | 0.74 | 0.049 | 0.181 | 0.165 | not included | not included | not included | 0.00 |
| Cauchit (fixed window) | 0.75 | 0.79 | 0.75 | 0.049 | 0.176 | 0.127 | not included | not included | not included | 0.00 |
| Random Forest (fixed window) | 0.69 | 0.72 | 0.71 | 0.052 | 0.202 | 0.127 | not included | not included | not included | 0.00 |
| ZPP—Random walk | 0.75 | 0.69 | 0.68 | 0.321 | 0.246 | 0.301 | not included | not included | not included | 0.00 |
| ZPP—Normal GARCH(1,1) | 0.66 | 0.58 | 0.58 | 0.189 | 0.280 | 0.214 | not included | not included | not included | 1.22 |
| ZPP—Student’st GARCH(1,1) | 0.63 | 0.55 | 0.61 | 0.184 | 0.275 | 0.254 | not included | not included | not included | 1.92 |
| ZPP—GH Skew-Student GARCH(1,1) | 0.64 | 0.57 | 0.60 | 0.160 | 0.264 | 0.229 | not included | not included | not included | 42.70 |
| ZPP—MSGARCH(1,1) | 0.68 | 0.67 | 0.74 | 0.123 | 0.218 | 0.144 | not included | not included | not included | 0.67 |
| ZPP—D.R.(Garman and Klass)RW | 0.52 | 0.50 | 0.58 | 0.087 | 0.296 | 0.143 | not included | not included | not included | 0.00 |
| ZPP—D.R.(Garman and Klass)HAR | 0.70 | 0.74 | 0.70 | 0.276 | 0.214 | 0.260 | not included | not included | not included | 12.06 |
| ZPP—D.R.(Garman and Klass)ARFIMA | 0.75 | 0.75 | 0.71 | 0.273 | 0.213 | 0.257 | not included | not included | not included | 74.30 |
| ZPP—D.R.(Garman and Klass)CARR | 0.64 | 0.61 | 0.58 | 0.162 | 0.247 | 0.193 | not included | not included | not included | 11.86 |
| ZPP—D.R.(Yang and Zhang)RW | 0.70 | 0.57 | 0.68 | 0.273 | 0.382 | 0.257 | not included | not included | not included | 0.00 |
| ZPP—D.R.(Yang and Zhang)HAR | 0.74 | 0.69 | 0.73 | 0.346 | 0.254 | 0.315 | not included | not included | not included | 0.00 |
| ZPP—D.R.(Yang and Zhang)ARFIMA | 0.77 | 0.73 | 0.73 | 0.338 | 0.244 | 0.309 | not included | not included | not included | 75.17 |
| ZPP—D.R.(Yang and Zhang)CARR | 0.73 | 0.61 | 0.68 | 0.298 | 0.316 | 0.290 | not included | not included | not included | 13.97 |
| Old Coins: 365-Day-Ahead Probability of Death | ||||||||||
|---|---|---|---|---|---|---|---|---|---|---|
| Models | AUC (Restrictive) | AUC (Simple) | AUC (1 Cent) | Brier Score (Restrictive) | Brier Score (Simple) | Brier Score (1 Cent) | MCS (Restrictive) | MCS (Simple) | MCS (1 Cent) | % Not Converged |
| Logit (expanding window) | 0.59 | 0.57 | 0.61 | 0.088 | 0.337 | 0.179 | not included | not included | not included | 0.00 |
| Probit (expanding window) | 0.58 | 0.55 | 0.61 | 0.085 | 0.331 | 0.182 | Included | not included | not included | 0.00 |
| Cauchit (expanding window) | 0.63 | 0.61 | 0.65 | 0.089 | 0.354 | 0.172 | not included | not included | included | 0.00 |
| Random Forest (expanding window) | 0.61 | 0.60 | 0.59 | 0.089 | 0.341 | 0.206 | not included | not included | not included | 0.00 |
| Logit (fixed window) | 0.60 | 0.58 | 0.65 | 0.103 | 0.366 | 0.188 | not included | not included | not included | 0.00 |
| Probit (fixed window) | 0.60 | 0.57 | 0.63 | 0.107 | 0.363 | 0.198 | not included | not included | not included | 0.00 |
| Cauchit (fixed window) | 0.63 | 0.60 | 0.65 | 0.096 | 0.381 | 0.177 | not included | not included | not included | 0.00 |
| Random Forest (fixed window) | 0.62 | 0.61 | 0.61 | 0.086 | 0.327 | 0.190 | Included | not included | not included | 0.00 |
| ZPP—Random walk | 0.69 | 0.50 | 0.63 | 0.697 | 0.503 | 0.584 | not included | not included | not included | 0.00 |
| ZPP—Normal GARCH(1,1) | 0.66 | 0.51 | 0.55 | 0.802 | 0.554 | 0.718 | not included | not included | not included | 1.22 |
| ZPP—Student’st GARCH(1,1) | 0.68 | 0.52 | 0.56 | 0.360 | 0.414 | 0.355 | not included | not included | not included | 1.92 |
| ZPP—GH Skew-Student GARCH(1,1) | 0.67 | 0.50 | 0.54 | 0.328 | 0.411 | 0.330 | not included | not included | not included | 42.70 |
| ZPP—MSGARCH(1,1) | 0.63 | 0.52 | 0.69 | 0.333 | 0.354 | 0.298 | not included | not included | not included | 0.67 |
| ZPP—D.R.(Garman and Klass)RW | 0.51 | 0.55 | 0.58 | 0.292 | 0.286 | 0.276 | not included | Included | not included | 0.00 |
| ZPP—D.R.(Garman and Klass)HAR | 0.64 | 0.62 | 0.66 | 0.544 | 0.301 | 0.467 | not included | not included | not included | 12.06 |
| ZPP—D.R.(Garman and Klass)ARFIMA | 0.69 | 0.60 | 0.70 | 0.543 | 0.296 | 0.467 | not included | not included | not included | 74.30 |
| ZPP—D.R.(Garman and Klass)CARR | 0.60 | 0.55 | 0.51 | 0.513 | 0.312 | 0.477 | not included | not included | not included | 11.86 |
| ZPP—D.R.(Yang and Zhang)RW | 0.70 | 0.47 | 0.64 | 0.914 | 0.702 | 0.771 | not included | not included | not included | 0.00 |
| ZPP—D.R.(Yang and Zhang)HAR | 0.69 | 0.52 | 0.66 | 0.766 | 0.495 | 0.639 | not included | not included | not included | 0.00 |
| ZPP—D.R.(Yang and Zhang)ARFIMA | 0.68 | 0.54 | 0.69 | 0.686 | 0.443 | 0.575 | not included | not included | not included | 75.17 |
| ZPP—D.R.(Yang and Zhang)CARR | 0.70 | 0.51 | 0.65 | 0.756 | 0.509 | 0.660 | not included | not included | not included | 13.97 |
Disclaimer/Publisher’s Note: The statements, opinions and data contained in all publications are solely those of the individual author(s) and contributor(s) and not of MDPI and/or the editor(s). MDPI and/or the editor(s) disclaim responsibility for any injury to people or property resulting from any ideas, methods, instructions or products referred to in the content. |
© 2023 by the author. Licensee MDPI, Basel, Switzerland. This article is an open access article distributed under the terms and conditions of the Creative Commons Attribution (CC BY) license (https://creativecommons.org/licenses/by/4.0/).
Share and Cite
Fantazzini, D. Assessing the Credit Risk of Crypto-Assets Using Daily Range Volatility Models. Information 2023, 14, 254. https://doi.org/10.3390/info14050254
Fantazzini D. Assessing the Credit Risk of Crypto-Assets Using Daily Range Volatility Models. Information. 2023; 14(5):254. https://doi.org/10.3390/info14050254
Chicago/Turabian StyleFantazzini, Dean. 2023. "Assessing the Credit Risk of Crypto-Assets Using Daily Range Volatility Models" Information 14, no. 5: 254. https://doi.org/10.3390/info14050254
APA StyleFantazzini, D. (2023). Assessing the Credit Risk of Crypto-Assets Using Daily Range Volatility Models. Information, 14(5), 254. https://doi.org/10.3390/info14050254