


Evaluation of a Resilience-Driven Operational Concept to Manage Drone Intrusions in Airports

 ,
,  ,
, 
Abstract
1. Introduction
- The “before” and “during” phases for “resisting” and “absorbing” the intrusion, in order to increase the resilience of the airport by means of mitigation and response planning;
- Technological and organizational dimensions in order to address a process model and an operational procedure for a proactive DIMS, employing different building blocks, from the detection up to the mitigation systems.
2. Related Work
2.1. Airport Resilience
2.2. Counter-Drone Systems for Airports
2.3. Research Gaps and Proposed Innovation
3. Operational Concept for Drone Intrusion Management
- ASPRID’s process model, which specifies the actors and the workflow of the operations performed by the actors to accomplish the management of drone intrusions;
- ASPRID’s operational procedure, which specifies the step-by-step instructions for the operators to accomplish the management of drone intrusions.
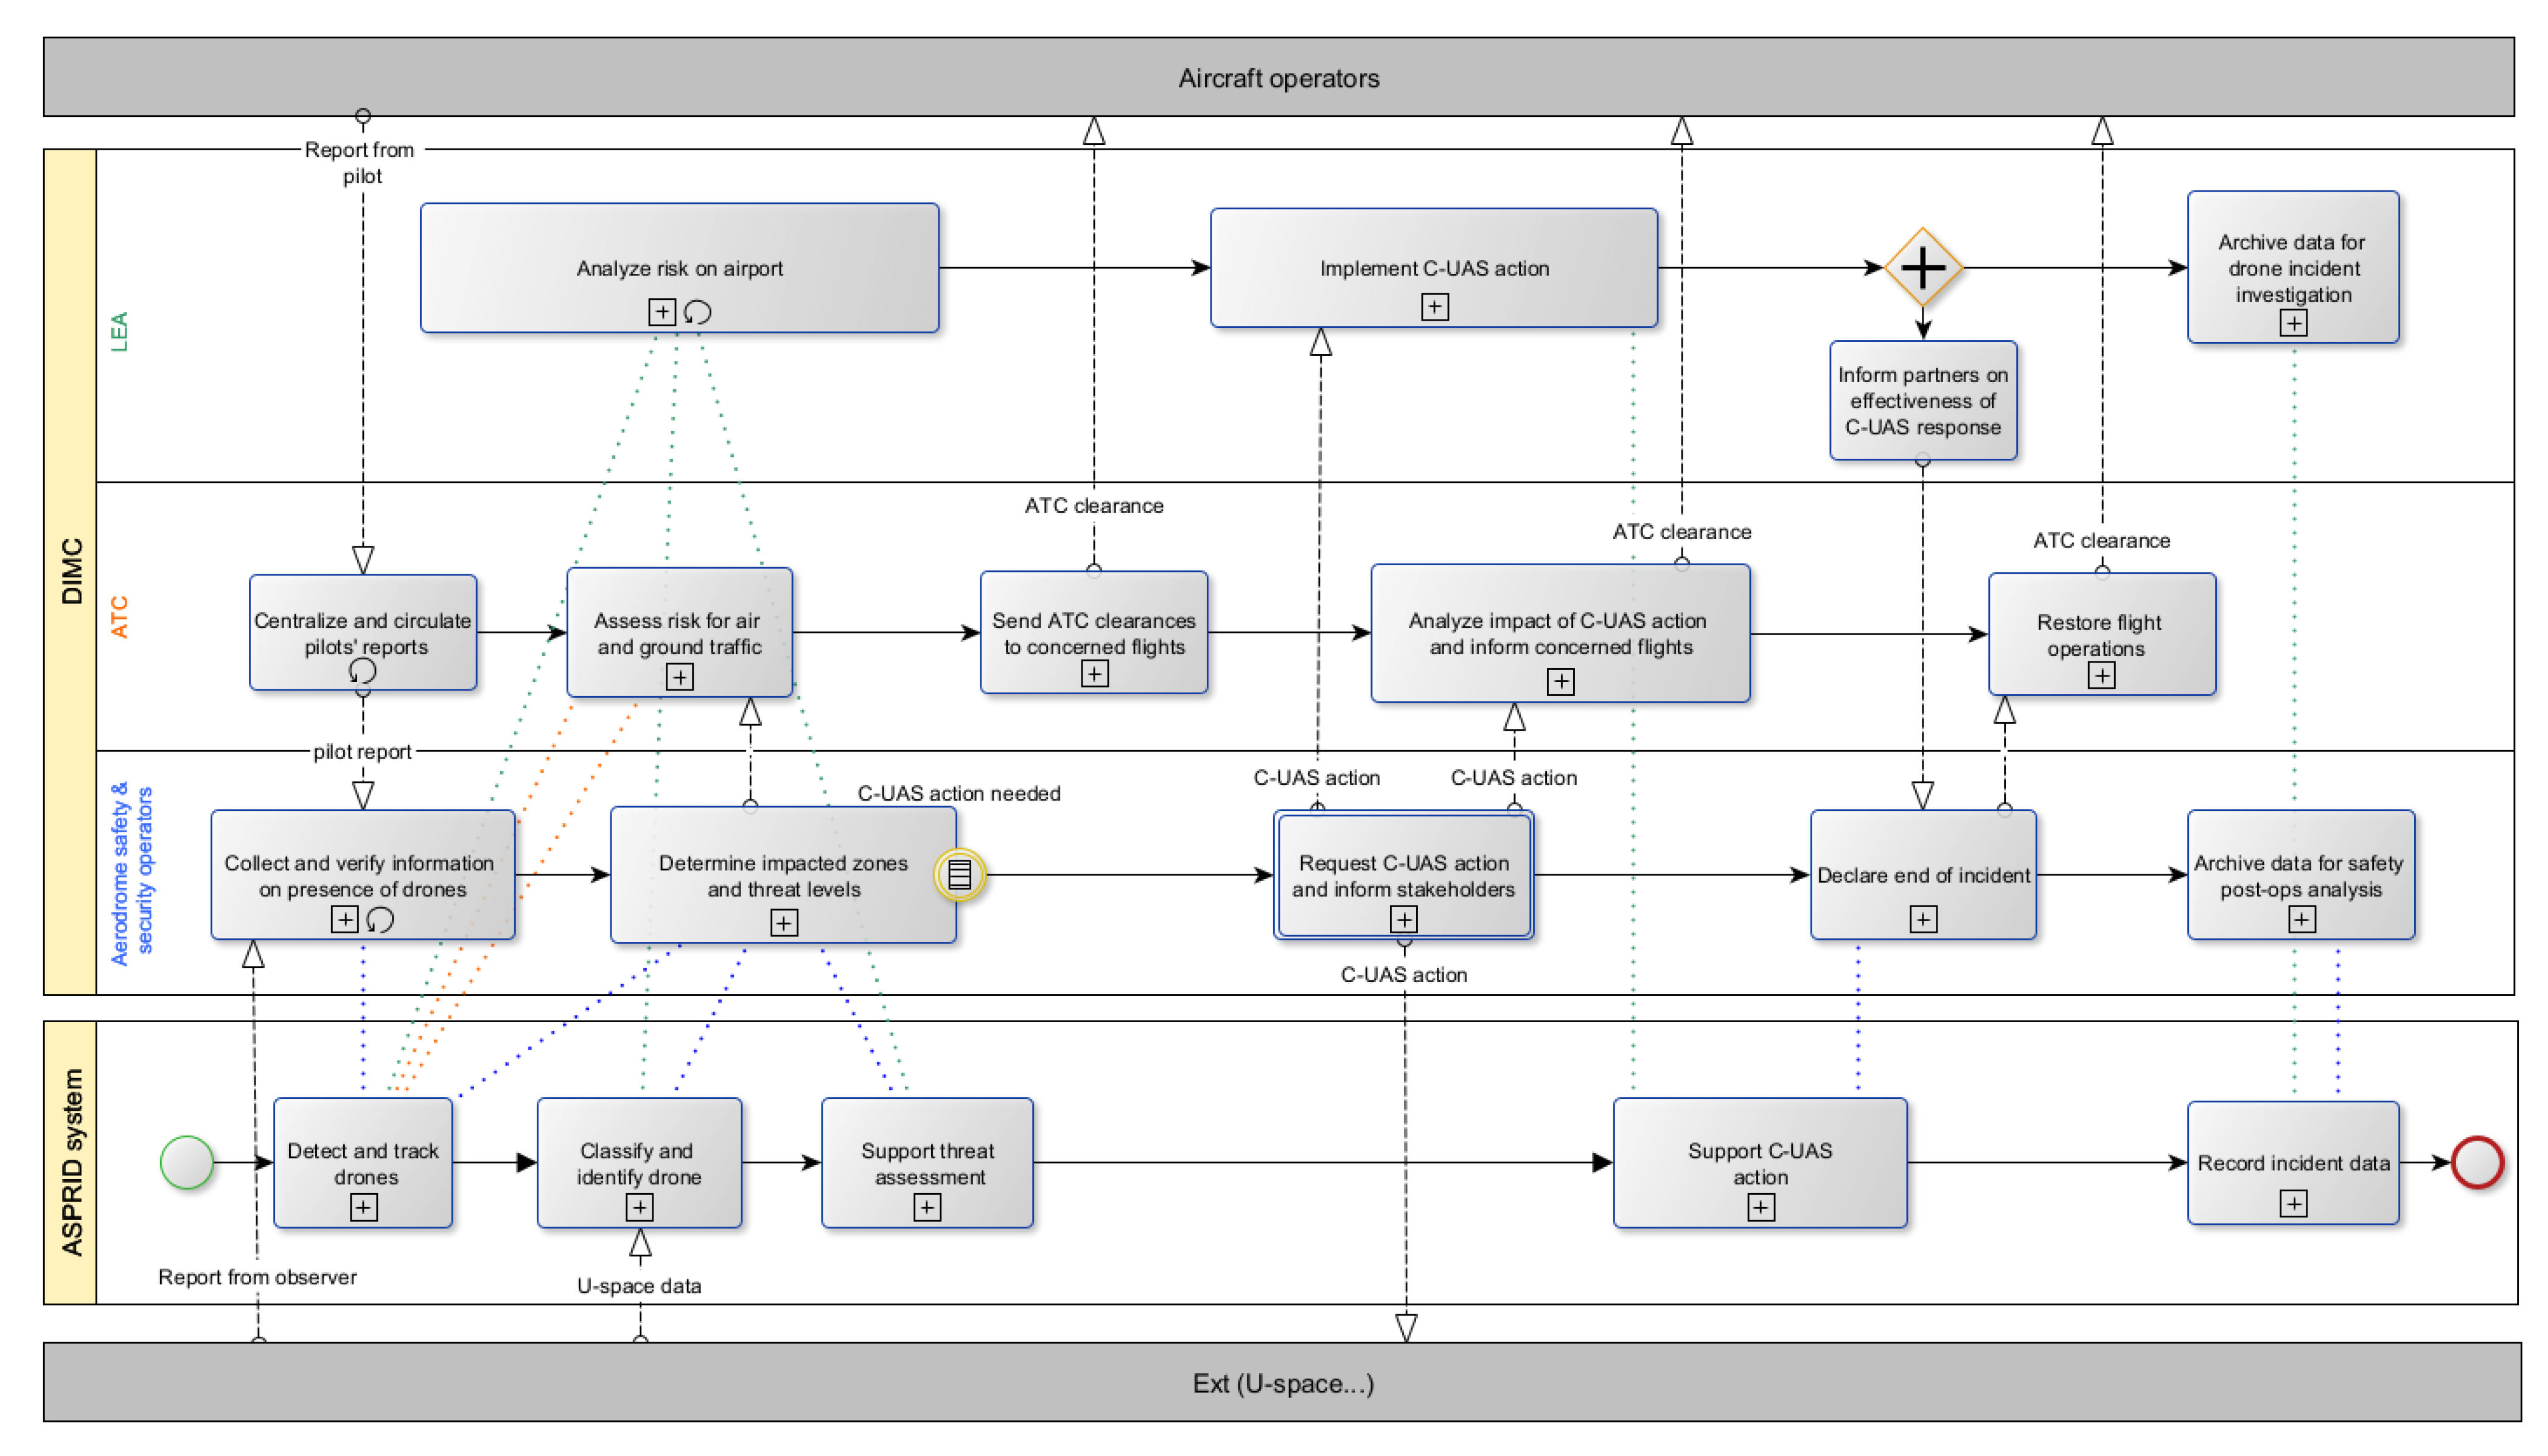
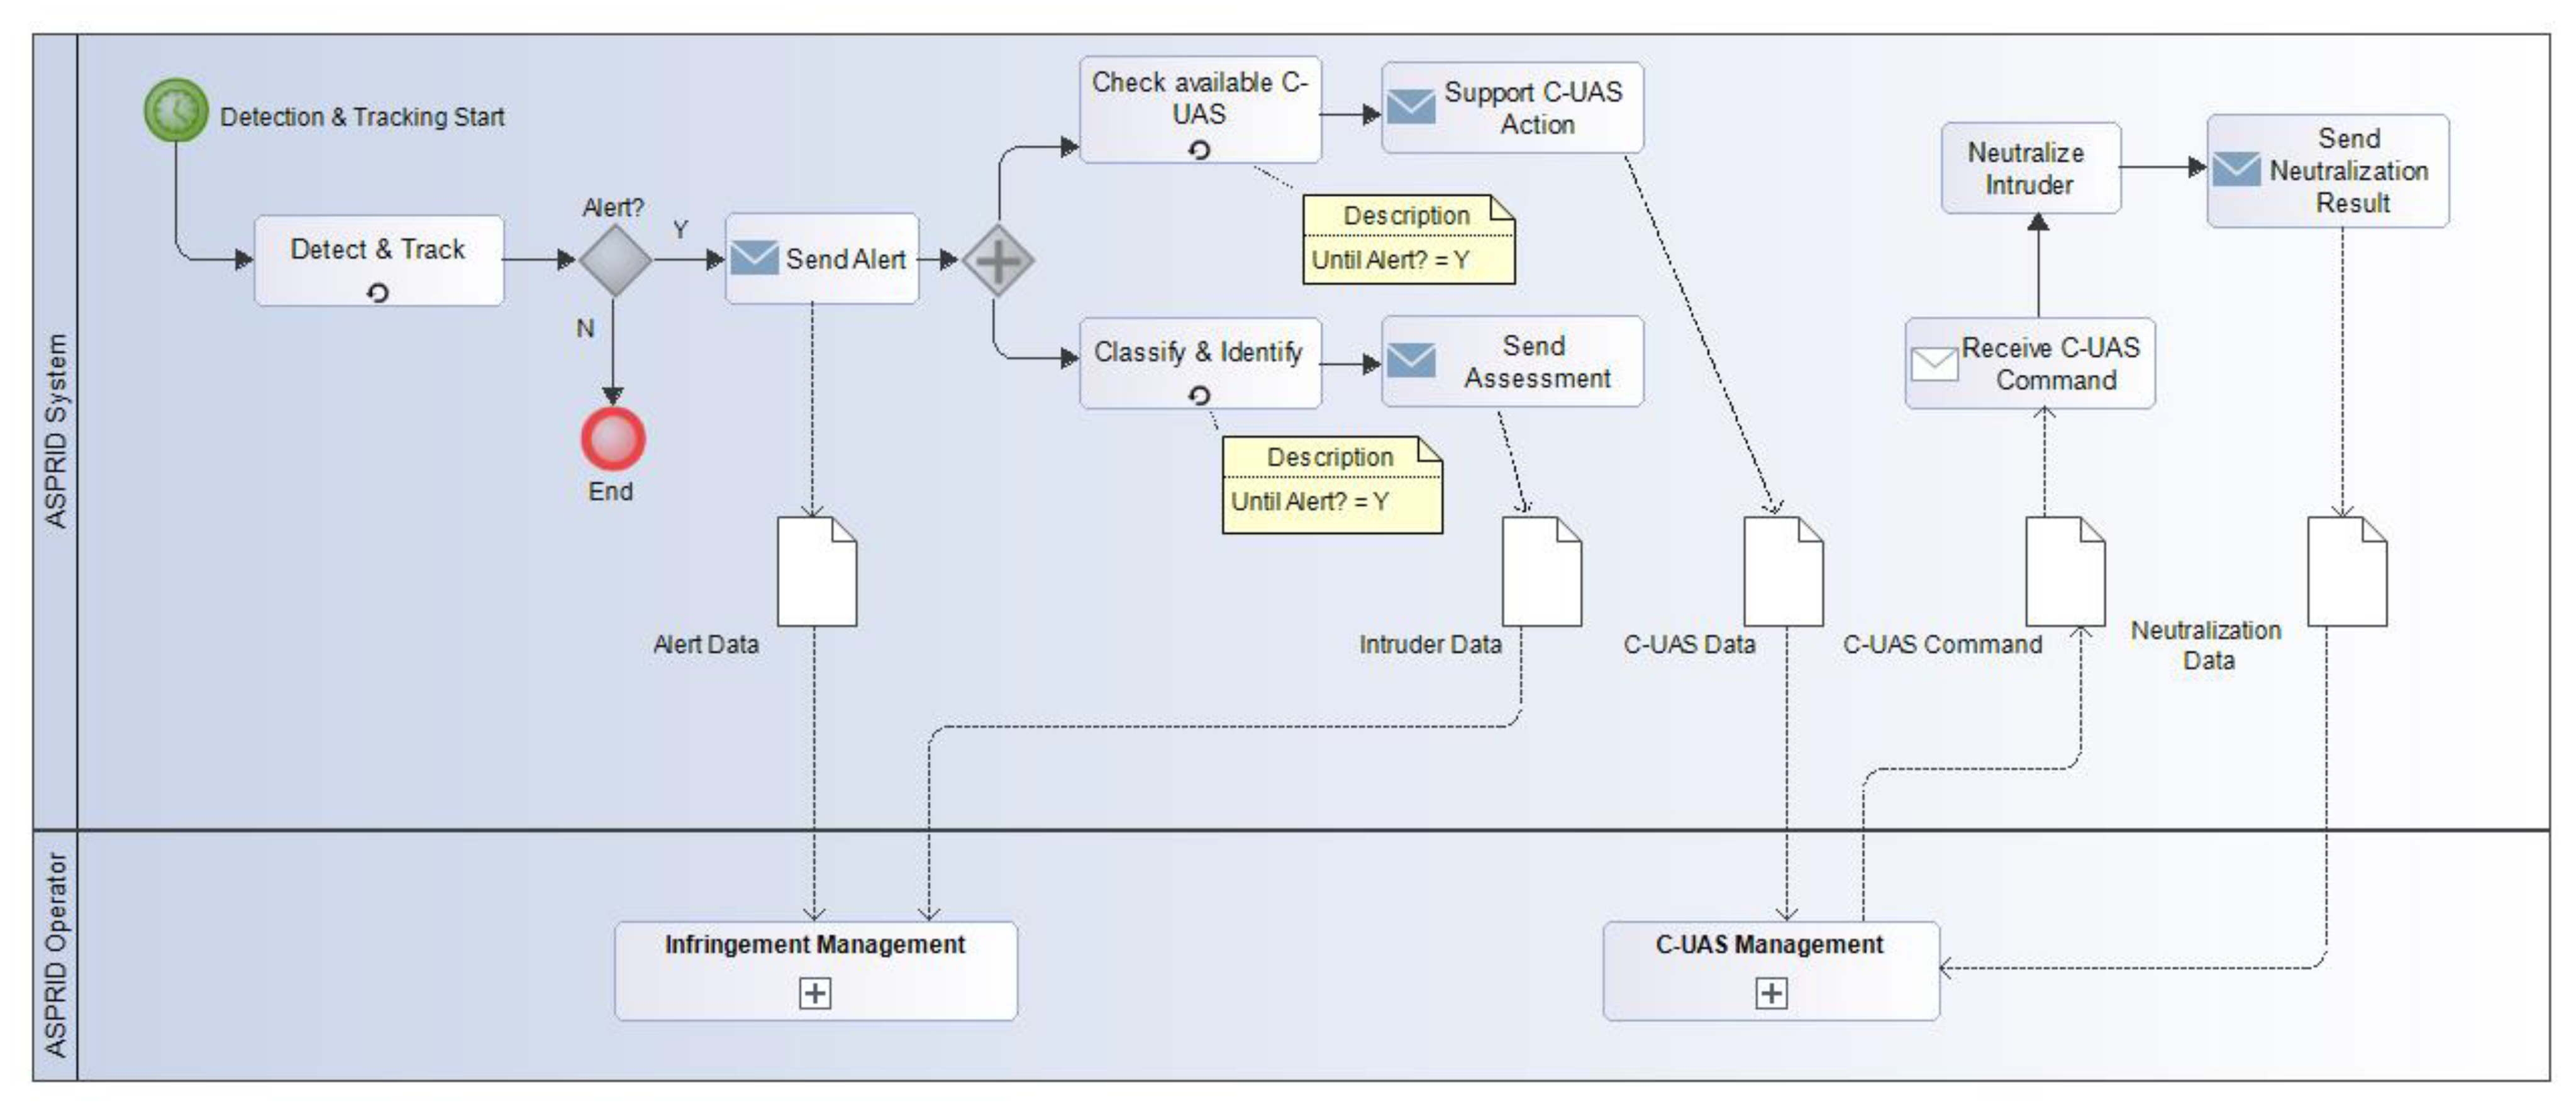
3.1. Process Model
- The detection and tracking of unauthorized drones;
- Alerting to drone intrusions;
- The classification and identification of unauthorized drones, i.e., reconnaissance of drone features (type, speed, etc.);
- Providing support to threat assessments, i.e., the estimation of the level of risk related to drone intrusion (e.g., as a function of the type and the speed of the drone, of the current ongoing operations, etc.);
- Providing support to C-UAS actions, i.e., the neutralization of unauthorized drones.
- The strategic phase, during which roles and responsibilities are defined, tools are trained and configured, and main scenarios are simulated;
- The tactical phase, during which all actors manage the threat according to procedures defined in the strategic phase, the latest information data, and the ASPRID analysis;
- The post-operations (post-ops) phase, which is used to investigate past incidents and how processes may be improved.
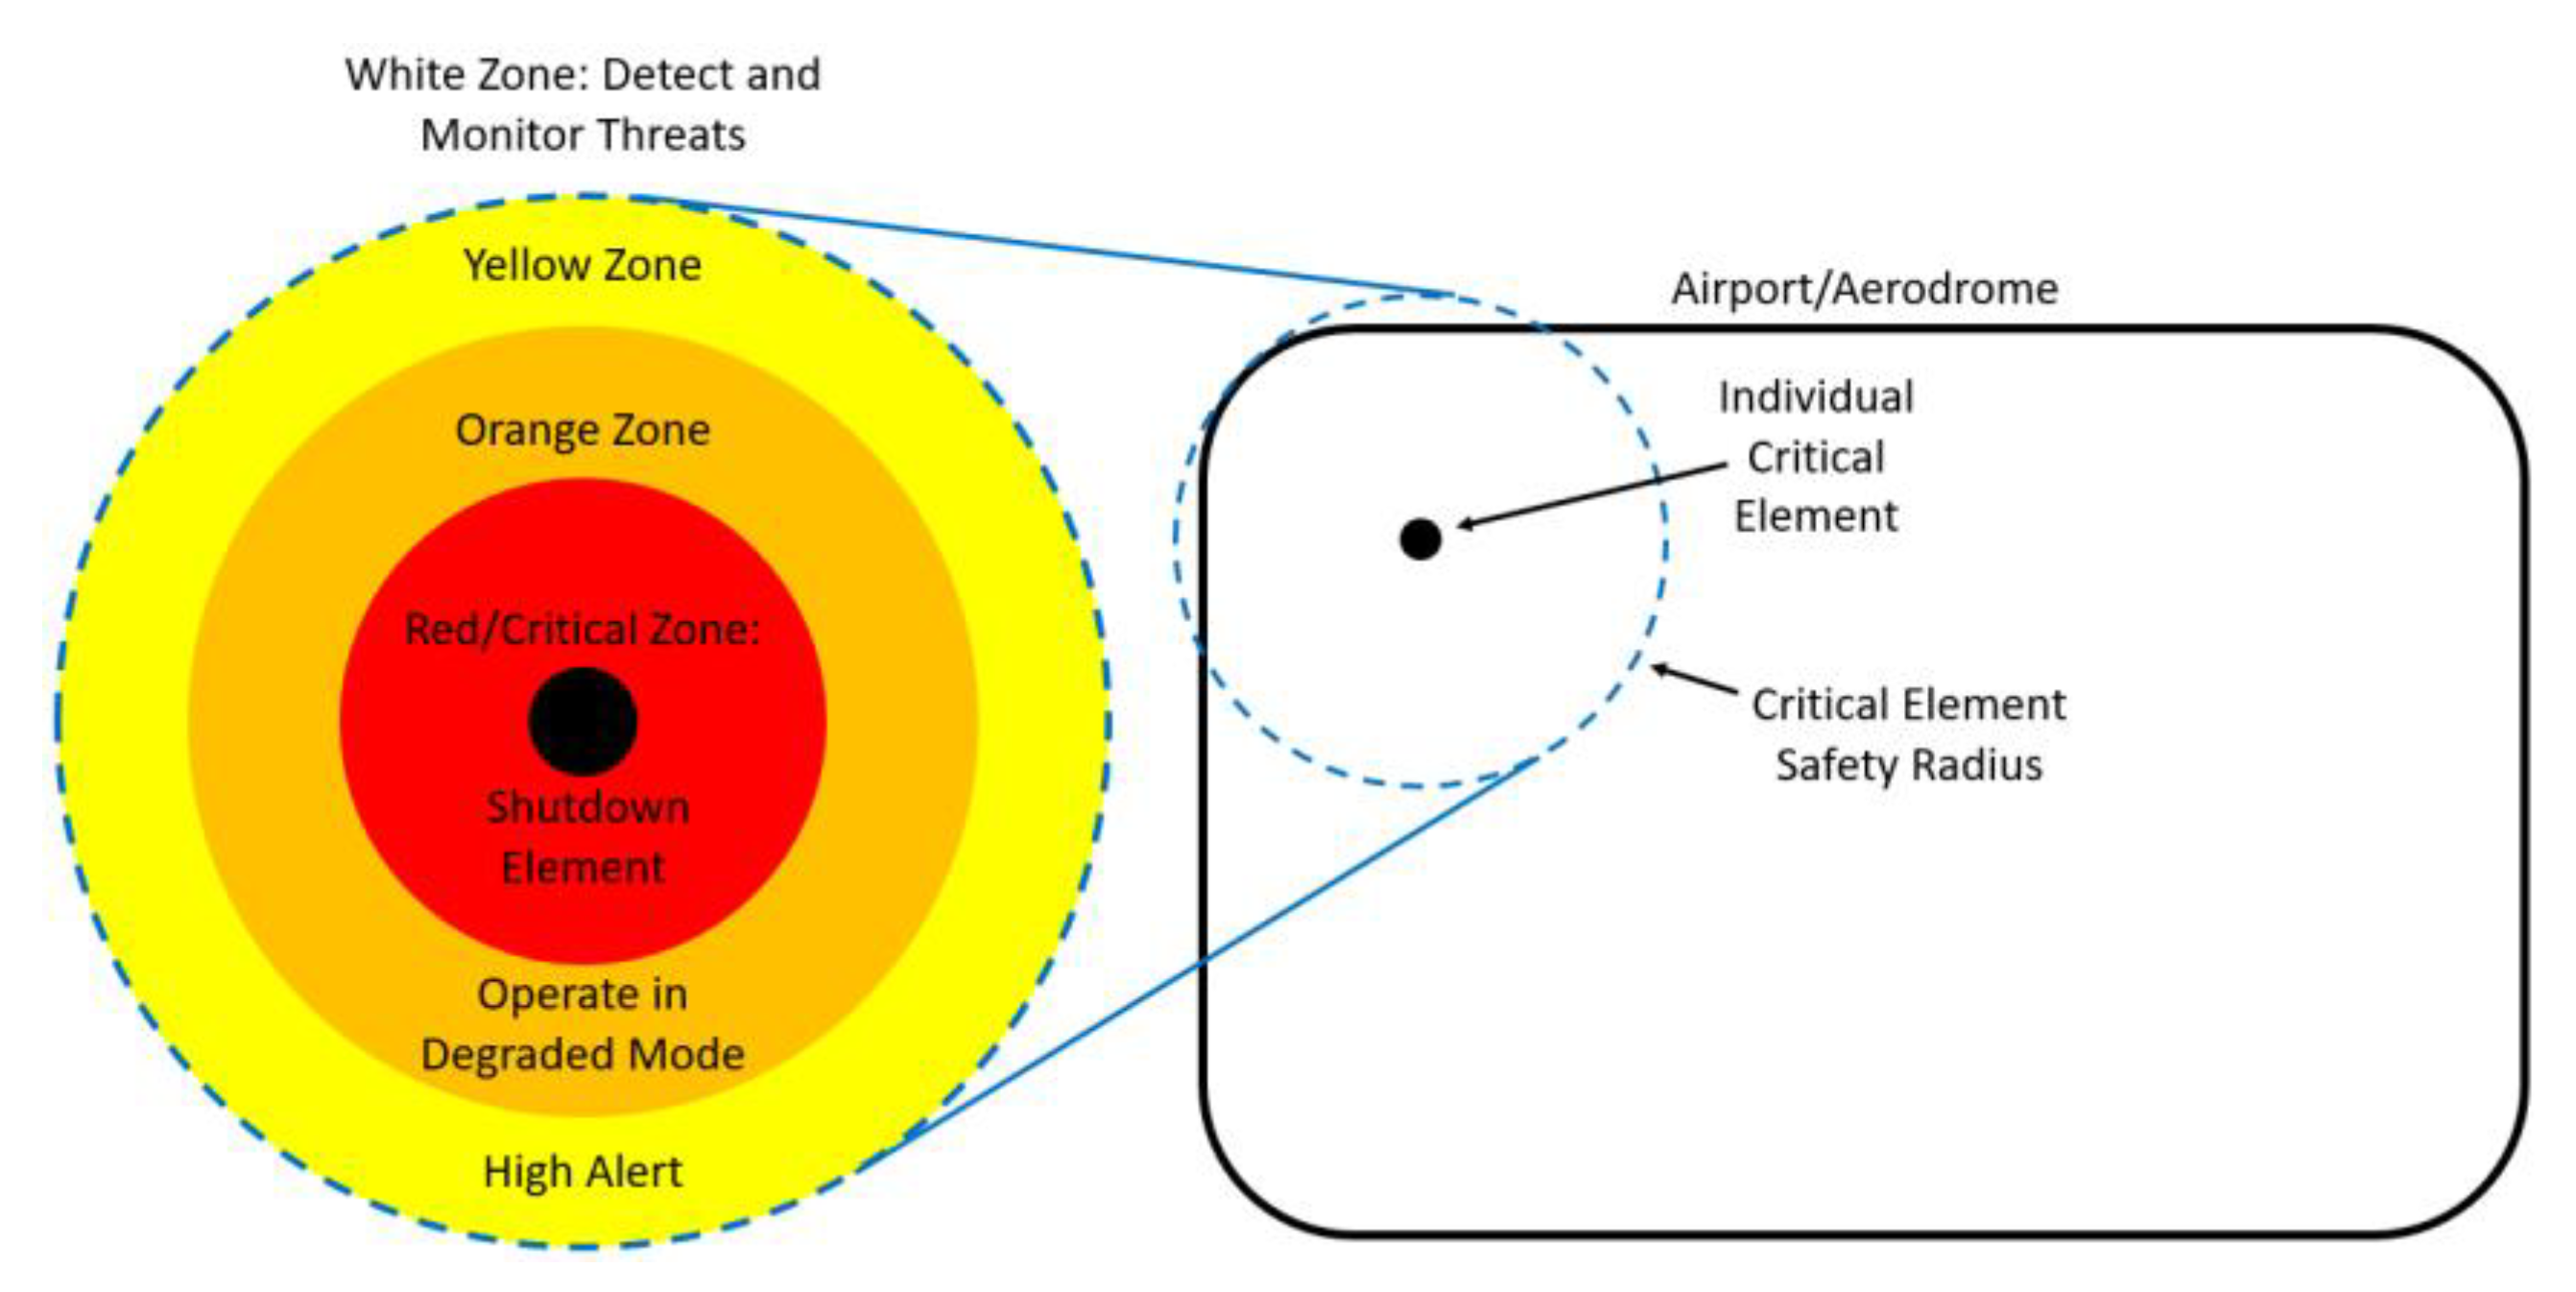
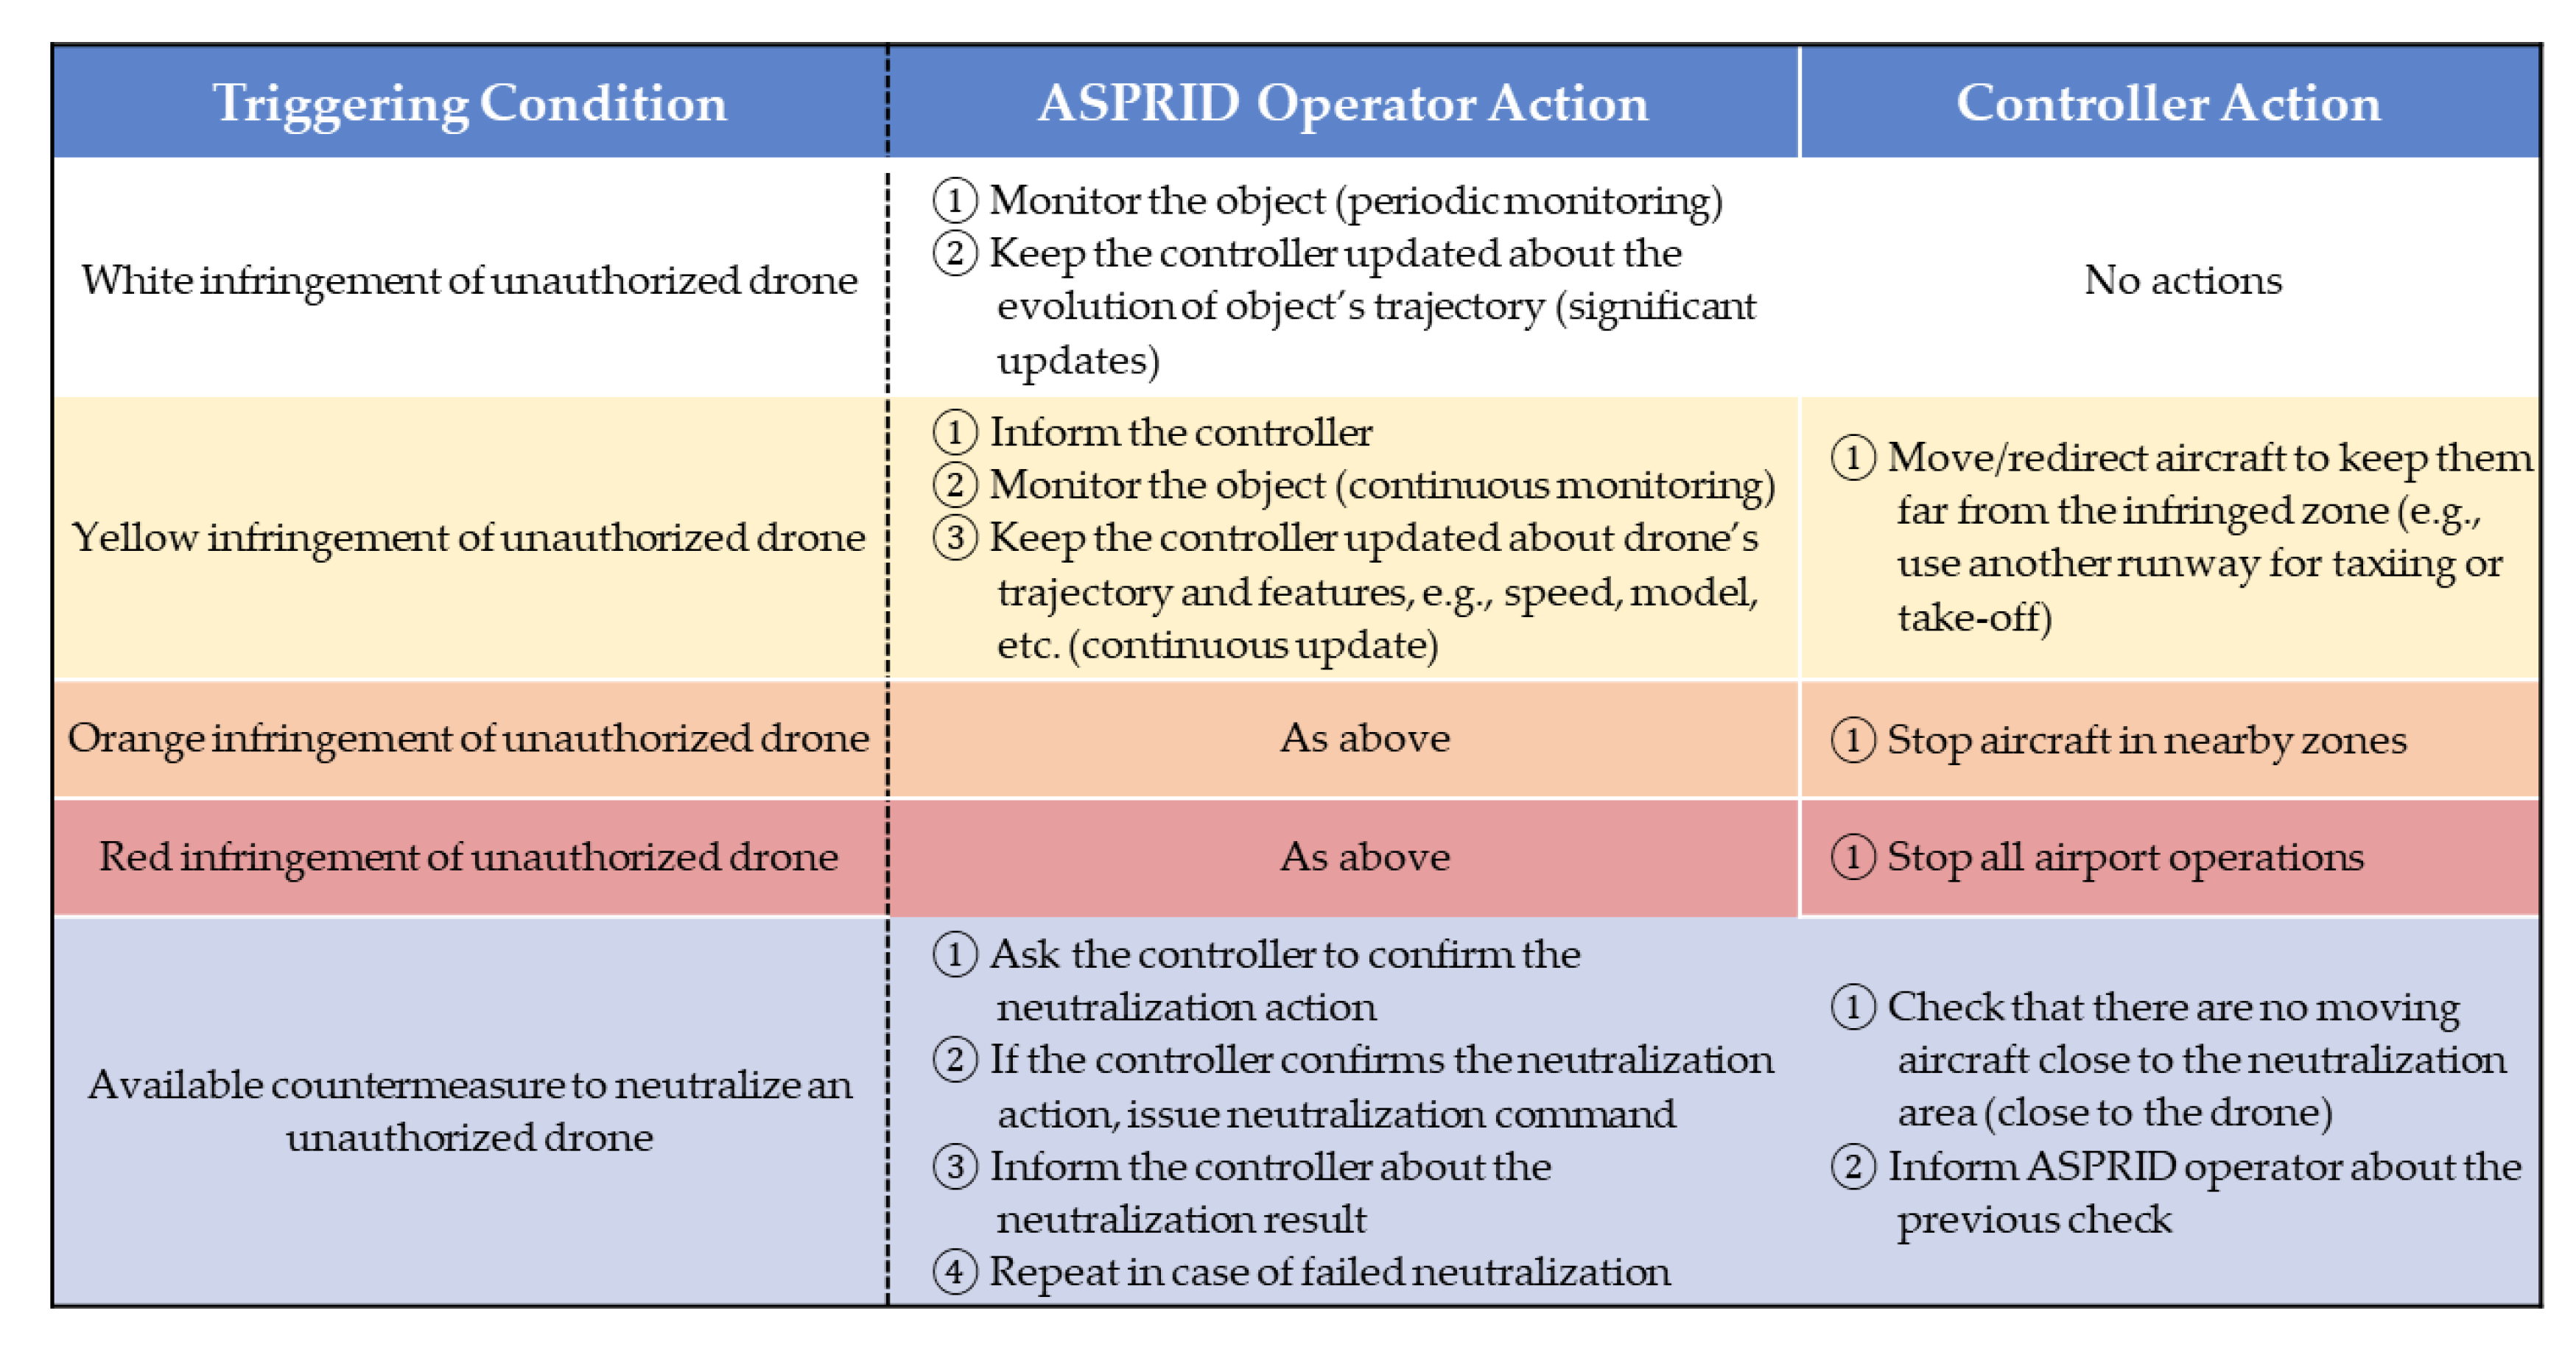
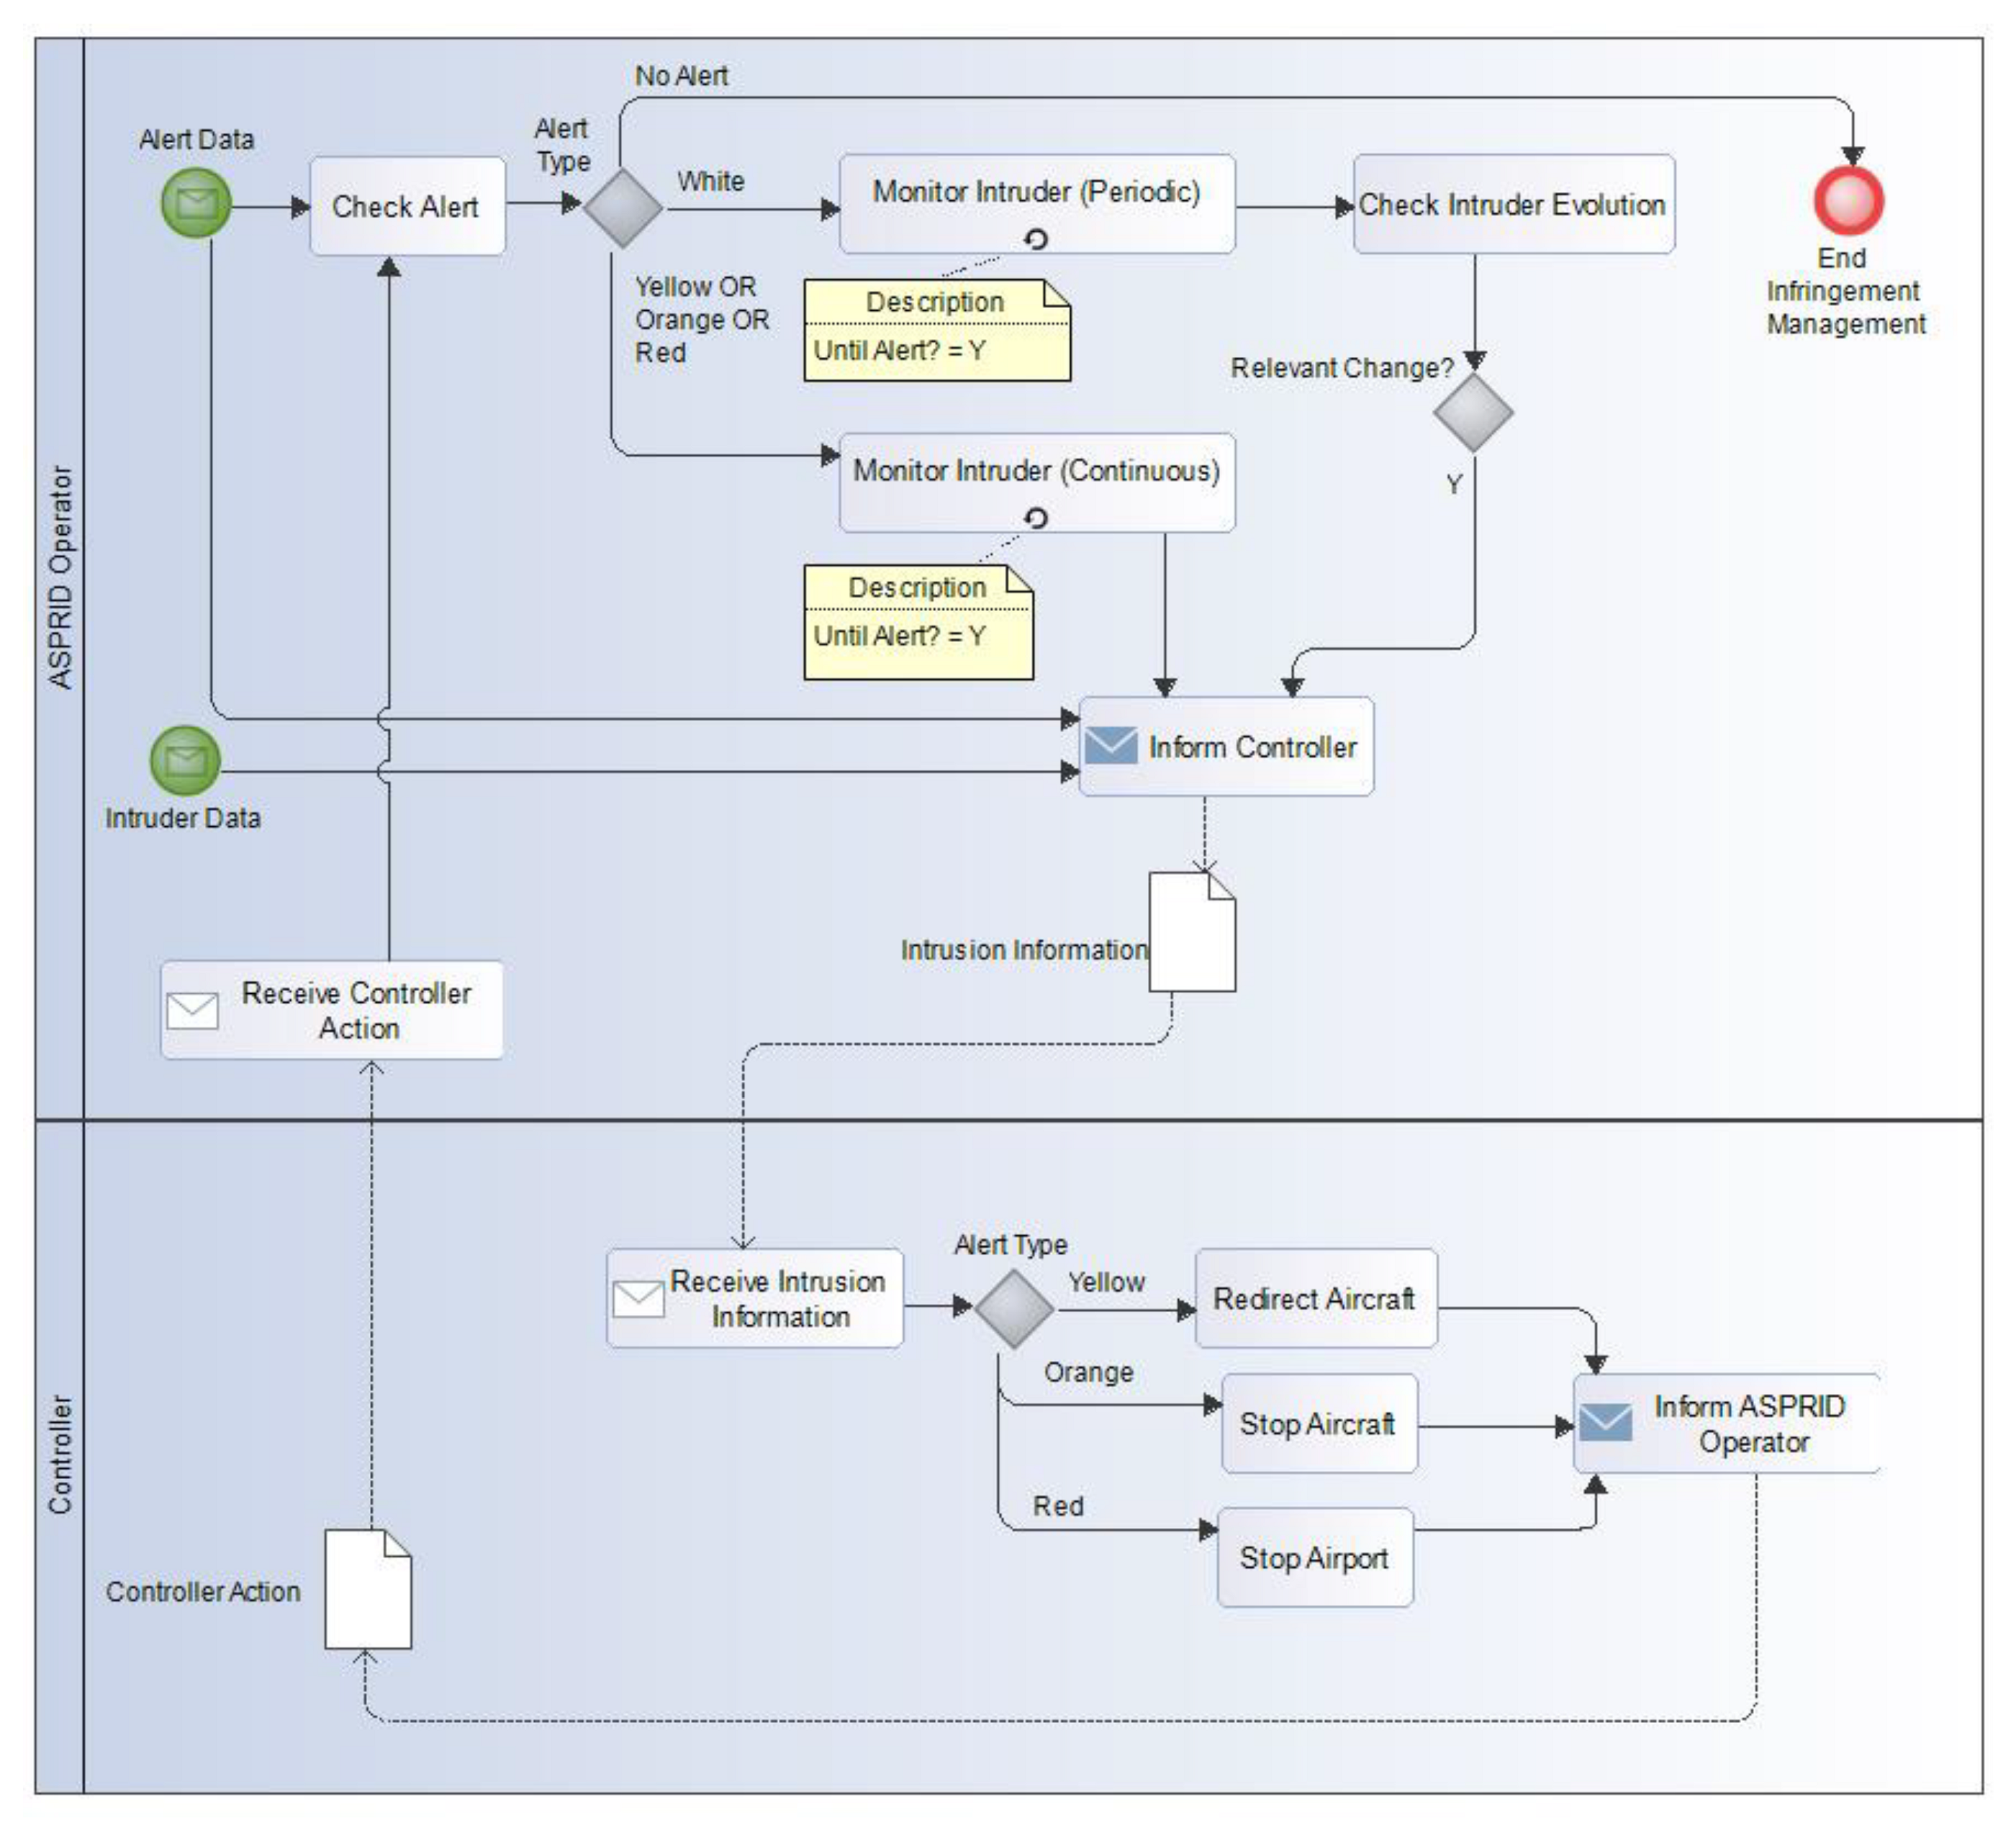
3.2. Operational Procedure
- White level—The drone is outside of the safety radius. The asset operates in nominal mode.
- Yellow level—The drone is within the safety radius but does not physically interfere with the asset’s operations. The asset operates in nominal mode but requires a high monitoring level.
- Orange level—The drone is within the safety radius and physically interferes with the asset’s operations, but the collision between the drone and the asset is not imminent. The asset operates in degraded mode. Interdependent assets may also operate in degraded mode.
- Red level—The drone is within the safety radius, it physically interferes with the asset’s operations, and the collision between the drone and the asset is imminent. The asset operates in suspended mode, i.e., it requires a shutdown for its operations. Interdependent assets or the full airport may also require a shutdown.

4. Evaluation Methodology
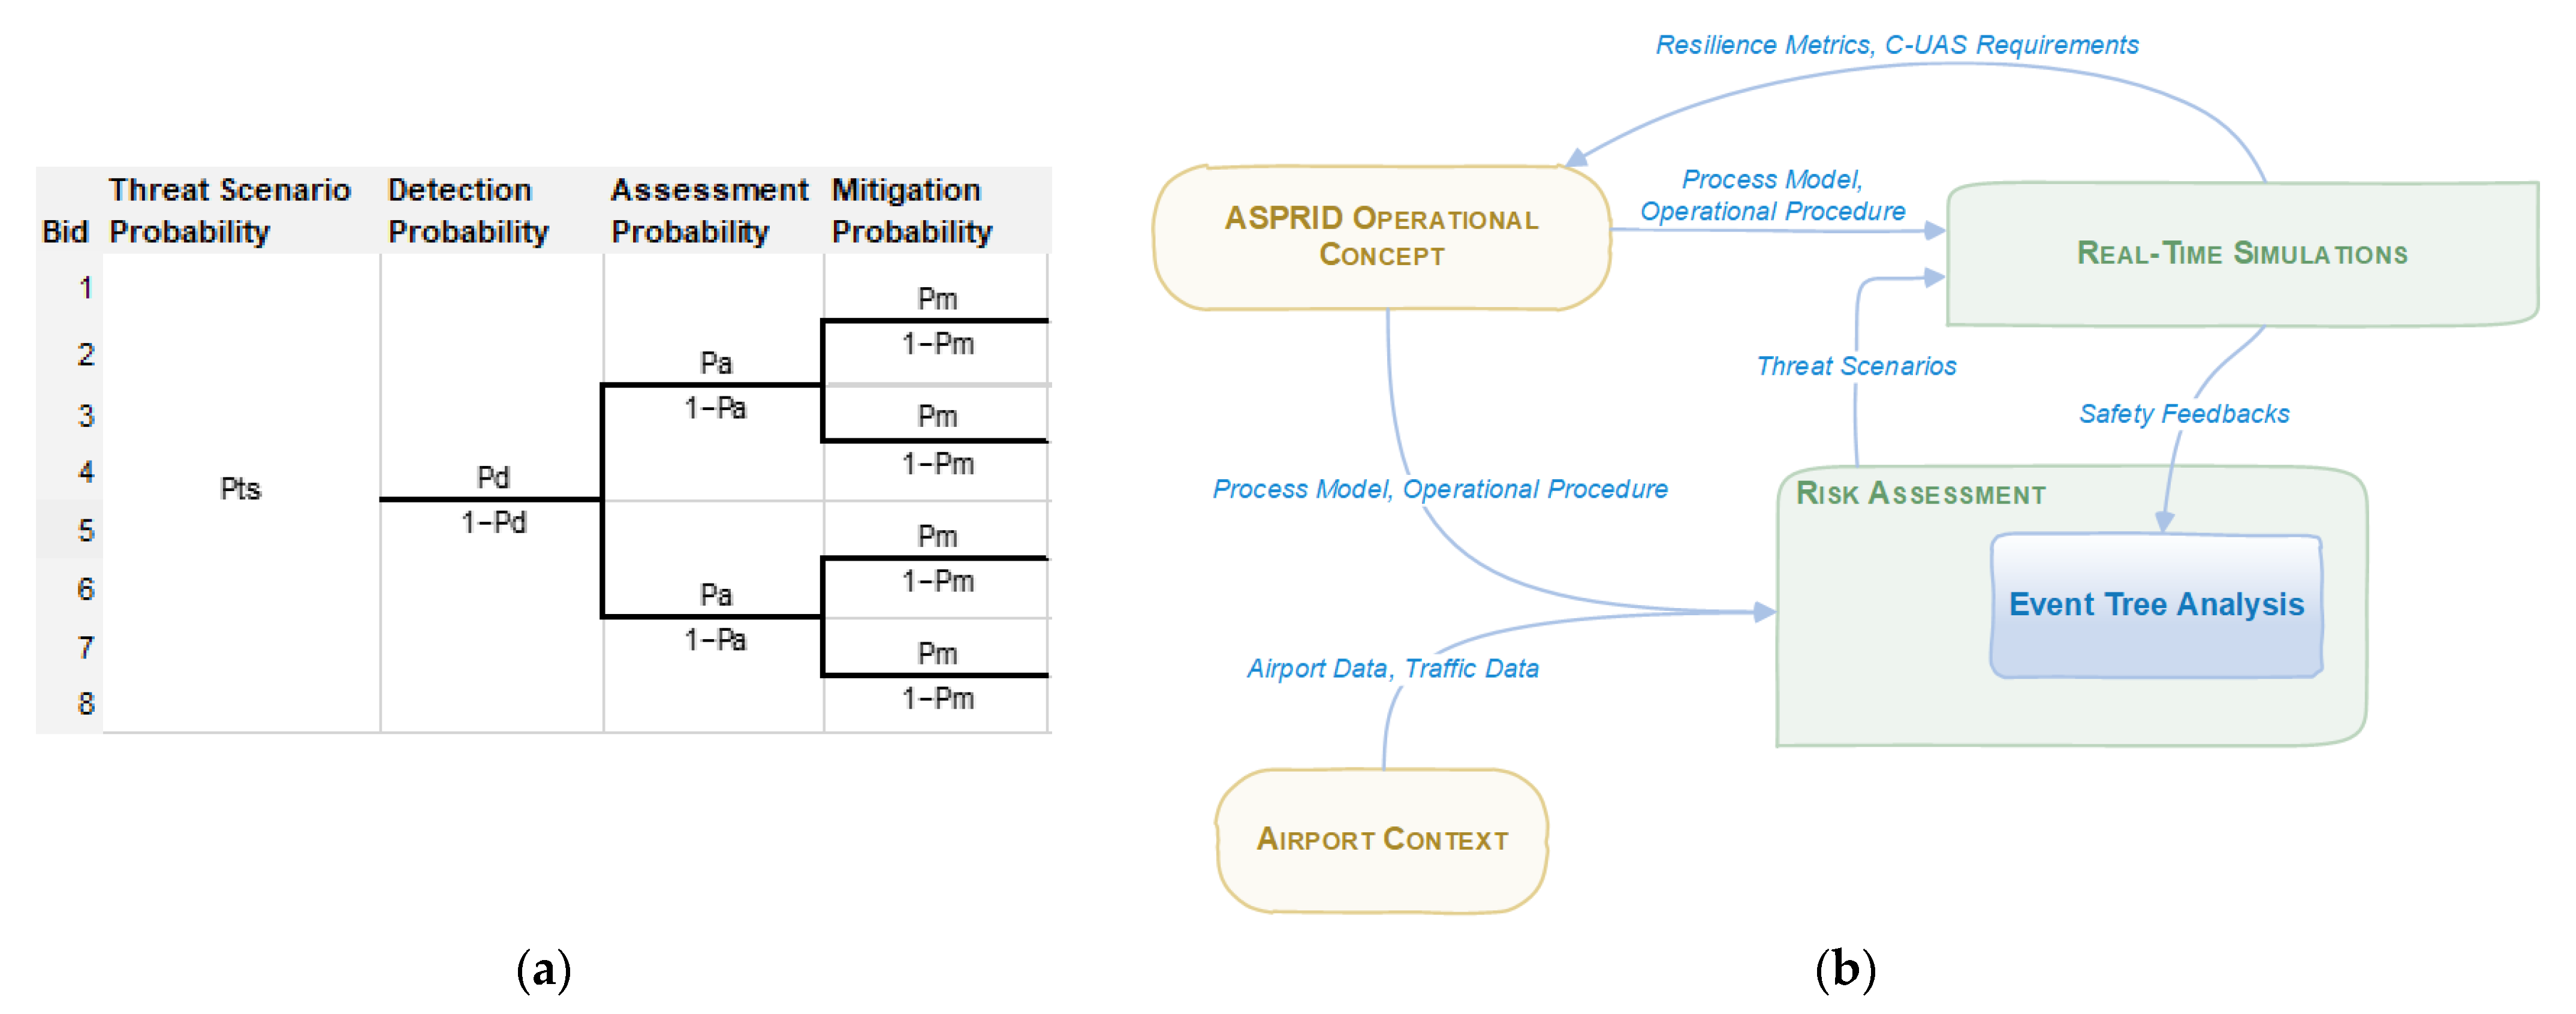
4.1. Approach
- , the probability of the threat scenario;
- , the probability of efficient drone detection;
- , the probability of efficient drone assessment (i.e., identification);
- , the probability of efficient drone mitigation (i.e., neutralization).
4.2. Real-Time Simulations
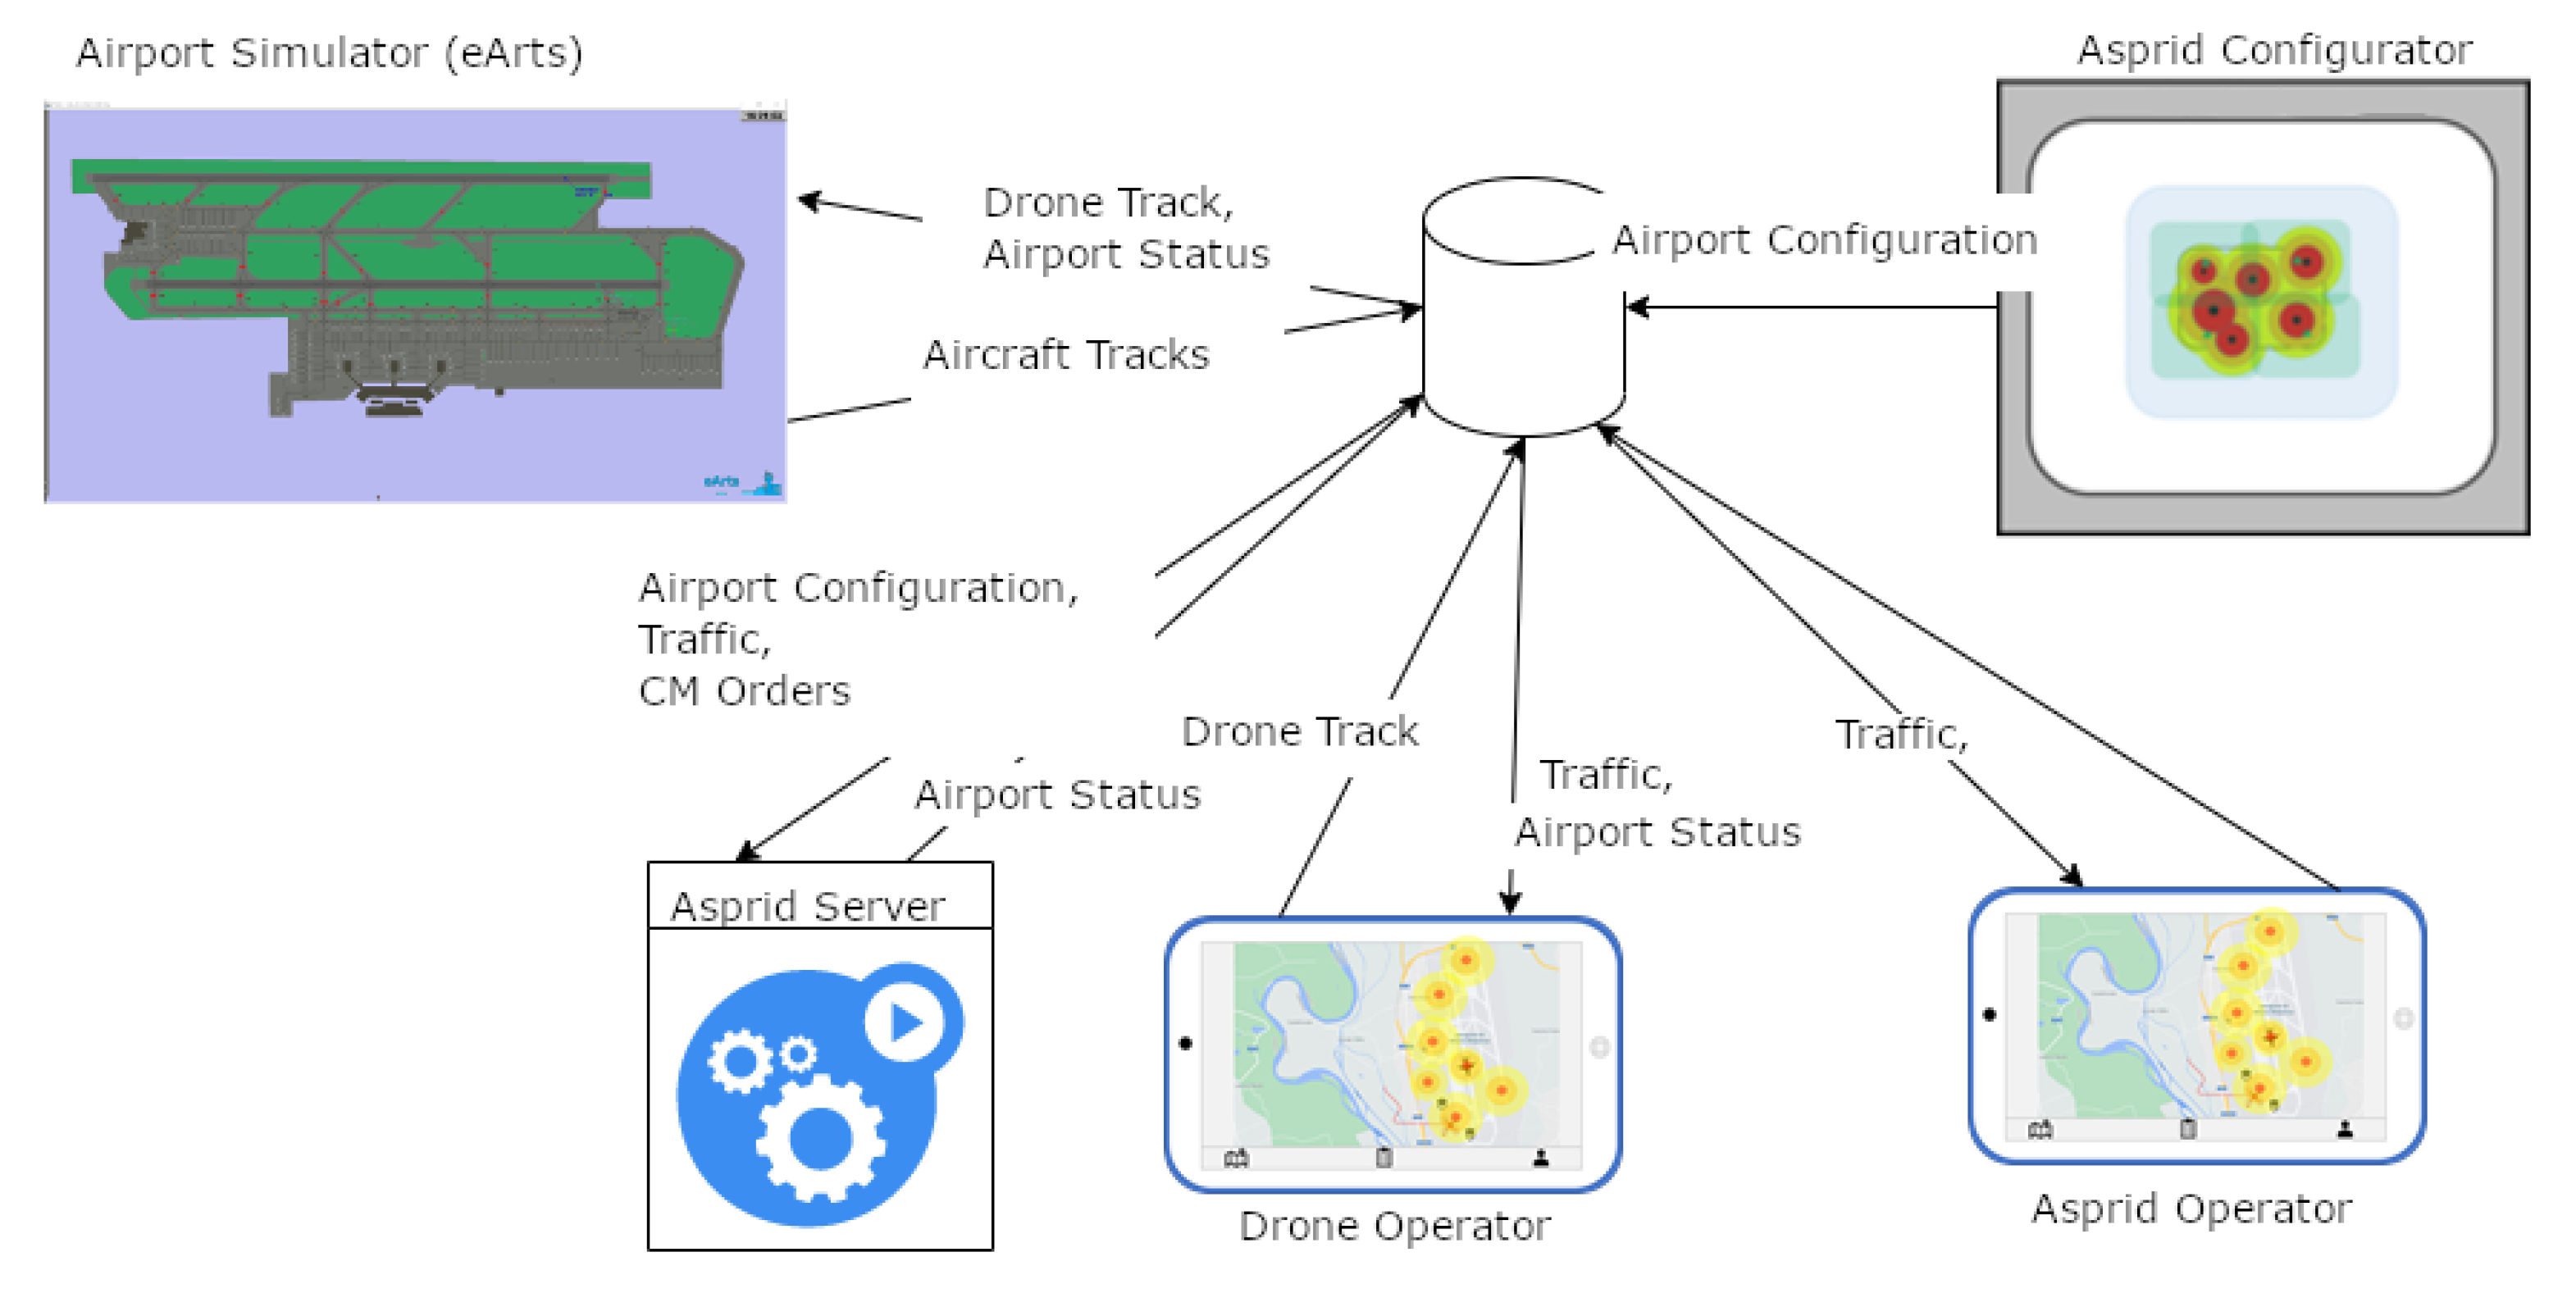
4.2.1. Simulation Platform
- ASPRID server—This is a backend that simulates the ASPRID system. It receives the configuration of the ASPRID system, the drone tracks, the traffic tracks, and the countermeasure commands. It estimates the state of the airport related to the threat, delivering the outputs of the ASPRID system, i.e., the information about the detection and tracking, identification, and neutralization of the intruder. It was developed in TypeScript and it runs on the Node.js runtime environment.
- ASPRID configurator—This is the tool in charge of the configuration of the ASPRID system. It allows: (i) the tagging of the critical assets in the available airport and specification of the related alert zones; (ii) the locating of the sensing and countermeasure units and specification of their characteristics. It has been developed in TypeScript.
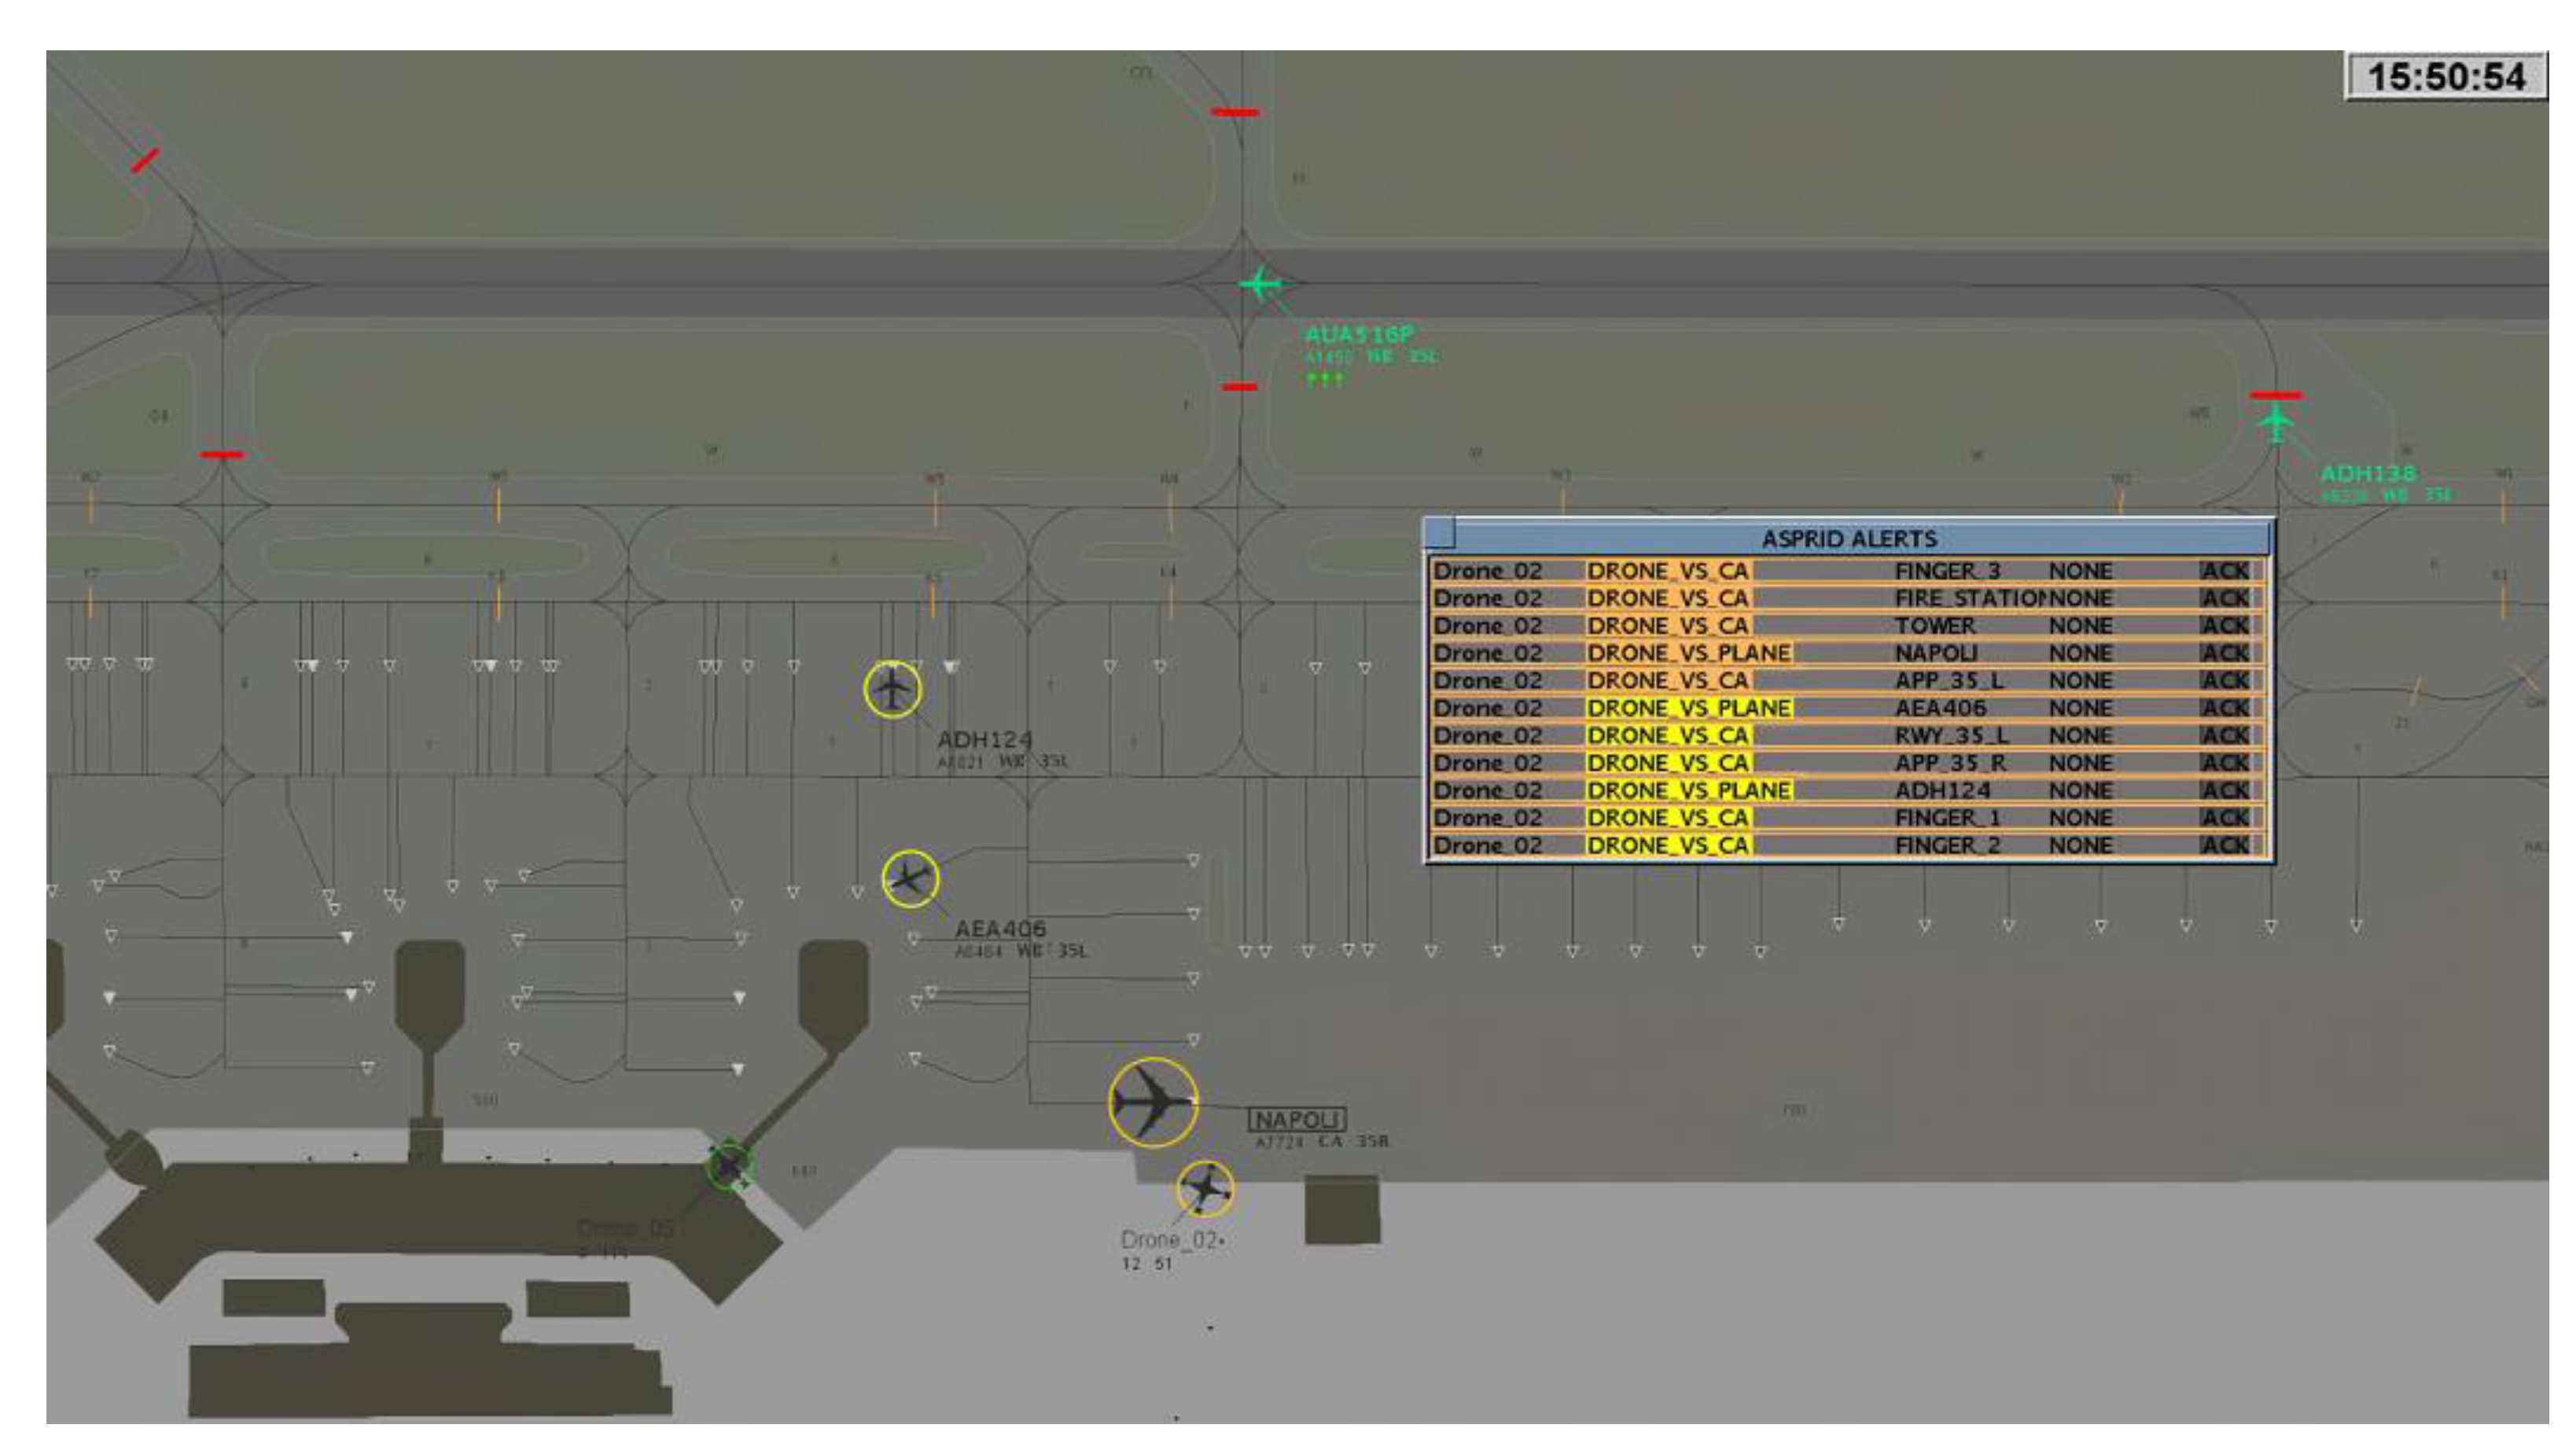
- eArts (en-route aerodrome real-time simulator)—This is a real-time simulator of aerodrome, en-route, and approach operations [32]. It can reproduce the controller working positions (CWPs) for the different roles of ATCOs and for aircraft pseudo-pilots (Figure 9). It was developed in the JAVA and Kotlin programming languages. Based on the outcomes of the ASPRID server, eArts CWPs are used to show: aircraft and drone tracks on the map; drone identification data; and alert information.
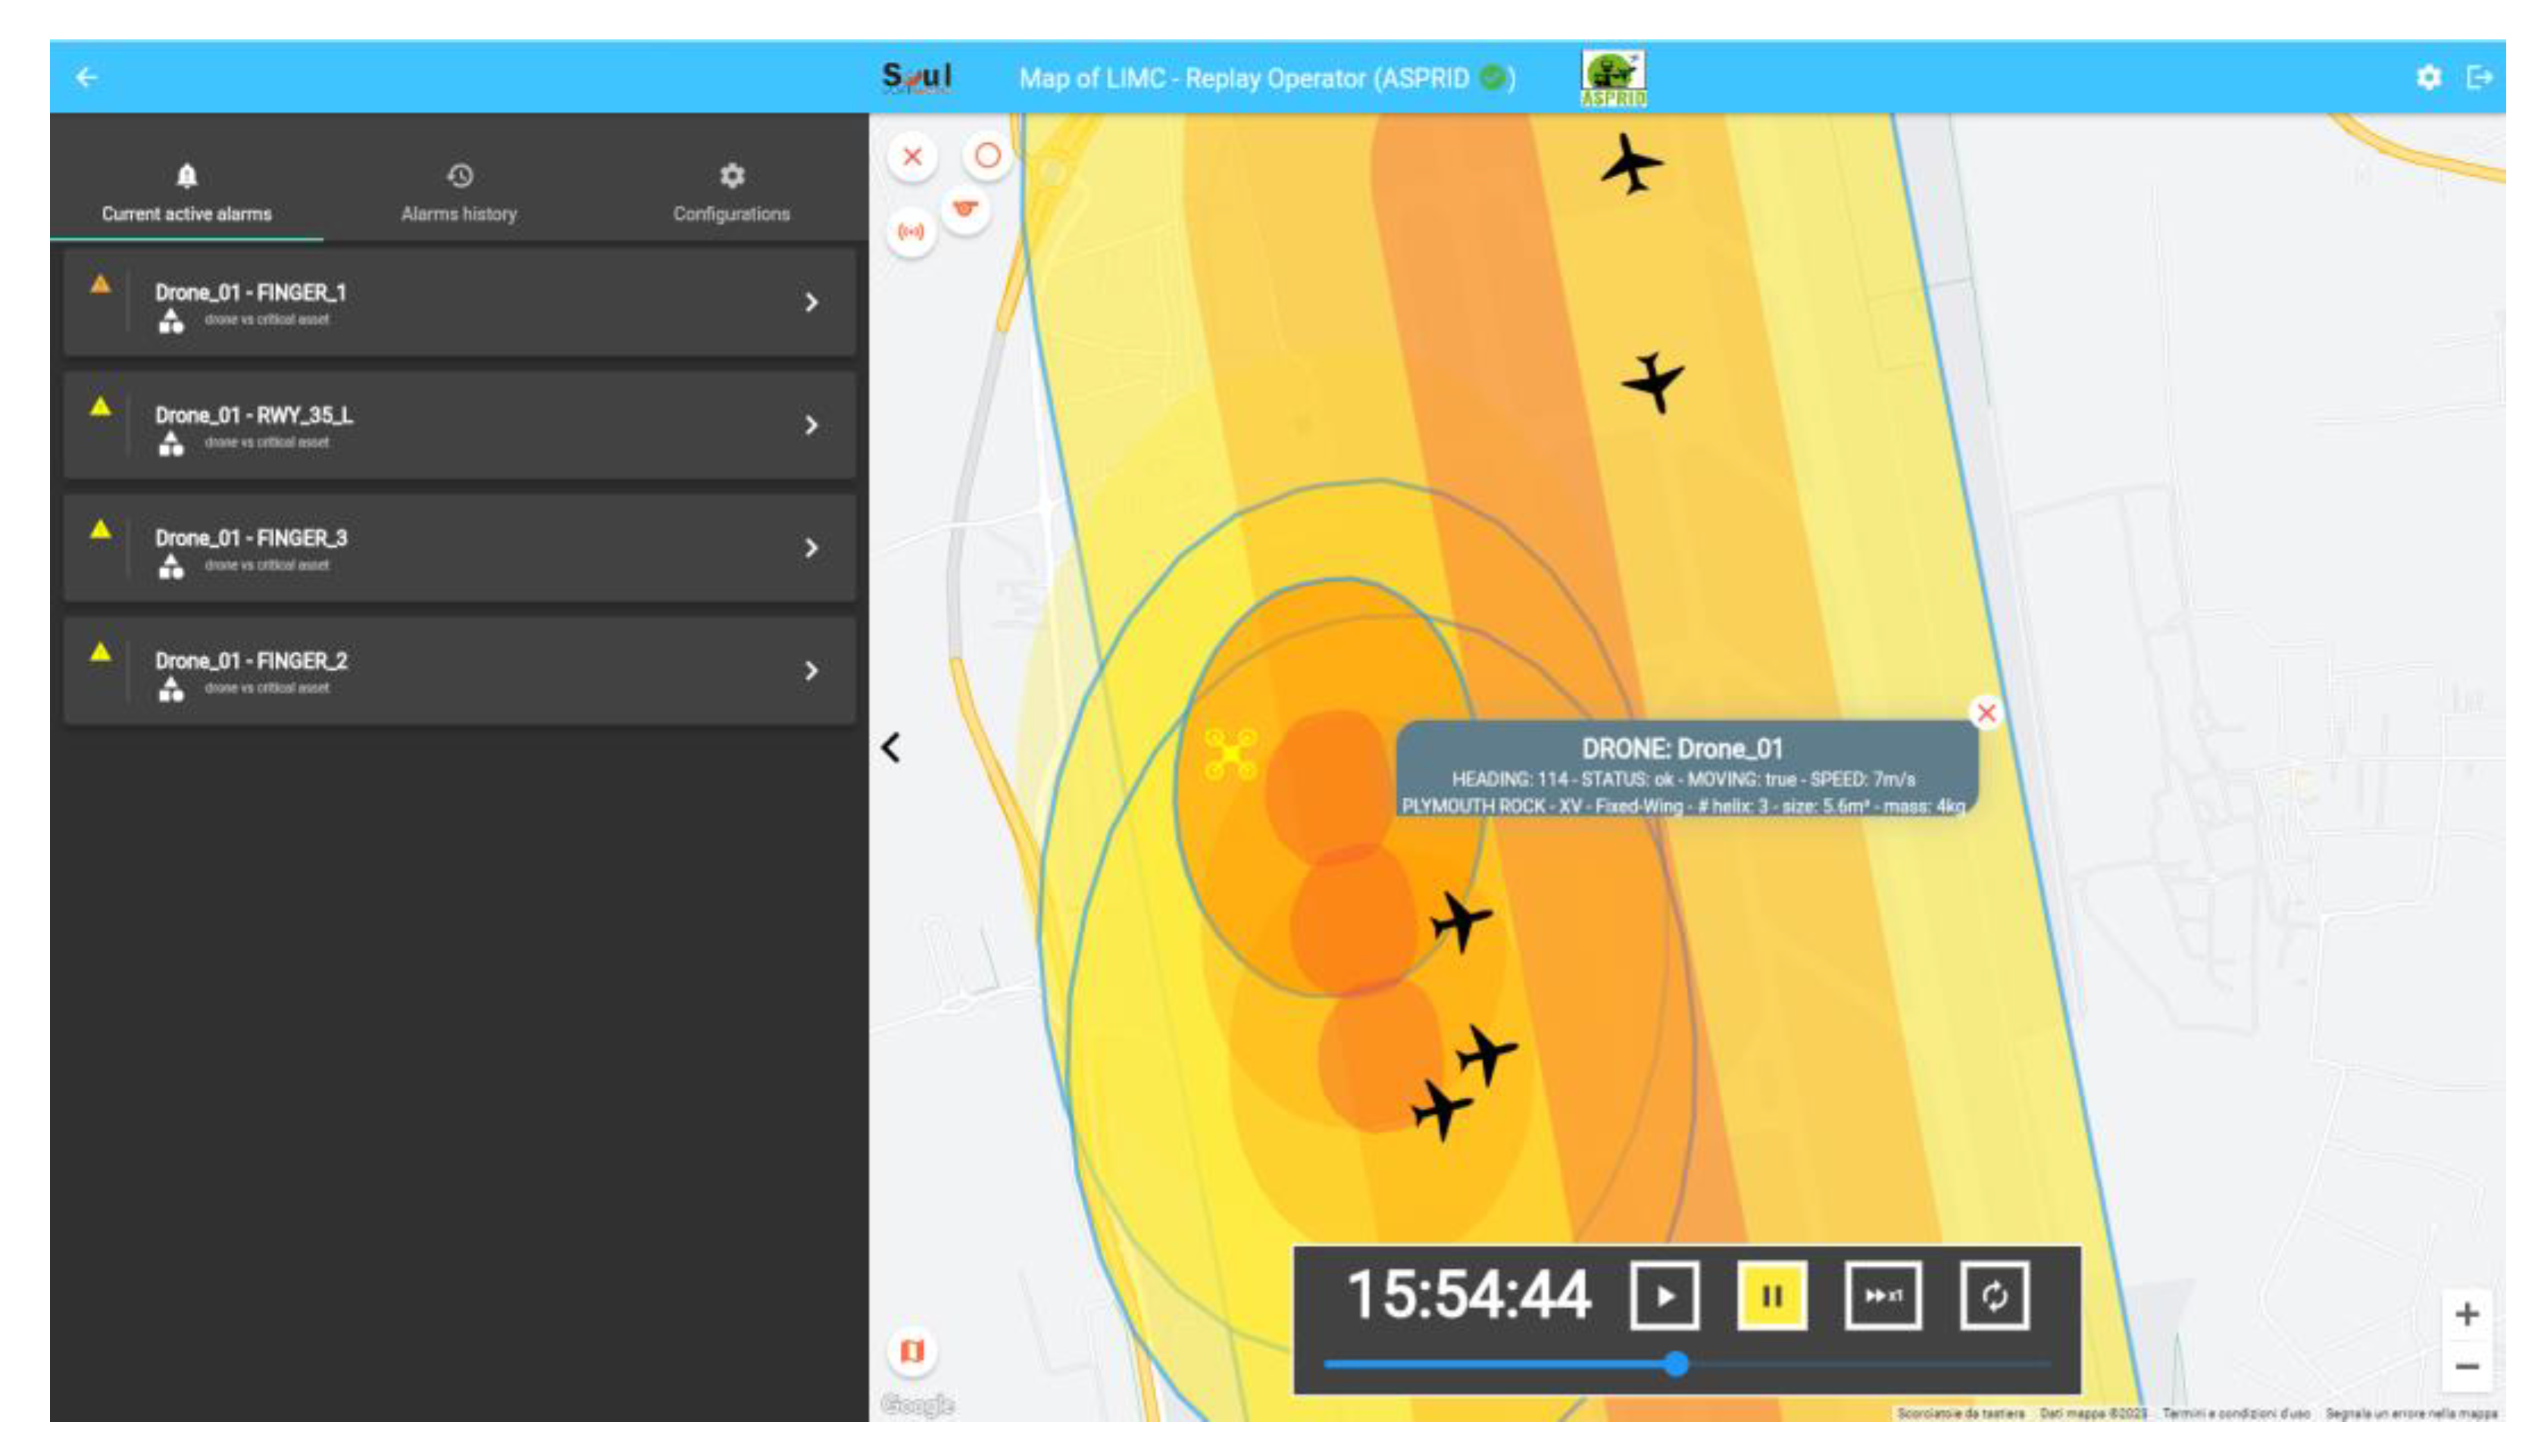
- ASPRID web app—This is a frontend for the interaction with different classes of users, such as (Figure 10): ASPRID’s operator; a human viewer (described in Section 4.2.3); a drone operator (i.e., the user who selects the trajectory and the features of the intruder drone); an LEA operator; etc. The ASPRID operator uses this app to issue neutralization commands within a simulation run. The web app was developed with the Flutter/Dart language. A demo web app is publicly available to replay some simulation exercises [33].
4.2.2. Simulation Scenarios
- The solution-scenario class, which is composed of simulation scenarios reproducing a given environment with the implementation of the operational improvement (i.e., the proposed operational concept) that is the subject of evaluation;
- The reference-scenario class, which is composed of simulation scenarios reproducing the same environment as a solution scenario without the implementation of the operational improvement that is the subject of evaluation.
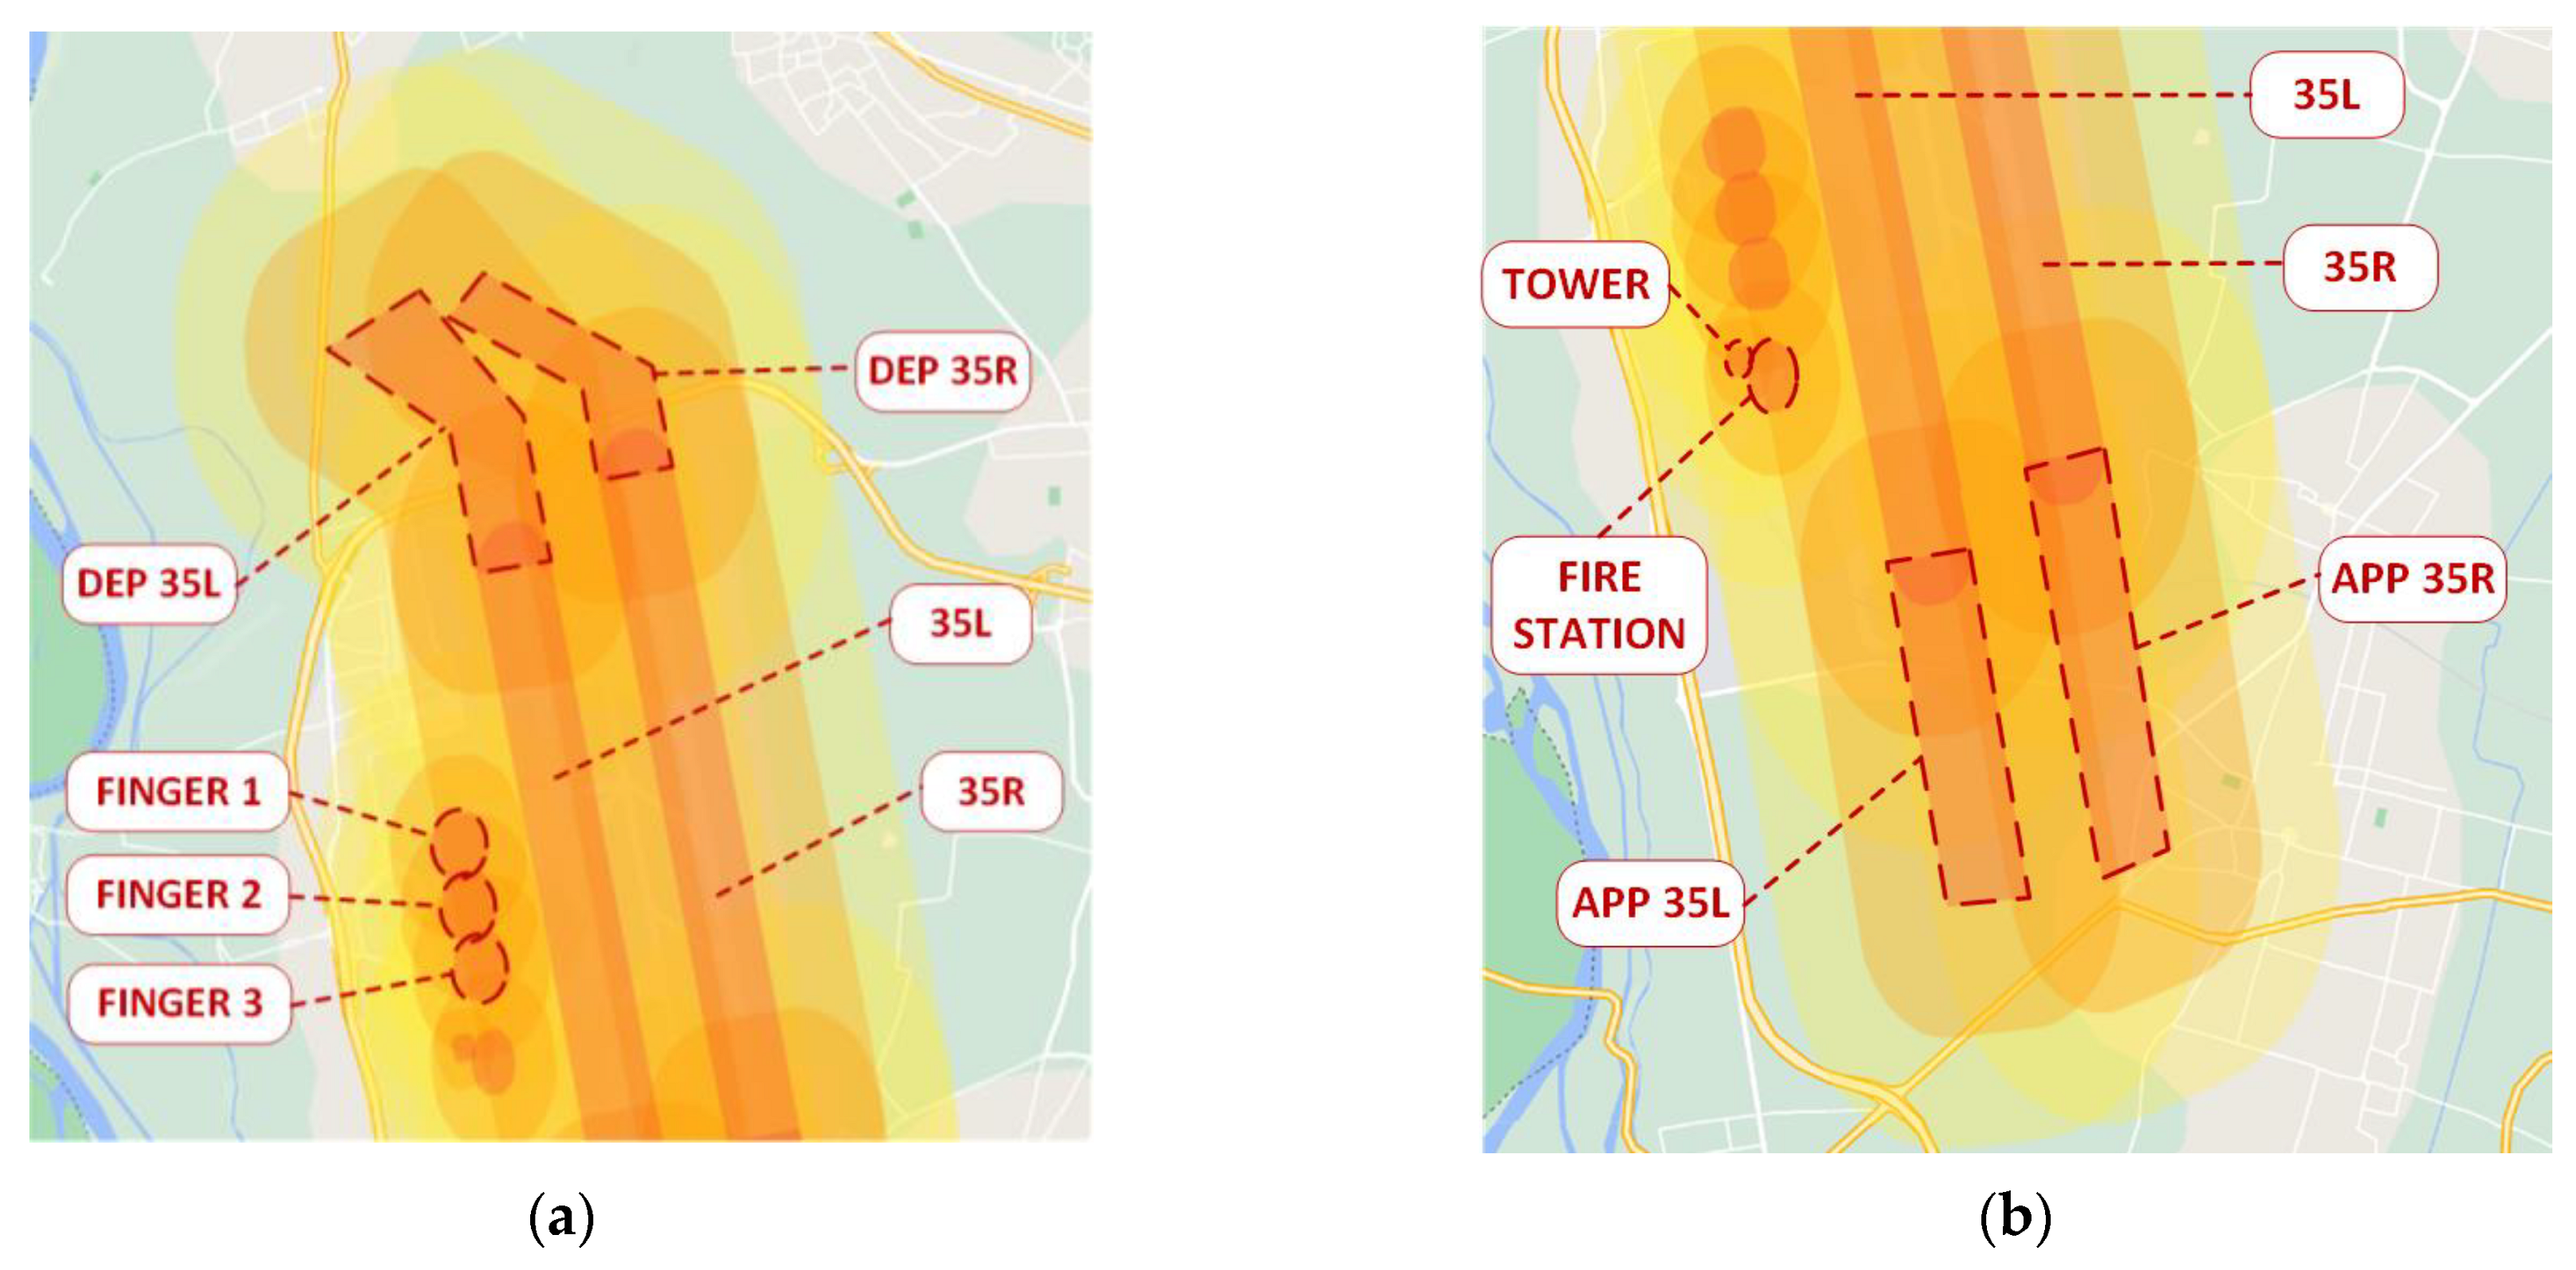
4.2.3. Operational Environment
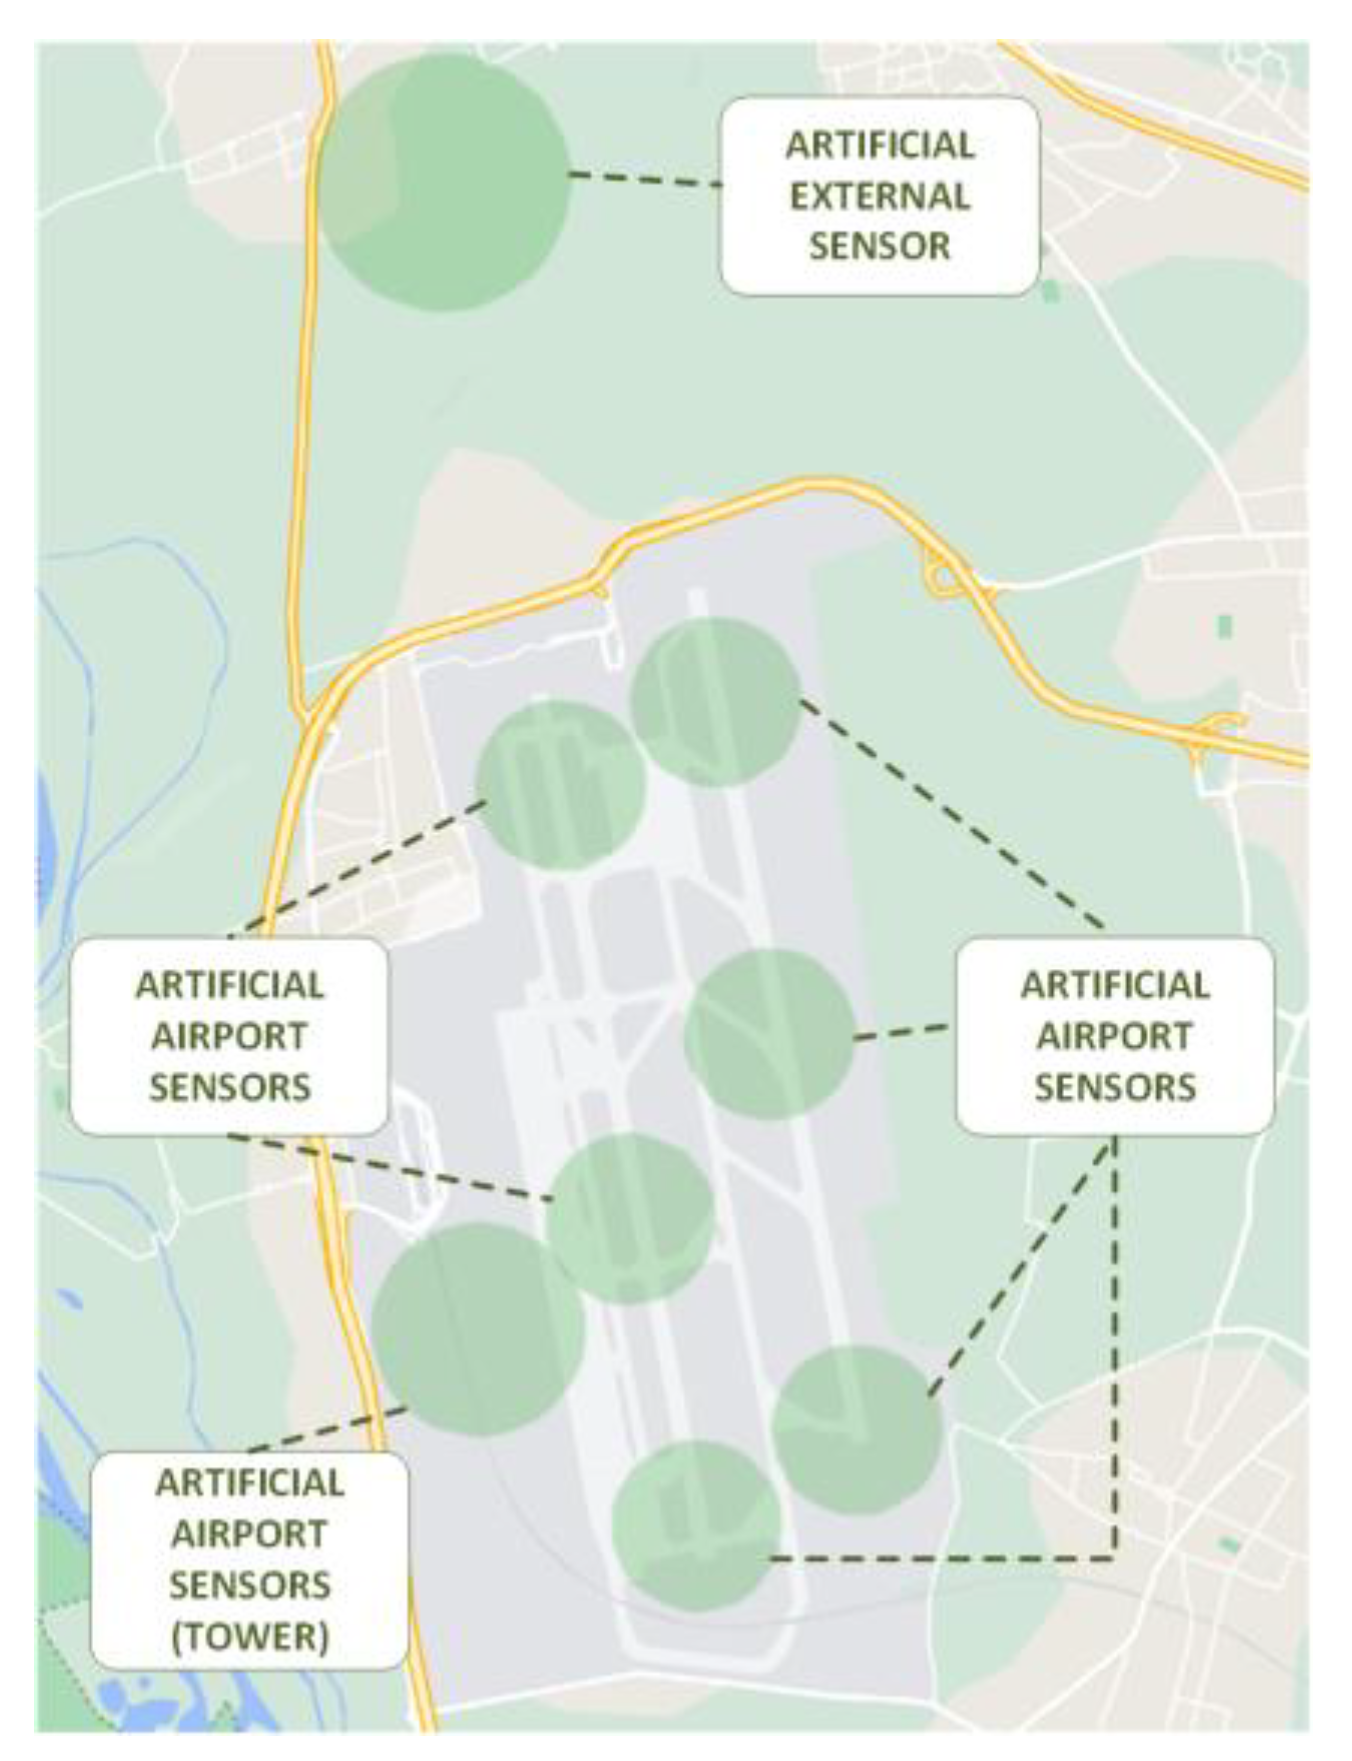
- Artificial airport sensors—They are displaced within the airport perimeter. They also include an artificial tower sensor, related to ATCOs in the tower.
- Artificial external sensors—They are displaced outside the airport perimeter. They simulate the human sighting of drones from the outside (e.g., from aircraft pilots).
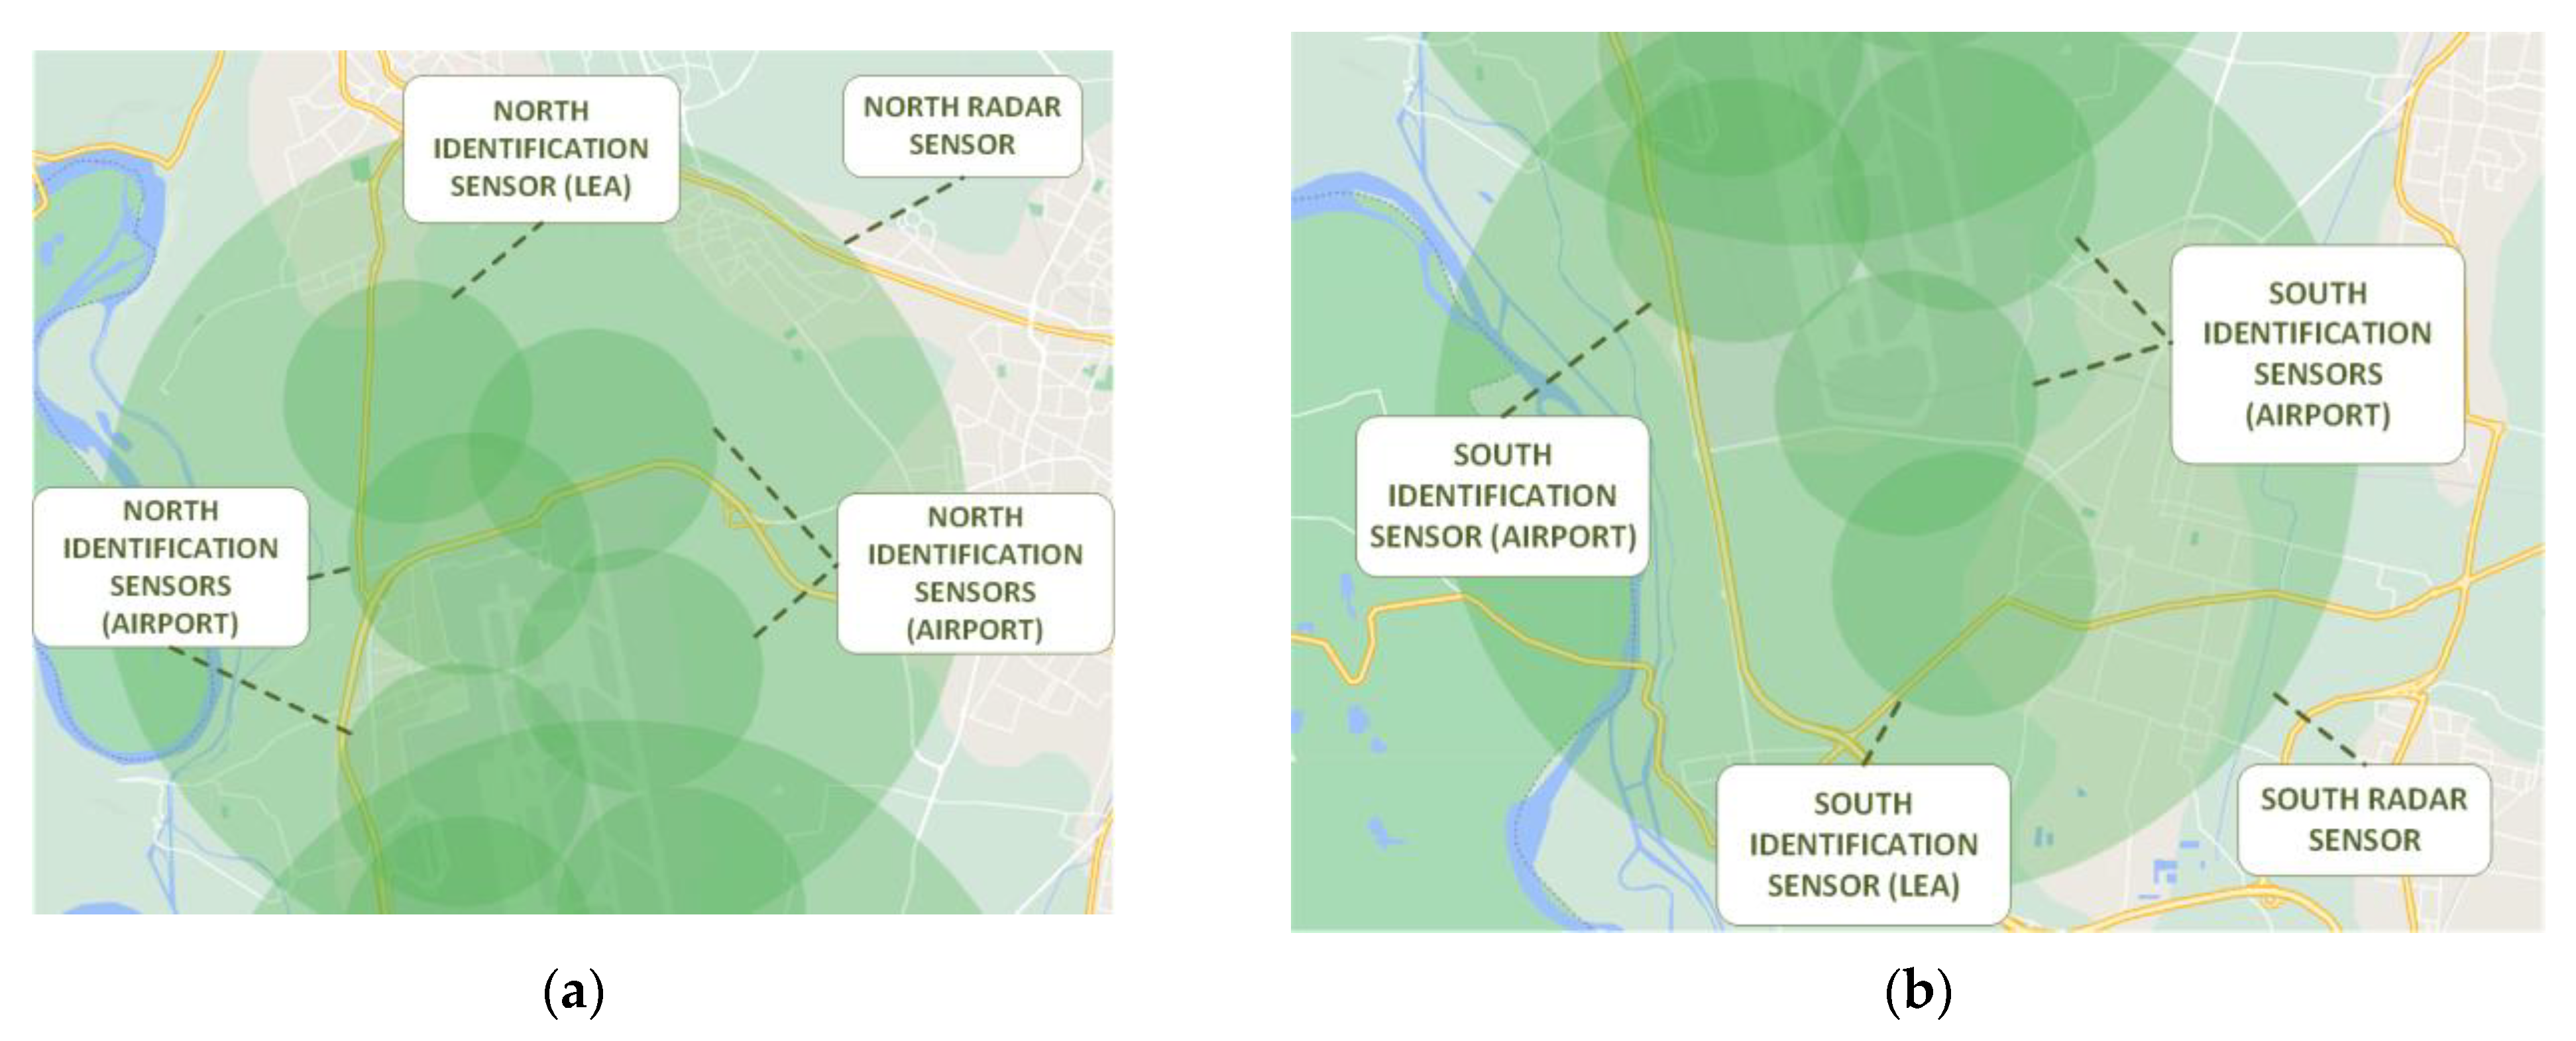
- Radar sensors—They simulate the detection-and-tracking capabilities by means of radars. They are able to detect and track the radar signature of an object, but they are not able to identify its nature. Thus, radars detect and track unknown objects, but they cannot confirm whether the object is a real unauthorized drone.
- Identification sensors—They simulate the detection-and-tracking capabilities by means of specific sensors (e.g., optical sensors, acoustic sensors, infrared sensors, etc.), which may also provide identification. They are able to: detect and track an object; confirm whether it is an unauthorized drone; recognize the model; provide an estimation of speed, mass, and payload. This class of sensors is divided into the following subclasses: (i) airport identification sensors, which represent identification sensors displaced within the airport perimeter; (ii) external identification sensors, which represent identification sensors displaced outside the airport perimeter, simulating the identification of drones by means of external support, such as LEAs.
- Each asset is associated with three alerting zones, i.e., yellow, orange, and red;
- The risk levels of the alert are in ascending order from yellow to orange and then to red, and consider the distance of the drone from the asset;
- The geometrical shape of an alerting zone may be any closed shape.
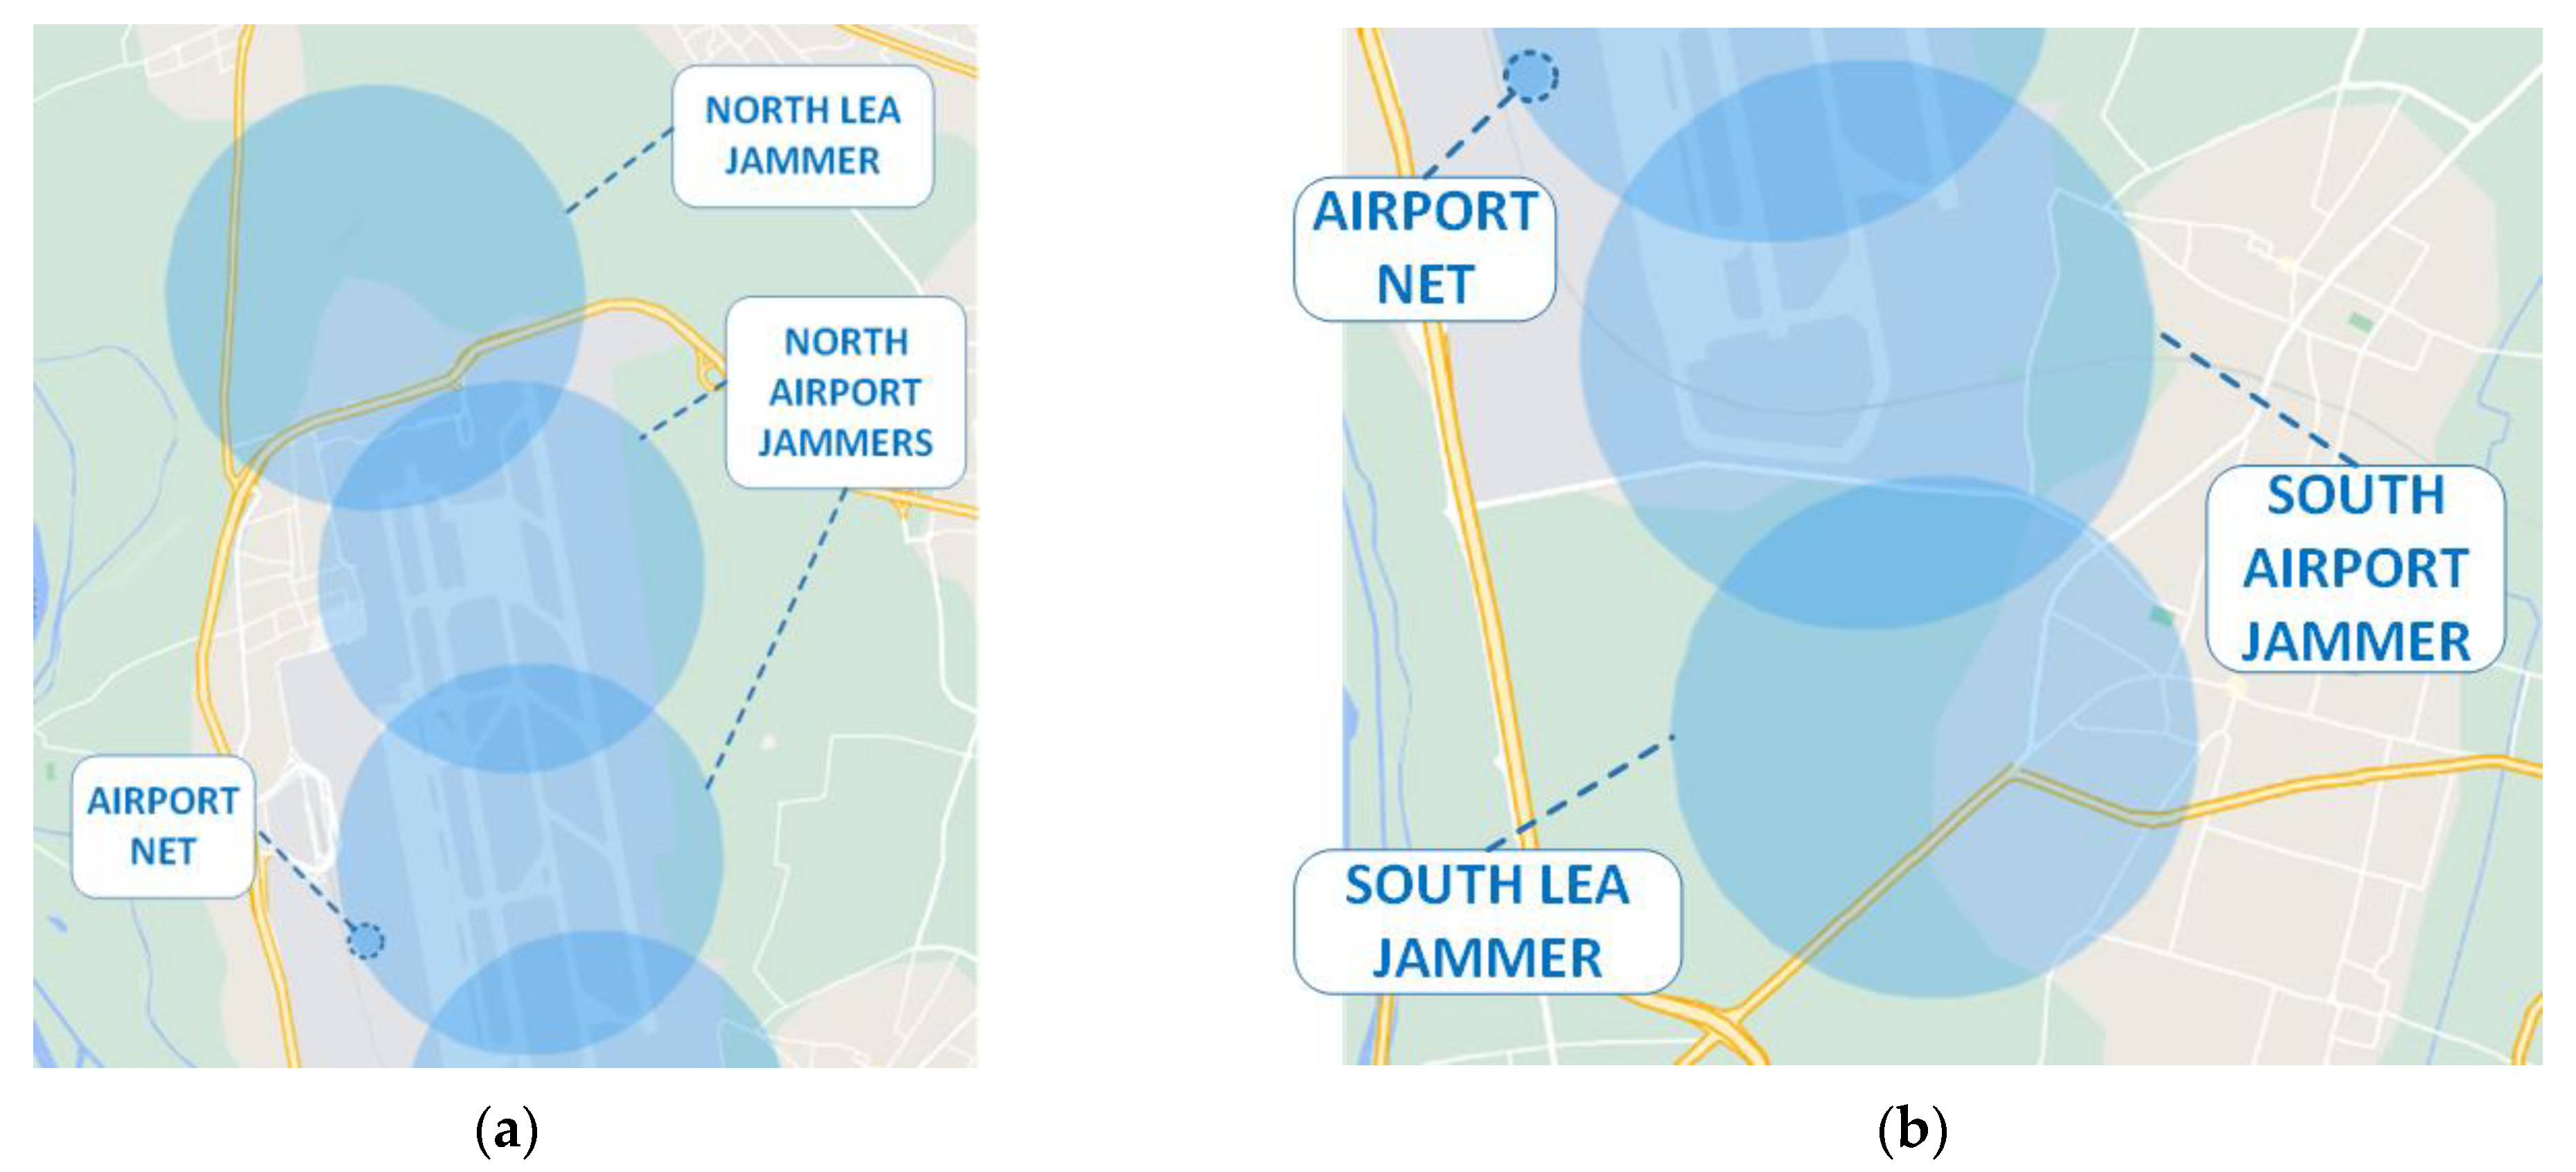
- Airport jammers (internal to the airport);
- LEA jammers (external to the airport);
- Airport net.
- In case of a drone sighting by a human viewer, this viewer informs the controller;
- The controller stops all ongoing operations and does not allow new aircraft to taxi from those available at the gates.
4.2.4. Threat Scenarios
- Start with a drone intrusion;
- Affect the operations of the airport and of its DIMS (if any);
- End with the consequences of an incident (i.e., collision with an airport’s asset) or with a safe termination of the intrusion (e.g., the exit of the drone from the airport and its surroundings, neutralization of the drone, etc.).
- The features of the intruder, e.g., in terms of trajectory, speed (also including constant-speed intrusion or variable-speed intrusion), drone type and related mass, etc.;
- The effectiveness of the sensing technologies of the DIMS, e.g., in terms of space coverage, accuracy, acquisition rate, success probability, dependency on meteorological conditions, etc.;
- The effectiveness of the neutralization technologies of the DIMS, e.g., in terms of technology (e.g., jamming, protection net, etc.), spatial coverage, latency, success probability, stationary/mobile type, dependency on meteorological conditions, collateral damages, etc.;
- The spatial displacement of the sensor and neutralization components;
- The type of airport traffic.

| Threat Scenario Class | Description | Instances |
|---|---|---|
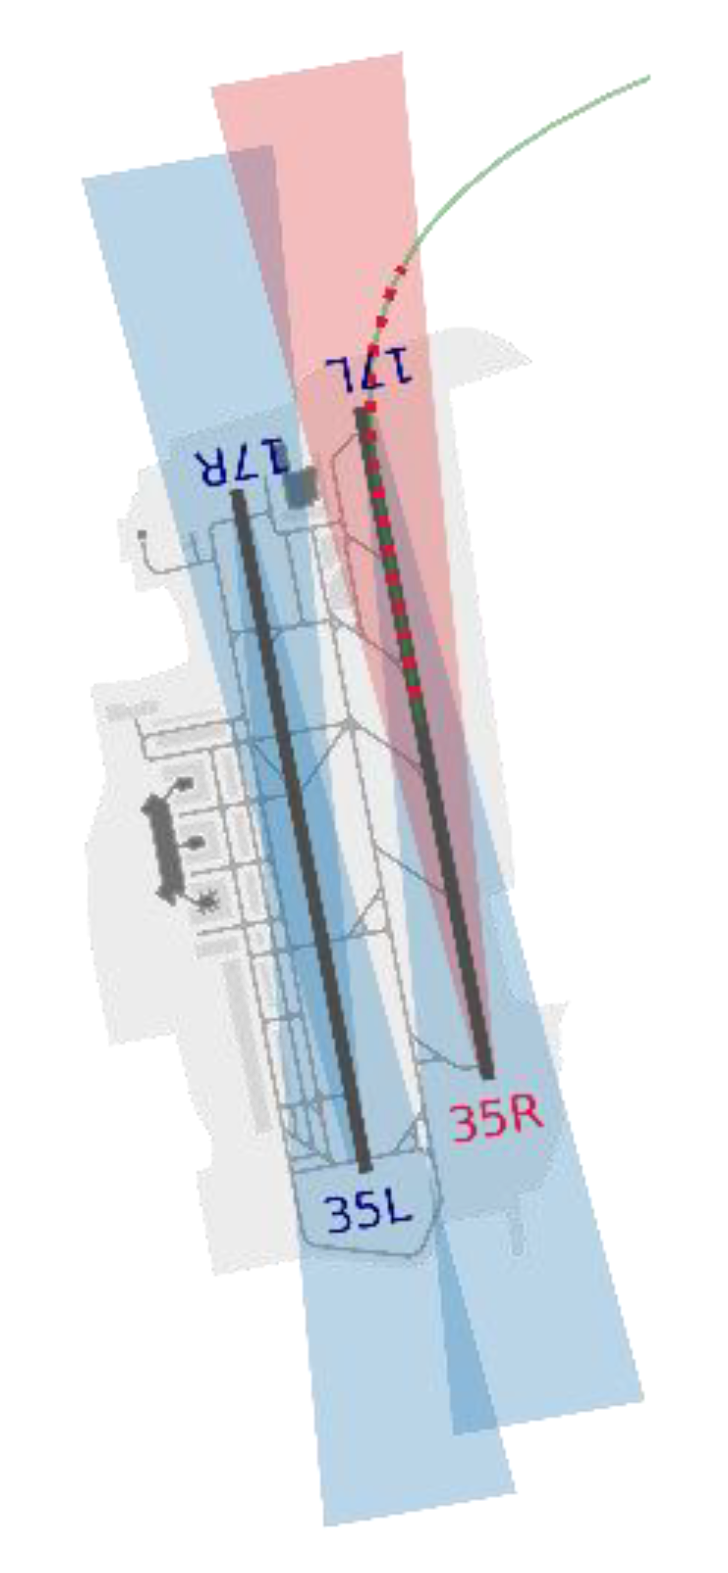
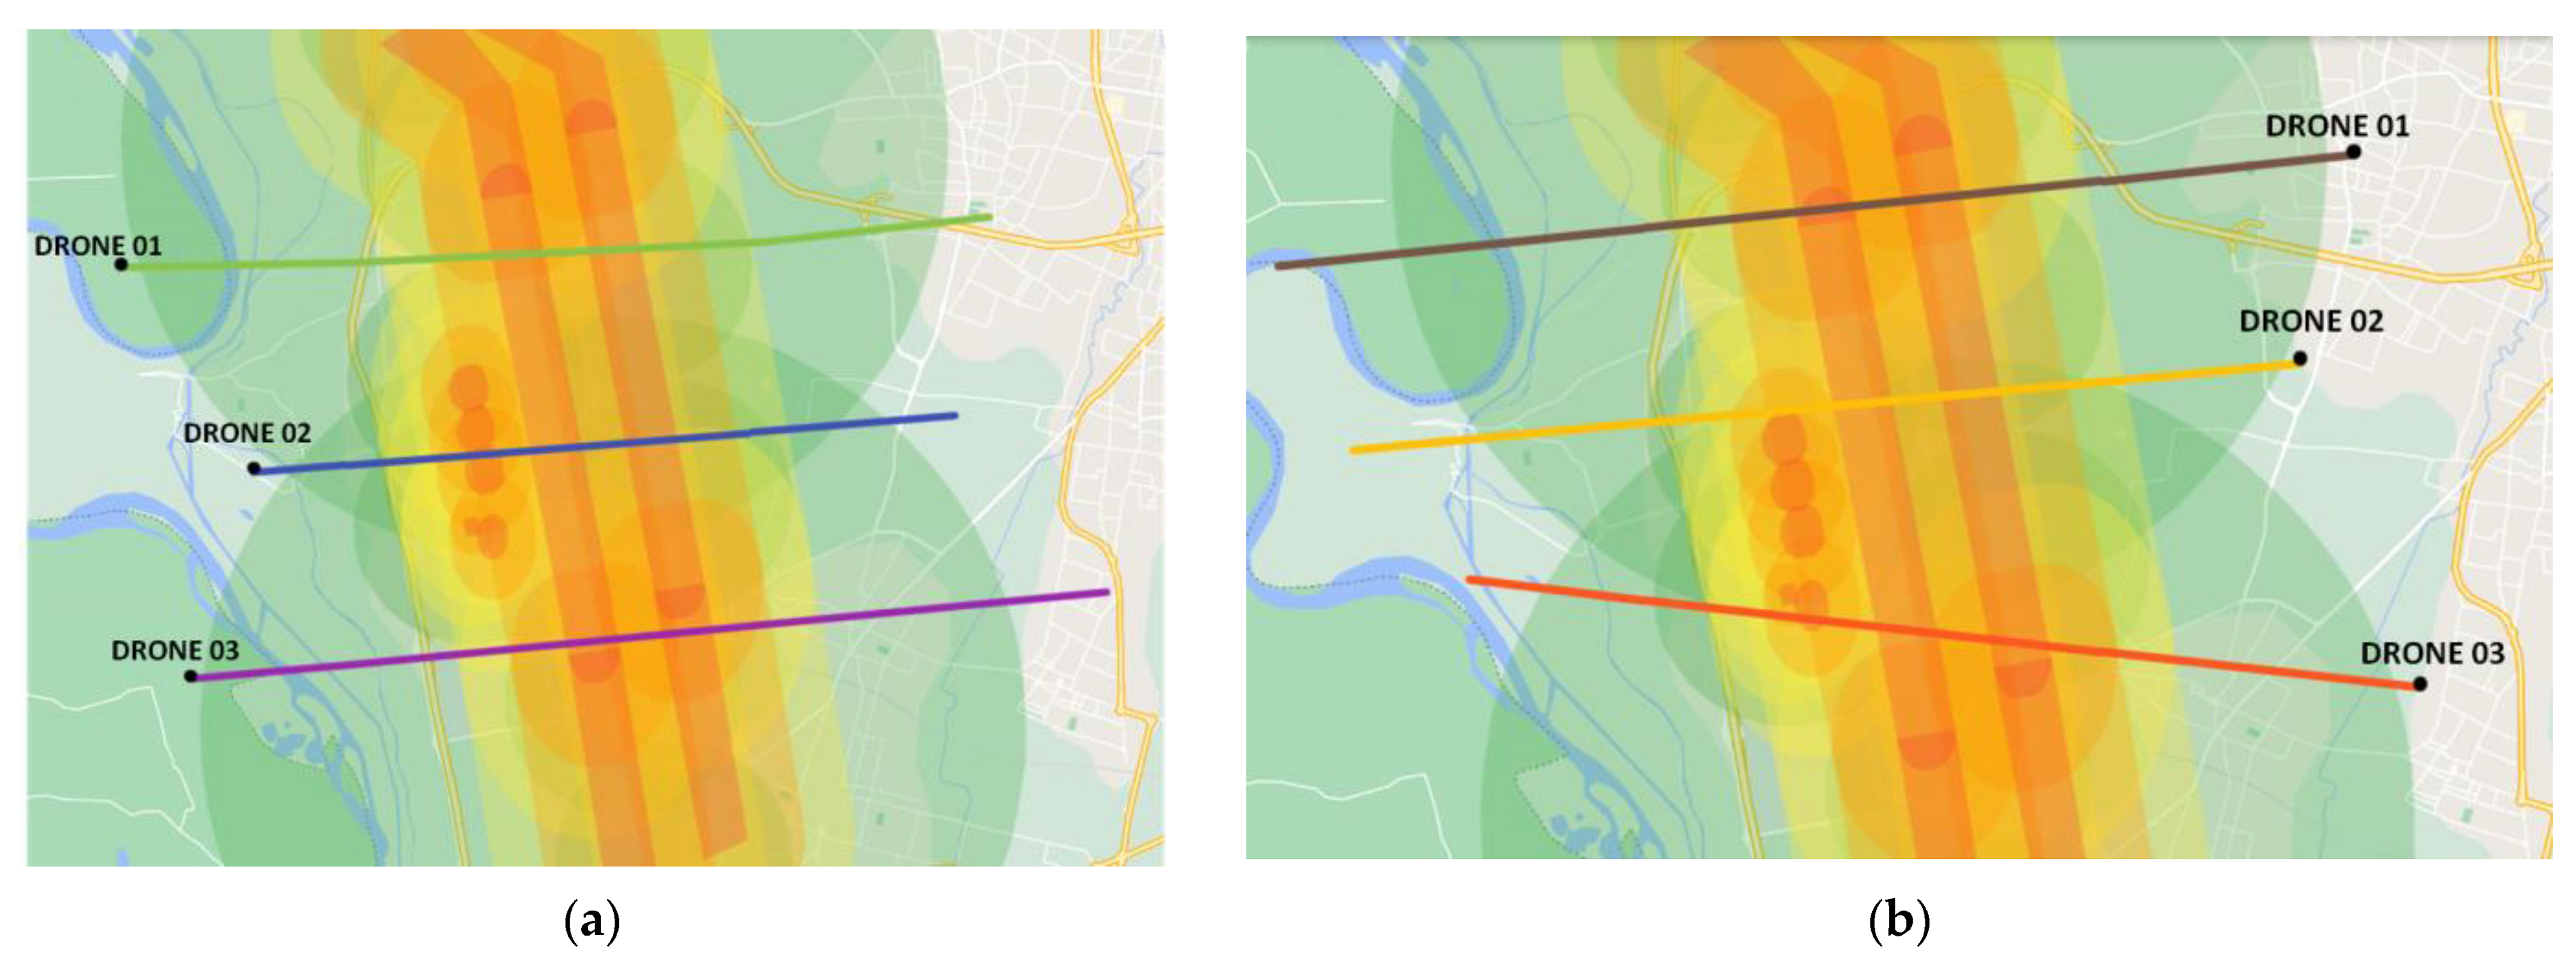
| Threat on 35L | This class includes intrusion trajectories representing direct threats to the runway 35L. | Drone 01—It affects the north part of 35L (Figure 15) |
| Drone 02—It affects the middle part of 35L (Figure 15) | ||
| Drone 03—It affects the south part of 35L (Figure 15) | ||
| Threat on 35R | This class includes intrusion trajectories representing direct threats to the runway 35R. | Drone 01—It affects the north part of 35R (Figure 15) |
| Drone 02—It affects the middle part of 35R Figure 15) | ||
| Drone 03—It affects the south part of 35R (Figure 15) | ||
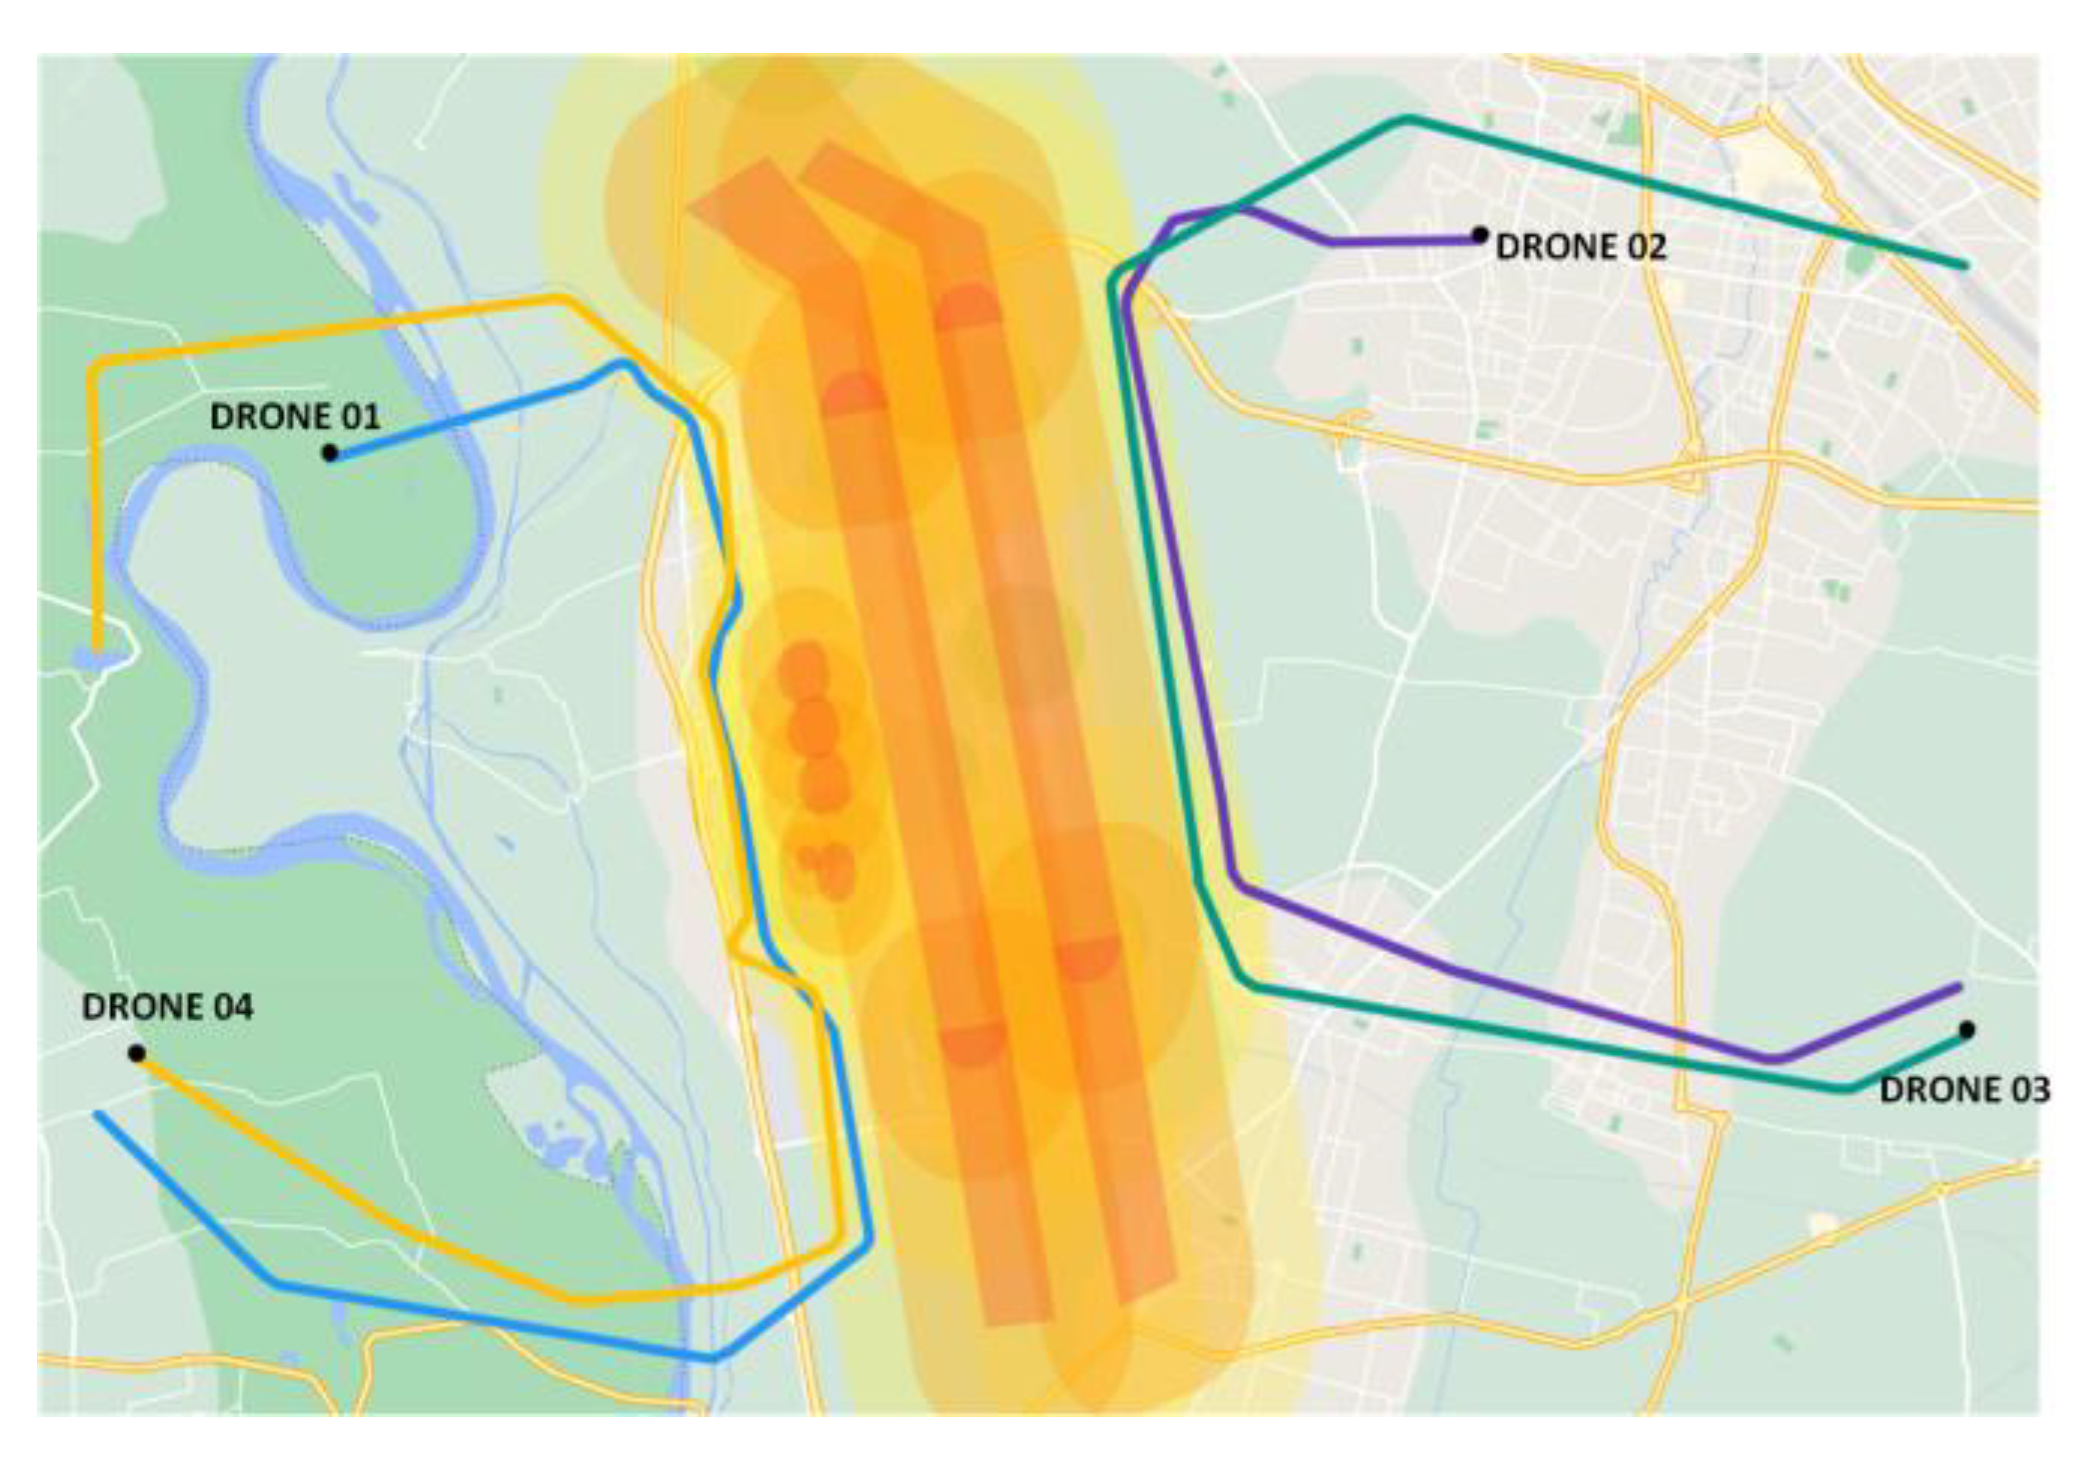
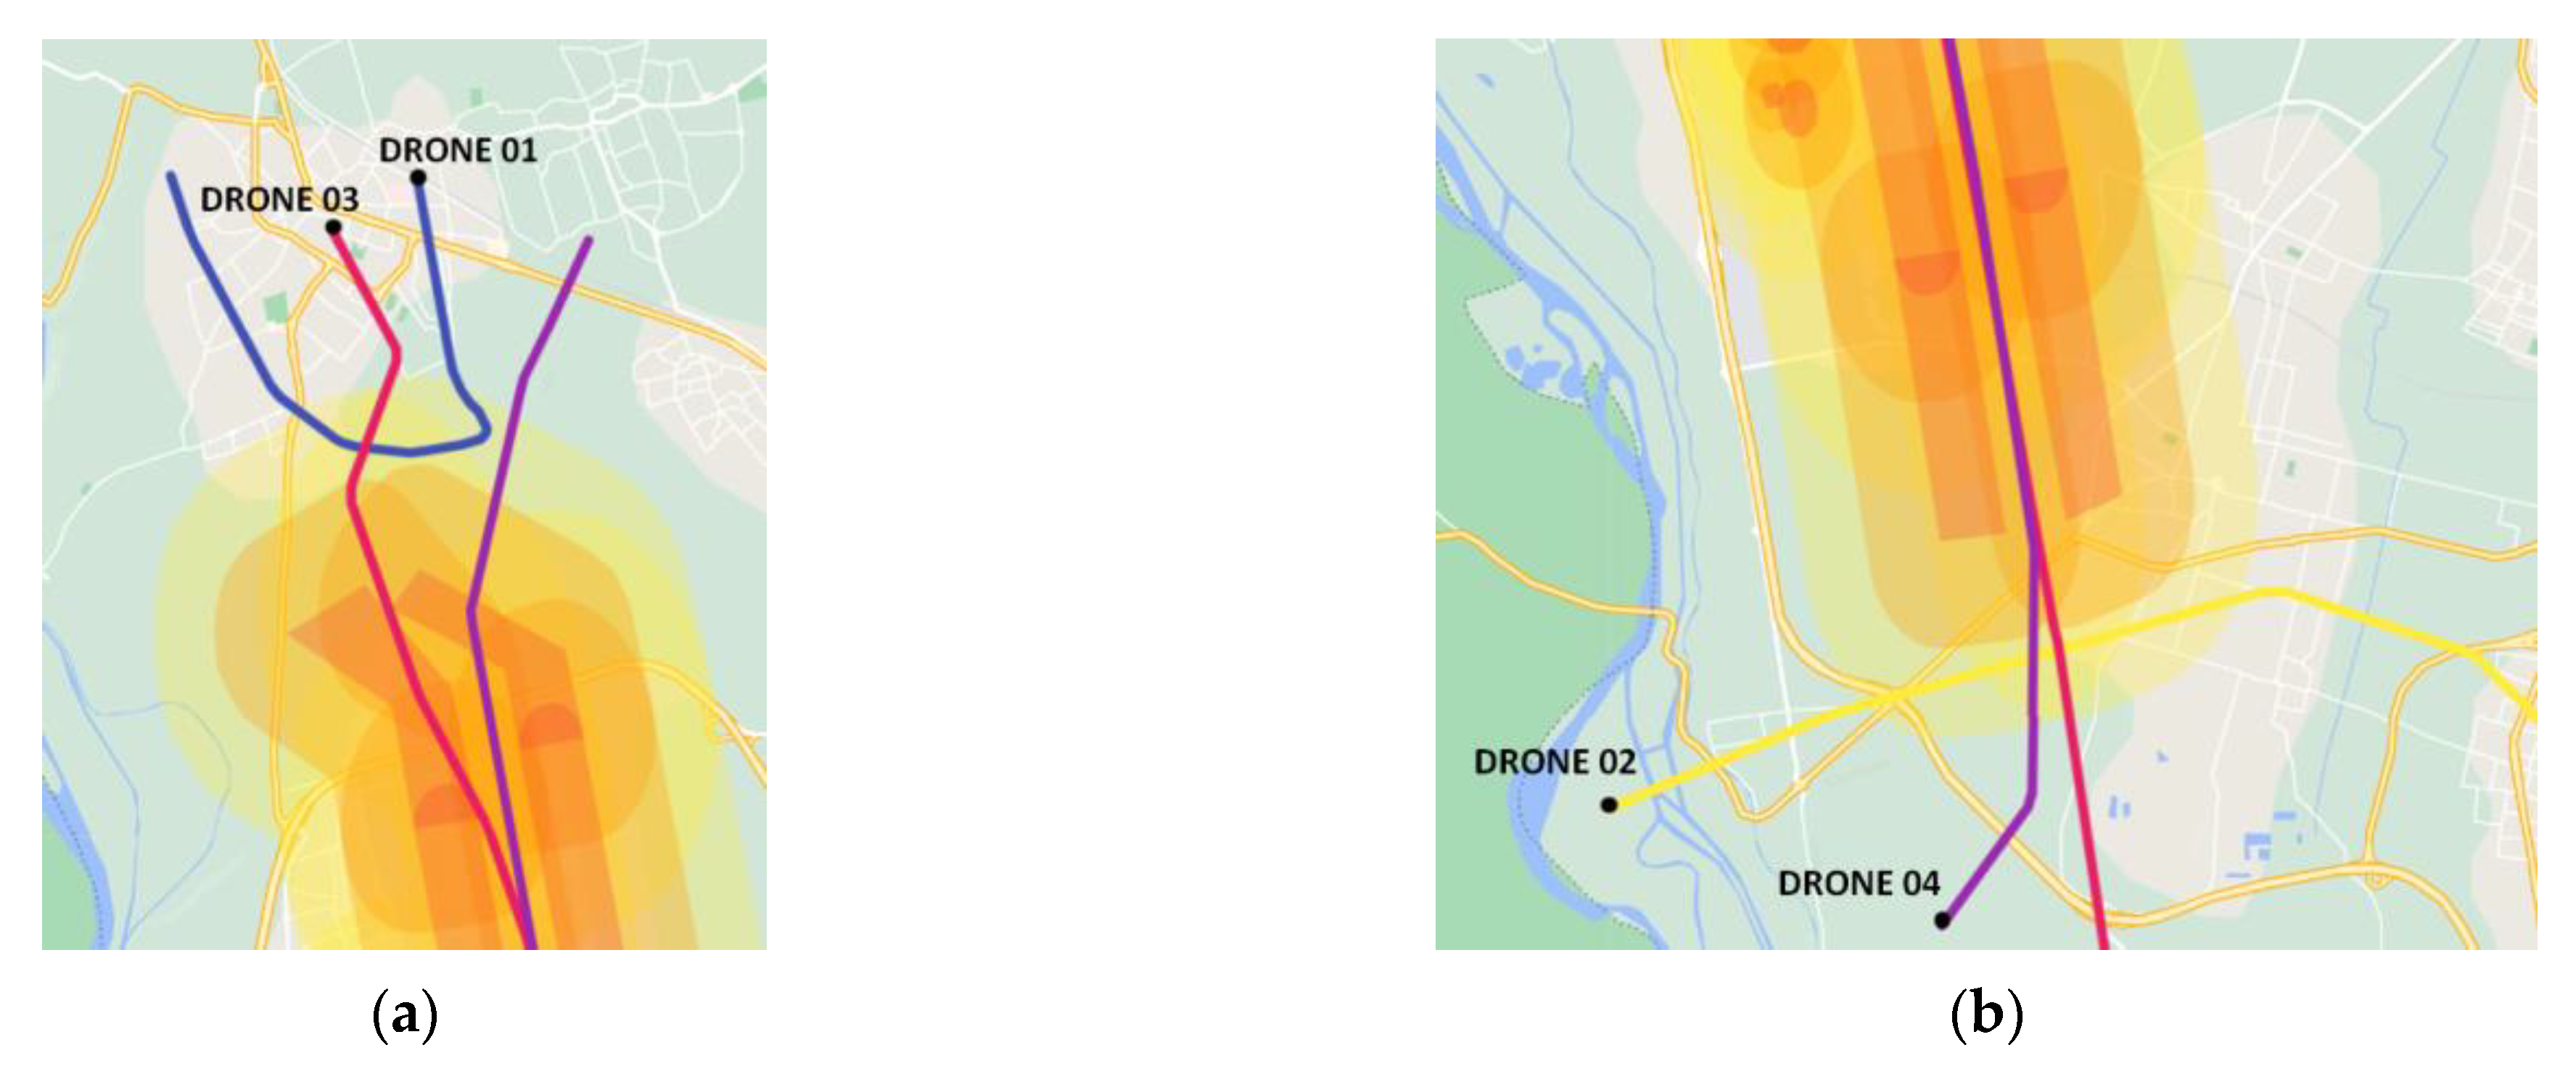
| Threat parallel to RWYs | This class includes intrusion trajectories representing direct threats running parallel to the runways. | Drone 01 and Drone 04—They affect 35L (Figure 16) |
| Drone 02 and Drone 03—They affect 35R (Figure 16) | ||
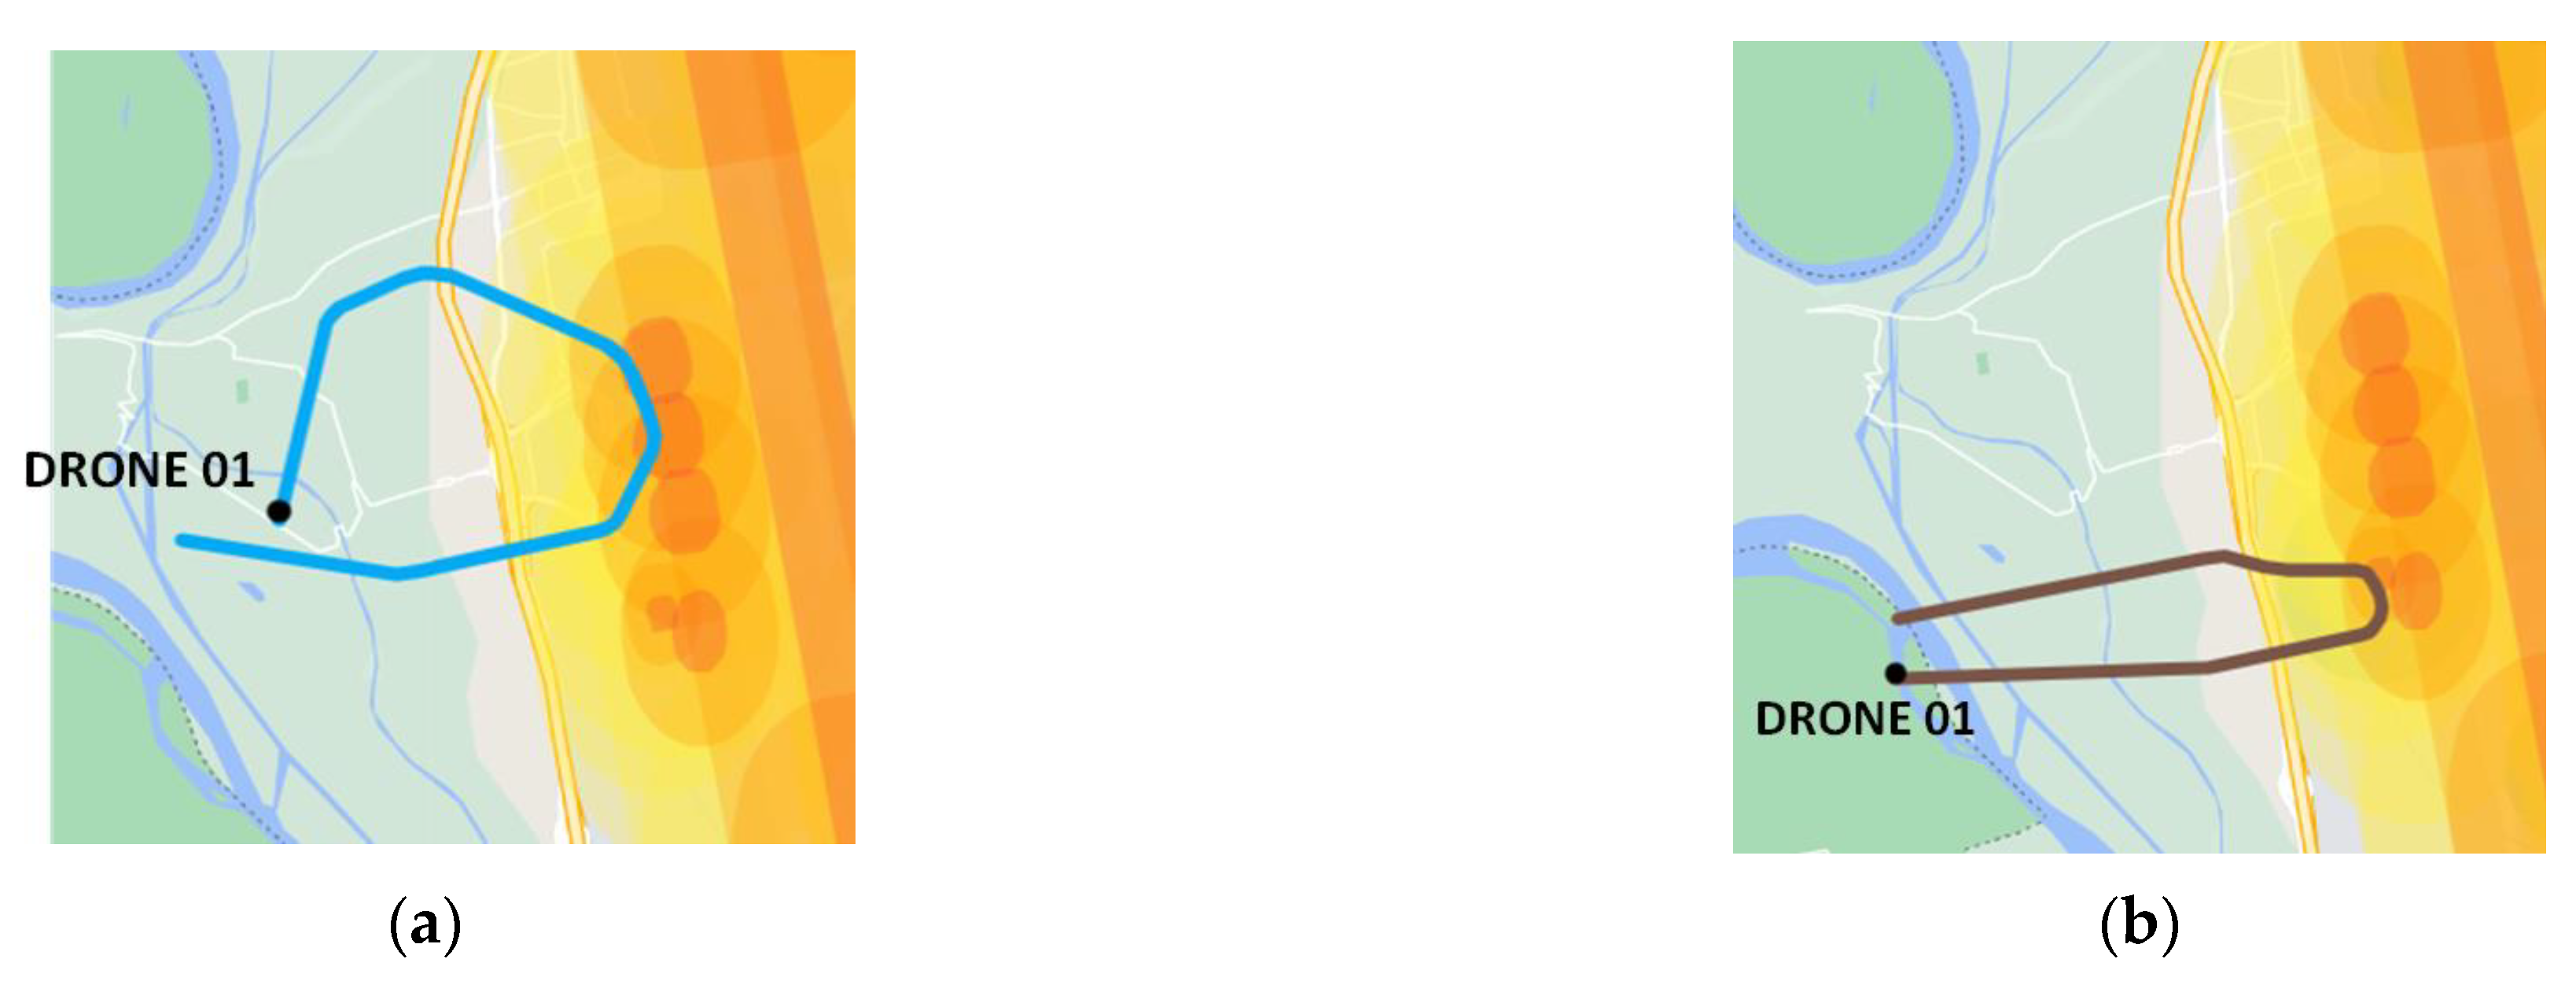
| Threat on fingers | This class includes intrusion trajectories representing direct threats to the fingers. | Drone 01 (Figure 17) |
| Threat on tower | This class includes intrusion trajectories representing direct threats to the tower. | Drone 01 (Figure 17) |
| Threat on routes | This class includes intrusion trajectories representing direct threats to the routes, i.e., for the SIDs and STARs of the airport. | Drone 01—It affects the SIDs, without entering the airport perimeter (Figure 18) |
| Drone 02—It affects the STARs, without entering the airport perimeter (Figure 18) | ||
| Drone 03—It affects the SIDs and then enters the airport perimeter (Figure 18) | ||
| Drone 04—It affects the STARs and then enters the airport perimeter (Figure 18) |
4.2.5. Performance Metrics
- To deliver performance goals during abnormal operating conditions by reducing impact and decreasing time to recover;
- To withstand and recover from planned and unplanned events and conditions that cause a loss of nominal capacity.
- Safety metrics (Table 4)—They measure the variation in safety margins for airport operations due to drone intrusions. They are defined in connection with the critical assets, the threat scenarios, and the operational procedure for drone intrusions. They basically consider the infringements of the intrusions with respect to the critical assets of the airports.
- Time performance metrics (Table 5)—They measure the variation in time performance for airport operations due to drone intrusions. They consider the punctuality of the airport traffic.
- Workload metrics (Table 6)—They measure the variation in human workload for airport operations due to drone intrusions. The human workload is related to controllers and is basically quantified in terms of the number of clearances.
- Capacity metrics (Table 7)—They measure the variation in airport capacity due to drone intrusions. Capacity is assessed by means of arrival and departure rates for each runway.
- Safety degradation metric (SDM, Table 8)—It includes four degradation levels (catastrophic, hazardous, major, minor, and negligible), which are related to the infringements of the assets by means of drone intrusions. The triggering rules in Table 8 do not consider: collisions between drones and assets, since red-zone infringements already trigger catastrophic (for aircraft) and hazardous (for stationary assets) degradations; durations and speed criticalities of the intruder trajectories in the infringement zones, since these are not used as control variables for the threat scenarios, as explained in Section 4.2.4.
- Time performance degradation metric (TDM, Table 9)—It includes three degradation levels (high, medium, and low), which are related to the mean delays for arrival and departure traffic.
- Workload degradation metric (WDM, Table 10)—It includes three degradation levels (high, medium, and low), which are related to the normalized numbers of controllers’ clearances to manage arrival and departure flights.
- In the tables for the degradation metrics (Table 8, Table 9 and Table 10), the triggering rules are applied in an ordered way, starting from the ones applicable for greater degradation levels. For example, in Table 9 for TDM, the rule for the medium level is applicable if the rule for the high level is not triggered; the rule for the low level is applicable if the rules for the high and medium levels are not triggered.
5. Results
5.1. Simulation Results
- Safety (Table A1 and Table A2)—For the sake of brevity, only a subset of the performance metrics has been reported in the tables.
- Reference scenarios—All the threat scenarios lead to a catastrophic (4) value of safety degradation, as shown in Table A1. Several threat scenarios imply a collision between the intruder drone and a stationary asset, such as the scenarios “threat on 35L” and “threat on 35R”.
- Solution scenarios—No threat scenarios imply collisions between drones and airport assets and no catastrophic (4) values are recorded for the safety degradation, as shown in Table A2. The only situation with a hazardous (3) SDM is represented by the scenario “threat on fingers—Drone 01”, due to an orange zone infringement with a plane. However, looking at the trajectory of the intruder in Figure 17, this infringement regards only stationary planes at the fingers. Thus, solution scenarios limit the reduction of safety margins.
- Time performance (Table A3)—With respect to the metrics in Table 5, two metrics are added in Table A3, which are: the number of departures, i.e., the number of flights available at the gates and ready for taxiing, and the number of takeoffs. Note that the number of departures is generally greater in solution scenarios since reference scenarios stop departure operations in the case of a drone sighting. Moreover, the number of takeoffs is always less than the number of departures, even in solution scenarios. This is because, in the case of drone neutralization, recovery is simulated by just restoring the previously stopped aircraft without approving new aircraft for taxiing from those available at the gates.
- Reference scenarios—Almost all the threat scenarios lead to a high (2) time performance degradation. Only the scenarios “threat on 35R—Drone 01” and “threat parallel to runways—Drone 04” lead to medium (1) and low (0) values for TDM. This is due to the specific trajectory of the drone intrusion in these scenarios, which is such that it postpones the drone sighting and implies fewer delays. This occurs even if a collision is recorded for the scenario “threat on 35R—Drone 01” considering that the collision occurs “late” in the simulation timeframe.
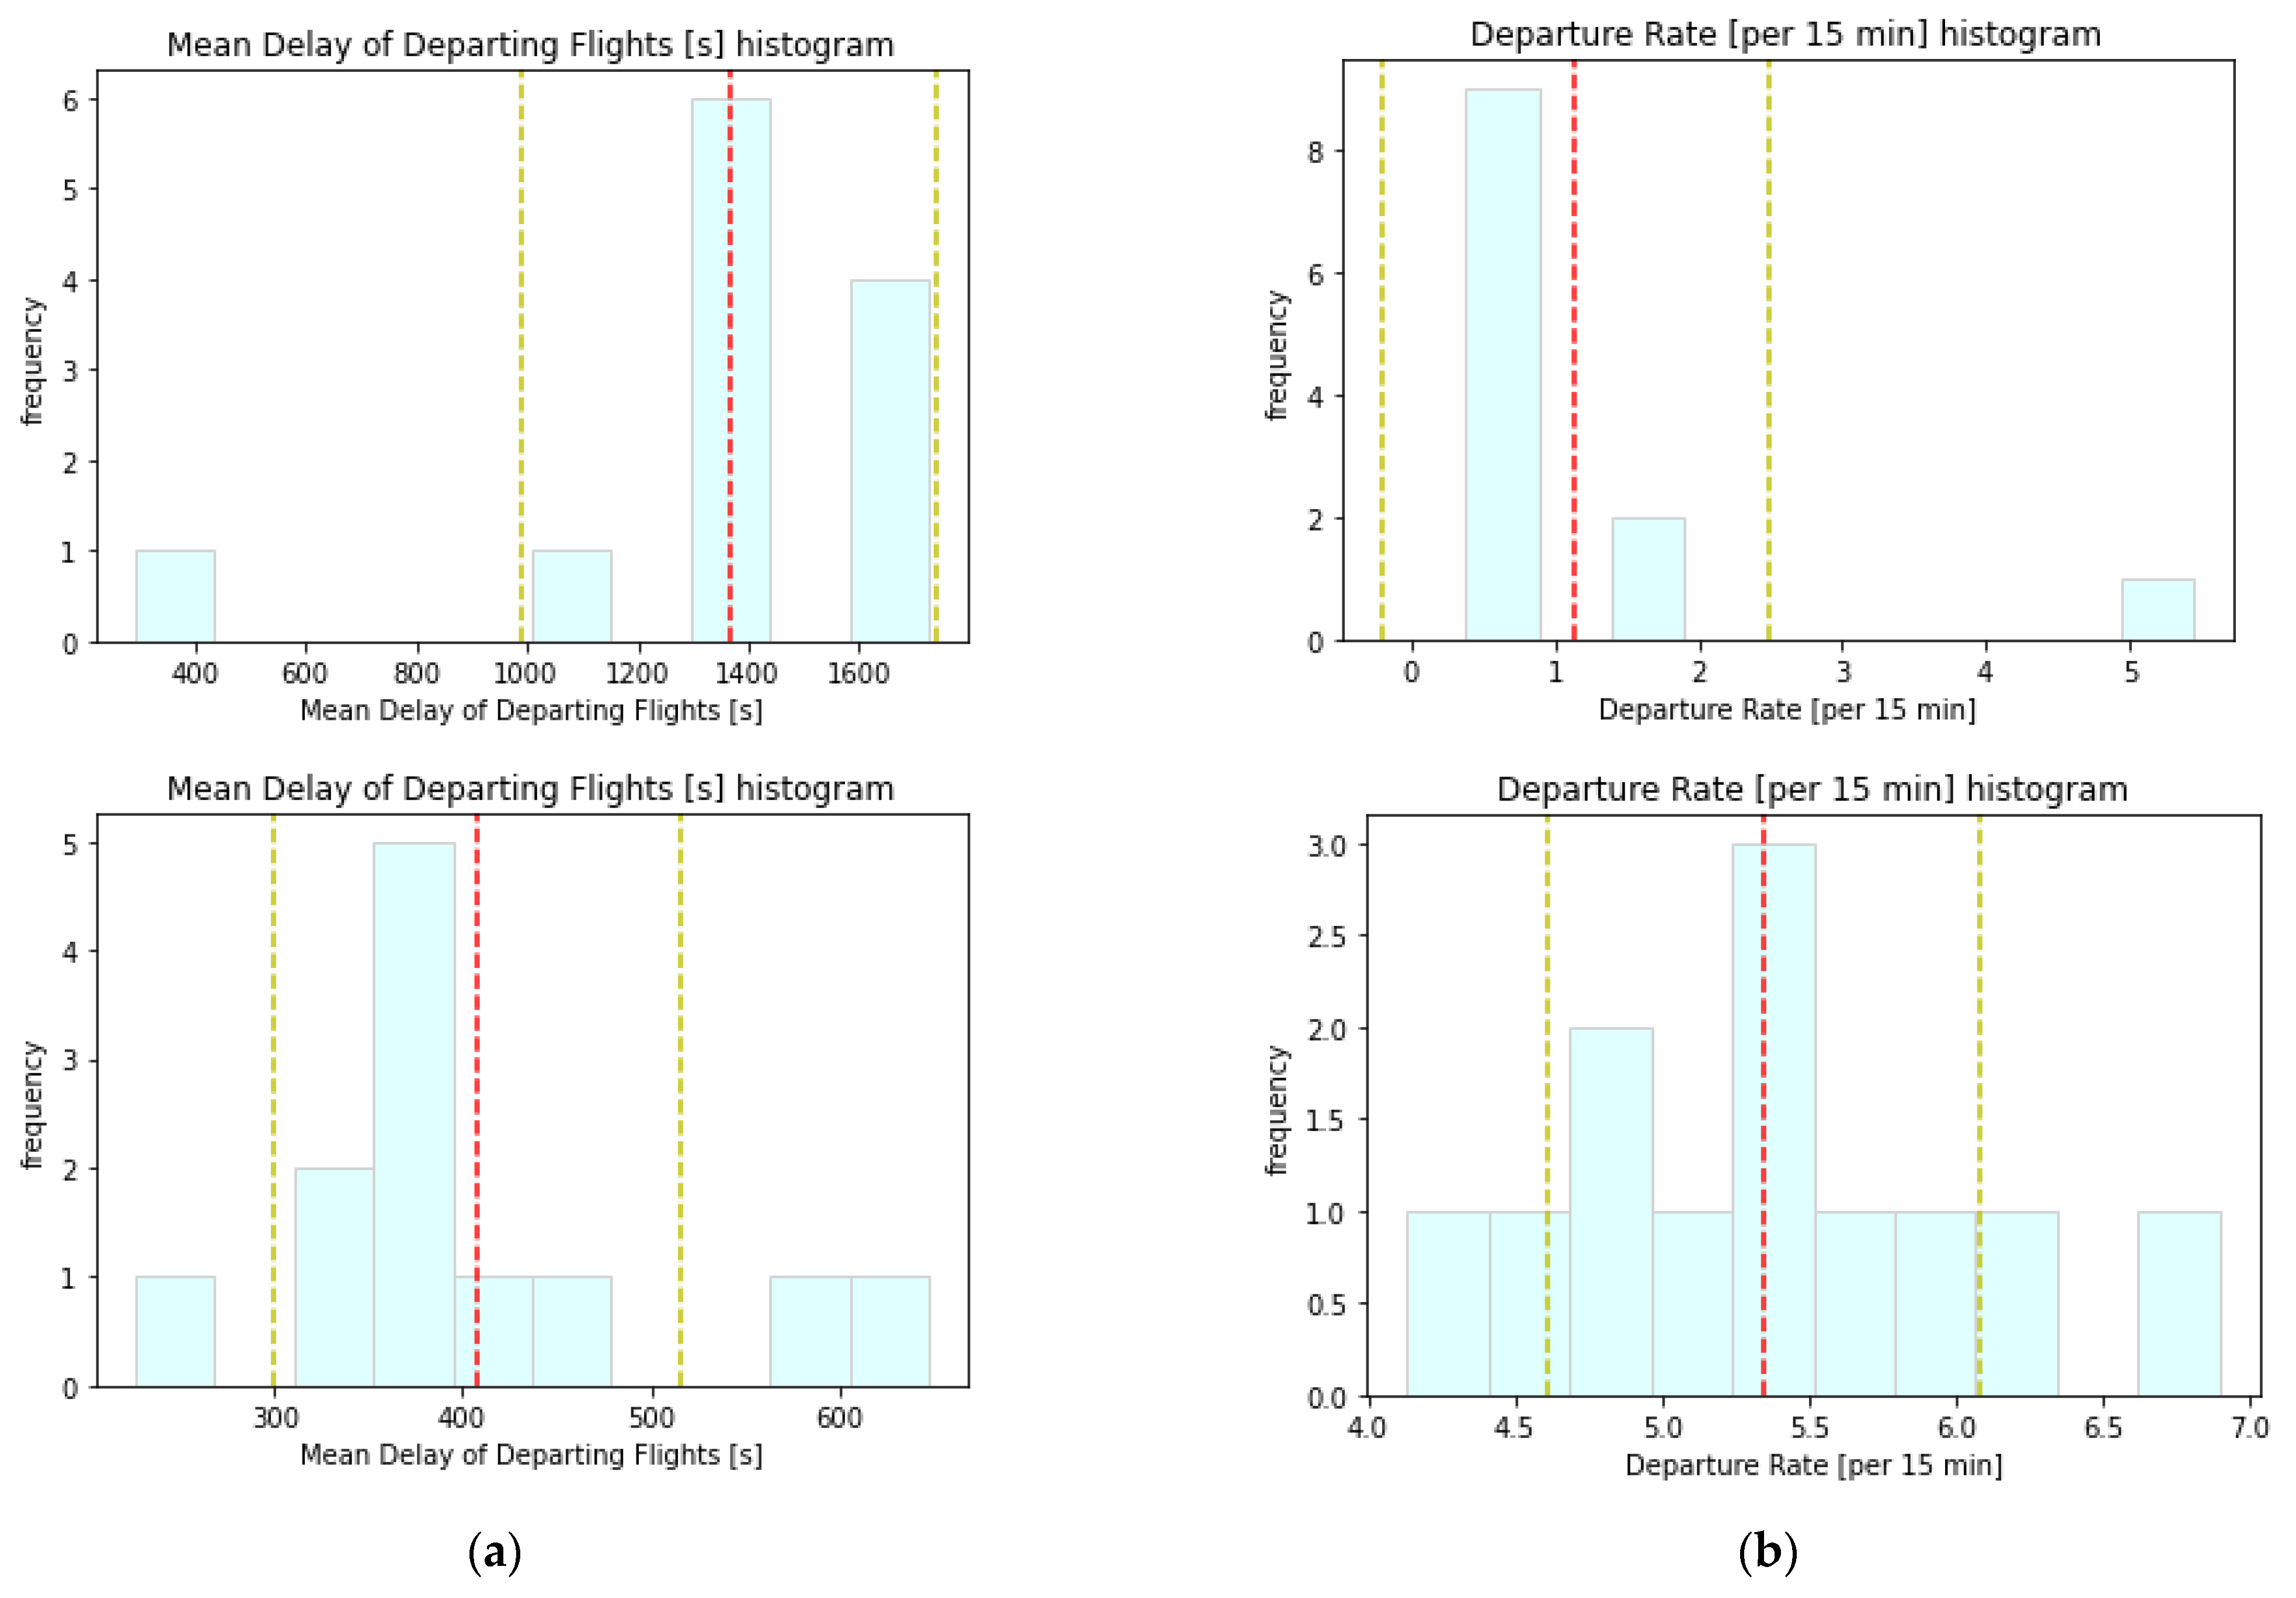
- Solution scenarios—Almost all the threat scenarios lead to a low (0) degradation of time performance, with the exception of the scenario “threat on routes—Drone 01”. This scenario is especially challenging from the point of view of the operational procedure since the drone’s trajectory (Figure 18) is such that no neutralization is possible. For the given scenarios and in the simulated timeframe (on average, 40 min), the ASPRID operational concept achieves a mean departing delay of about 400 s, which is less than a third of the mean departing delay of reference scenarios (about 1360 s). On the one hand, this gives a clear and quantitative idea of the time performance improvement in solution scenarios with respect to reference scenarios. On the other hand, this improvement is underestimated since several flights in reference scenarios would garner greater delays (or would even be canceled) with longer simulation timeframes.
- Workload (Table A4)—The number of departures is included also in the analysis of workload metrics, as it is for the time performance.
- Reference scenarios—Almost all the threat scenarios lead to a low (0) degradation of workload. This is coherent with the idea that, in reference scenarios, the operational procedure simply stops all airport operations in the case of drone sightings without providing a significant burden to controllers’ workload. However, this is also due to the fact that for these scenarios, the simulation never restores airport operations after an unauthorized drone sighting; in the case of a collision between the drone and a critical airport asset, the simulation is stopped without considering restoration.
- Solution scenarios—Almost all the threat scenarios lead to a medium (1) degradation of workload. This is coherent with the greater awareness and the early management of drone intrusions and the new guidelines of the ASPRID operational procedure, which prescribe different controller actions according to the current alert level of the threat. However, only a slight workload increase is observed in solution scenarios. Indeed, the normalized number of clearances per departing flight is on average 5.14, which is only 0.3 greater with respect to reference scenarios (4.86).
- Capacity (Table A5)—The results for capacity provide an additional view with respect to time performance. First of all, the same observations may be made related to the number of flights released for departures. Moreover, a clear capacity improvement may be observed. Indeed, solution scenarios show an average increment of about four flights/15 min for the departure rate with respect to reference scenarios.
5.2. Risk Assessment Results
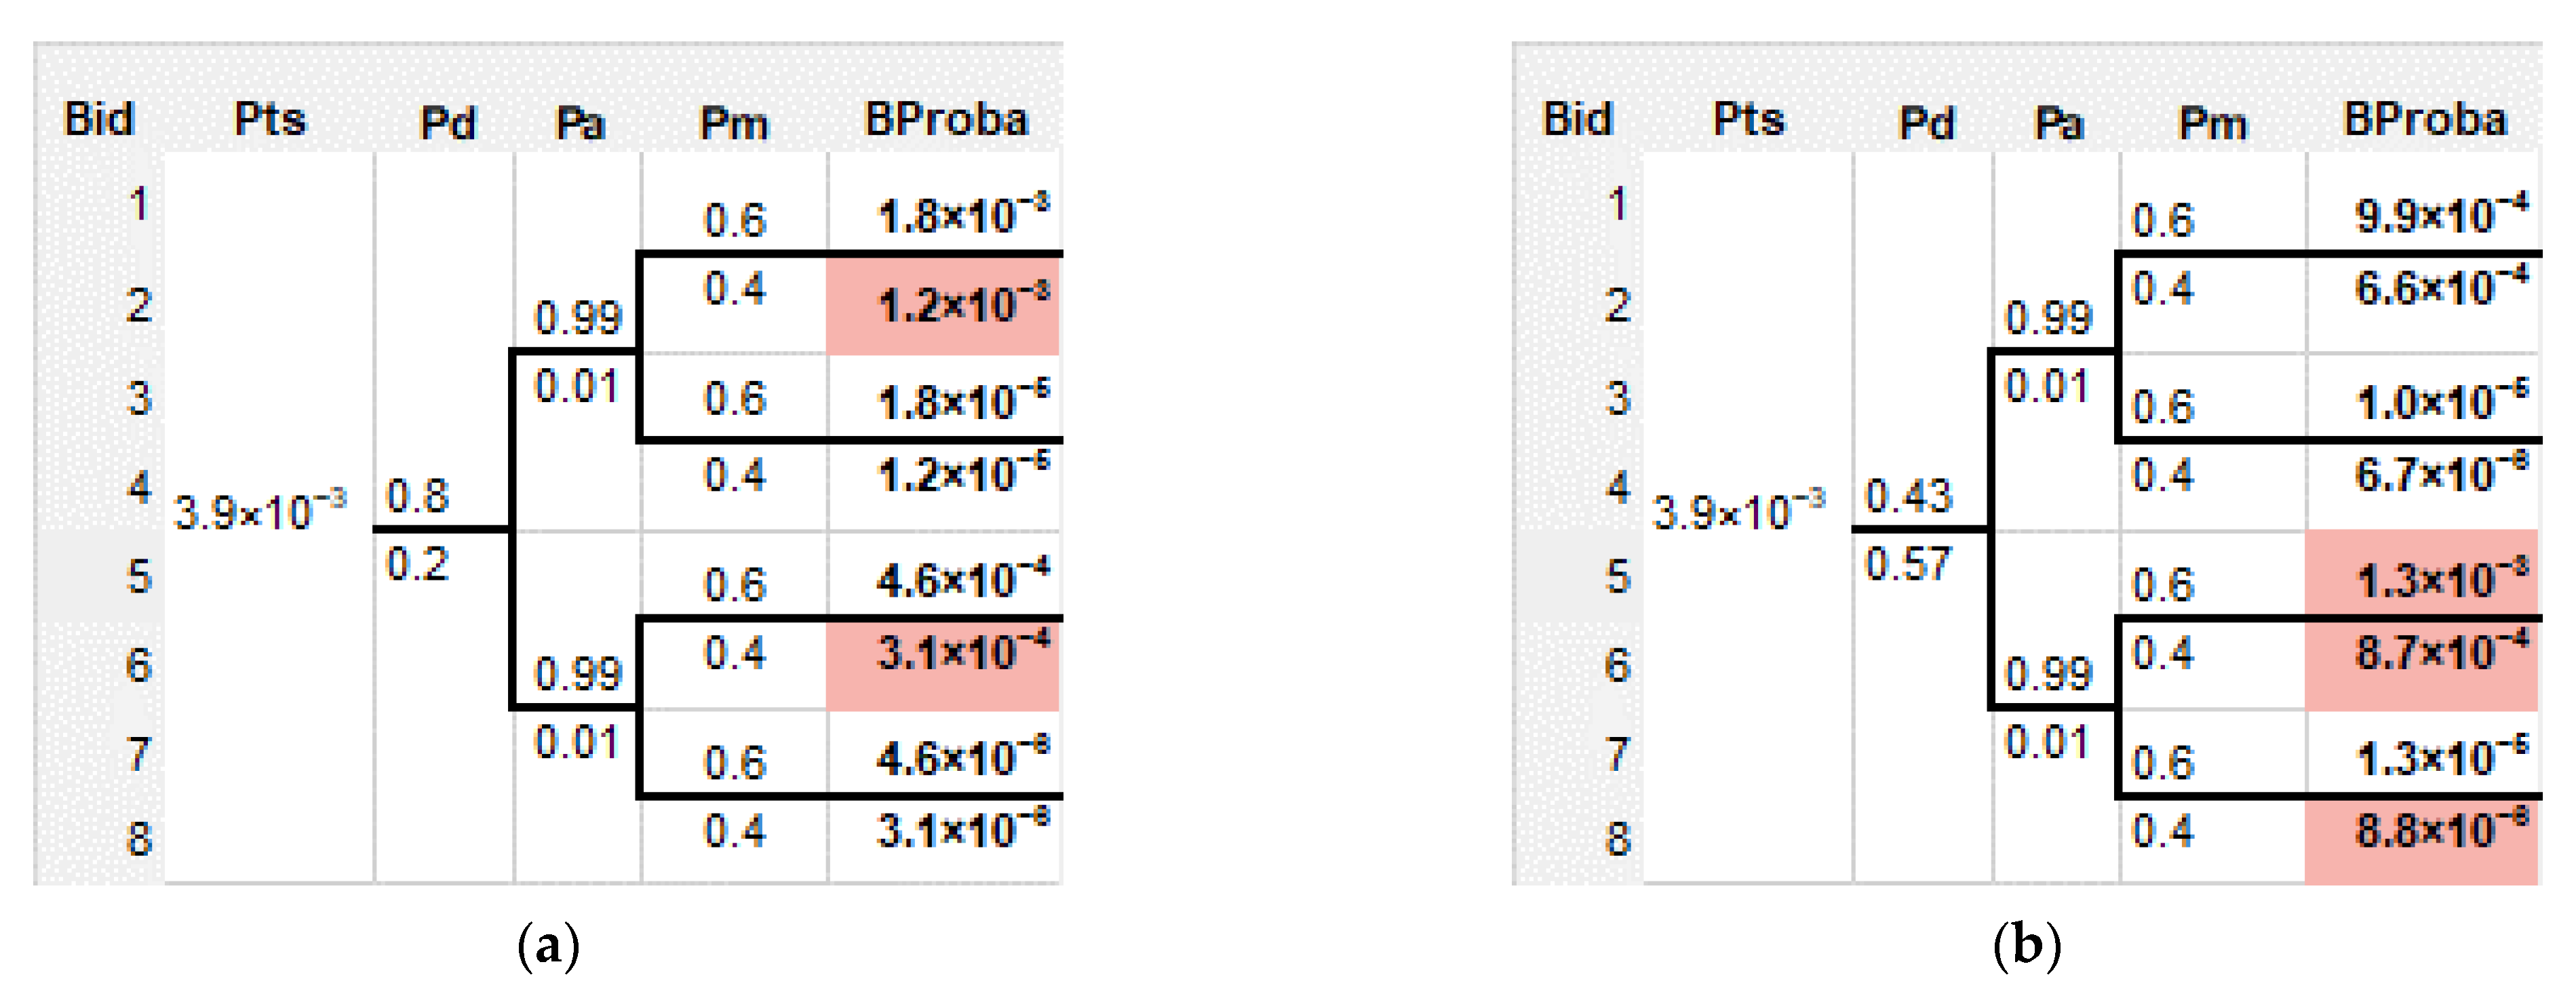
- ASPRID’s operational concept has always efficiently detected the intruder drone in the given threat scenarios. This contributes to a potential de-risking of all the unacceptable branches in Figure 20b.
- With regard to threat assessments, no consideration may be provided since the successful/unsuccessful assessments of intruder drones have not been modeled in the real-time simulator.
- ASPRID’s operational concept has always neutralized the intruder drone in the given threat scenarios, where allowed by the countermeasures’ coverage. In case a neutralization was not available due to the intruder’s trajectory (i.e., in the scenarios “threat parallel to runways” and “threat on routes—Drone 01”), the ASPRID operational procedure ruled out safety issues. This is confirmed by the results in Table A2, which show that, with regard to the abovementioned scenarios: (i) no collisions and no red alerts occurred; (ii) the safety degradation was only major (2). This contributes to a potential de-risking of Branch 2 and Branch 6 in Figure 20a.
6. Discussion
- Guarantee the safe continuity of airport operations in normal or degraded modes—The safety of airport operations is preserved, as demonstrated by the simulation results for the safety metrics. Moreover, the ASPRID system potentially contributes to the de-risking of most critical branches in the event trees, as preliminarily discussed in regard to risk assessment results. These numbers are reached despite that the closure of the overall airport was avoided in all the solution scenarios by means of the ASPRID operational procedure, which limited the interruption to those operations that are strictly affected by the intruder.
- Reduce time performance and capacity degradations—This benefit is demonstrated by the simulation results for time performance and capacity metrics, which report a clear improvement with respect to reference scenarios. Clearly, such a benefit directly implies an increase in airport resilience in the face of drone intrusions.
- Limit the increase in workload—An increase in the human workload is observed for solution scenarios, as expected. Anyway, even if this does not really represent a performance benefit, the workload increase is slight with respect to reference scenarios. Additional mitigation of this increase may be further explored in future works.
- Improve the situational awareness and early-management capabilities of airport operations with respect to intrusions—This benefit is not directly measured, but it is tangible due to the alerting functions. Moreover, the previous benefits are a clear consequence of this one.
- Lastly, it is worth noting that, with respect to reference scenarios, the assessed improvement in solution scenarios is even greater in the case of long-lasting drone intrusions.
7. Conclusions
Author Contributions
Funding
Data Availability Statement
Acknowledgments
Conflicts of Interest
Appendix A
| Threat Scenario | NYI | NOI | NRI | MTYI (s) | MTOI (s) | MTRI (s) | NYI-P | NOI-P | NRI-P | NYI-A | NOI-A | NRI-A | SDM |
|---|---|---|---|---|---|---|---|---|---|---|---|---|---|
| Threat on 35L—Drone 01 | 8 | 3 | 2 | 74.38 | 71.00 | 1906.50 | 2 | 6 | 0 | 3 | 0 | 2 | 4 |
| Threat on 35L—Drone 02 | 12 | 5 | 2 | 772.80 | 445.78 | 1011.45 | 3 | 9 | 0 | 5 | 0 | 2 | 4 |
| Threat on 35L—Drone 03 | 5 | 4 | 1 | 51.40 | 1544.00 | 2047.00 | 0 | 5 | 0 | 4 | 0 | 1 | 4 |
| Threat on 35R—Drone 01 | 5 | 4 | 1 | 418.58 | 1332.18 | 1760.90 | 1 | 4 | 0 | 4 | 0 | 1 | 4 |
| Threat on 35R—Drone 02 | 2 | 2 | 1 | 36.00 | 1102.00 | 2188.00 | 0 | 2 | 0 | 2 | 0 | 1 | 4 |
| Threat on 35R—Drone 03 | 4 | 2 | 1 | 1076.85 | 1098.35 | 2103.70 | 0 | 4 | 0 | 2 | 0 | 1 | 4 |
| Threat on fingers—Drone 01 | 10 | 6 | 2 | 1178.08 | 970.48 | 41.50 | 3 | 7 | 0 | 6 | 0 | 2 | 4 |
| Threat parallel to runways—Drone 01 | 8 | 0 | 0 | 591.35 | 0.00 | 0.00 | 1 | 7 | 0 | 0 | 0 | 0 | 4 |
| Threat parallel to runways—Drone 04 | 3 | 0 | 0 | 198.67 | 0.00 | 0.00 | 0 | 3 | 0 | 0 | 0 | 0 | 4 |
| Threat on routes—Drone 01 | 2 | 0 | 0 | 2033.50 | 0.00 | 0.00 | 0 | 2 | 0 | 0 | 0 | 0 | 4 |
| Threat on routes—Drone 03 | 2 | 2 | 0 | 159.50 | 1976.50 | 0.00 | 0 | 2 | 0 | 2 | 0 | 0 | 4 |
| Threat on tower—Drone 01 | 11 | 4 | 1 | 1374.64 | 22.75 | 12.00 | 3 | 8 | 0 | 4 | 0 | 1 | 4 |
| Mean | 6.00 | 2.67 | 0.92 | 663.81 | 713.59 | 922.59 | 1.08 | 4.92 | 0.00 | 2.67 | 0.00 | 0.92 | 4.00 |
| Standard Deviation | 3.51 | 1.93 | 0.76 | 611.08 | 678.33 | 955.23 | 1.26 | 2.36 | 0.00 | 1.93 | 0.00 | 0.76 | 0.00 |
| Threat Scenario | NYI | NOI | NRI | MTYI (s) | MTOI (s) | MTRI (s) | NYI-P | NOI-P | NRI-P | NYI-A | NOI-A | NRI-A | SDM |
|---|---|---|---|---|---|---|---|---|---|---|---|---|---|
| Threat on 35L—Drone 01 | 3 | 2 | 0 | 183.00 | 333.00 | 0.00 | 0 | 3 | 0 | 2 | 0 | 0 | 2 |
| Threat on 35L—Drone 02 | 10 | 2 | 0 | 284.50 | 263.00 | 0.00 | 4 | 6 | 0 | 2 | 0 | 0 | 2 |
| Threat on 35L—Drone 03 | 3 | 2 | 0 | 347.00 | 700.00 | 0.00 | 0 | 3 | 0 | 2 | 0 | 0 | 2 |
| Threat on 35R—Drone 01 | 2 | 1 | 0 | 221.00 | 293.00 | 0.00 | 0 | 2 | 0 | 1 | 0 | 0 | 2 |
| Threat on 35R—Drone 02 | 1 | 1 | 0 | 43.00 | 410.00 | 0.00 | 0 | 1 | 0 | 1 | 0 | 0 | 2 |
| Threat on 35R—Drone 03 | 3 | 2 | 0 | 139.00 | 615.50 | 0.00 | 1 | 2 | 0 | 2 | 0 | 0 | 2 |
| Threat on fingers—Drone 01 | 15 | 7 | 2 | 93.87 | 47.57 | 41.50 | 5 | 10 | 1 | 6 | 0 | 2 | 3 |
| Threat parallel to runways—Drone 01 | 11 | 0 | 1 | 161.19 | 0.00 | 188.00 | 1 | 10 | 0 | 0 | 0 | 0 | 2 |
| Threat parallel to runways—Drone 04 | 16 | 0 | 2 | 236.23 | 0.00 | 249.00 | 4 | 12 | 0 | 0 | 0 | 0 | 2 |
| Threat on routes—Drone 01 | 2 | 0 | 0 | 430.45 | 0.00 | 0.00 | 0 | 2 | 0 | 0 | 0 | 0 | 1 |
| Threat on routes—Drone 03 | 2 | 2 | 0 | 374.50 | 695.50 | 0.00 | 0 | 2 | 0 | 2 | 0 | 0 | 2 |
| Threat on tower—Drone 01 | 7 | 2 | 0 | 427.29 | 481.50 | 0.00 | 2 | 5 | 0 | 2 | 0 | 0 | 2 |
| Mean | 6.25 | 1.75 | 0.42 | 245.09 | 319.92 | 39.88 | 1.42 | 4.83 | 0.08 | 1.67 | 0.00 | 0.17 | 2.00 |
| Standard Deviation | 5.18 | 1.79 | 0.76 | 123.41 | 256.98 | 81.64 | 1.80 | 3.65 | 0.28 | 1.55 | 0.00 | 0.55 | 0.41 |
| Threat Scenario | Reference Scenarios | Solution Scenarios | ||||||||||||
|---|---|---|---|---|---|---|---|---|---|---|---|---|---|---|
| Departures | Takeoffs | NDDF | PDDF (%) | MDDF (s) | WDDF (s) | TDM | Departures | Takeoffs | NDDF | PDDF (%) | MDDF (s) | WDDF (s) | TDM | |
| Threat on 35L—Drone 01 | 11 | 2 | 10 | 90.91 | 1328.81 | 2071.12 | 2 | 15 | 7 | 8 | 53.33 | 400.29 | 568.57 | 0 |
| Threat on 35L—Drone 02 | 9 | 2 | 8 | 88.89 | 1358.29 | 2071.12 | 2 | 14 | 6 | 8 | 57.14 | 393.38 | 739.22 | 0 |
| Threat on 35L—Drone 03 | 8 | 2 | 7 | 87.50 | 1423.03 | 2071.12 | 2 | 17 | 10 | 8 | 47.06 | 382.44 | 650.01 | 0 |
| Threat on 35R—Drone 01 | 11 | 4 | 9 | 81.82 | 1085.75 | 2071.12 | 1 | 13 | 6 | 6 | 46.15 | 225.54 | 472.10 | 0 |
| Threat on 35R—Drone 02 | 8 | 1 | 7 | 87.50 | 1720.18 | 2596.10 | 2 | 11 | 4 | 4 | 36.36 | 355.15 | 612.10 | 0 |
| Threat on 35R—Drone 03 | 8 | 1 | 7 | 87.50 | 1725.79 | 2596.10 | 2 | 17 | 11 | 11 | 64.71 | 384.96 | 736.40 | 0 |
| Threat on fingers—Drone 01 | 9 | 2 | 8 | 88.89 | 1381.82 | 2071.12 | 2 | 15 | 9 | 7 | 46.67 | 336.19 | 538.22 | 0 |
| Threat parallel to runways—Drone 01 | 9 | 2 | 8 | 88.89 | 1371.04 | 2071.12 | 2 | 13 | 5 | 6 | 46.15 | 459.20 | 1111.07 | 0 |
| Threat parallel to runways—Drone 04 | 15 | 8 | 7 | 46.67 | 292.14 | 546.10 | 0 | 19 | 11 | 14 | 73.68 | 391.65 | 948.81 | 0 |
| Threat on routes—Drone 01 | 9 | 2 | 8 | 88.89 | 1357.77 | 2071.12 | 2 | 19 | 12 | 12 | 63.16 | 648.00 | 1184.22 | 1 |
| Threat on routes—Drone 03 | 9 | 1 | 8 | 88.89 | 1626.39 | 2596.10 | 2 | 17 | 10 | 12 | 70.59 | 582.62 | 1161.42 | 0 |
| Threat on tower—Drone 01 | 8 | 1 | 7 | 87.50 | 1718.46 | 2596.10 | 2 | 15 | 8 | 7 | 46.67 | 331.52 | 602.12 | 0 |
| Mean | 9.50 | 2.33 | 7.83 | 84.49 | 1365.79 | 2119.03 | 1.75 | 15.42 | 8.25 | 8.58 | 54.31 | 407.58 | 777.02 | 0.08 |
| Standard Deviation | 1.94 | 1.89 | 0.90 | 11.59 | 374.57 | 532.33 | 0.60 | 2.36 | 2.52 | 2.87 | 11.03 | 107.83 | 245.82 | 0.28 |
| Threat Scenario | Reference Scenarios | Solution Scenarios | ||||||
|---|---|---|---|---|---|---|---|---|
| Departures | NCDF | NNCDF | WDM | Departures | NCDF | NNCDF | WDM | |
| Threat on 35L—Drone 01 | 11 | 92 | 8.36 | 1 | 15 | 71 | 4.73 | 0 |
| Threat on 35L—Drone 02 | 9 | 39 | 4.33 | 0 | 14 | 64 | 4.57 | 0 |
| Threat on 35L—Drone 03 | 8 | 36 | 4.50 | 0 | 17 | 105 | 6.18 | 1 |
| Threat on 35R—Drone 01 | 11 | 49 | 4.45 | 0 | 13 | 56 | 4.31 | 0 |
| Threat on 35R—Drone 02 | 8 | 34 | 4.25 | 0 | 11 | 44 | 4.00 | 0 |
| Threat on 35R—Drone 03 | 8 | 34 | 4.25 | 0 | 17 | 91 | 5.35 | 1 |
| Threat on fingers—Drone 01 | 9 | 44 | 4.89 | 0 | 15 | 85 | 5.67 | 1 |
| Threat parallel to runways—Drone 01 | 9 | 38 | 4.22 | 0 | 13 | 70 | 5.38 | 1 |
| Threat parallel to runways—Drone 04 | 15 | 99 | 6.60 | 1 | 19 | 109 | 5.74 | 1 |
| Threat on routes—Drone 01 | 9 | 38 | 4.22 | 0 | 19 | 104 | 5.47 | 1 |
| Threat on routes—Drone 03 | 9 | 37 | 4.11 | 0 | 17 | 88 | 5.18 | 1 |
| Threat on tower—Drone 01 | 8 | 33 | 4.13 | 0 | 15 | 77 | 5.13 | 1 |
| Mean | 9.50 | 47.75 | 4.86 | 0.17 | 15.42 | 80.33 | 5.14 | 0.67 |
| Standard Deviation | 1.94 | 21.83 | 1.24 | 0.37 | 2.36 | 19.51 | 0.61 | 0.47 |
| Threat Scenario | Reference Scenarios | Solution Scenarios | ||
|---|---|---|---|---|
| Departures | DR | Departures | DR | |
| Threat on 35L—Drone 01 | 11 | 1.50 | 15 | 4.44 |
| Threat on 35L—Drone 02 | 9 | 0.76 | 14 | 4.92 |
| Threat on 35L—Drone 03 | 8 | 0.75 | 17 | 5.31 |
| Threat on 35R—Drone 01 | 11 | 1.50 | 13 | 6.90 |
| Threat on 35R—Drone 02 | 8 | 0.38 | 11 | 6.14 |
| Threat on 35R—Drone 03 | 8 | 0.38 | 17 | 5.49 |
| Threat on fingers—Drone 01 | 9 | 0.75 | 15 | 6.06 |
| Threat parallel to runways—Drone 01 | 9 | 0.75 | 13 | 4.96 |
| Threat parallel to runways—Drone 04 | 15 | 5.45 | 19 | 4.13 |
| Threat on routes—Drone 01 | 9 | 0.75 | 19 | 5.26 |
| Threat on routes—Drone 03 | 9 | 0.38 | 17 | 4.92 |
| Threat on tower—Drone 01 | 8 | 0.38 | 15 | 5.63 |
| Mean | 9.50 | 1.14 | 15.42 | 5.35 |
| Standard Deviation | 1.94 | 1.35 | 2.36 | 0.73 |
References
- Bouarfa, S.; Blom, H.A.; Curran, R.; HC Everdij, M. Agent-based modeling and simulation of emergent behavior in air transportation. Complex Adapt. Syst. Model. 2013, 1, 15. [Google Scholar] [CrossRef]
- Leonhardt, J.; Macchi, L.; Hollnagel, E.; Kirwan, B. A White Paper on Resilience Engineering for ATM; EUROCONTROL: Brussels, Belgium, 2009. [Google Scholar] [CrossRef]
- Hollnagel, E. Resilience—The Challenge of the Unstable. In Resilience Engineering: Concepts and Precepts, 1st ed.; Hollnagel, E., Woods, D.D., Leveson, N., Eds.; CRC Press: London, UK, 2006; pp. 9–17. [Google Scholar] [CrossRef]
- Gluchshenko, O.; Foerster, P. Performance Based Approach to Investigate Resilience and Robustness of an ATM System. In Proceedings of the Tenth USA/Europe Air Traffic Management Research and Development Seminar (ATM Seminar 2013), Chicago, IL, USA, 10–13 June 2013. [Google Scholar]
- Environmental Science Associates, Defining Airport Resilience. Available online: https://esassoc.com/news-and-ideas/2021/08/defining-airport-resilience (accessed on 16 January 2023).
- Shelley, A. Drone Registration Will Not Prevent Another Gatwick. SSRN 2019. [Google Scholar] [CrossRef]
- European Union Aviation Safety Agency (EASA). Drone Incident Management at Aerodromes. Part 1: The Challenge of Unauthorised Drones in the Surroundings of Aerodromes; EASA: Cologne, Germany, March 2021; Available online: https://www.easa.europa.eu/en/downloads/125405/en (accessed on 16 January 2023).
- European Union Aviation Safety Agency (EASA). The European Plan for Aviation Safety (EPAS 2021–2025), Volume I: Introduction and Strategy; EASA: Cologne, Germany, December 2020; Available online: https://www.easa.europa.eu/en/downloads/123562/en (accessed on 16 January 2023).
- European Union Aviation Safety Agency (EASA). Drone Incident Management at Aerodromes. Part 2: Guidance and Recommendations; EASA: Cologne, Germany, March 2021. [Google Scholar]
- European Union Aviation Safety Agency (EASA). Drone Incident Management at Aerodromes. Part 3: Resources and Practical Tools; EASA: Cologne, Germany, March 2021. [Google Scholar]
- ASPRID (Airport System PRotection from Intruding Drones). Available online: https://www.asprid.eu/ (accessed on 16 January 2023).
- ASPRID Presentation in Drones Beyond 2022. Available online: https://www.youtube.com/watch?v=7bebCiZtNYs (accessed on 16 January 2023).
- Pascarella, D.; Gigante, G.; Nebula, F.; Vozella, A.; Redondo de la Mata, E.; Jiménez Roncero, F.J.; Martinavarro, E. Historical Data Analysis and Modelling for Drone Intrusions in Airports. In Proceedings of the 2021 13th International Conference on Electronics, Computers and Artificial Intelligence (ECAI), Pitesti, Romania, 1–3 July 2021; pp. 1–8. [Google Scholar] [CrossRef]
- Pascarella, D.; Gigante, G.; Vozella, A.; Bieber, P.; Dubot, T.; Martinavarro, E.; Barraco, G.; Li Calzi, G. A Methodological Framework for the Risk Assessment of Drone Intrusions in Airports. Aerospace 2022, 9, 747. [Google Scholar] [CrossRef]
- Guo, J.; Zhu, X.; Liu, C.; Ge, S. Resilience Modeling Method of Airport Network Affected by Global Public Health Events. Math. Probl. Eng. 2021, 2021, 6622031. [Google Scholar] [CrossRef]
- Cook, A.; Blom, H.A.P.; Lillo, F.; Mantegna, R.N.; Miccichè, S.; Rivas, D.; Vázquez, R.; Zanin, M. Applying complexity science to air traffic management. J. Air Transp. Manag. 2015, 42, 149–158. [Google Scholar] [CrossRef]
- Resilience2050. Available online: https://resilience2050.org (accessed on 16 January 2023).
- Gluchshenko, O.; Foerster, P. Setting the Basis—Defining Resilience in the Organization of ATM; V1.0; Seventh Framework Programme of the European Union: Brussels, Belgium, 30 August 2013; Available online: https://s3.eu-central-1.amazonaws.com/innaxis-comm/RESILIENCE2050/D1.3+Resilience2050.pdf (accessed on 16 January 2023).
- The Innaxis Foundation and Research Institute. Resilience Multilayer Representationz; Issue 1 Draft 1; Seventh Framework Programme of the European Union: Brussels, Belgium, 30 September 2013; Available online: https://s3.eu-central-1.amazonaws.com/innaxis-comm/RESILIENCE2050/D3.1+Resilience2050.pdf (accessed on 16 January 2023).
- Filippone, E.; Gargiulo, F.; Errico, A.; Di Vito, V.; Pascarella, D. Resilience management problem in ATM systems as a shortest path problem. J. Air Transp. Manag. 2016, 56 Pt A, 57–65. [Google Scholar] [CrossRef]
- Pascarella, D.; Gargiulo, F.; Errico, A.; Filippone, E. An Analytical Approach for Optimal Resilience Management in Future ATM Systems. In Intelligent Distributed Computing IX; Studies in Computational Intelligence, Novais, P., Camacho, D., Analide, C., El Fallah Seghrouchni, A., Badica, C., Eds.; Springer: Cham, Switzerland, 2016; Volume 616, pp. 415–425. [Google Scholar] [CrossRef]
- European Organisation for Civil Aviation Equipment (EUROCAE). ED-286. Operational Services and Environment Definition for Counter-UAS in Controlled Airspace; EUROCAE: Saint-Denis, France, March 2021. [Google Scholar]
- Airports Council International (ACI) Europe. Drones in the Airport Environment: Concept of Operations & Industry Guidance; ACI Europe: Brussels, Belgium, April 2020. [Google Scholar]
- Pyrgies, J. The UAVs threat to airport security: Risk analysis and mitigation. J. Airl. Airpt. Manag. 2019, 9, 63–96. [Google Scholar] [CrossRef]
- Lykou, G.; Moustakas, D.; Gritzalis, D. Defending Airports from UAS: A Survey on Cyber-Attacks and Counter-Drone Sensing Technologies. Sensors 2020, 20, 3537. [Google Scholar] [CrossRef]
- Castrillo, V.U.; Manco, A.; Pascarella, D.; Gigante, G. A Review of Counter-UAS Technologies for Cooperative Defensive Teams of Drones. Drones 2022, 6, 65. [Google Scholar] [CrossRef]
- Kang, H.; Joung, J.; Kim, J.; Kang, J.; Cho, Y.S. Protect Your Sky: A Survey of Counter Unmanned Aerial Vehicle Systems. IEEE Access 2020, 8, 168671–168710. [Google Scholar] [CrossRef]
- Guide to the Systems Engineering Body of Knowledge (SEBoK)—Operational Concept (Glossary). Available online: https://www.sebokwiki.org/wiki/Operational_Concept_(glossary) (accessed on 16 January 2023).
- Object Management Group (OMG). Business Process Model and Notation (BPMN); formal/2013-12-09, 2.0.2; OBM: Needham, MA, USA, December 2013; Available online: https://www.omg.org/spec/BPMN/2.0.2/PDF (accessed on 16 January 2023).
- Manfredi, G.; Jestin, Y. An Introduction to Fast Time Simulations for RPAS Collision Avoidance System Evaluation. In Proceedings of the ICRAT 2018, 8th International Conference for Research in Air Transportation, Barcelona, Spain, 26–29 June 2018. [Google Scholar]
- ASPRID Consortium. DEMO Software for Validation; 01.00.01; SESAR Joint Undertaking: Brussels, Belgium, 4 February 2022; Available online: https://www.asprid.eu/wp-content/uploads/2022/05/D3.3.pdf (accessed on 16 January 2023).
- eArts (En-Route Aerodrome Real Time Simulator). Available online: https://www.soulsoftware.it/html/en/earts-1 (accessed on 16 January 2023).
- ASPRID Demo Web App. Available online: https://aspriddemo.web.app (accessed on 16 January 2023).
- Le Fevre, M.; Gölz, B.; Flohr, R.; Stelkens-Kobsch, T.; Verhoogt, T. SecRAM 2.0 Security Risk Assessment Methodology for SESAR 2020; 02.00.00; SESAR Joint Undertaking: Brussels, Belgium, 25 September 2017. [Google Scholar]
- Cordero, J.M.; García-Ovies, I.; Verdonk Gallego, C.; Sánchez-Palomo Bermúdez, L.; Bujor, A.; Calvo Fernandez, E.; Carbo, L.; Deransy, R.; Kanstein, A.; Lacatus, R.; et al. PJ19.04: Performance Framework (2019); 01.00.01; SESAR Joint Undertaking: Brussels, Belgium, 30 November 2019. [Google Scholar]
- ASPRID Gaming Exercise Results. Available online: https://www.asprid.eu/wp-content/uploads/2022/09/220913-ASPRID-Gaming-Exercise-results-ENG.pdf (accessed on 7 April 2023).


| Simulation Scenarios | Sensor Class | Spatial Coverage (m) | Efficiency |
|---|---|---|---|
| Reference | Artificial airport sensors (tower) | 500 | 50% |
| Artificial airport sensors (other) | 400 | 50% | |
| Artificial external sensors | 600 | 50% | |
| Solution | Radar sensors | 3500 | 25% |
| Identification sensors | 1000 | 75% |
| Neutralizer | Spatial Coverage (m) | Reaction Time (s) | Success Probability |
|---|---|---|---|
| Airport jammer | 1100 | 1 | 65% |
| LEA jammer | 1300 | 30 | 65% |
| Airport net | 100 | 2 | 50% |
| Safety Metric | Description |
|---|---|
| NYI | Number of yellow-zone infringements (NYI) of drone intrusions |
| NOI | Number of orange-zone infringements (NOI) of drone intrusions |
| NRI | Number of red-zone infringements (NRI) of drone intrusions |
| MTYI | Mean time of yellow-zone infringement (MTYI) of drone intrusions |
| MTOI | Mean time of orange-zone infringement (MTOI) of drone intrusions |
| MTRI | Mean time of red-zone infringement (MTRI) of drone intrusions |
| WTYI | Worst time of yellow-zone infringement (WTYI) of drone intrusions |
| WTOI | Worst time of orange-zone infringement (MTOI) of drone intrusions |
| WTRI | Worst time of red-zone infringement (MTRI) of drone intrusions |
| NYI-P | Number of yellow-zone infringements of drone intrusions against planes |
| NOI-P | Number of orange-zone infringements of drone intrusions against planes |
| NRI-P | Number of red-zone infringements of drone intrusions against planes |
| NYI-A | Number of yellow-zone infringements of drone intrusions against stationary assets |
| NOI-A | Number of orange-zone infringements of drone intrusions against stationary assets |
| NRI-A | Number of red-zone infringements of drone intrusions against stationary assets |
| Time Performance Metric | Description |
|---|---|
| NDAF | Number of delayed arrival flights (NDAF) with a delay greater than a given threshold |
| NDDF | Number of delayed departing flights (NDDF) with a delay greater than a given threshold |
| PDAF | Percentage of delayed arrival flights (PDAF) with a delay greater than a given threshold |
| PDDF | Percentage of delayed departing flights (PDDF) with a delay greater than a given threshold |
| MDAF | Mean delay of arrival flights (MDAF) with a delay greater than a given threshold |
| MDDF | Mean delay of departing flights (MDDF) with a delay greater than a given threshold |
| WDAF | Worst delay of arrival flights (WDAF) with a delay greater than a given threshold |
| WDDF | Worst delay of departing flights (WDDF) with a delay greater than a given threshold |
| Workload Metric | Description |
|---|---|
| NCAF | Number of controller clearances for arrival flights (NCAF) |
| NCDF | Number of controller clearances for departing flights (NCDF) |
| NNCAF | Normalized number of controller clearances for arrival flights (NNCAF) |
| NNCDF | Normalized number of controller clearances for departing flights (NCDF) |
| Capacity Metric | Description |
|---|---|
| AR | Arrival rate (AR) per 15 min for a given runway |
| DR | Departure rate (AR) per 15 min for a given runway |
| Safety Degradation Level | Safety Degradation Value | Triggering Rule |
|---|---|---|
| Catastrophic | 4 | |
| Hazardous | 3 | |
| Major | 2 | |
| Minor | 1 | |
| Negligible | 0 | All other conditions |
| Time Performance Degradation Level | Time Performance Degradation Value | Triggering Rule |
|---|---|---|
| High | 2 | |
| Medium | 1 | |
| Low | 0 |
| Workload Degradation Level | Workload Degradation Value | Triggering Rule |
|---|---|---|
| High | 2 | |
| Medium | 1 | |
| Low | 0 | All other conditions |
Disclaimer/Publisher’s Note: The statements, opinions and data contained in all publications are solely those of the individual author(s) and contributor(s) and not of MDPI and/or the editor(s). MDPI and/or the editor(s) disclaim responsibility for any injury to people or property resulting from any ideas, methods, instructions or products referred to in the content. |
© 2023 by the authors. Licensee MDPI, Basel, Switzerland. This article is an open access article distributed under the terms and conditions of the Creative Commons Attribution (CC BY) license (https://creativecommons.org/licenses/by/4.0/).
Share and Cite
Pascarella, D.; Gigante, G.; Vozella, A.; Sodano, M.; Ippolito, M.; Bieber, P.; Dubot, T.; Martinavarro, E. Evaluation of a Resilience-Driven Operational Concept to Manage Drone Intrusions in Airports. Information 2023, 14, 239. https://doi.org/10.3390/info14040239
Pascarella D, Gigante G, Vozella A, Sodano M, Ippolito M, Bieber P, Dubot T, Martinavarro E. Evaluation of a Resilience-Driven Operational Concept to Manage Drone Intrusions in Airports. Information. 2023; 14(4):239. https://doi.org/10.3390/info14040239
Chicago/Turabian StylePascarella, Domenico, Gabriella Gigante, Angela Vozella, Maurizio Sodano, Marco Ippolito, Pierre Bieber, Thomas Dubot, and Edgar Martinavarro. 2023. "Evaluation of a Resilience-Driven Operational Concept to Manage Drone Intrusions in Airports" Information 14, no. 4: 239. https://doi.org/10.3390/info14040239
APA StylePascarella, D., Gigante, G., Vozella, A., Sodano, M., Ippolito, M., Bieber, P., Dubot, T., & Martinavarro, E. (2023). Evaluation of a Resilience-Driven Operational Concept to Manage Drone Intrusions in Airports. Information, 14(4), 239. https://doi.org/10.3390/info14040239