1. Introduction
An important worldwide health issue is the highly contagious bacterial illness tuberculosis caused by Mycobacterium tuberculosis. This airborne bacterial disease, which primarily affects the lungs but can also damage other organs, is spread through respiratory droplets expelled by infected people. According to the report [
1], TB is a major global health threat, with approximately 8–10 million new TB patients and 2–3 million deaths from the disease each year. About 10.6 million people were diagnosed with TB in 2021, a 4.5% increase over the 10.1 million cases that were reported in 2020. The report [
1] shows the number of new cases of TB per 100,000 individuals annually had increased by 3.6% between 2020 and 2021. A decreasing tendency of about 2% per year that had been present for the previous two decades was reversed by this rise [
1]. If left untreated, TB has a high mortality rate. Furthermore, the prevalence and mortality rate are found to be higher in countries with lower human development indexes [
2].
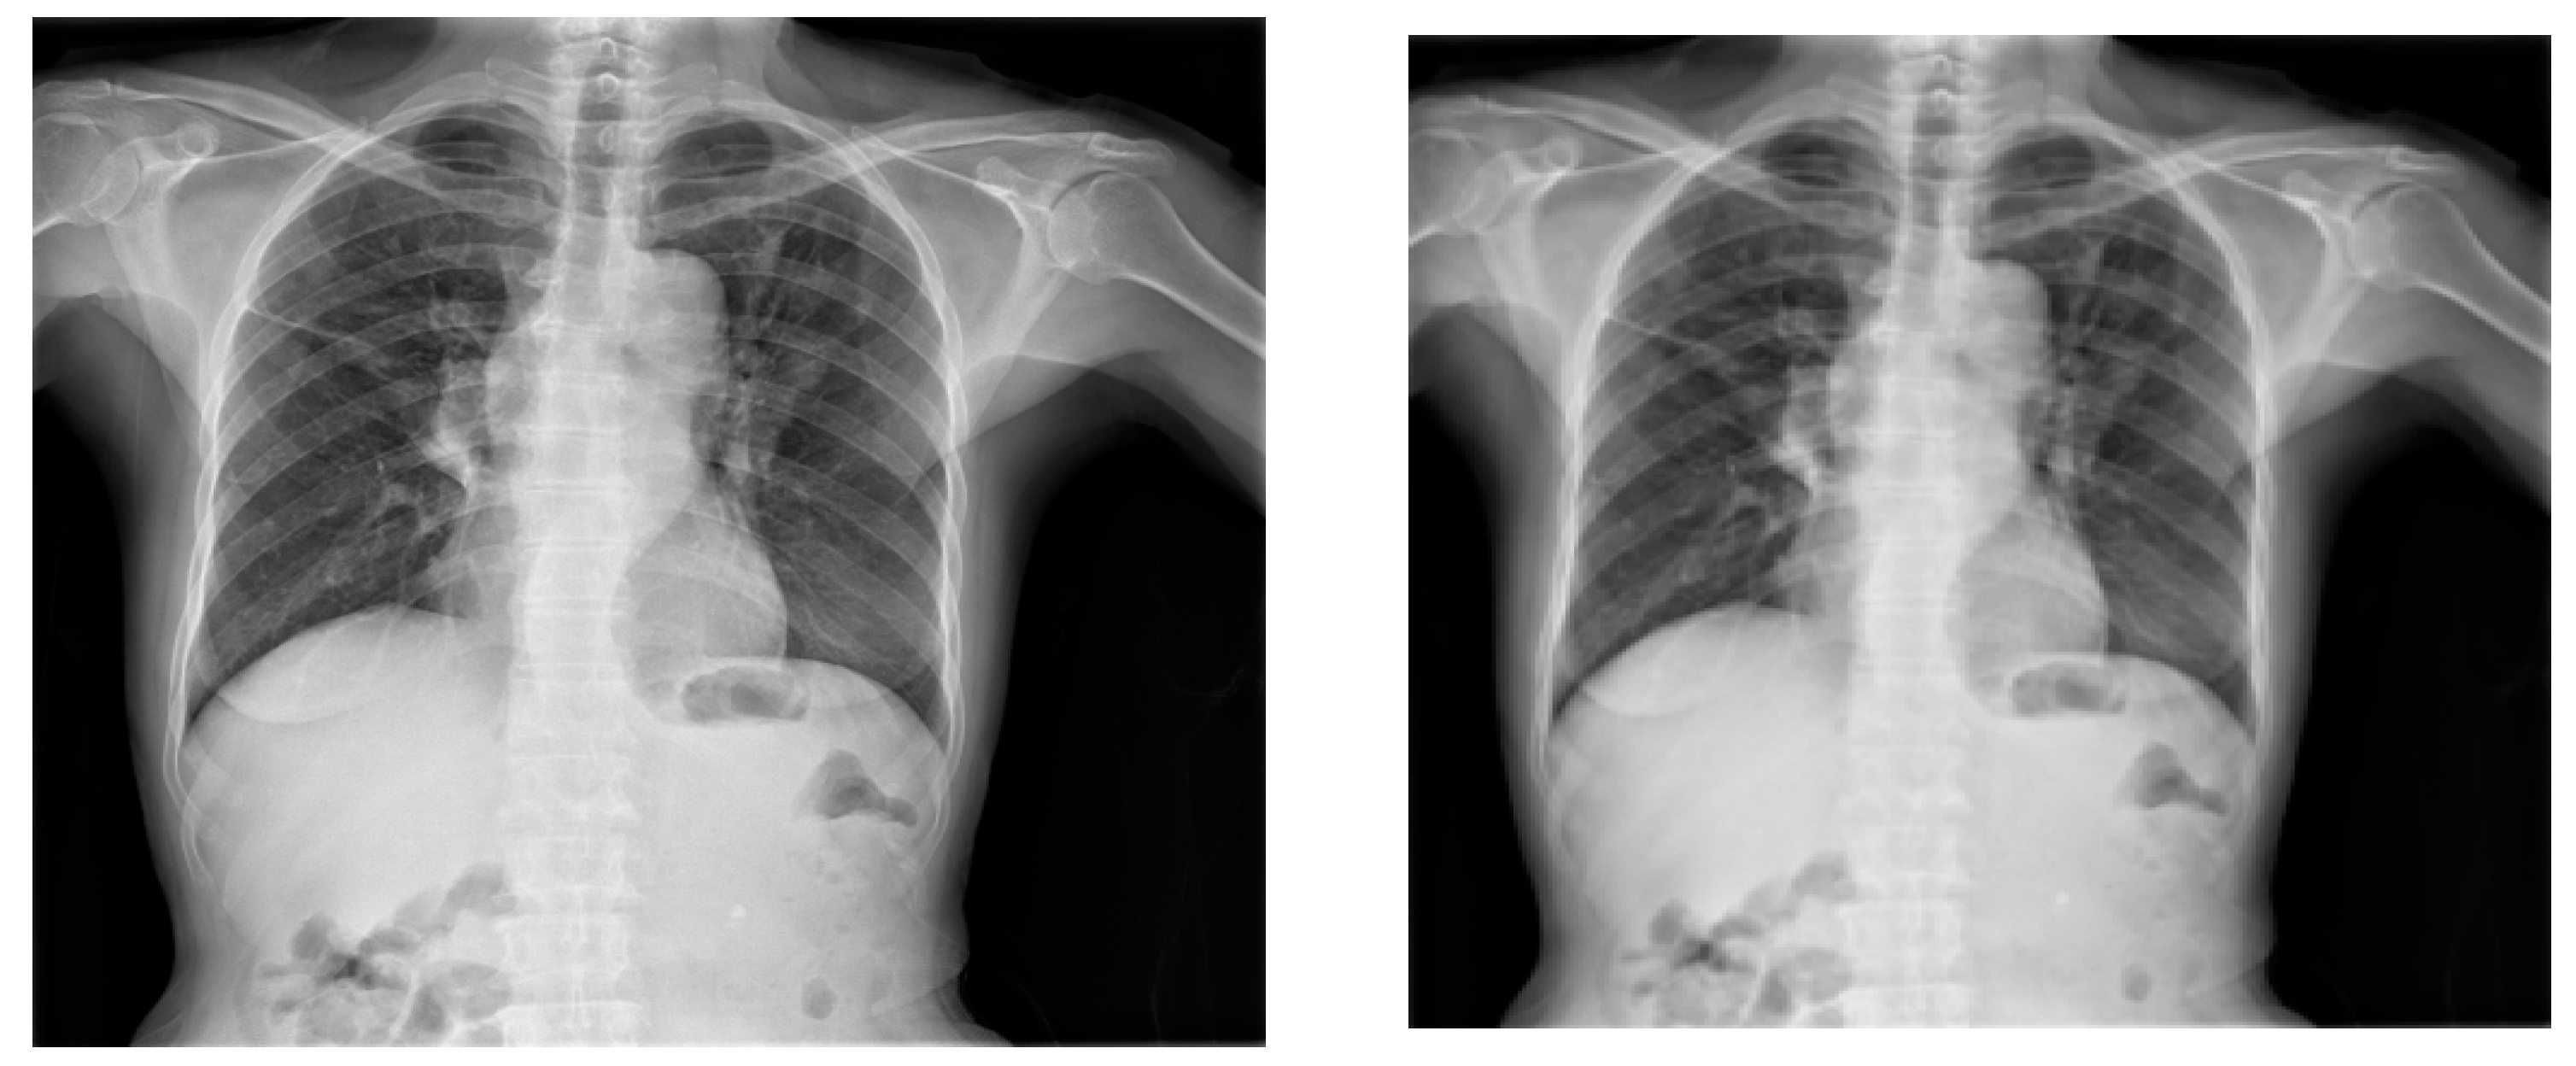
TB can be active or obsolete. The term “active TB” describes the condition in which the bacteria are present in the body actively, causing clinical symptoms and the potential for transmission to others. On the other hand, “obsolete TB” refers to a condition in which the bacteria are still present but do not result in an active illness, causing a latent infection [
3]. However, early diagnosis and treatment with antibiotics greatly improve survival chances and help control the spread of active infection [
4,
5,
6].
The most common TB detection approaches include TST (Tuberculin Skin Test) and IGRAs (Interferon-Gamma Release Assays). The ancient TST has limitations due to technical errors and BCG (Bacillus Calmette–Guérin) vaccination influence. Identifying TST conversion is important for LTBI (latent TB infection) preventive therapy. IGRAs offer higher specificity but have logistical constraints and are more expensive [
7]. This might also be a challenge for developing countries where most of the population cannot afford such diagnostic tests.
However, a chest X-ray is the most common and less expensive screening method for TB. Early TB screening through X-ray has significant implications for the early detection, treatment, and prevention of TB [
8,
9,
10,
11]. However, radiologists’ examination of X-rays is often prone to errors, with experienced radiologists from top hospitals only achieving an accuracy of 68.7% [
9,
10]. This is due to the difficulty distinguishing TB areas from other areas in X-rays, which the human eye is not sensitive enough to detect.
The medical field’s evaluation of chest X-rays can significantly benefit from the integration of an efficient CAD system paired with precise computer vision models for disease detection. Detecting TB early is crucial for implementing effective measures to mitigate risks and prevent the spread of infection. Additionally, such a system can expedite the diagnostic process, reducing the risk of infection extension during prolonged testing procedures. Typically, doctors focus on specific areas in chest X-ray images, searching for consolidation or cavitary lesions in the lungs as indicators of infection [
3]. Utilizing computer vision technology alongside advanced neural network (NN) architectures enhances the ability to annotate, locate, and analyze chest X-ray images, predicting the presence of similar patterns [
12].
AI (Artificial Intelligence) aims to make machines mimic and perform like humans in everyday tasks by utilizing large amounts of data. This enables machines to surpass human capabilities in tasks such as image analysis and video processing [
13,
14,
15]. Particularly, CNN is a deep-learning algorithm designed to take an image as input and acquire knowledge about the image from different perspectives, leveraging the unique properties of a CNN [
16]. This helps the CNN-based AI systems to simulate human-like understanding and excel in tasks such as image analysis, surpassing human capabilities in these areas. This technology, along with CAD software, can help medical professionals make effective decisions. CADs are useful decision-support tools that aid physicians and radiologists in increasing their precision, effectiveness, and patient outcomes by providing additional insights and reducing diagnostic errors [
17].
In this study, we present a computer vision model based on YOLOv7, a CNN-based single-shot object detector, accompanied by an effective CAD system trained on the TBX11K dataset. Throughout our study, we converted Pascal VOC annotations to the YOLO format using scripts for each annotation and the associated images, ensuring compatibility with YOLO algorithms. Previously, the authors in [
12] applied object detection and segmentation models such as Faster RCNN (Faster Region-Based Convolutional Neural Network), SSD (Single-Shot Detector), RetinaNet, and FCOS (Fully Convolutional One-Stage) detectors on the imbalanced TBX11K dataset. However, to address this imbalance, we introduced class weights and image augmentations, resulting in the synthesis of a balanced dataset. Following this, YOLOv7, an approach not previously tested for this specific object detection problem, was employed with hyperparameter evolution. This implementation results in more generalized outcomes and a higher mAP than the other formally recorded approaches. Additionally, the improved efficiency and detection speed of the YOLOv7 model made it well suited for the seamless integration into our cloud-based CAD system, developed on the foundation of this object detection model. Despite the efforts, the approach and the system can be further improved. Also, the medical data are always hard to obtain; the model might perform better in a high abundance of data since neural networks are very data-hungry [
13].
This paper has been organized as follows. In
Section 2, we present the related work. In
Section 3, we discuss the materials and methods of this study. The results and discussions are presented in
Section 4. Finally,
Section 5 covers the conclusion and future work.
2. Related Work
Most of the recent approaches in the field cover the classification aspect from chest X-rays and some infection location techniques without employing the actual annotated dataset for training and validation. For instance, in the proposed model from [
18], ImageNet fine-tuned NFNets (Normalization-Free Networks) are employed for chest X-ray classification using the Score-Cam algorithm to highlight diagnostic regions. The proposed method achieves a high accuracy, AUC, sensitivity, and specificity for both binary and multiclass classification, with results reaching 96.91% accuracy, 99.38% AUC, 91.81% sensitivity, and 98.42% specificity on the multiclass dataset.
Likewise, the study from [
19] proposes a TB detection system employing advanced deep-learning models. Segmentation networks are utilized to extract the region of interest from CXR images, leading to an improved classification performance. Among the tested CNN models, the proposed model achieves the highest accuracy of 99.1% on three publicly available CXR datasets, demonstrating the superiority of segmented lung CXR images over raw ones.
The authors in [
12] conducted a comparison of object detection and classification methods for TB detection using annotated chest X-ray images. The goal was to distinguish between TB and non-TB X-rays, with a focus on predicting the boundary box of TB in the X-ray images. They evaluated several models, including SSD with VGGNet-16 backbone, RetinaNet with ResNet-50 backbone and FPN, and Faster R-CNN with ResNet-50 backbone and FPN.
In the case of classification models, the results showed that using pre-trained backbones significantly improved the performance of the models. SSD with pre-trained VGGNet-16 achieved an accuracy of 84.7% and an AUC of 93.0%. RetinaNet with pre-trained ResNet-50 achieved an accuracy of 87.4% and an AUC of 91.8%. Faster R-CNN with pre-trained ResNet-50 achieved an accuracy of 89.7% and an AUC of 93.6%.
However, without pre-training, the performance of the models decreased. SSD without pre-trained weights achieved an accuracy of 88.2%, RetinaNet without pre-trained weights achieved an accuracy of 79.0%, and Faster R-CNN without pre-trained weights achieved an accuracy of 81.3%.
The evaluation also focused on the models’ ability to detect active TB and latent TB cases. Faster R-CNN with ResNet-50 backbone and FPN demonstrated the highest accuracy of 53.3% and sensitivity of 21.9% for active TB detection. For latent TB detection, RetinaNet with ResNet-50 backbone and FPN achieved the highest accuracy of 37.8% and sensitivity of 12.7%.
The study also evaluates the performance of object detection models to make the boundary box prediction of the infected regions of active and latent TB. Here, many approaches have been considered with separate backgrounds and with the option of using pre-trained weights. Then, the respective AP scores are compared with each other, and the models are compared. It is illustrated in
Table 1.
Table 1 compares different deep-learning architectures for TB detection on the TBX11K dataset, emphasizing the impact of backbones, pre-trained models, and data configurations. Faster R-CNN with ResNet-50 and FPN consistently excels in detecting active TB and latent TB, showcasing its clinical potential.
Overall, the study emphasized the importance of using appropriate backbone networks and pre-trained weights for improved performance in TB detection from chest X-ray images. The authors acknowledged the challenge of data imbalance when detecting latent TB cases. Further research and optimization are necessary to improve the detection rates for latent TB, as it poses additional challenges due to its subtler manifestations in X-ray images compared to active TB. Similarly, the method did not consider one of the state-of-the-art computer vision algorithms: YOLO.
YOLO has been found to be promising for the automation of the detection of TB. A basic CNN’s maximum speed cap is exceeded by YOLO, which achieves an excellent balance between speed and accuracy. One of the swiftest all-purpose item detectors is YOLO. Furthermore, YOLO is the best model for applications that require quick, accurate object recognition because it generalizes objects better than other models. Because of these outstanding and valuable benefits, it merits being strongly suggested and receiving more exposure over time [
20].
YOLO in CAD is its ability to detect multiple objects in a single image. This is particularly useful in medical imaging, where multiple abnormalities or lesions may be present in a single image. By detecting and localizing multiple objects in a single pass, YOLO can help improve the efficiency and accuracy of CAD systems [
21]. Additionally, YOLO can be trained on datasets of annotated medical images, allowing it to learn and recognize patterns that are characteristic of various diseases and conditions. This can help improve the accuracy of CAD systems, as they can be trained to detect subtle changes in images that may be difficult for human experts to detect. Overall, YOLO has the potential to significantly improve the accuracy and efficiency of CAD systems, leading to earlier and more accurate diagnoses of various medical conditions With the introduction of YOLO and its architectural successors/descendants, YOLOs are widely used in many applications, primarily because of their quicker conclusions and respectable accuracy, due to which YOLO is a perfect fit for boundary box detection in medical images along with its quick inference in the CAD software [
22].
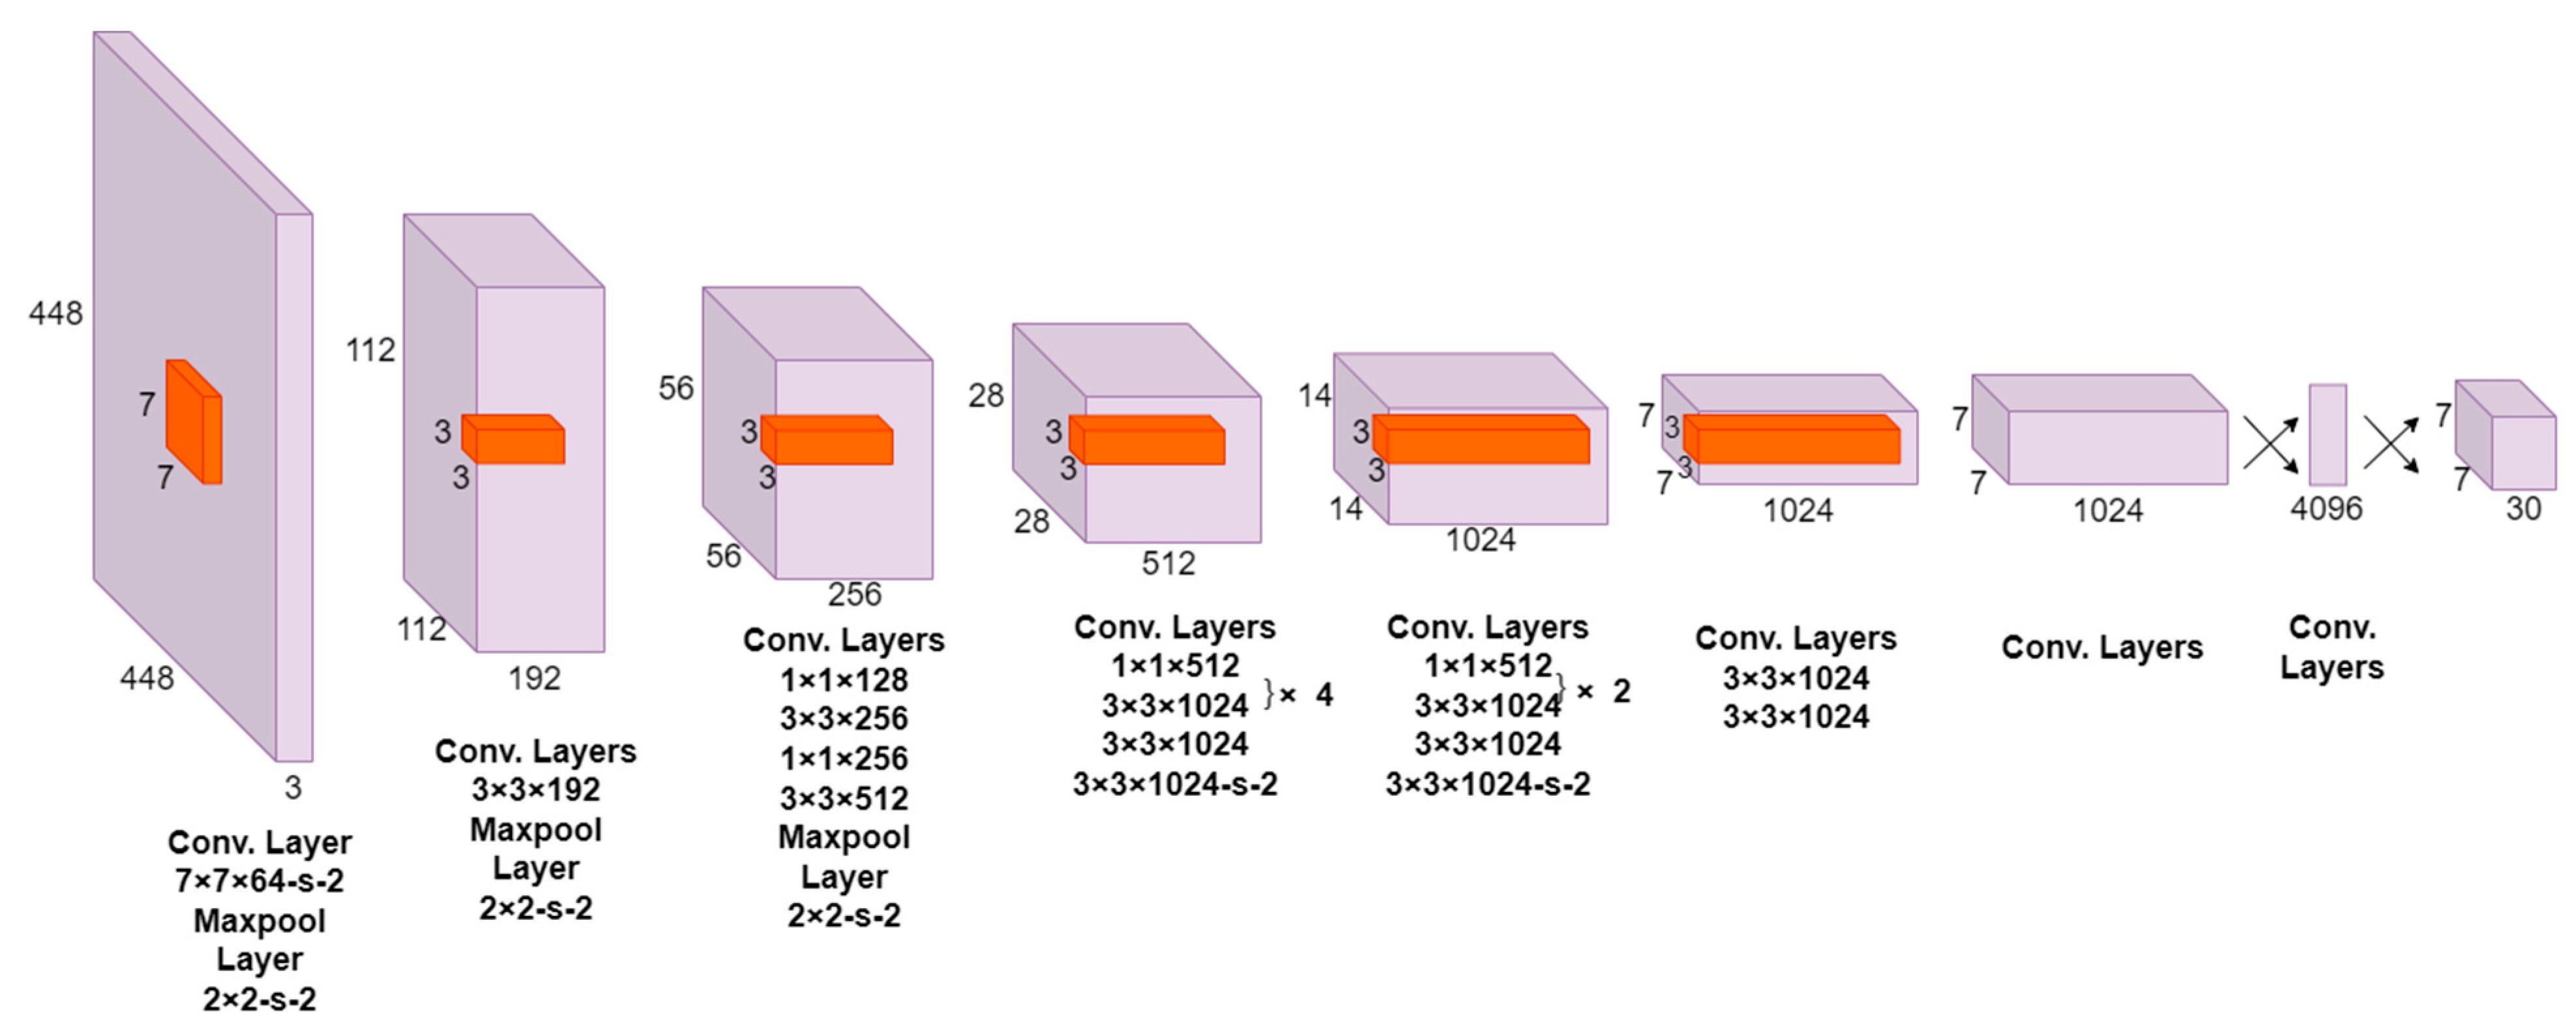
The YOLO architecture in
Figure 1 is a pioneering object detection model that combines speed and accuracy. It consists of 24 convolutional layers followed by 2 fully connected layers. Notably, the YOLO architecture incorporates alternating 1 × 1 convolutional layers, which effectively reduce the feature space from the preceding layers. This reduction aids in capturing and consolidating essential information while maintaining computational efficiency. To leverage the power of transfer learning, the YOLO model adopts a pre-trained approach. The convolutional layers are initially pre-trained on the ImageNet classification task using a resolution of 224 × 224 input images. This pre-training step enables the network to learn discriminative features and high-level representations from a large-scale dataset. Subsequently, the resolution is doubled for object detection, enhancing the spatial resolution of the final predictions [
23].
The output of the YOLO network is a tensor with dimensions of 7 × 7 × 30. This tensor represents a grid that divides the input image into spatial cells, with each cell responsible for predicting multiple bounding boxes and corresponding class probabilities. The 7 × 7 grid allows for efficient detection across the image while maintaining a balance between localization accuracy and computational complexity. The 30-dimensional tensor encompasses various predictions, including bounding box coordinates, class probabilities, and other parameters needed for object detection tasks [
23].
Similarly, the above architecture evolved into many iterations and YOLOV7 (the latest at the time) was considered during the experiments. The YOLOv7 architecture, known for its efficiency and real-time object detection capabilities, has undergone advancements in the form of extended efficient layer aggregation networks (ELANs) and model scaling. The ELAN introduces variations to the VoVNet architecture, considering factors such as memory access cost, input/output channel ratio, number of branches, and element-wise operations. Additionally, the ELAN analyzes the gradient path to enable the learning of diverse features and achieve faster and more accurate inference. Building upon the ELAN, the extended-ELAN (E-ELAN) further enhances the network’s learning ability by employing expand, shuffle, and merge cardinality operations within the computational blocks. This allows for continuous learning without disrupting the original gradient path [
24].
When it comes to model scaling in concatenation-based architectures like YOLO, a compound scaling approach is necessary due to the interdependence of scaling factors. Traditional scaling methods used in other architectures may not be directly applicable to concatenation-based models. For instance, when scaling up or down the depth of a computational block in YOLO, it affects the in-degree and out-degree of the subsequent transition layer, which can impact hardware usage and model performance. To address this, a compound model scaling method is proposed for concatenation-based models. This method considers both depth and width scaling, ensuring that changes in one factor are accompanied by corresponding adjustments in the other to maintain the optimal structure and preserve the desired properties of the model [
24].
This paper addresses a significant research gap in the domain of TB detection from chest X-ray images, particularly in relation to the utilization of advanced computer vision techniques. While previous studies have underscored the importance of appropriate backbone networks and pre-trained weights for enhanced performance, an underexplored area pertains to the integration of state-of-the-art algorithms like YOLO, whose efficiency and inference speed beat all of the other algorithms. This paper also addresses the challenge of data imbalance, particularly in detecting latent TB cases with subtler manifestations. This study not only emphasizes the value of optimizing TB detection rates but also introduces a novel approach through the comprehensive CAD system. By incorporating CNNs and YOLOv7 architecture, we bridge the gap between accuracy and speed, thereby contributing to the advancement of automated TB detection in CAD systems.
3. Materials and Methods
This section first discusses the architecture of both a CAD and object detection system to detect TB.
Section 3.1 presents the dataset. The data preprocessing step is presented in
Section 3.2.
Section 3.3 and
Section 3.4 are about class weights and data augmentation to tackle the data imbalance problem.
Section 3.5 discusses more on the experiments.
Section 3.6 covers hyperparameter tuning with an approach like hyperparameter evolution. Finally,
Section 3.7 is about the deployment of the model in a CAD system.
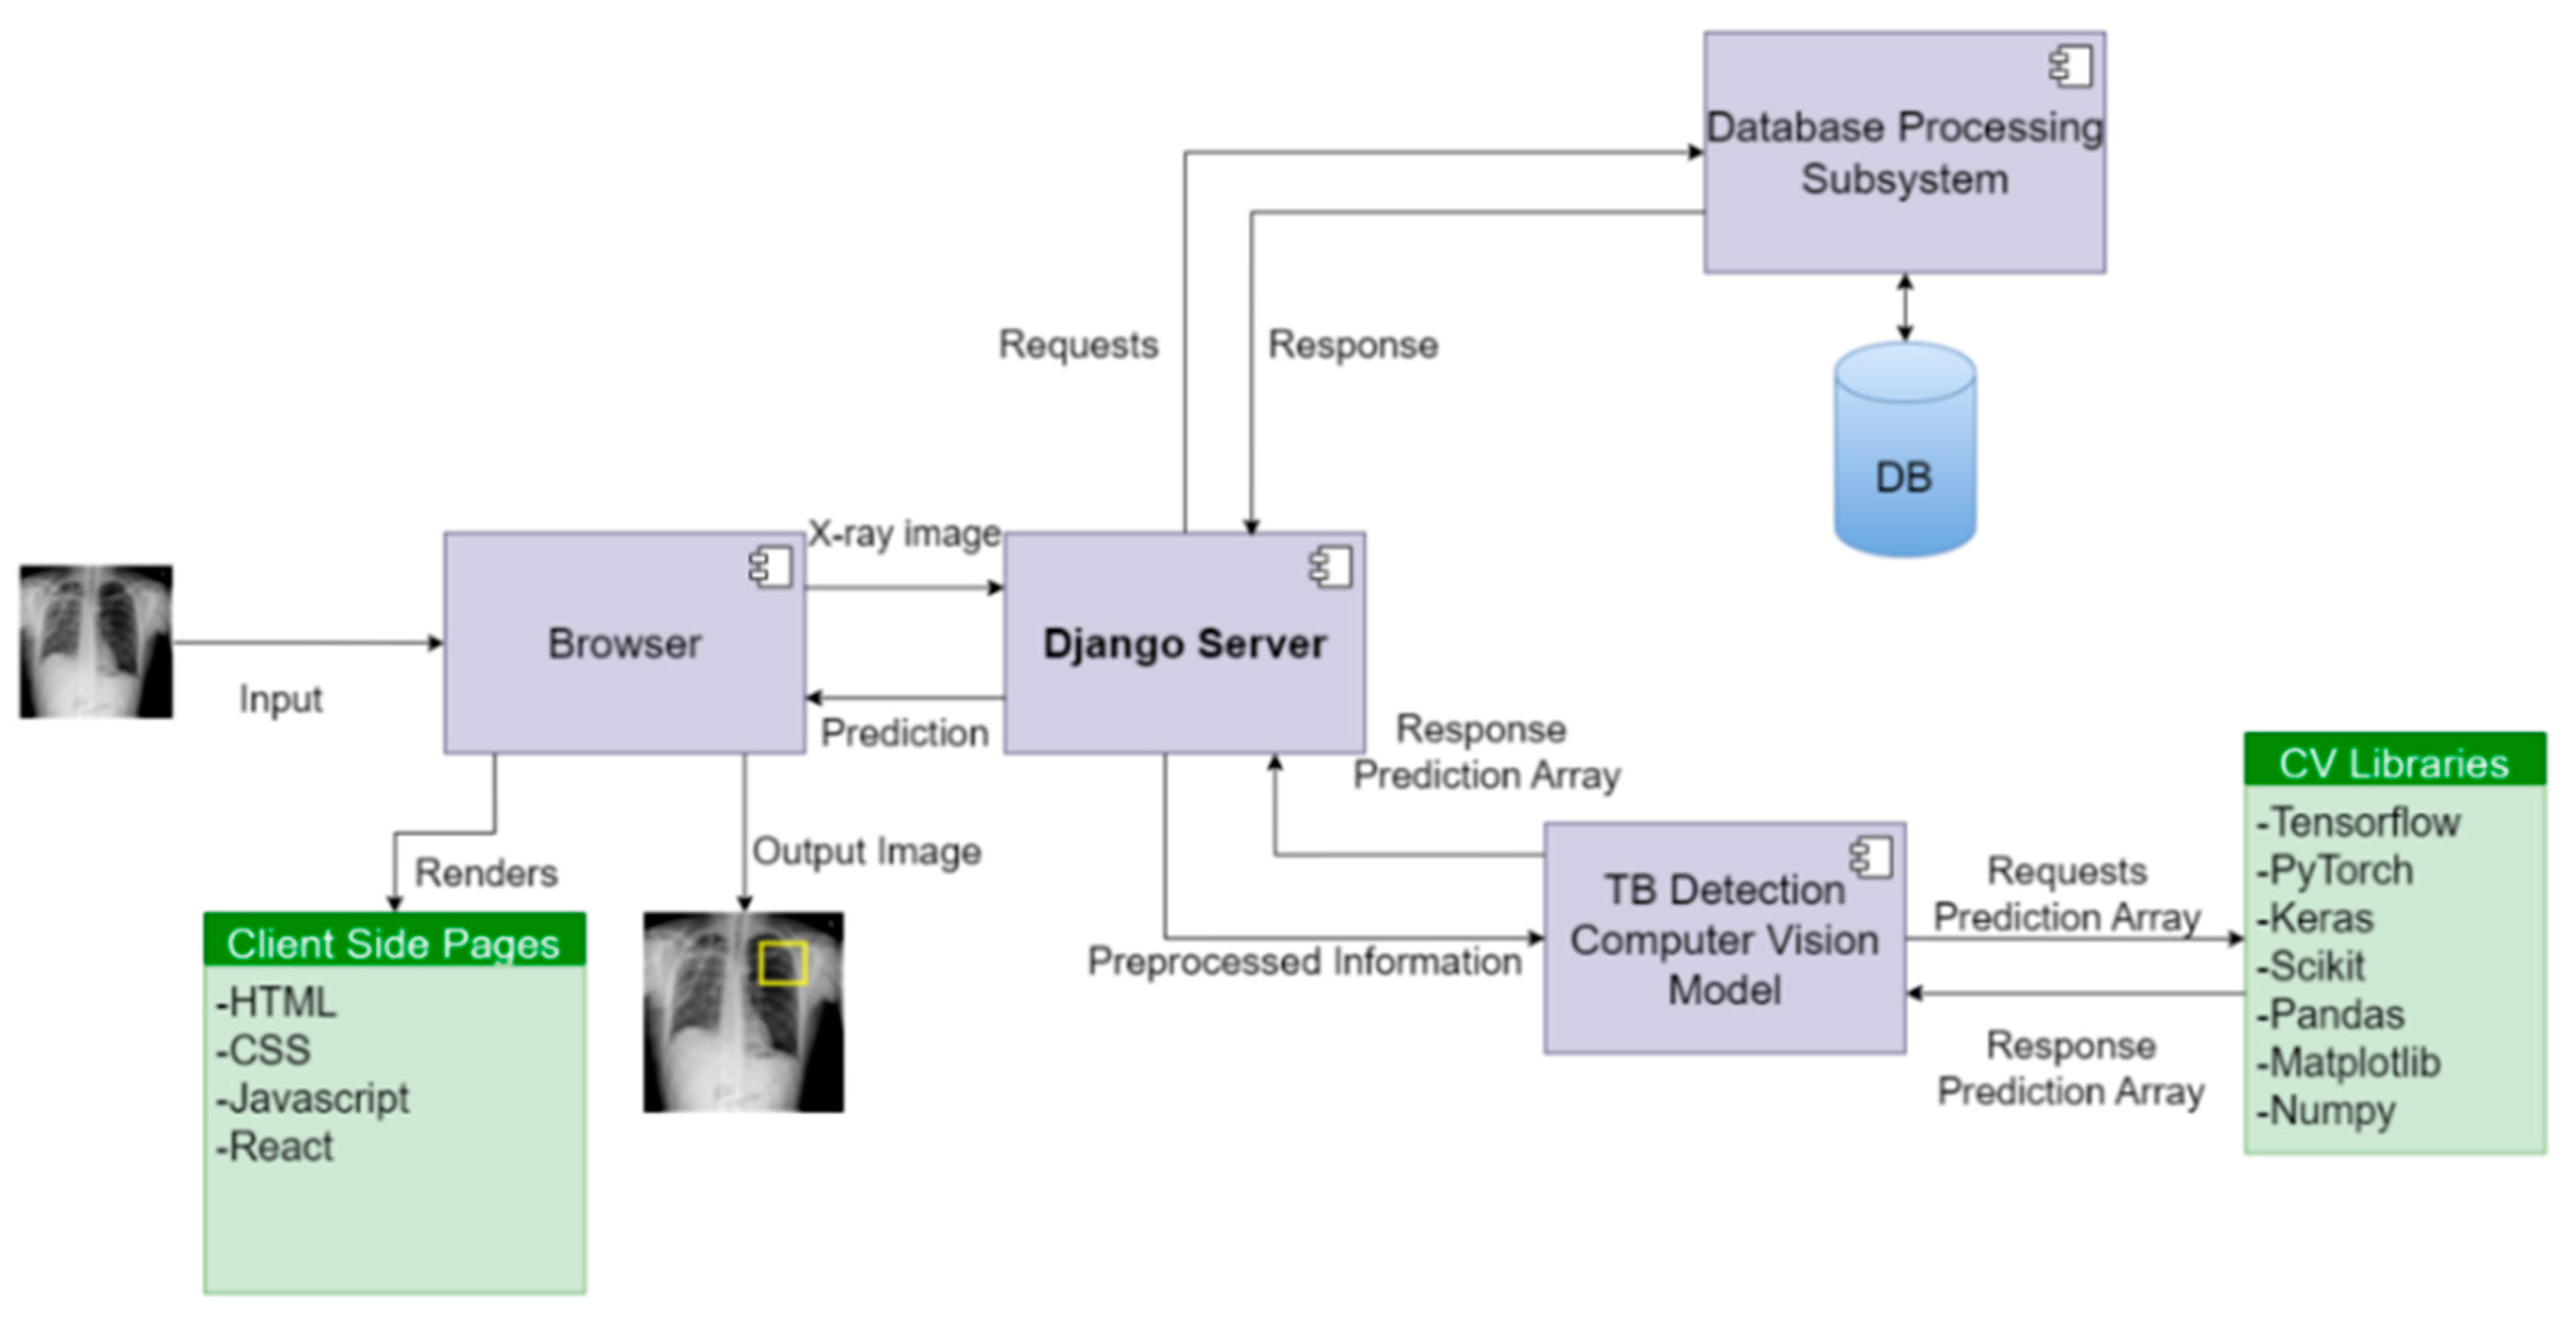
The architectural design of the system in
Figure 2 revolves around distinct views and routes, aligning with specific functionalities of the computer vision model. The server effectively handles image data received via POST requests, utilizing the TB detection computer vision model to compute potential infection region coordinates. These coordinates are then transmitted to the front end, where the image is rendered with infection predictions. To facilitate communication between the front end and the backend application programming interface (API), the Django REST Framework is employed.
The system ensures ease of use for doctors by incorporating features such as create, retrieve, update, and delete (CRUD) functionality, thereby enhancing accessibility and supporting informed decision-making. In addition, the platform maintains detailed records of each doctor’s interactions, enabling further analysis of infections.
The backend server relies on the Postgresql database engine, while pivotal libraries like TensorFlow, Scikit, Keras, PyTorch, Pandas, and NumPy are utilized to effectively serve the model. This configuration allows for the seamless integration of CAD software, thereby augmenting the analysis of TB infections in medical imaging.
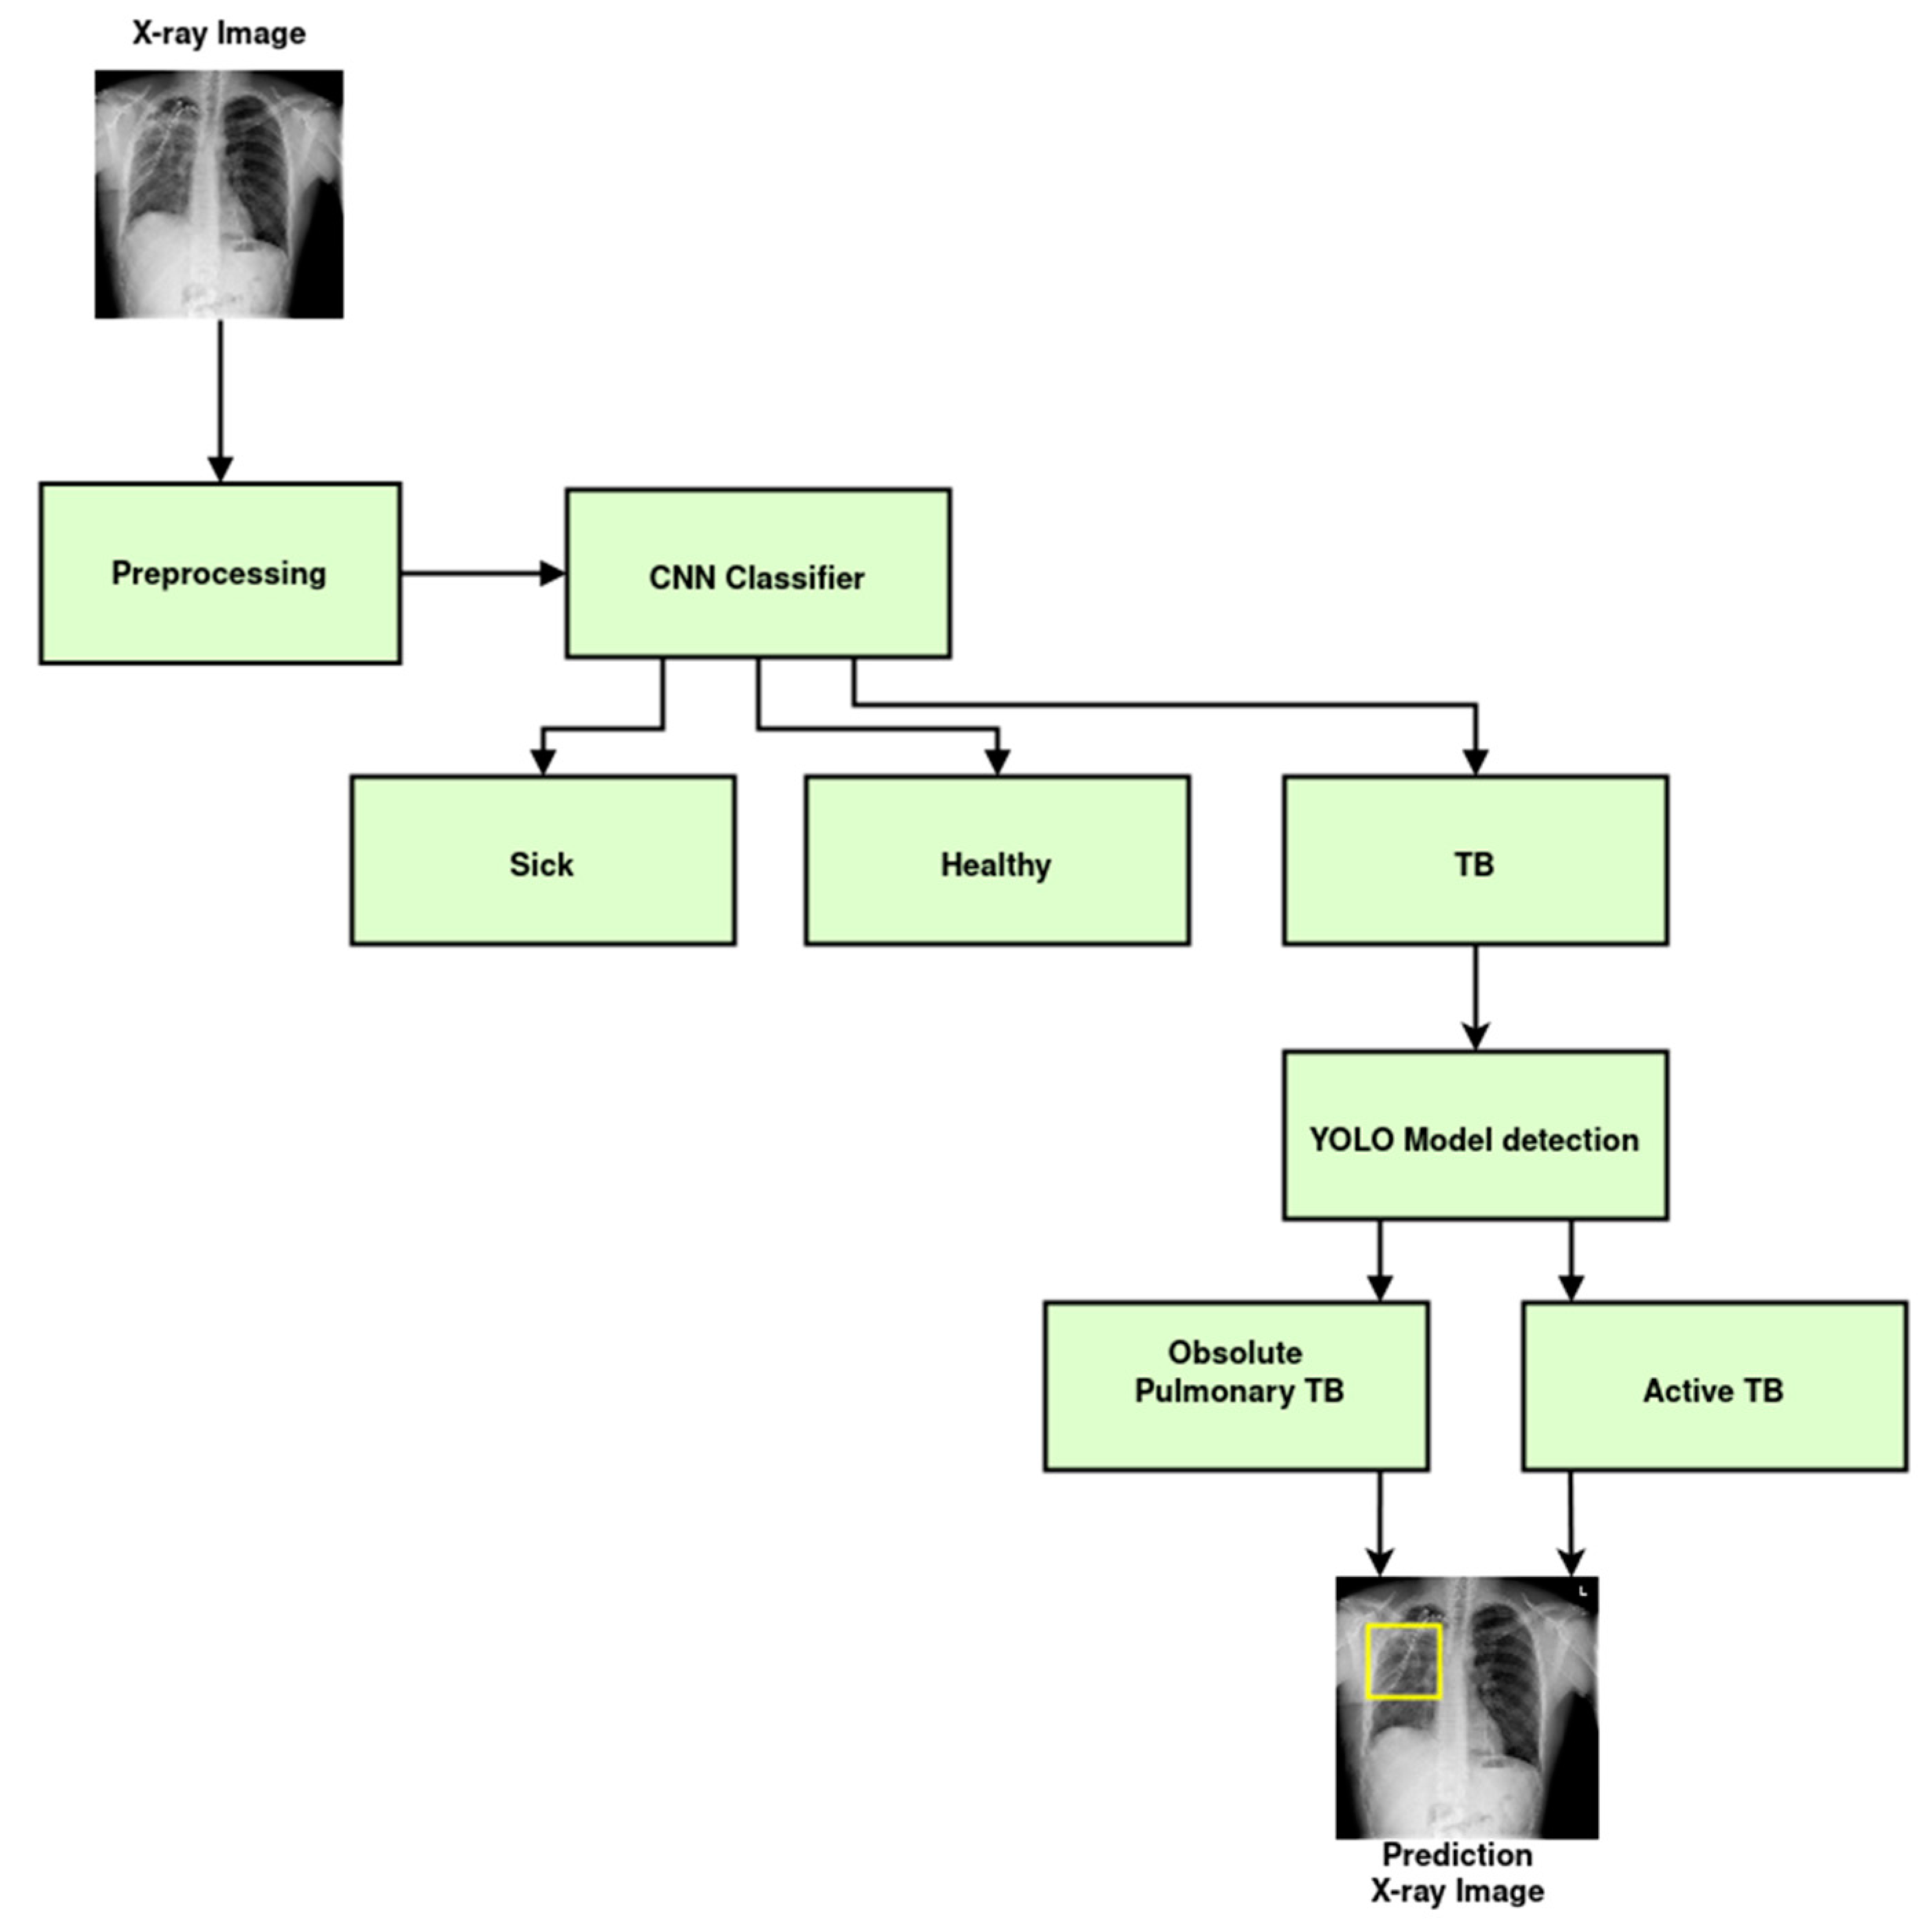
Figure 3 illustrates the schematics of the deep-learning models for TB classification and detection. First and foremost, the image preprocessing was performed to improve the image quality, reduce noise, and standardize the format of the X-ray images. To determine whether the X-ray depicts a sick patient, a healthy patient, or a patient with TB, a CNN was employed. The model was trained on a labeled dataset that contained X-ray pictures of patients with and without TB after the CNN determined that the patient had been diagnosed with TB. Assuming the infection classification task was effective, the next phase involved locating and identifying items in an X-ray by employing the YOLO object detection technique. In this instance, it was used to identify particular TB subtypes in the X-ray pictures, such as pulmonary TB and obsolete TB. An extensive and varied dataset of X-ray pictures with associated labels for which X-rays were tagged and were necessary for an accurate diagnosis. Deep-learning-based medical image analysis has demonstrated considerable promise for supporting medical practitioners with early diagnosis and therapy planning. However, it is essential to validate the models and ensure they are integrated into the medical workflow responsibly to avoid any potential harm caused by misdiagnosis.
5. Conclusions and Future Work
In this research study, we have presented a comprehensive CAD system for TB detection using advanced deep-learning models and computer vision techniques. TB continues to be a global health concern due to its contagious nature and severe implications for public health. Chest X-rays are widely used for screening, but the accuracy of visual inspection by human experts is limited and time-consuming. Our proposed CAD system aims to overcome these limitations and enhance the diagnostic accuracy for TB detection, thereby facilitating early intervention and reducing transmission risks.
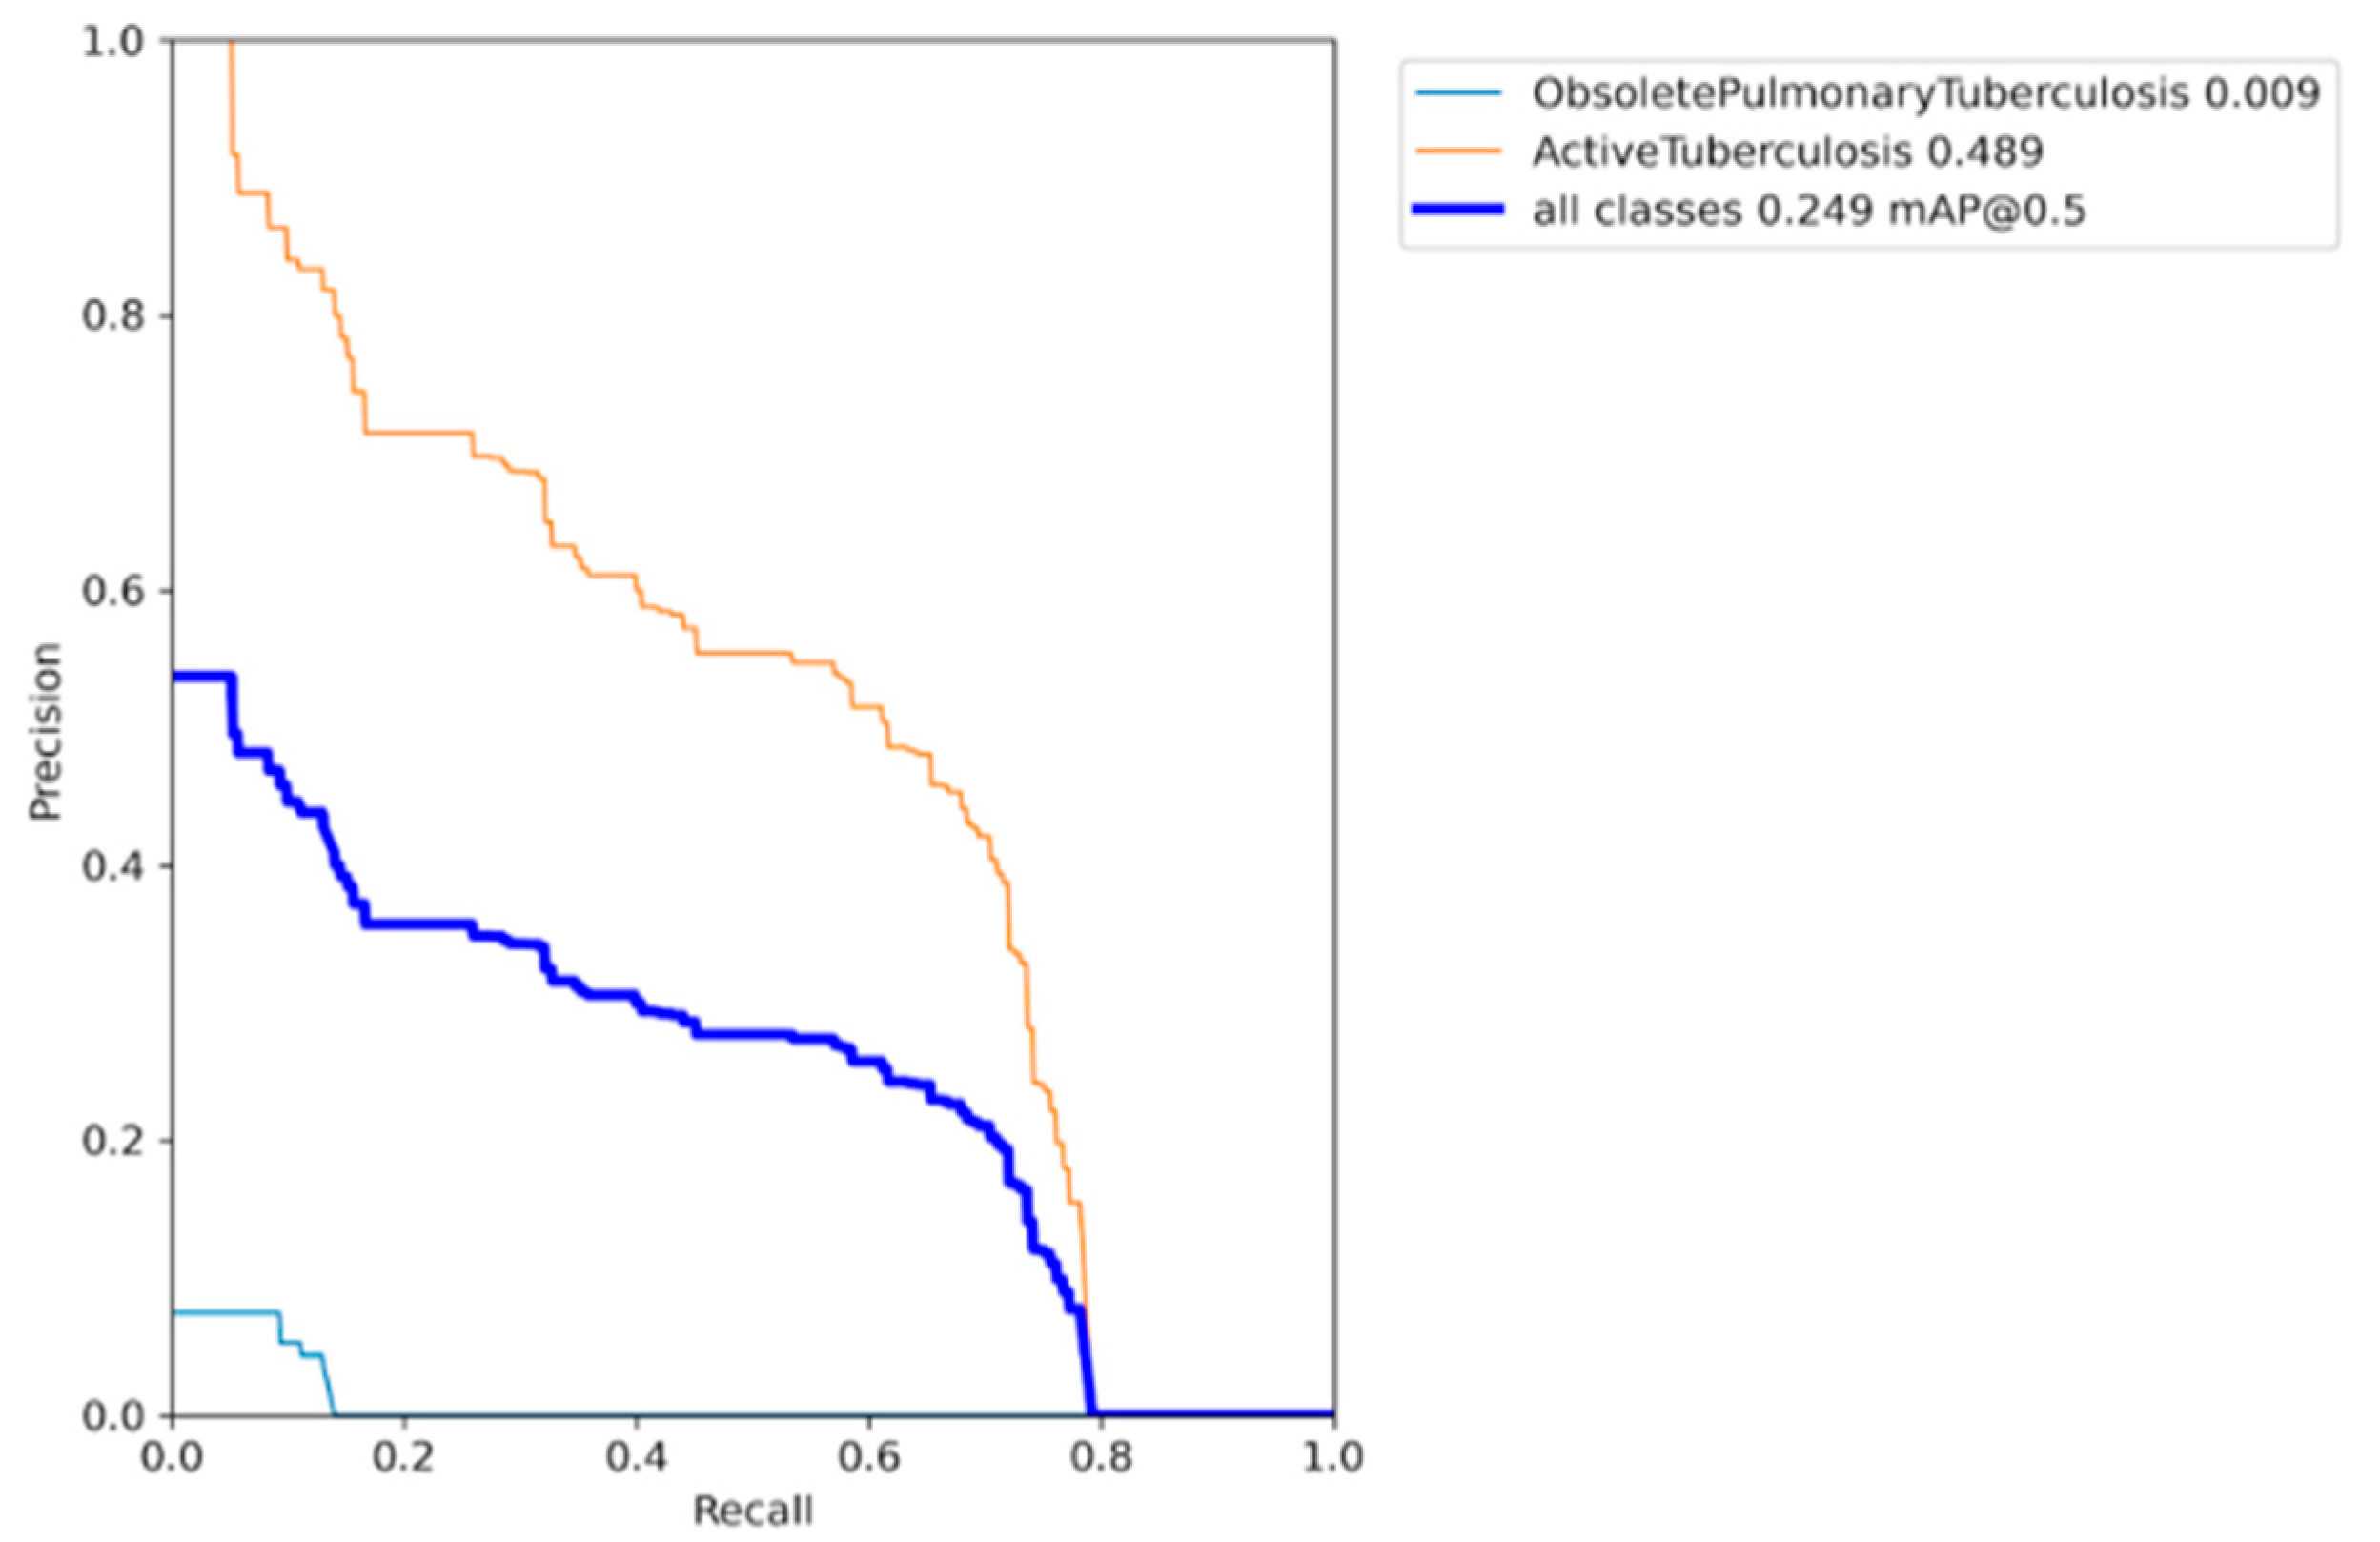
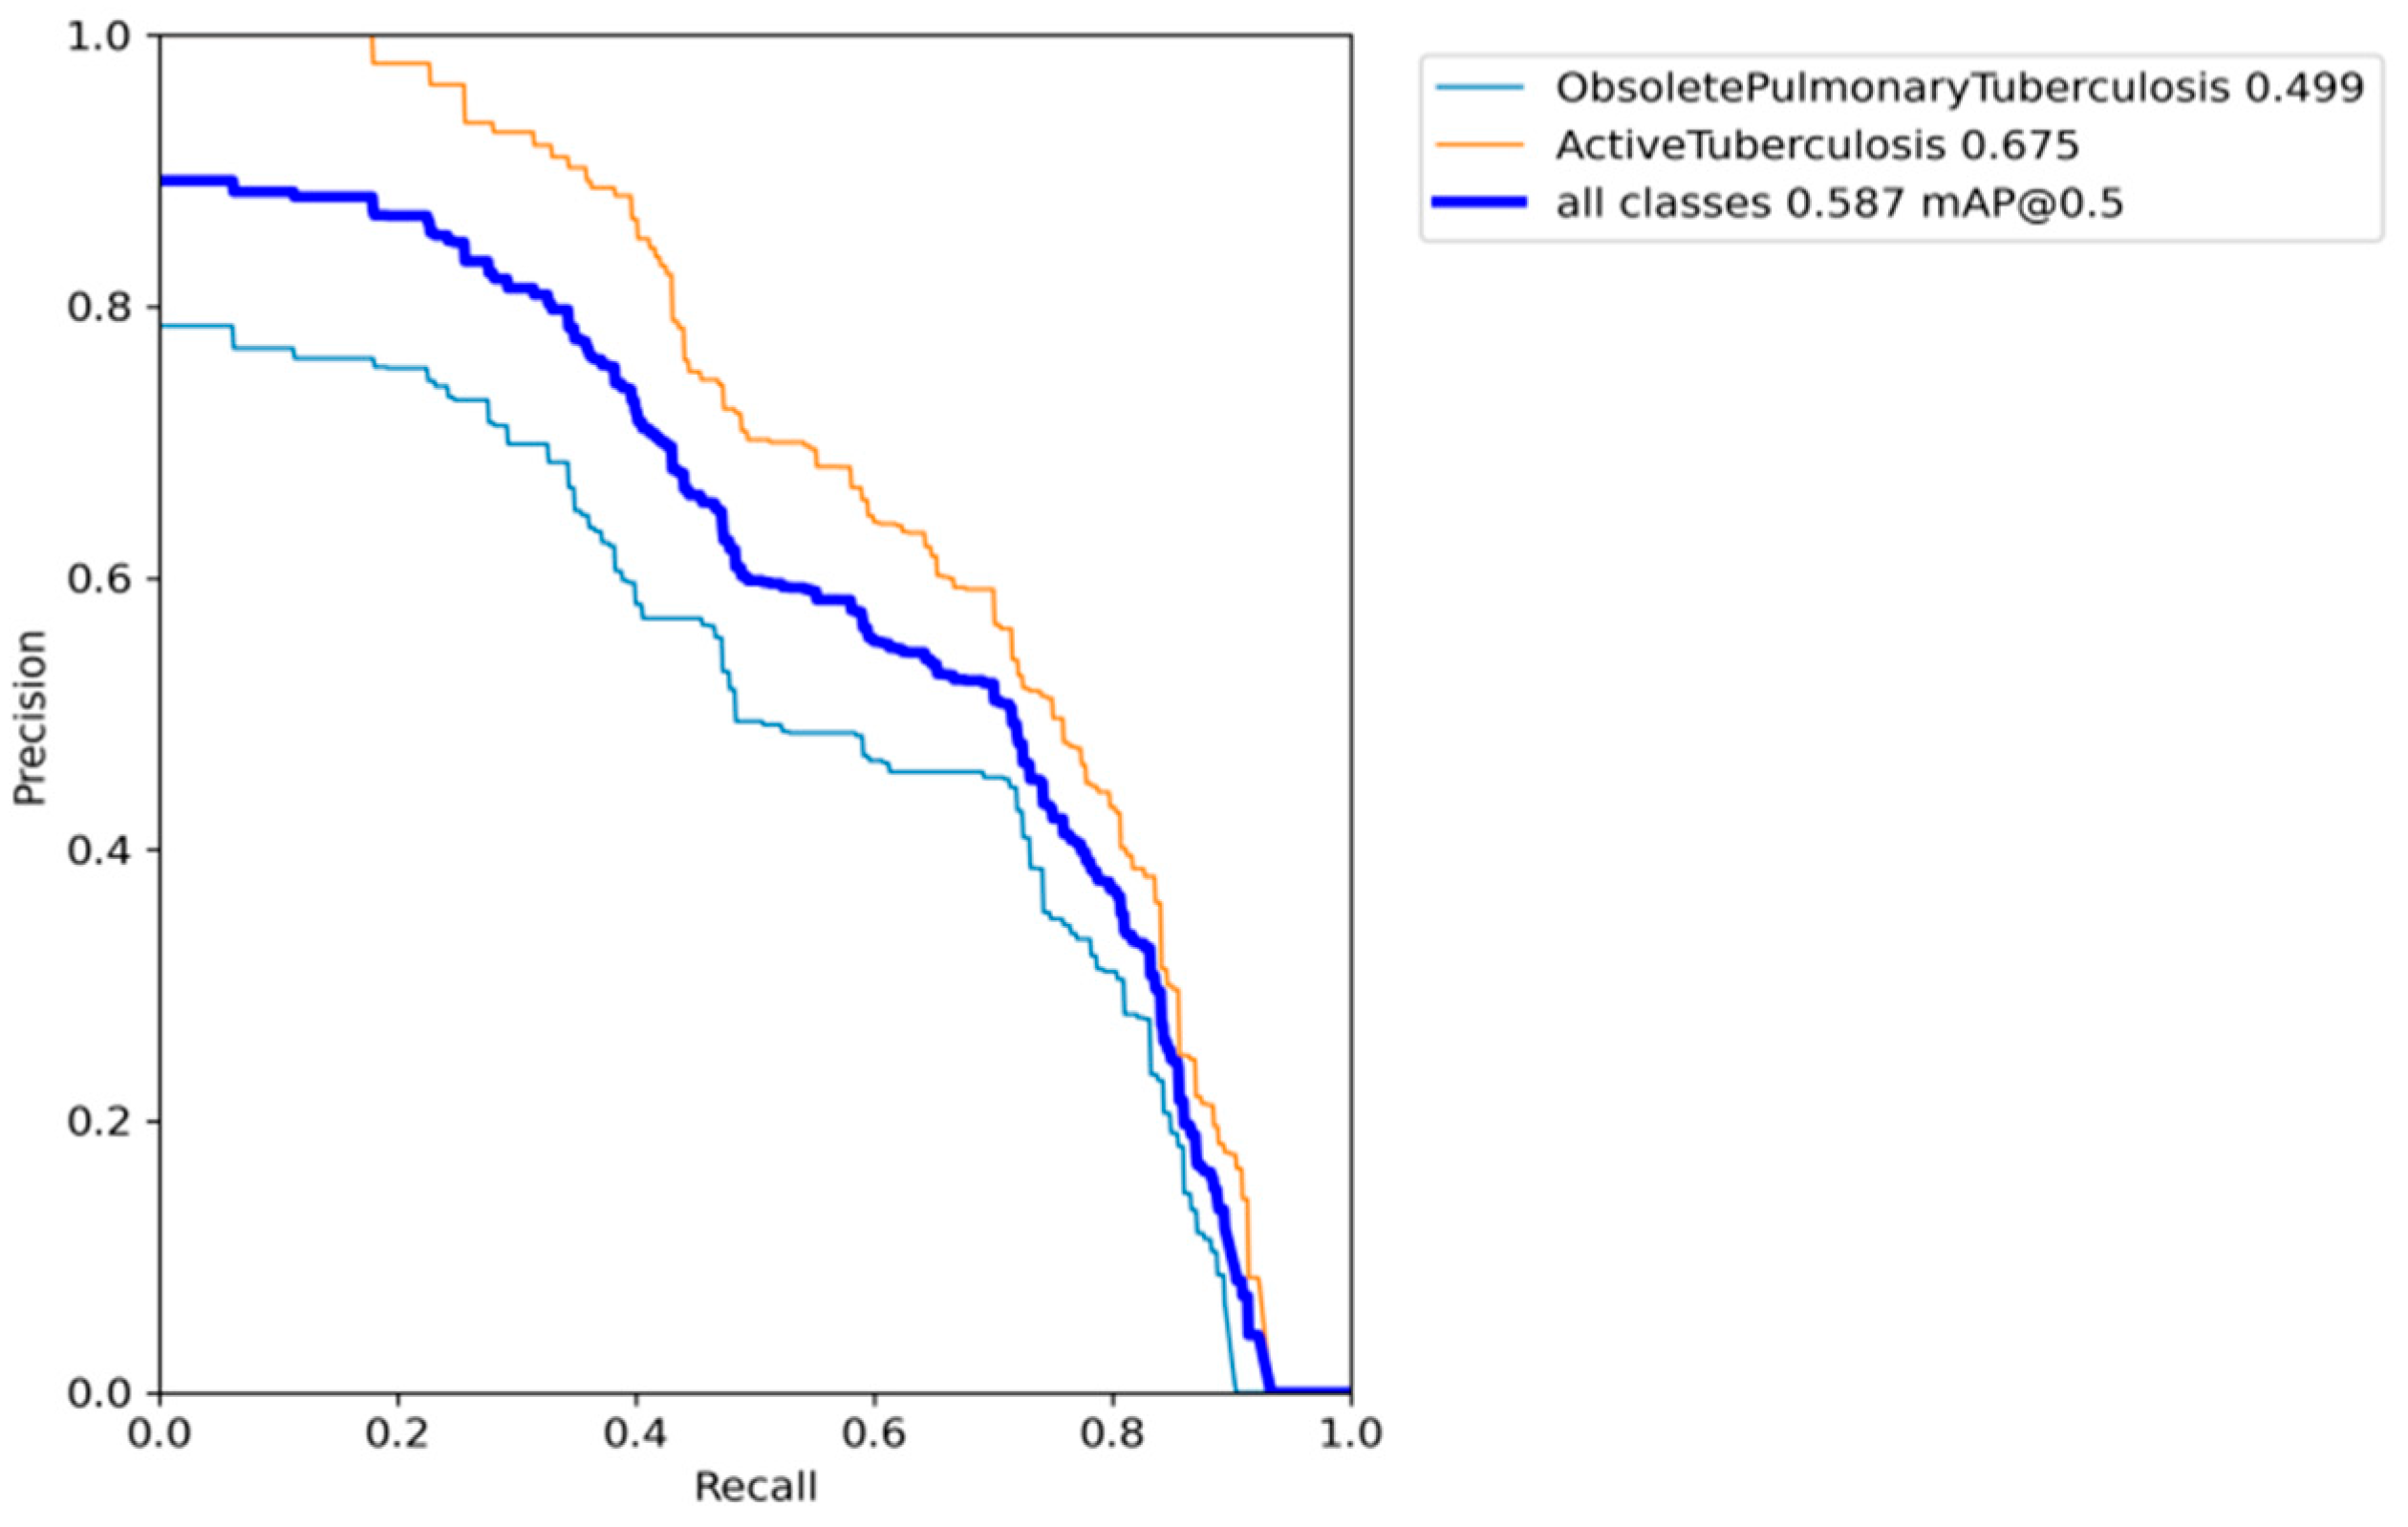
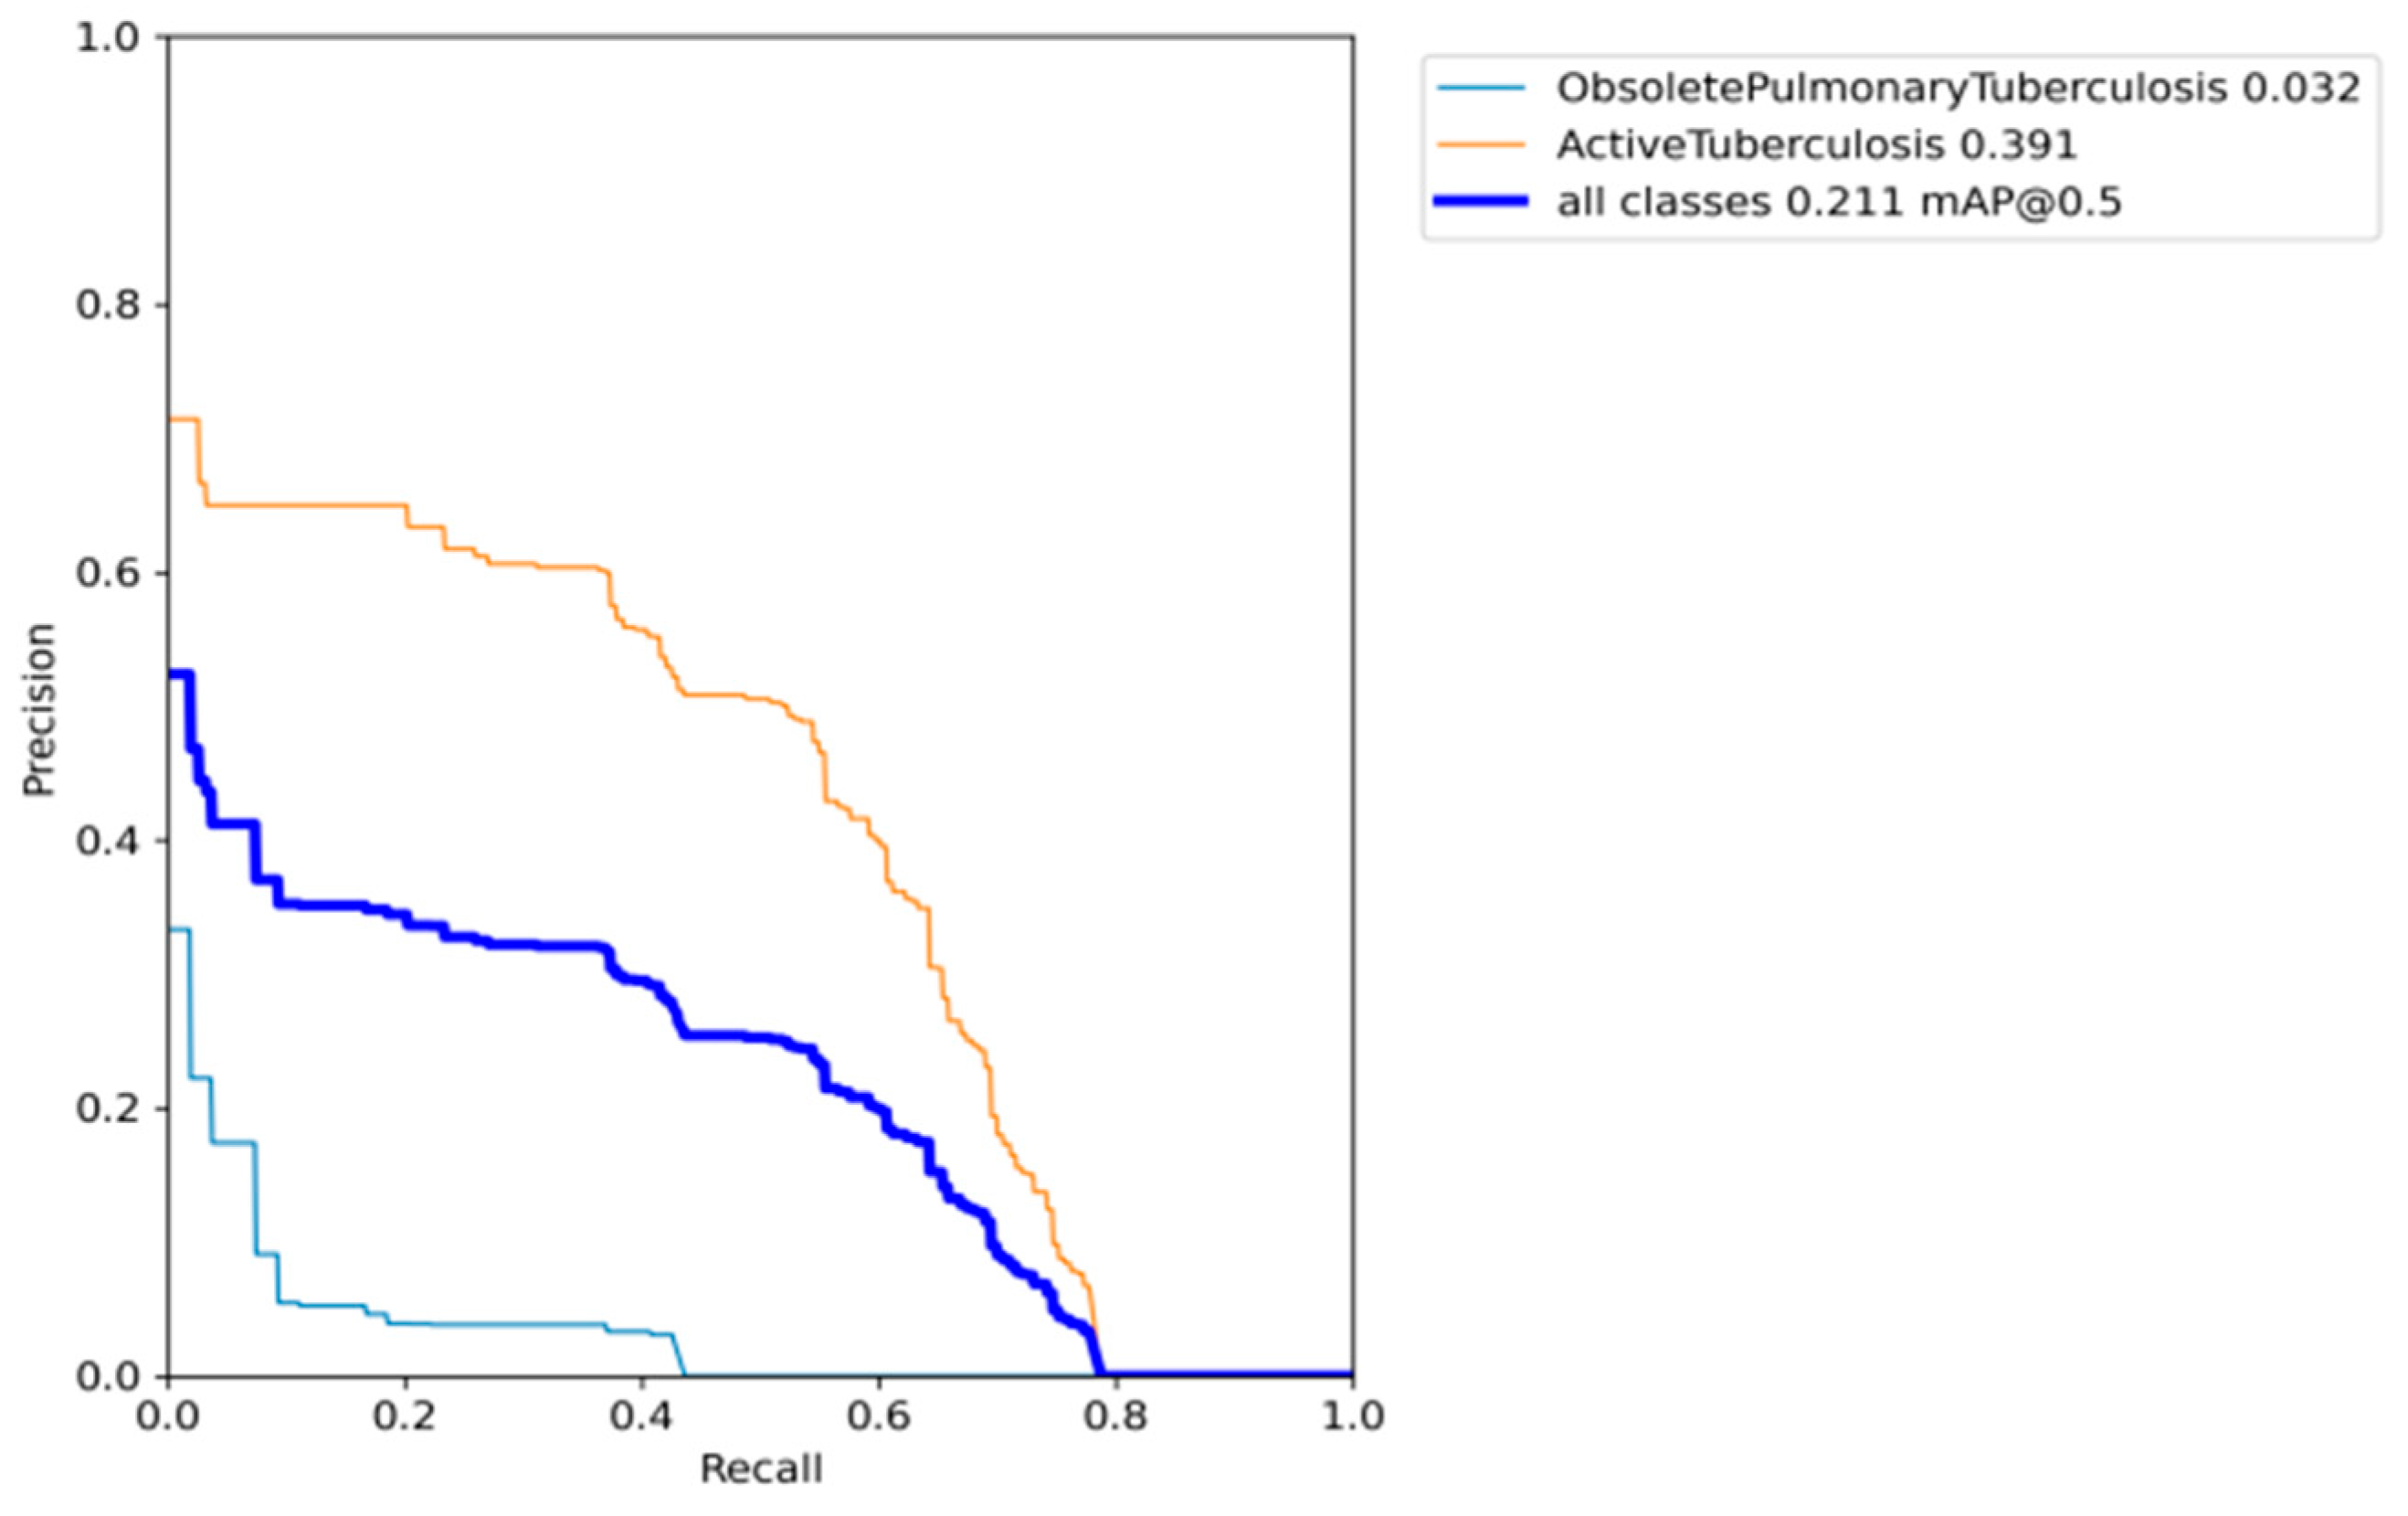
The utilization of CNNs and YOLOv7 architecture enables the accurate detection and classification of TB patterns in chest X-ray images. By leveraging the TBX11K dataset, we demonstrated the effectiveness of the proposed system in distinguishing between active TB and obsolete pulmonary TB cases. Mitigation of data imbalance in the dataset through class weights and data augmentation techniques, including focal loss and image augmentation, resulted in an improved model performance and robust generalization, as illustrated in
Figure 14.
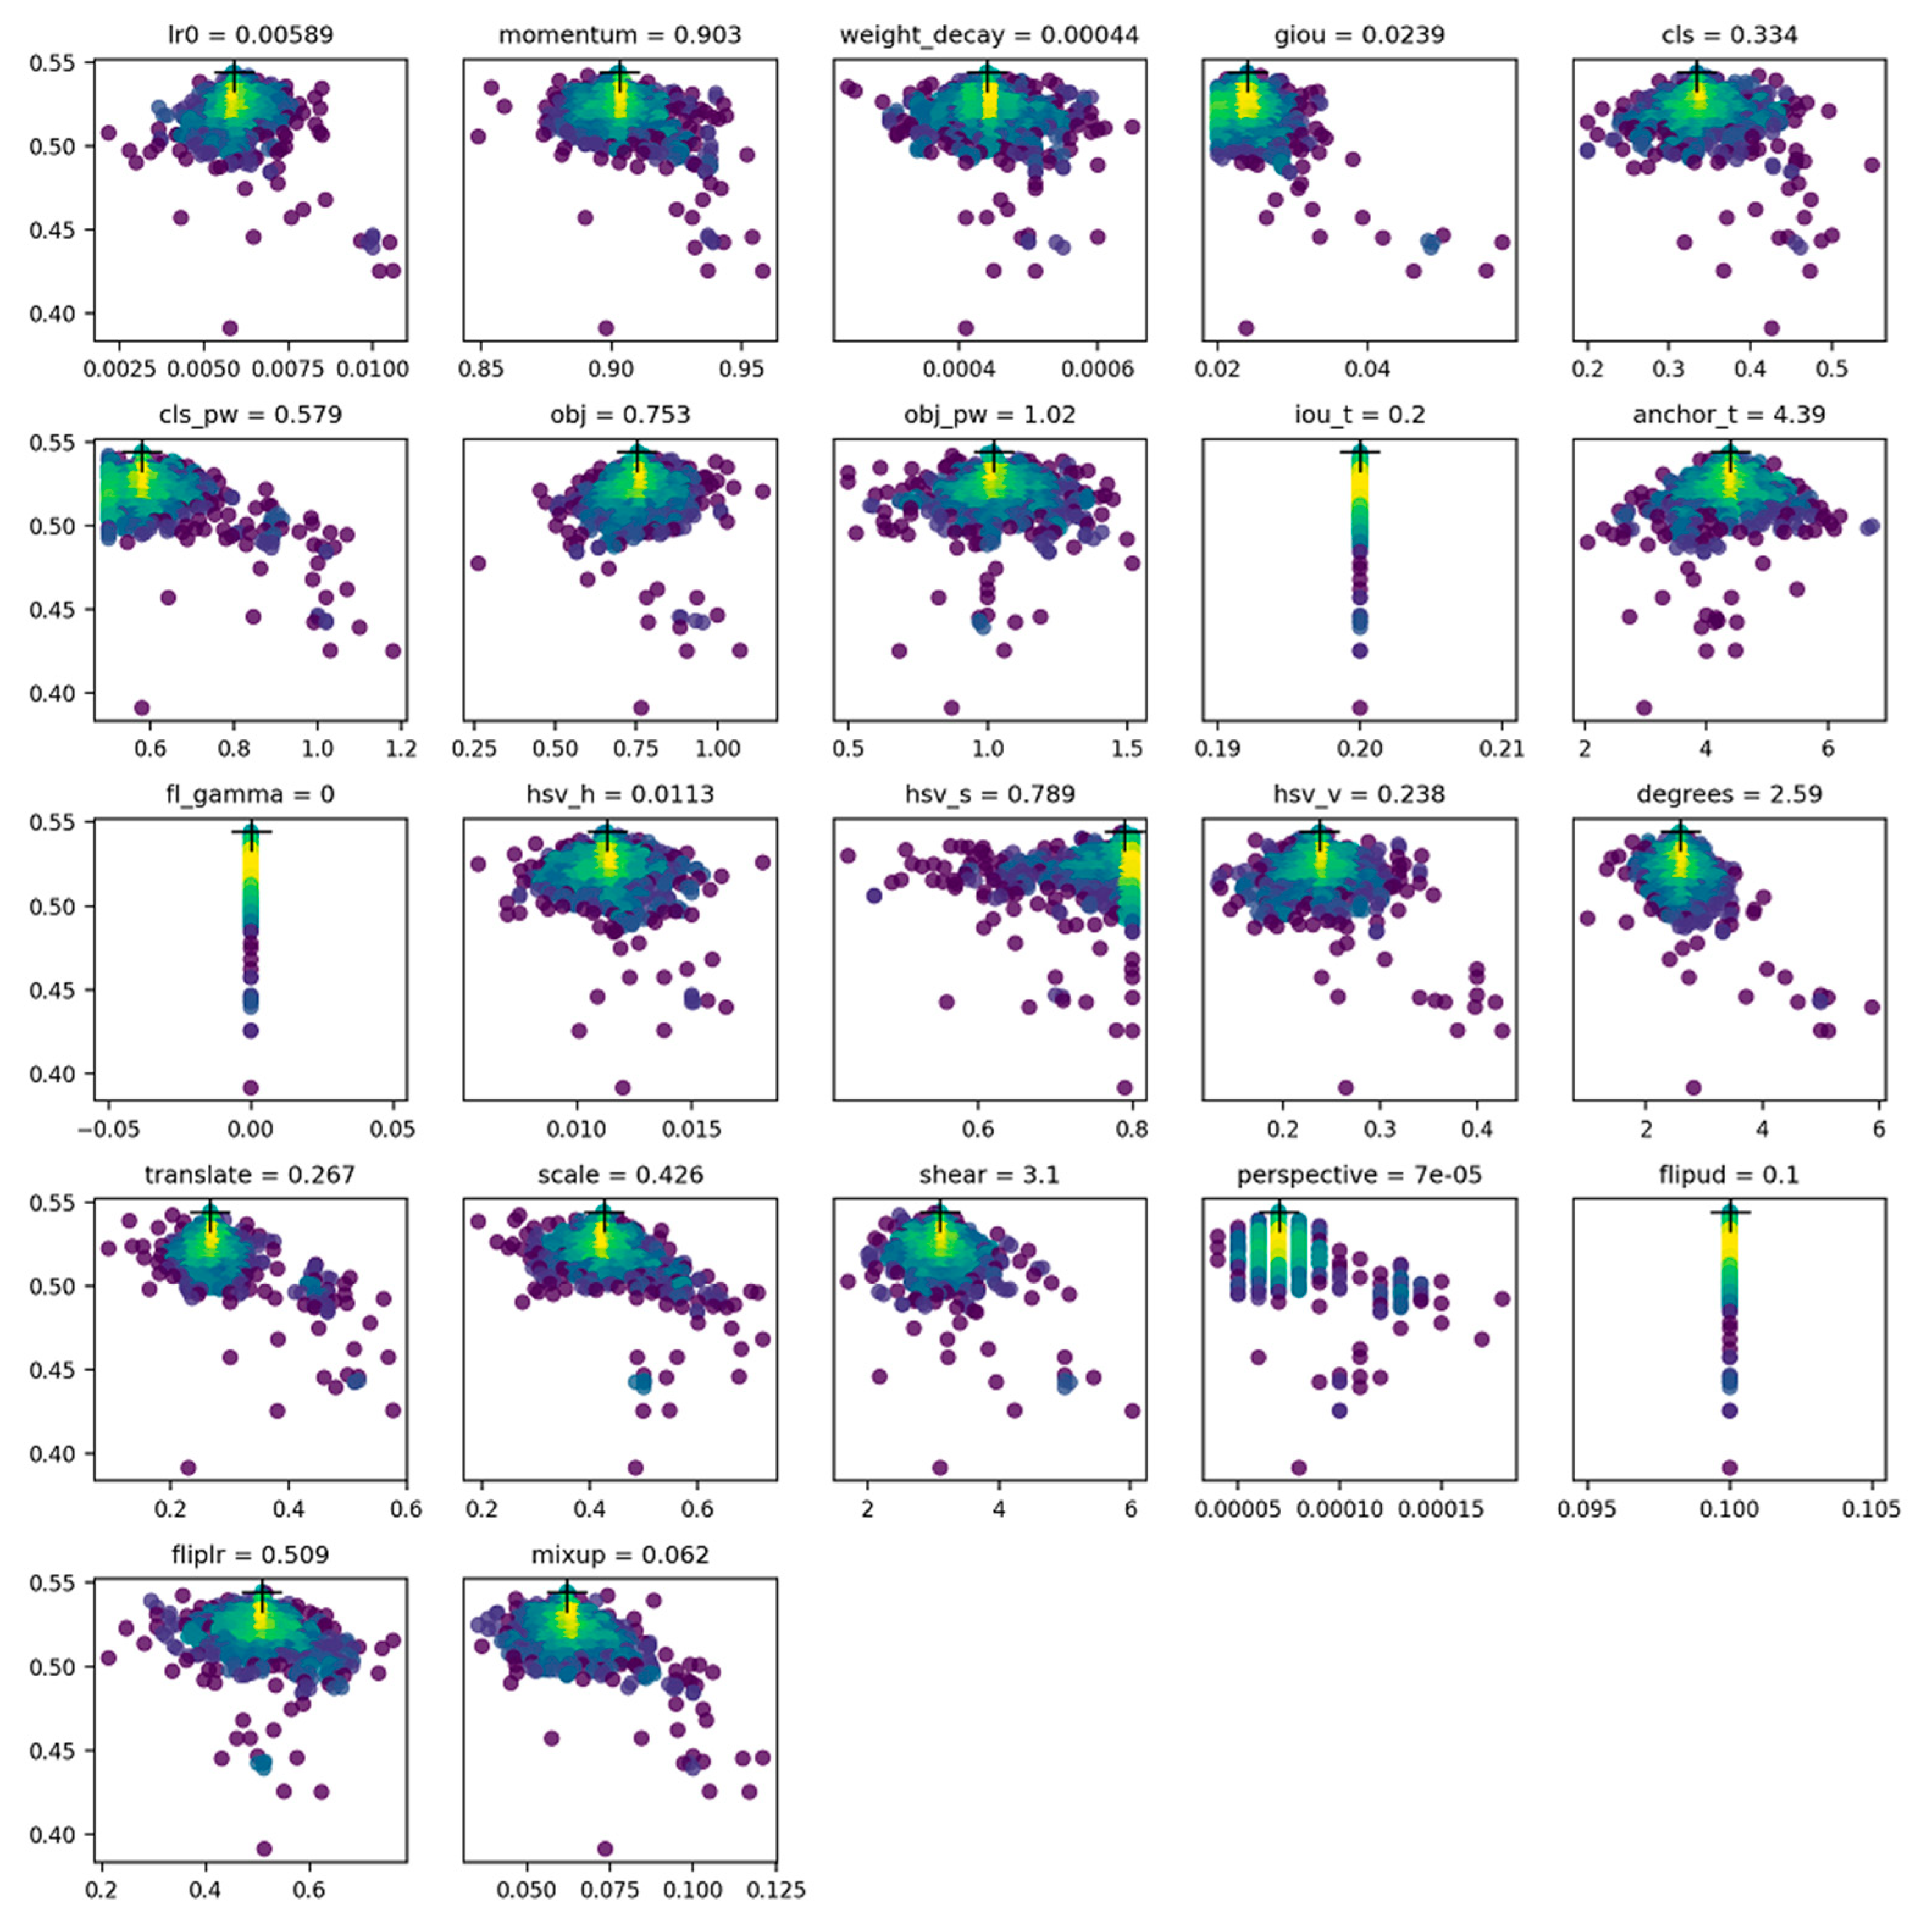
After incorporating genetic algorithms to optimize the hyperparameters in the YOLO model, our research findings indicate that the proposed CAD system achieved a promising mAP of 0.587, as illustrated in
Figure 14. Our model outperforms previous formally recorded models, which are recorded in
Table 1.
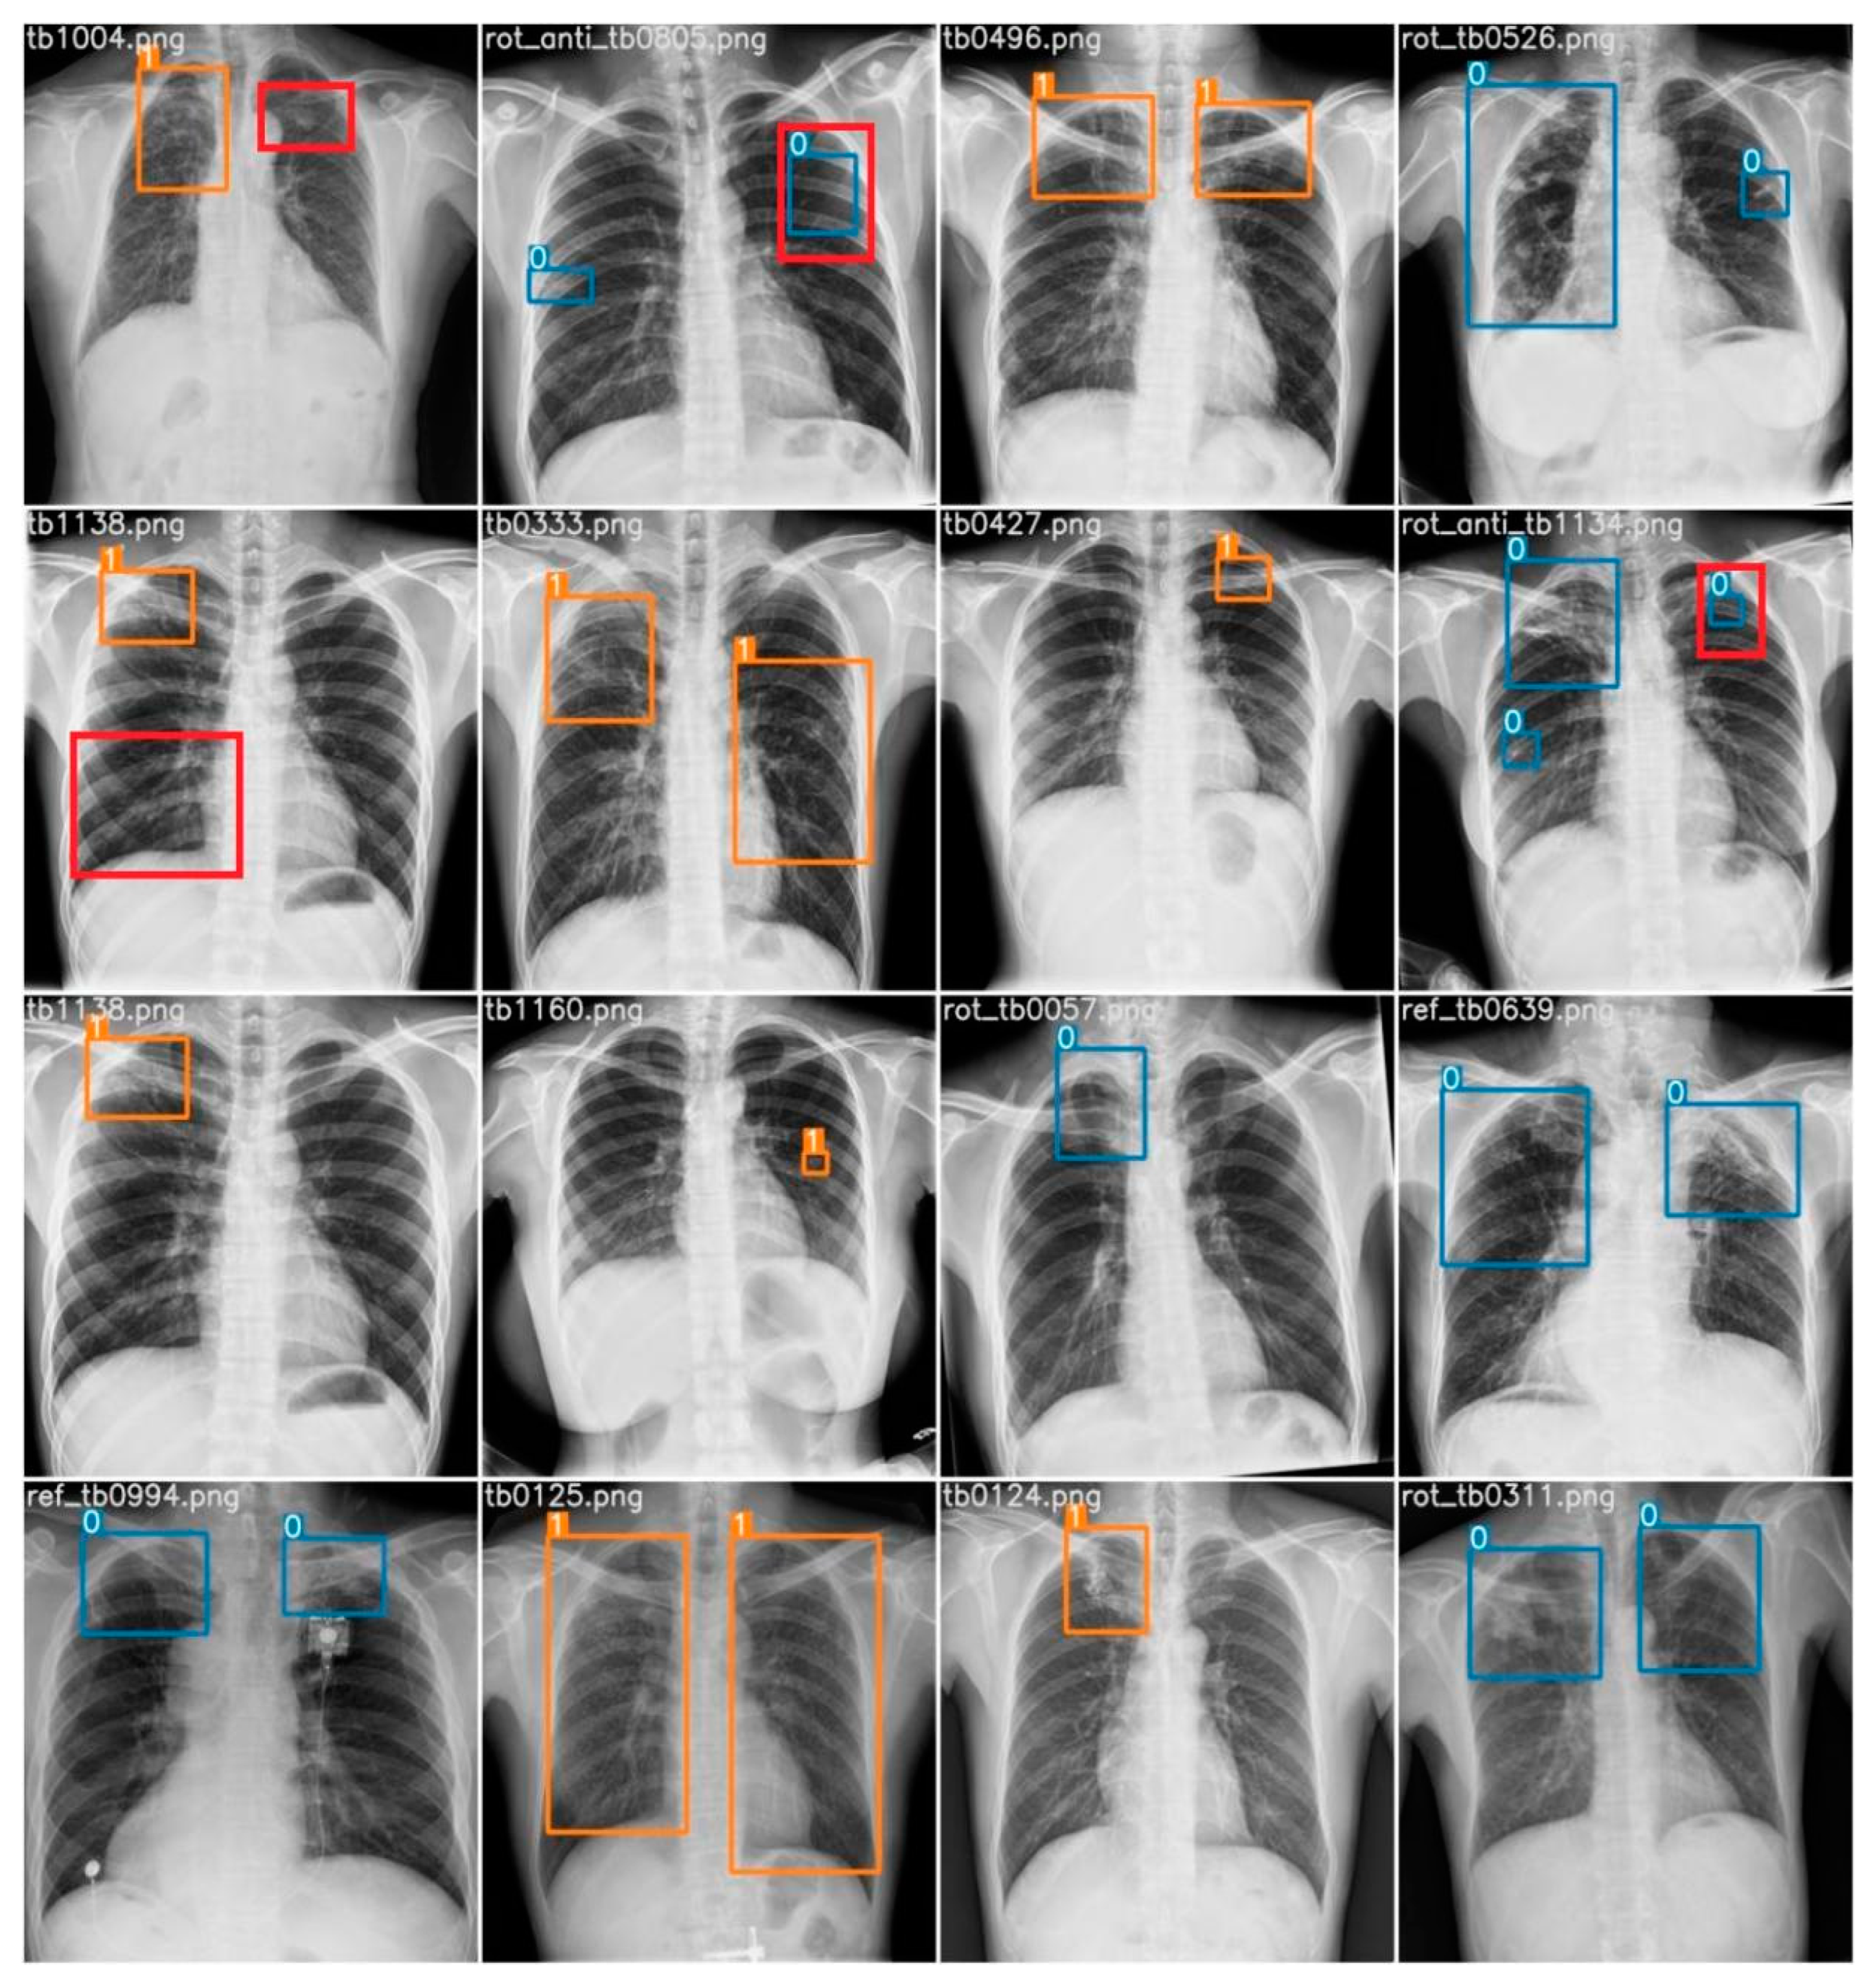
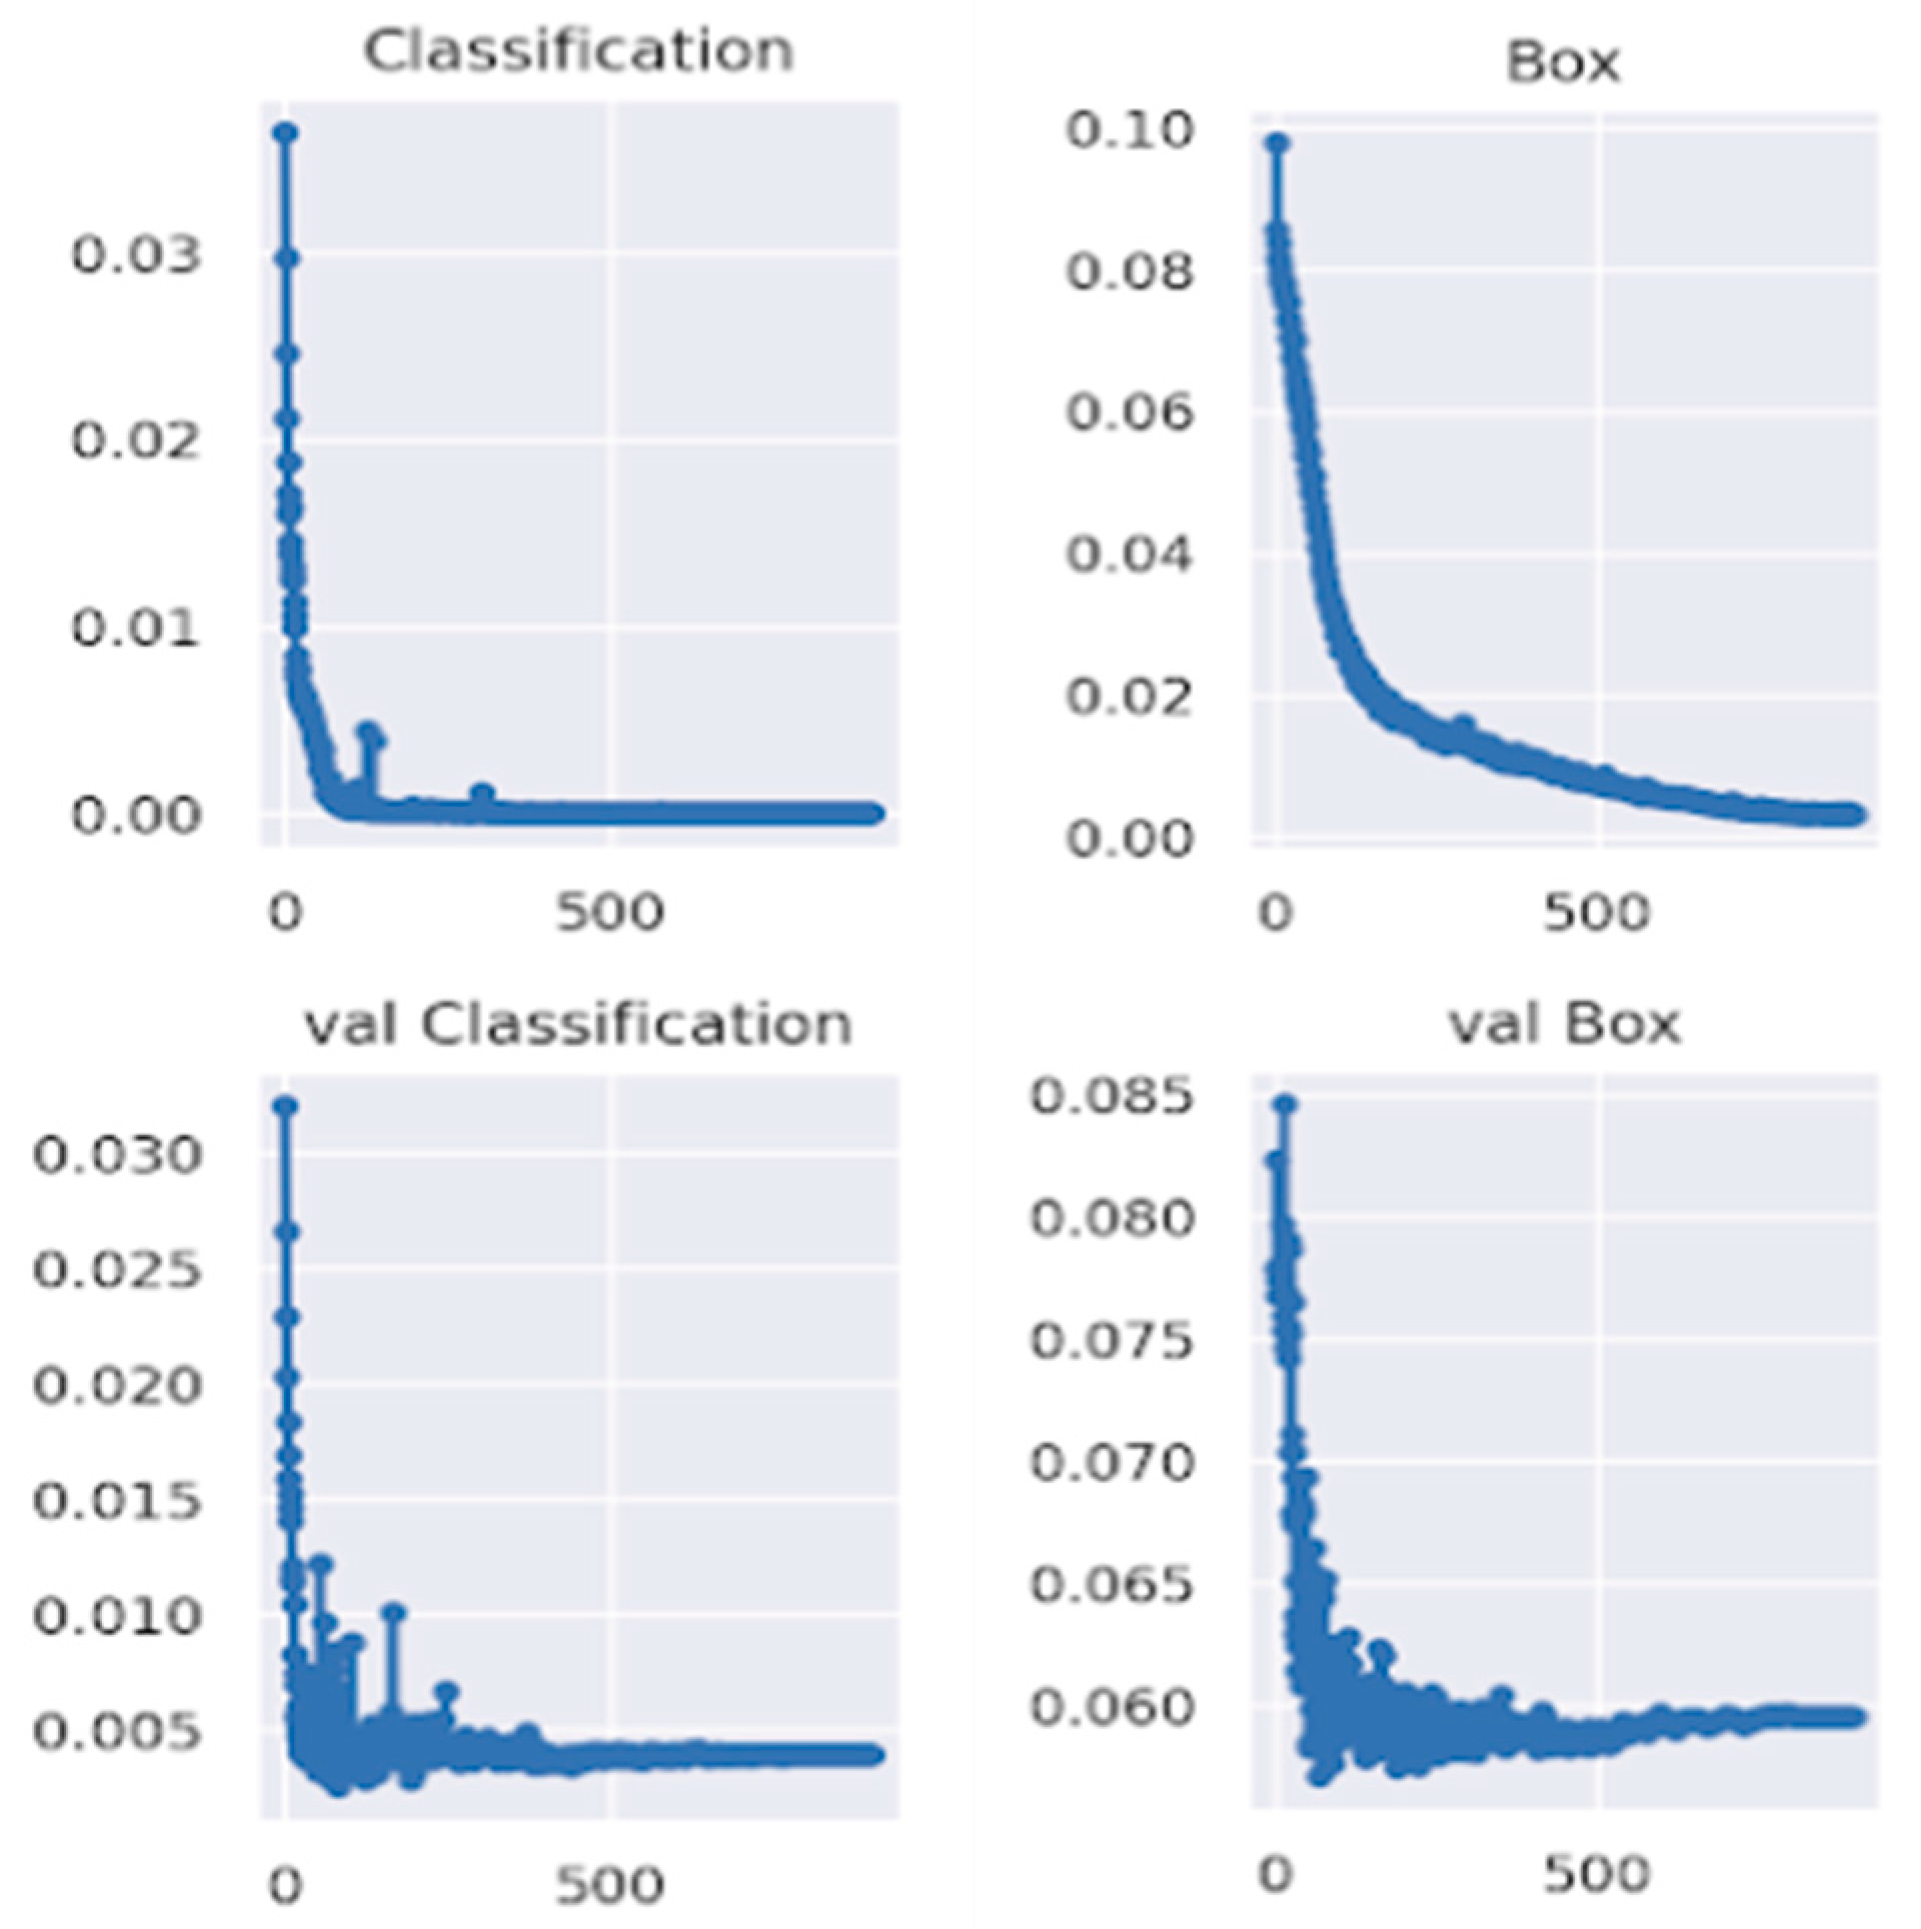
Figure 16 also illustrated that the classification loss generalized well in the validation set with respectable numbers, concluding there was no overfitting of our model for the boundary box classification task. Also, the professional’s evaluation of our model in the randomly chosen test set depicts a decent result and practicality of our model, as shown in
Figure 15. The developed CAD system holds great promise for the medical community, providing a more efficient and accurate approach to TB detection in chest X-rays. With seamless integration through a Django server and leveraging key deep-learning libraries like TensorFlow and PyTorch, our system can aid healthcare professionals in the early identification and diagnosis of TB, potentially leading to improved patient outcomes and reduced disease transmission through effective pattern recognition.
However, it is important to acknowledge that further research and development are necessary to refine and enhance the CAD system for TB detection. One significant challenge is the scarcity of medical data, which poses difficulties for neural network models. By obtaining a more extensive and diverse dataset for training and validation purposes, the performance of the TB detection model can be improved [
31,
32,
33,
34]. It will also help the model to mitigate the slight overfitting of the boundary box prediction loss, as illustrated in
Figure 16.
Incorporating multi-modal data sources, such as clinical information and patient history, can also contribute to enhancing the accuracy and reliability of the CAD system [
35]. By considering a broader range of information and integrating it into the analysis, a more comprehensive understanding of TB patterns and characteristics can be achieved, which might be the interest of future research.
There is also a need for further evaluation of the model’s clinical applicability through a larger prospective study, assessing its impact on clinical outcomes. While our current study did not encompass such a study due to limitations in data and resources available at the time, our approach utilizes existing resources to enhance TB detection technology, positioning it as a relevant tool for pattern recognition.
Importantly, we stress that our model should not replace the expertise of radiologists but serve as an assistive technology. The mAP of 0.587 on the validation set instills confidence in the model’s pattern recognition capabilities, making it a promising assistive tool for radiologists. The claim is further supported by the analysis of our model conducted by a professional radiologist, as presented in
Figure 15. The example result of the model’s predictions on random samples on test set images suggests a fair applicability, strengthening confidence in its potential clinical utility in the context of the pattern recognition of TB infection.


 ,
, 


