


Customer Shopping Behavior Analysis Using RFID and Machine Learning Models

 ,
,  ,
,  ,
,  ,
,
Abstract
:1. Introduction
- We introduced an innovative approach that combines iForest outlier detection, ADASYN data balancing, and Multilayer Perceptron to categorize customer activity, a novel contribution to the field.
- The model’s performance was enhanced through the removal of outliers and balancing of the training dataset.
- We conducted comprehensive comparative experiments, comparing our model to other prediction methods and prior research findings.
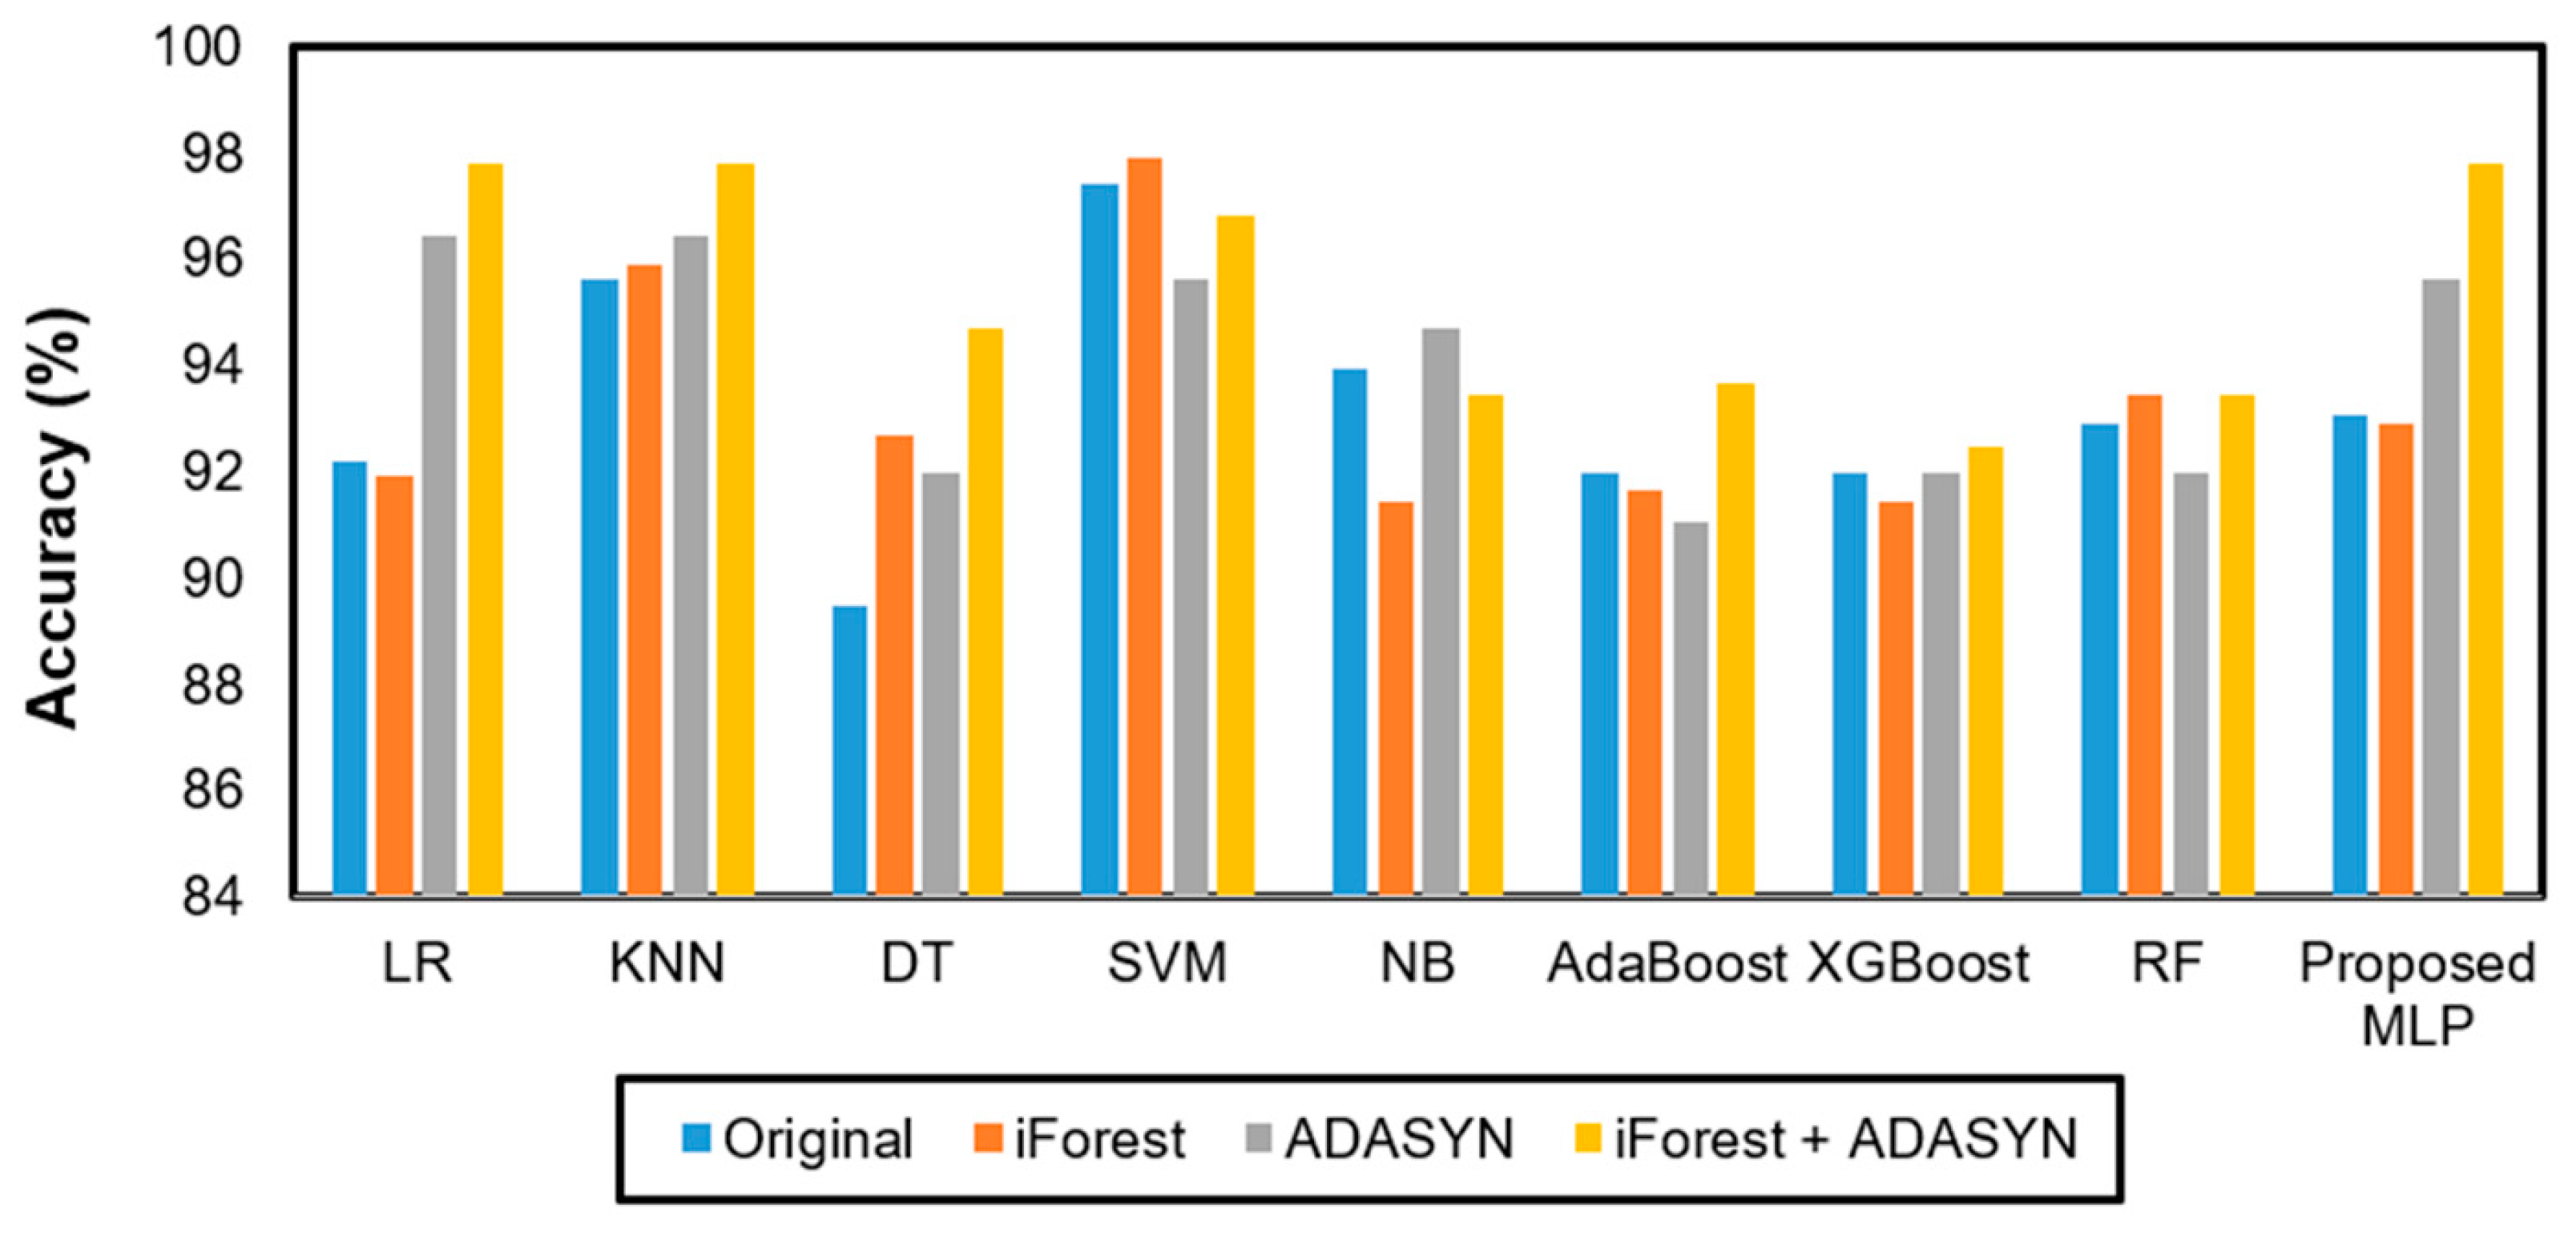
- We analyzed the impact of outlier detection and data balancing methods, both with and without iForest and ADASYN, on the model’s accuracy.
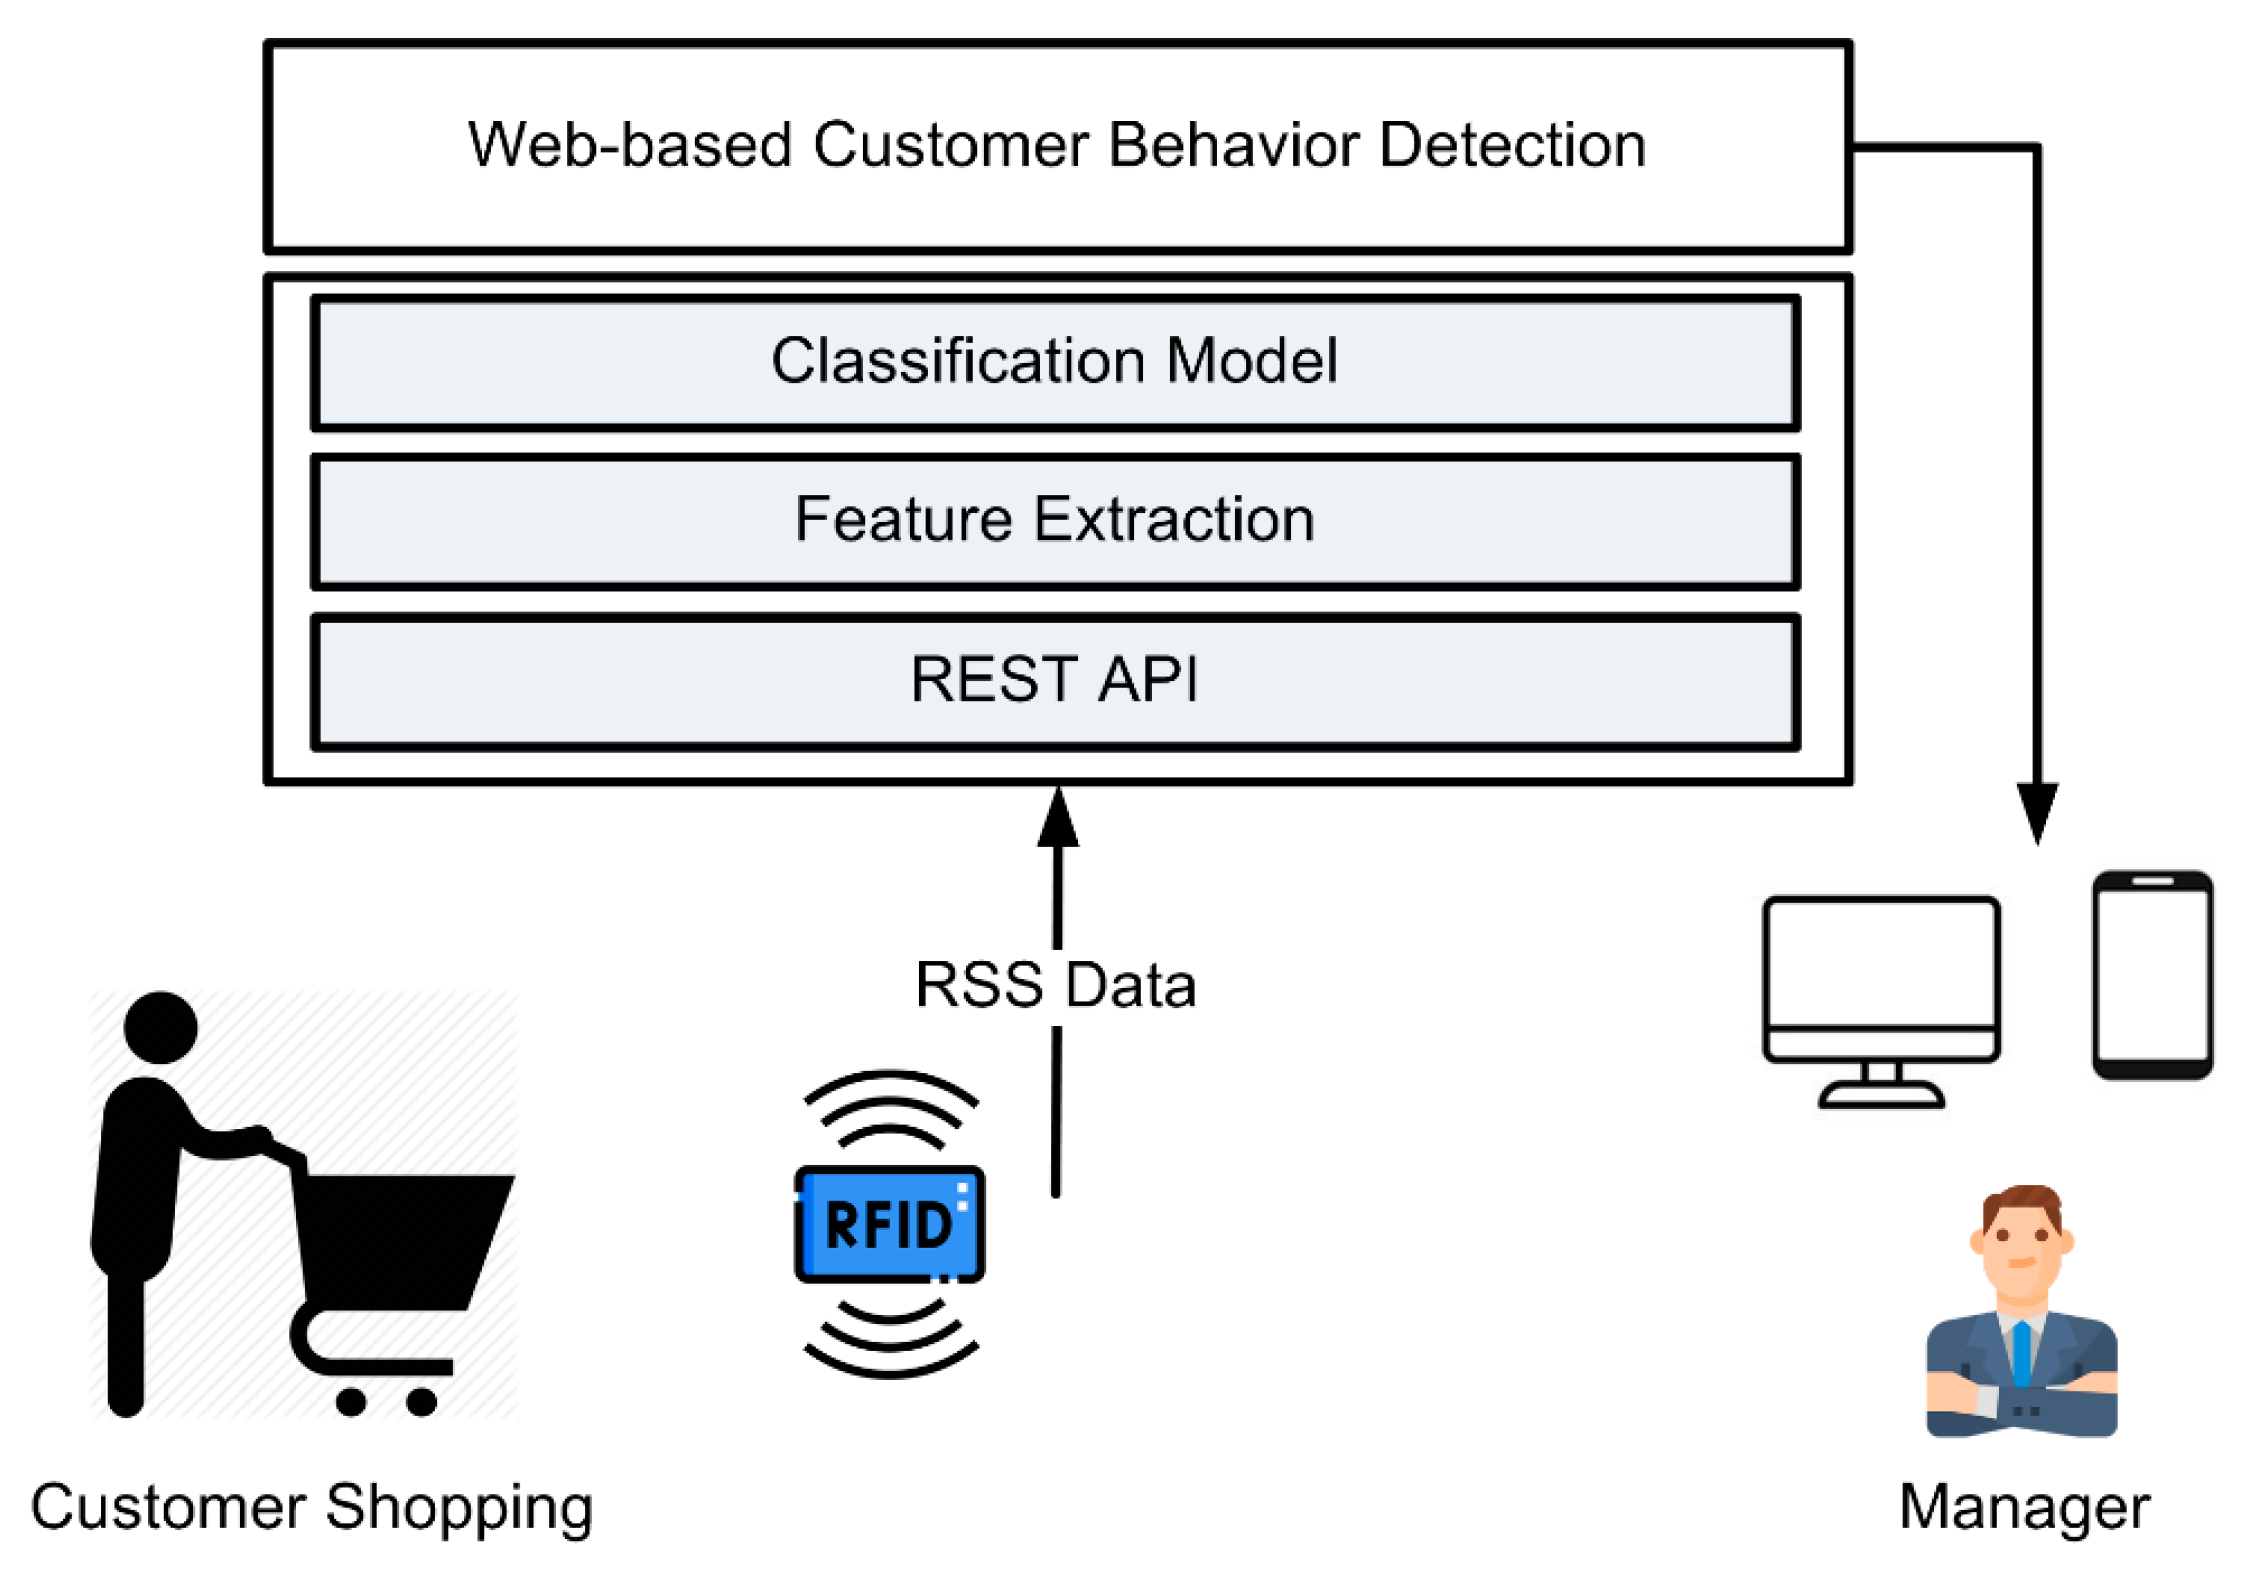
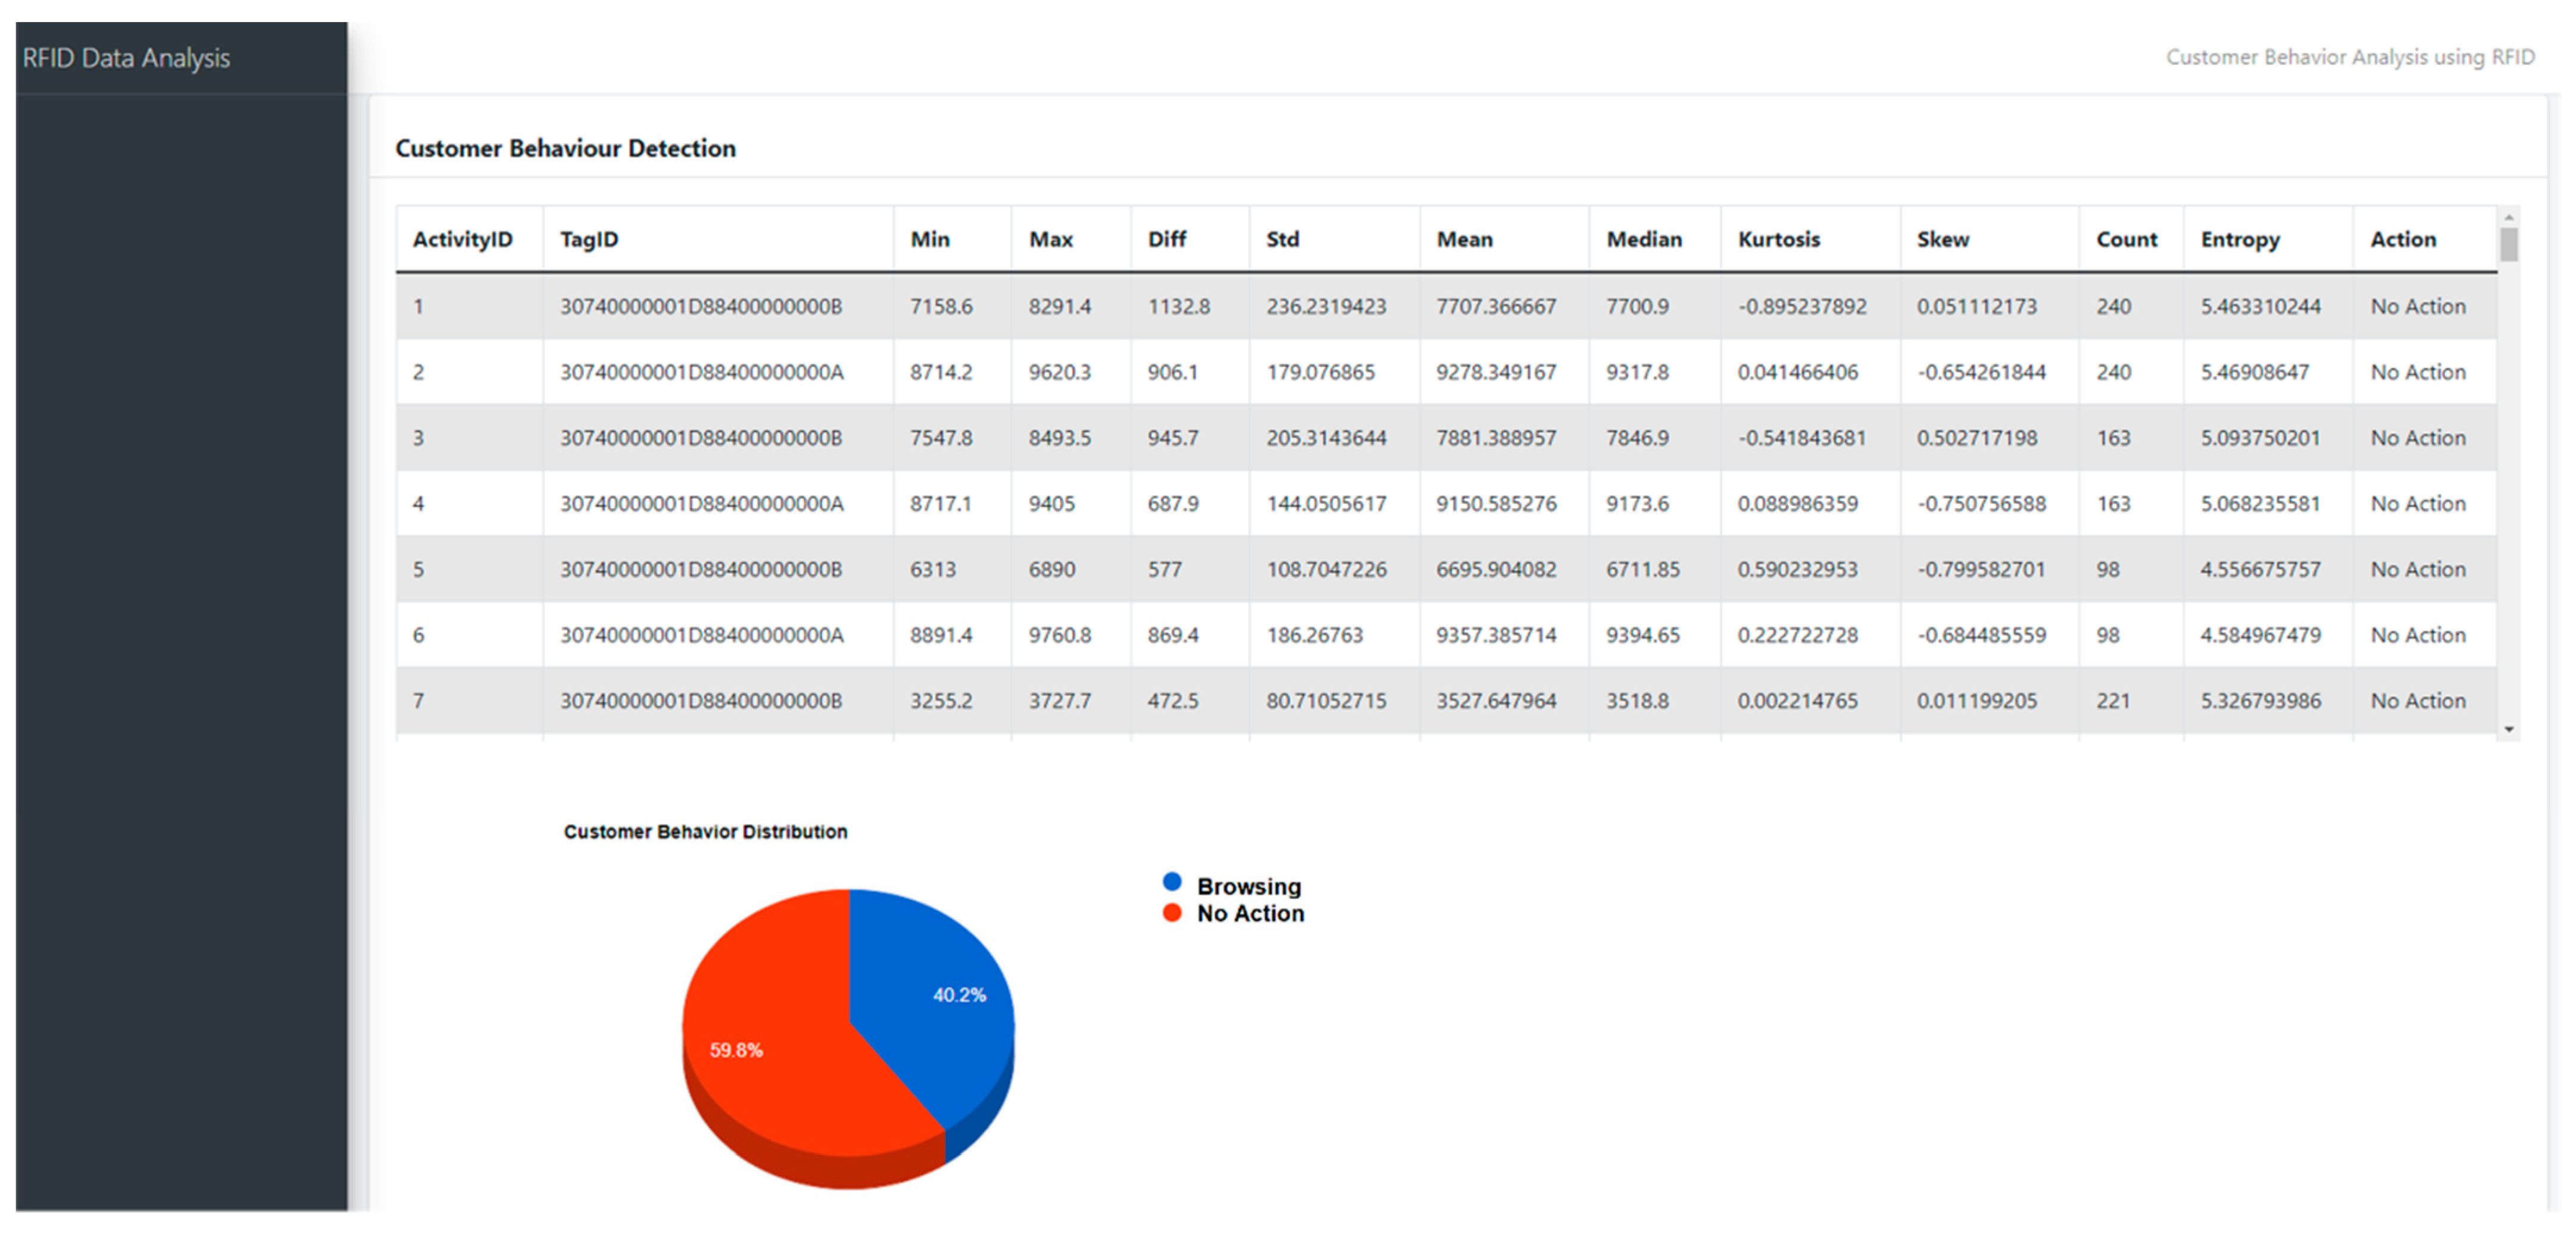
- Finally, we showcased the practicality of our model by designing and implementing a web-based customer behavior analysis system.
2. Literature Review
2.1. Customer Behavior Analysis Based on RFID
2.2. Isolation Forest Outlier Detection
2.3. ADASYN Data Balancing
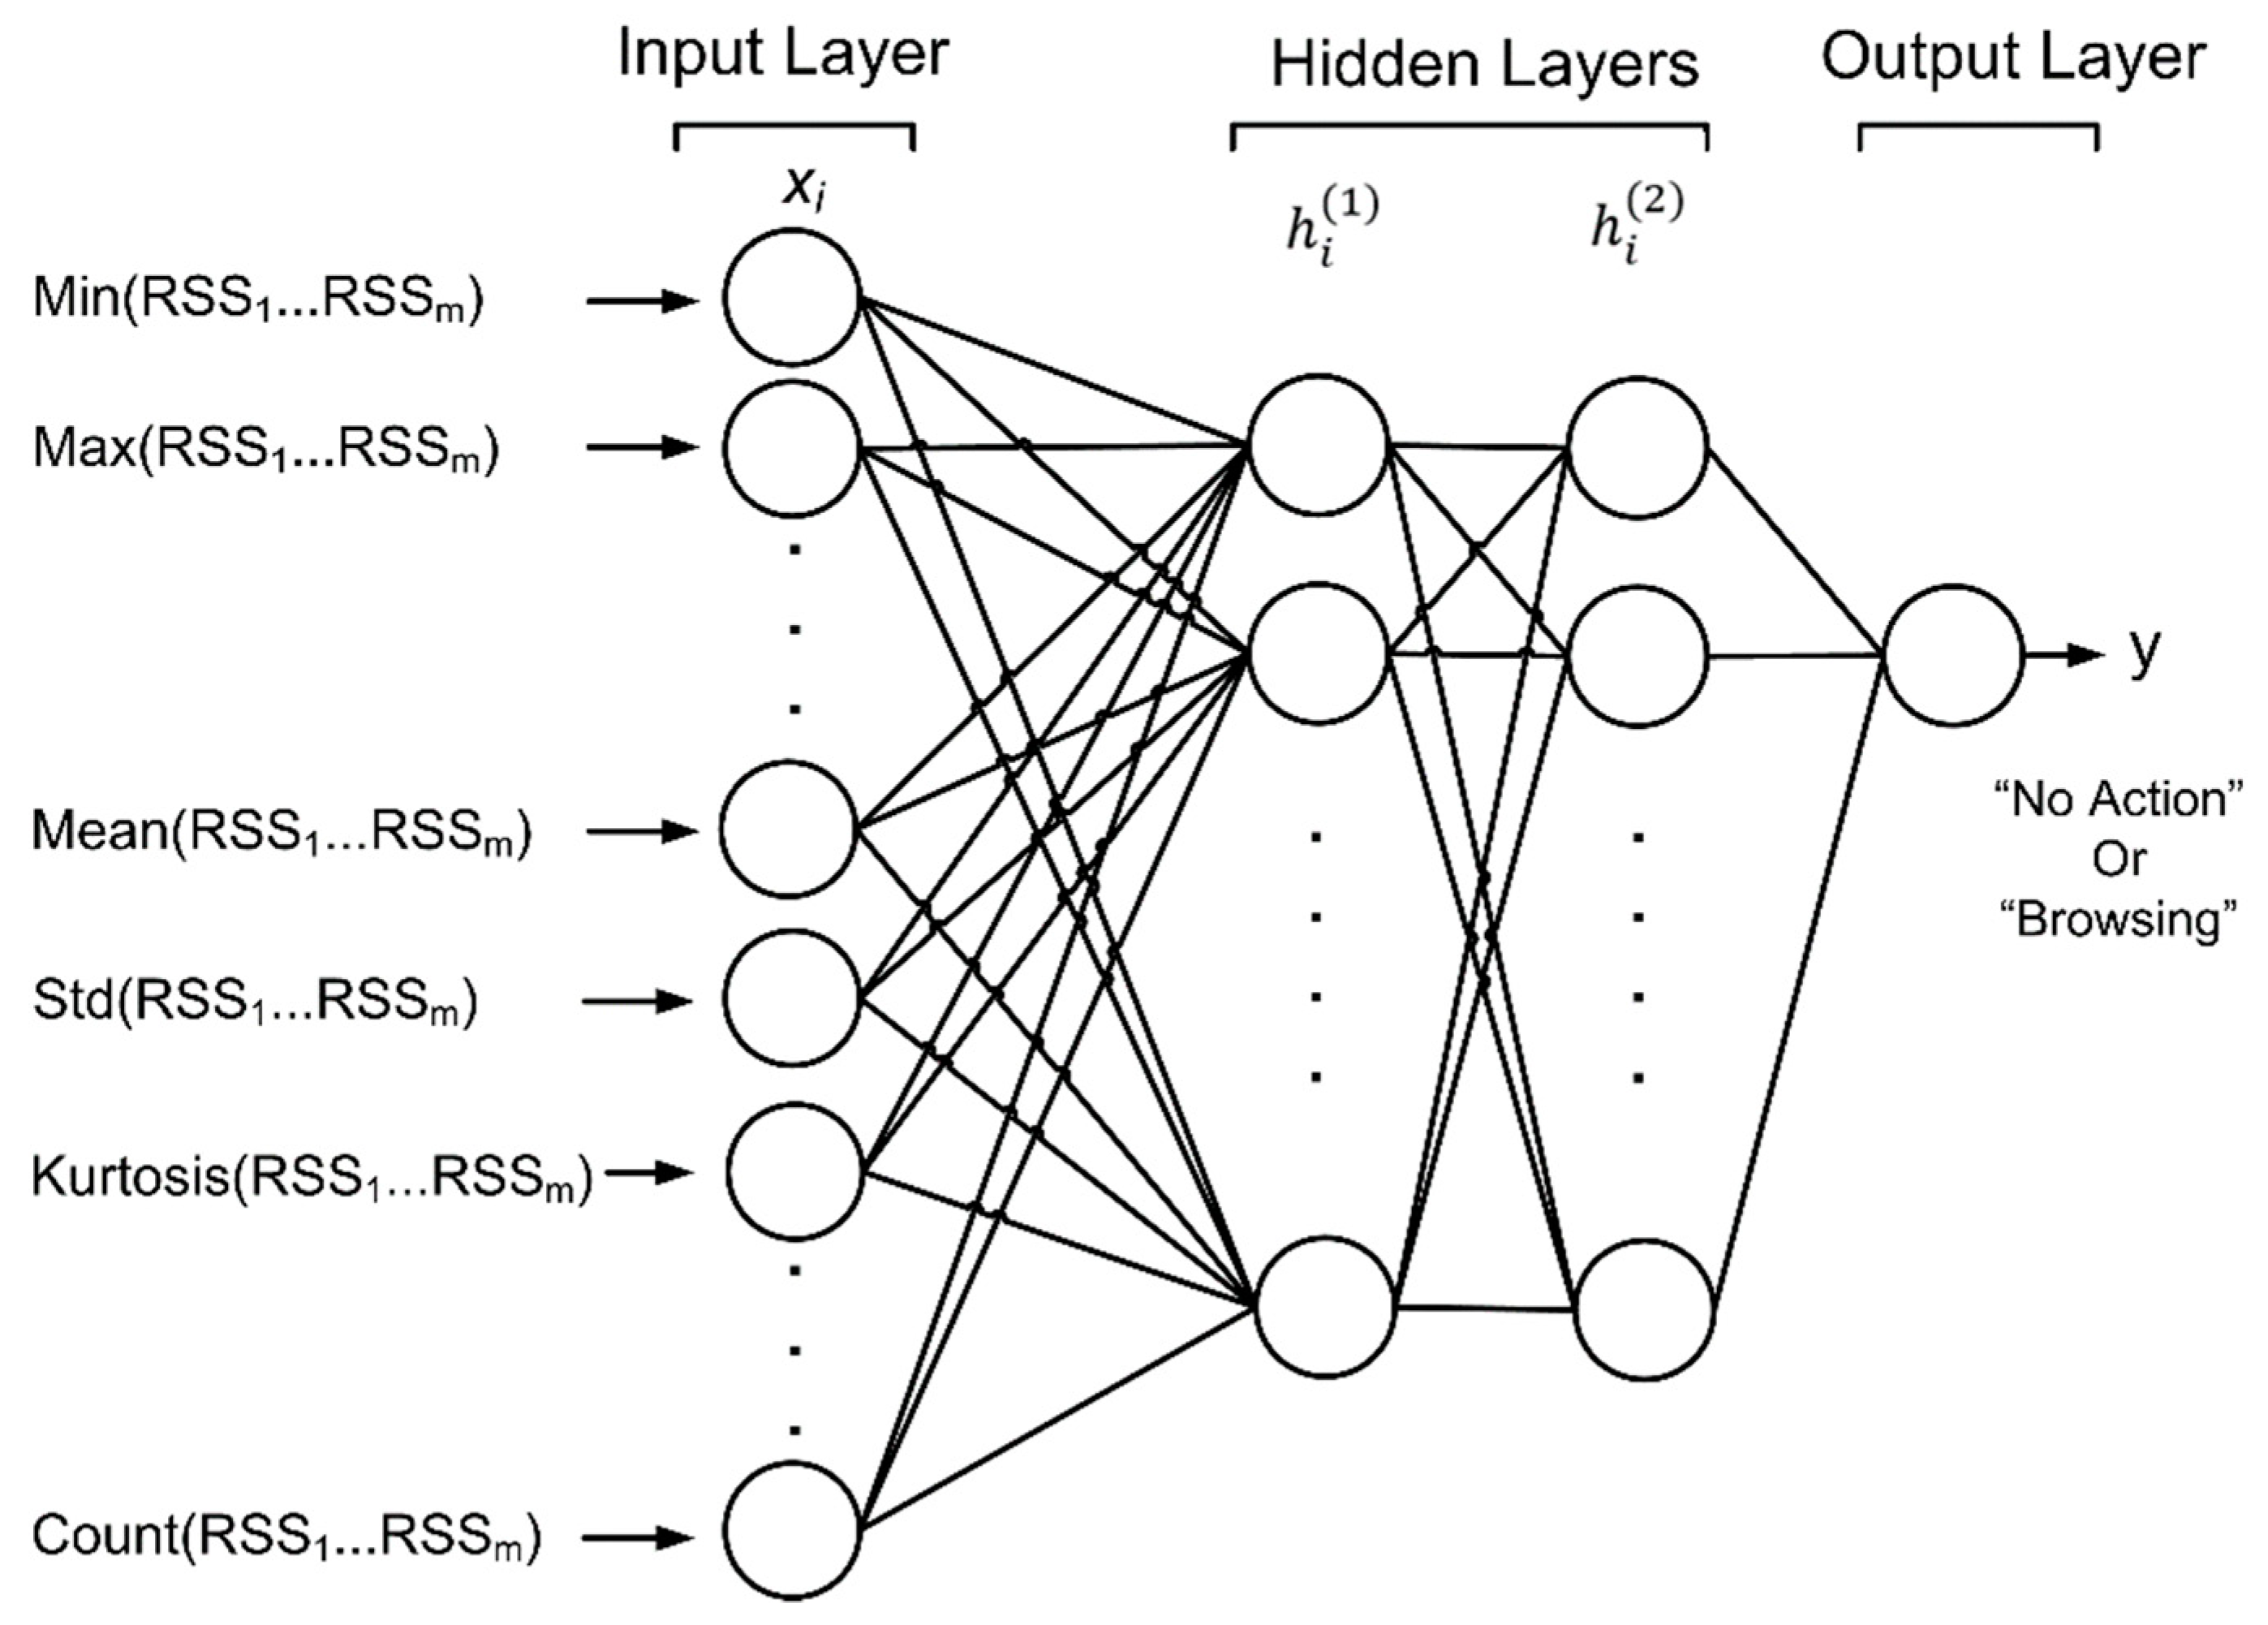
2.4. Multilayer Perceptron
3. Methodology
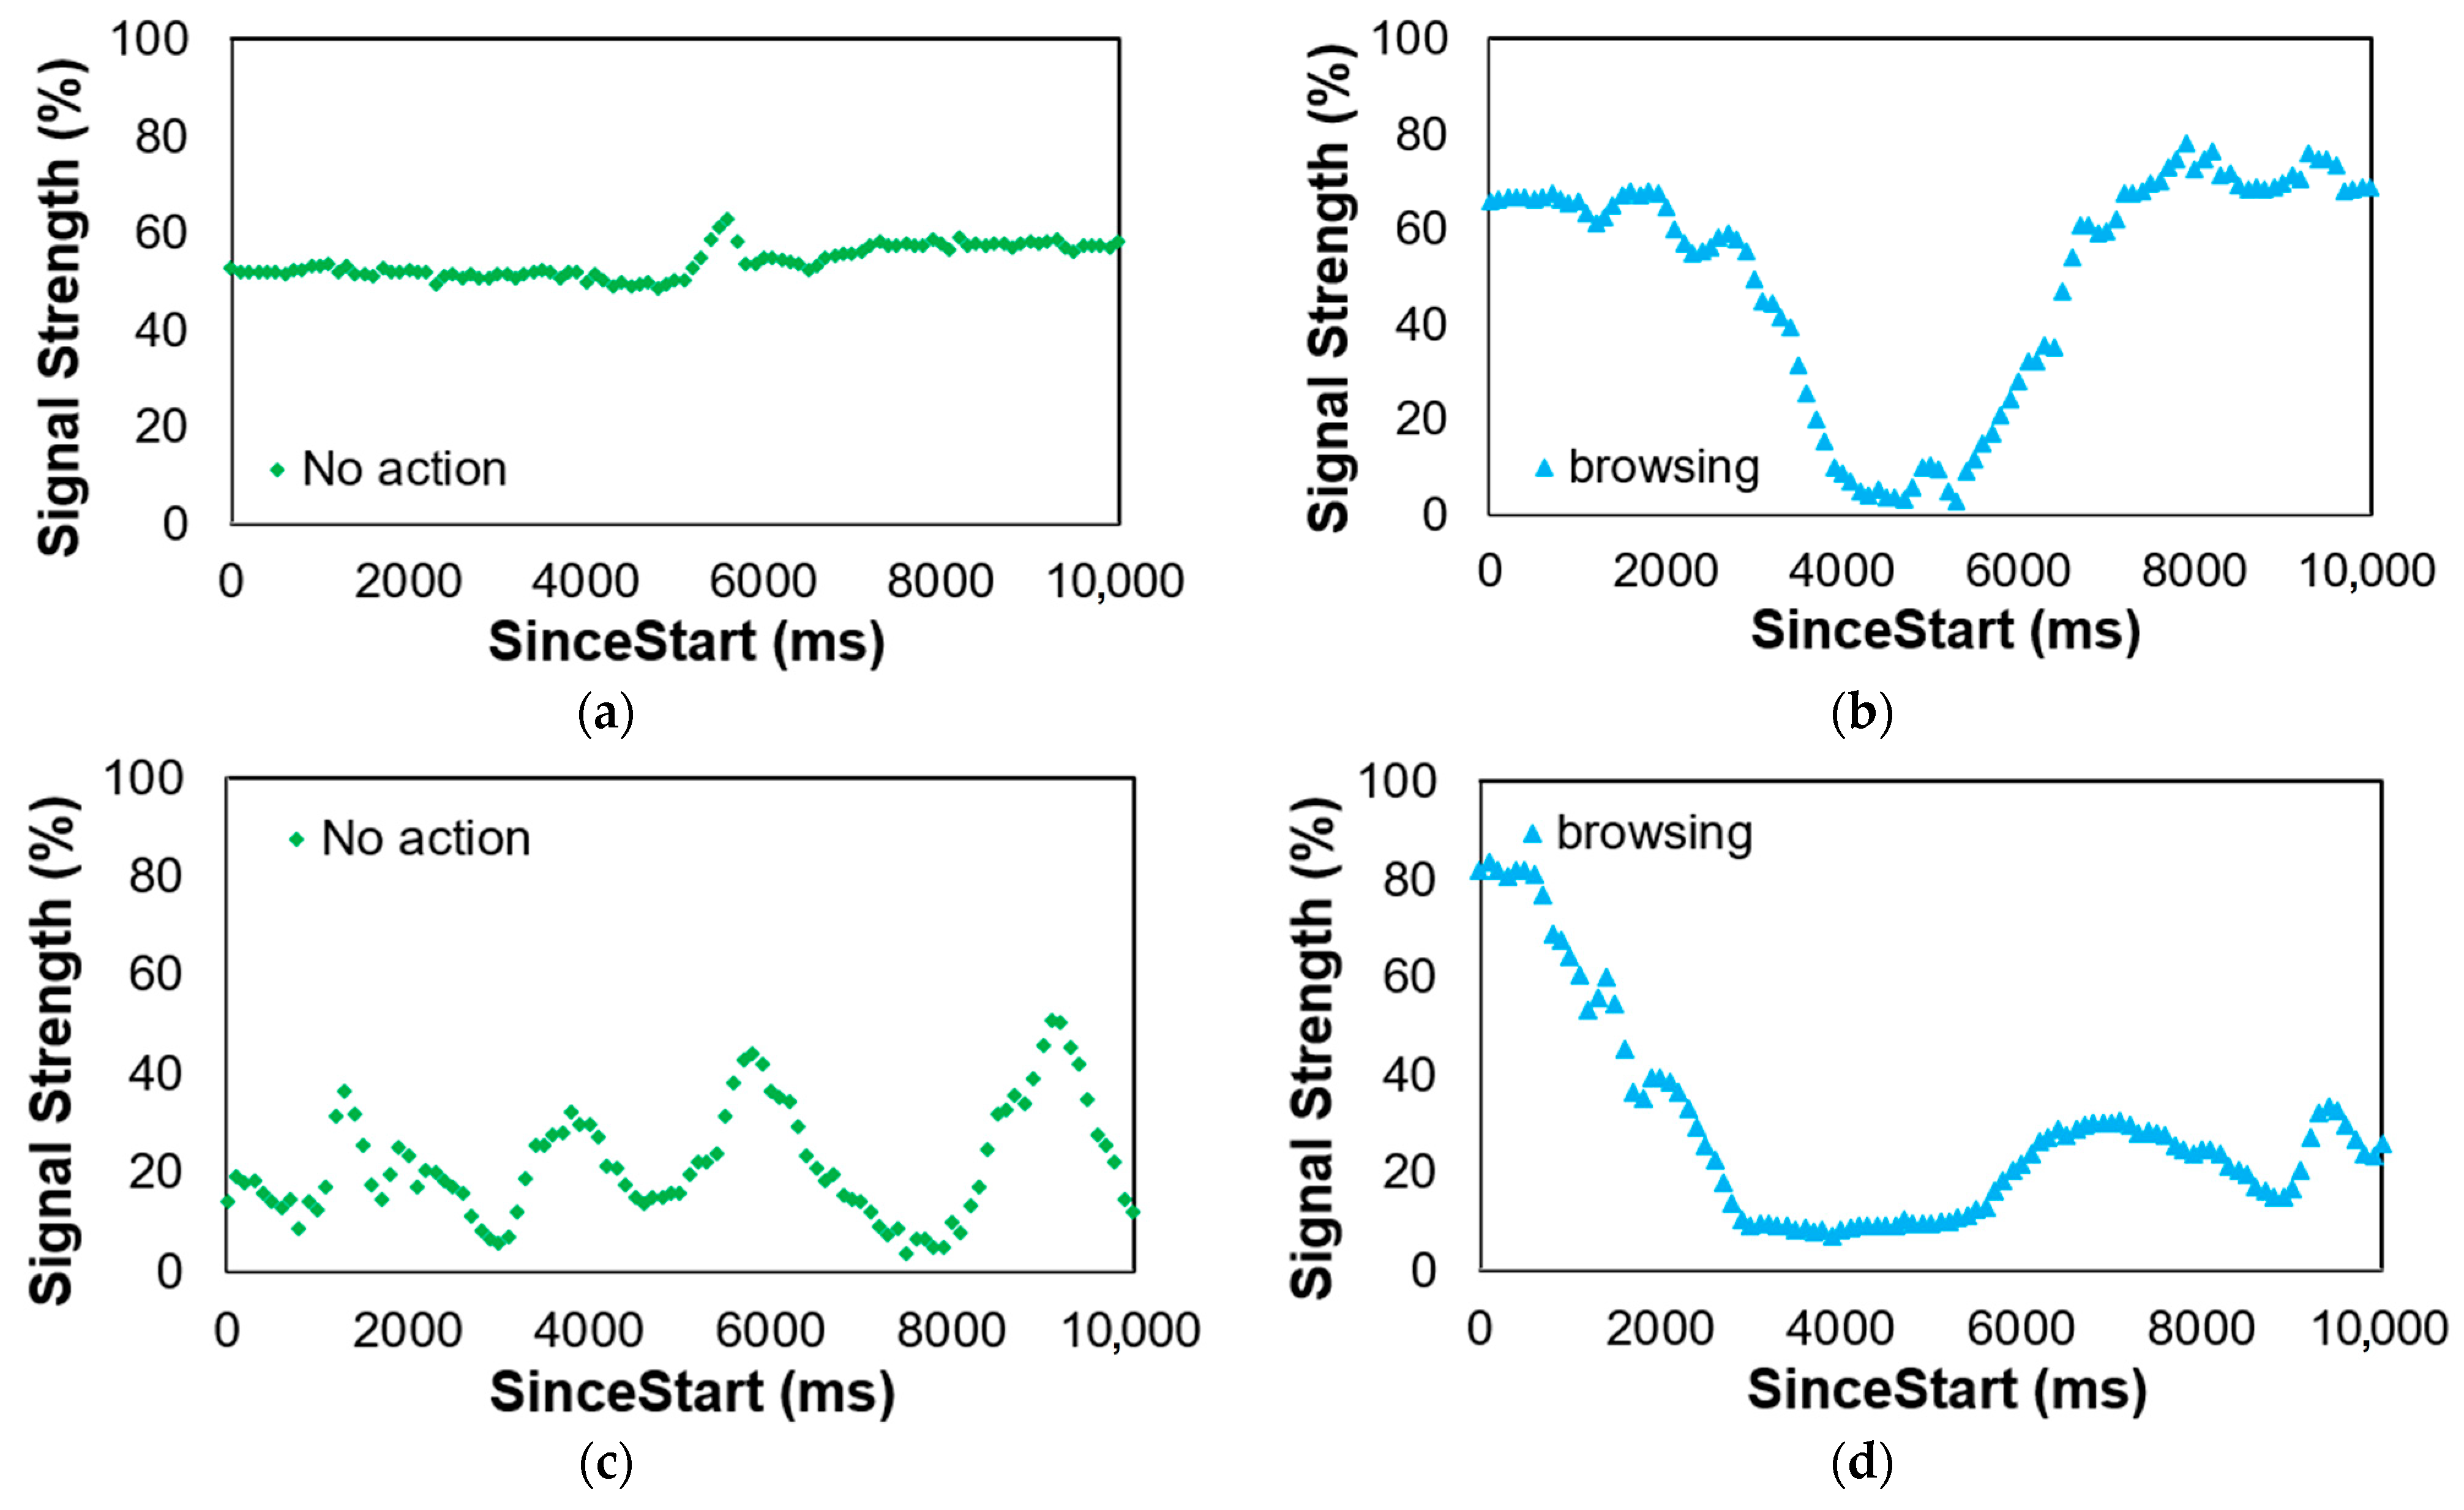
3.1. Dataset
3.2. Feature Extraction
3.3. iForest Outlier Detection
| Algorithm 1: Isolation forest. | ||
| Input | MaxSample, NumTree, D | |
| Output | Collection of iTrees | |
| 1: | create Forest | |
| 2: | ||
| 3: | for i = 1 to NumTree do | |
| 4: | D′ ⟵ sample(D, MaxSample) | |
| 5: | Forest ⟵ iTree (D′, 0, h) | |
| 6: | end for | |
| 7: | return Forest | |
3.4. ADASYN
3.5. Multilayer Perceptron
4. Result and Discussion
4.1. Performance of Machine Learning Models
4.2. Impact of Outlier Detection and Data Balancing Method on Model Performance
4.3. Comparison with Previous Studies
4.4. Practical Applications
5. Conclusions and Future Works
Author Contributions
Funding
Data Availability Statement
Conflicts of Interest
References
- Hawkins, D.I.; Mothersbaugh, D.L. Consumer Behavior: Building Marketing Strategy, 13th ed.; McGraw-Hill Education: New York, NY, USA, 2016; ISBN 978-1-259-23254-1. [Google Scholar]
- Want, R. An Introduction to RFID Technology. IEEE Pervasive Comput. 2006, 5, 25–33. [Google Scholar] [CrossRef]
- Ozguven, E.E.; Ozbay, K. An RFID-Based Inventory Management Framework for Emergency Relief Operations. Transp. Res. Part C Emerg. Technol. 2015, 57, 166–187. [Google Scholar] [CrossRef]
- Lenko, F. Specifics of RFID Based Access Control Systems Used in Logistics Centers. Transp. Res. Procedia 2021, 55, 1613–1619. [Google Scholar] [CrossRef]
- Oztekin, A.; Pajouh, F.M.; Delen, D.; Swim, L.K. An RFID Network Design Methodology for Asset Tracking in Healthcare. Decis. Support Syst. 2010, 49, 100–109. [Google Scholar] [CrossRef]
- Unhelkar, B.; Joshi, S.; Sharma, M.; Prakash, S.; Mani, A.K.; Prasad, M. Enhancing Supply Chain Performance Using RFID Technology and Decision Support Systems in the Industry 4.0–A Systematic Literature Review. Int. J. Inf. Manag. Data Insights 2022, 2, 100084. [Google Scholar] [CrossRef]
- Badi, R.; Momin, B. SISC: Sensor-based intelligent shopping cart. In Proceedings of the 2018 3rd International Conference for Convergence in Technology (I2CT), Pune, India, 6–8 April 2018; IEEE: New York, NY, USA, 2018; pp. 1–4. [Google Scholar]
- Athauda, T.; Marin, J.C.L.; Lee, J.; Karmakar, N.C. Robust Low-Cost Passive UHF RFID Based Smart Shopping Trolley. IEEE J. Radio Freq. Identif. 2018, 2, 134–143. [Google Scholar] [CrossRef]
- Pradhan, S.; Chai, E.; Sundaresan, K.; Rangarajan, S.; Qiu, L. Konark: A RFID based system for enhancing in-store shopping experience. In Proceedings of the 4th International on Workshop on Physical Analytics, Niagara Falls, NY, USA, 19 June 2017; ACM: New York, NY, USA, 2017; pp. 19–24. [Google Scholar]
- Nakahara, T.; Yada, K. Analyzing Consumers’ Shopping Behavior Using RFID Data and Pattern Mining. Adv. Data Anal. Classif. 2012, 6, 355–365. [Google Scholar] [CrossRef]
- Shen, B.; Zheng, Q.; Li, X.; Xu, L. A Framework for Mining Actionable Navigation Patterns from In-Store RFID Datasets via Indoor Mapping. Sensors 2015, 15, 5344–5375. [Google Scholar] [CrossRef]
- Zhou, Z.; Shangguan, L.; Zheng, X.; Yang, L.; Liu, Y. Design and Implementation of an RFID-Based Customer Shopping Behavior Mining System. IEEE/ACM Trans. Netw. 2017, 25, 2405–2418. [Google Scholar] [CrossRef]
- Liu, W.; Wang, J.; Li, B.; Wang, L. Enabling Fine-Grained Shopping Behavior Information Acquisition with Dual RFID Tags. IEEE Internet Things J. 2020, 7, 7539–7549. [Google Scholar] [CrossRef]
- Shangguan, L.; Zhou, Z.; Zheng, X.; Yang, L.; Liu, Y.; Han, J. ShopMiner: Mining customer shopping behavior in physical clothing stores with COTS RFID devices. In Proceedings of the 13th ACM Conference on Embedded Networked Sensor Systems, Seoul, Republic of Korea, 1–4 November 2015; ACM: New York, NY, USA, 2015; pp. 113–125. [Google Scholar]
- Hauser, M.; Günther, S.A.; Flath, C.M.; Thiesse, F. Towards Digital Transformation in Fashion Retailing: A Design-Oriented IS Research Study of Automated Checkout Systems. Bus. Inf. Syst. Eng. 2019, 61, 51–66. [Google Scholar] [CrossRef]
- Choi, S.H.; Yang, Y.X.; Yang, B.; Cheung, H.H. Item-Level RFID for Enhancement of Customer Shopping Experience in Apparel Retail. Comput. Ind. 2015, 71, 10–23. [Google Scholar] [CrossRef]
- Alfian, G.; Syafrudin, M.; Rhee, J.; Stasa, P.; Mulyanto, A.; Fatwanto, A. In-Store Customer Shopping Behavior Analysis by Utilizing RFID-Enabled Shelf and Multilayer Perceptron Model. IOP Conf. Ser. Mater. Sci. Eng. 2020, 803, 012022. [Google Scholar] [CrossRef]
- Pasanisi, S.; Paiano, R. A Hybrid Information Mining Approach for Knowledge Discovery in Cardiovascular Disease (CVD). Information 2018, 9, 90. [Google Scholar] [CrossRef]
- Javed, F.; Gilani, S.O.; Latif, S.; Waris, A.; Jamil, M.; Waqas, A. Predicting Risk of Antenatal Depression and Anxiety Using Multi-Layer Perceptrons and Support Vector Machines. J. Pers. Med. 2021, 11, 199. [Google Scholar] [CrossRef]
- Ke, K.-C.; Huang, M.-S. Quality Prediction for Injection Molding by Using a Multilayer Perceptron Neural Network. Polymers 2020, 12, 1812. [Google Scholar] [CrossRef] [PubMed]
- Ferreira, J.; Callou, G.; Josua, A.; Tutsch, D.; Maciel, P. An Artificial Neural Network Approach to Forecast the Environmental Impact of Data Centers. Information 2019, 10, 113. [Google Scholar] [CrossRef]
- Ahmed, S. A Software Framework for Predicting the Maize Yield Using Modified Multi-Layer Perceptron. Sustainability 2023, 15, 3017. [Google Scholar] [CrossRef]
- Ribeiro, D.; Matos, L.M.; Moreira, G.; Pilastri, A.; Cortez, P. Isolation Forests and Deep Autoencoders for Industrial Screw Tightening Anomaly Detection. Computers 2022, 11, 54. [Google Scholar] [CrossRef]
- Chen, J.; Zhang, J.; Qian, R.; Yuan, J.; Ren, Y. An Anomaly Detection Method for Wireless Sensor Networks Based on the Improved Isolation Forest. Appl. Sci. 2023, 13, 702. [Google Scholar] [CrossRef]
- Alfian, G.; Syafrudin, M.; Fitriyani, N.L.; Alam, S.; Pratomo, D.N.; Subekti, L.; Octava, M.Q.H.; Yulianingsih, N.D.; Atmaji, F.T.D.; Benes, F. Utilizing Random Forest with IForest-Based Outlier Detection and SMOTE to Detect Movement and Direction of RFID Tags. Future Internet 2023, 15, 103. [Google Scholar] [CrossRef]
- Li, Z.; Wang, J.; Zhang, Z.; Jin, F.; Yang, J.; Sun, W.; Cao, Y. A Method Based on Improved IForest for Trunk Extraction and Denoising of Individual Street Trees. Remote Sens. 2022, 15, 115. [Google Scholar] [CrossRef]
- Zeng, J.; Cao, B.; Tian, R. Quality Monitoring for Micro Resistance Spot Welding with Class-Imbalanced Data Based on Anomaly Detection. Appl. Sci. 2020, 10, 4204. [Google Scholar] [CrossRef]
- Javeed, A.; Dallora, A.L.; Berglund, J.S.; Idrisoglu, A.; Ali, L.; Rauf, H.T.; Anderberg, P. Early Prediction of Dementia Using Feature Extraction Battery (FEB) and Optimized Support Vector Machine (SVM) for Classification. Biomedicines 2023, 11, 439. [Google Scholar] [CrossRef] [PubMed]
- Askari, M.R.; Abdel-Latif, M.; Rashid, M.; Sevil, M.; Cinar, A. Detection and Classification of Unannounced Physical Activities and Acute Psychological Stress Events for Interventions in Diabetes Treatment. Algorithms 2022, 15, 352. [Google Scholar] [CrossRef]
- Raihan, M.; Hassan, M.M.; Hasan, T.; Bulbul, A.A.-M.; Hasan, M.K.; Hossain, M.S.; Roy, D.S.; Awal, M.A. Development of a Smartphone-Based Expert System for COVID-19 Risk Prediction at Early Stage. Bioengineering 2022, 9, 281. [Google Scholar] [CrossRef]
- Zakariah, M.; AlQahtani, S.A.; Al-Rakhami, M.S. Machine Learning-Based Adaptive Synthetic Sampling Technique for Intrusion Detection. Appl. Sci. 2023, 13, 6504. [Google Scholar] [CrossRef]
- Cao, B.; Li, C.; Song, Y.; Qin, Y.; Chen, C. Network Intrusion Detection Model Based on CNN and GRU. Appl. Sci. 2022, 12, 4184. [Google Scholar] [CrossRef]
- Fu, Y.; Du, Y.; Cao, Z.; Li, Q.; Xiang, W. A Deep Learning Model for Network Intrusion Detection with Imbalanced Data. Electronics 2022, 11, 898. [Google Scholar] [CrossRef]
- Thaher, T.; Zaguia, A.; Al Azwari, S.; Mafarja, M.; Chantar, H.; Abuhamdah, A.; Turabieh, H.; Mirjalili, S.; Sheta, A. An Enhanced Evolutionary Student Performance Prediction Model Using Whale Optimization Algorithm Boosted with Sine-Cosine Mechanism. Appl. Sci. 2021, 11, 10237. [Google Scholar] [CrossRef]
- Li, Q.; Song, Z. Ensemble-Learning-Based Prediction of Steel Bridge Deck Defect Condition. Appl. Sci. 2022, 12, 5442. [Google Scholar] [CrossRef]
- Liu, F.T.; Ting, K.M.; Zhou, Z.-H. Isolation forest. In Proceedings of the 2008 Eighth IEEE International Conference on Data Mining, Pisa, Italy, 15–19 December 2008; IEEE: New York, NY, USA, 2008; pp. 413–422. [Google Scholar]
- He, H.; Bai, Y.; Garcia, E.A.; Li, S. ADASYN: Adaptive synthetic sampling approach for imbalanced learning. In Proceedings of the 2008 IEEE International Joint Conference on Neural Networks (IEEE World Congress on Computational Intelligence), Hong Kong, 1–8 June 2008; IEEE: New York, NY, USA, 2008; pp. 1322–1328. [Google Scholar]
- Alien Technology ALR-9900 Enterprise RFID Reader. Available online: http://www.alientechnology.com/wp-content/uploads/Alien-Technology-ALR-9900-Enterprise-RFID-Reader.pdf (accessed on 1 January 2023).
- Ma, H.; Wang, Y.; Wang, K. Automatic Detection of False Positive RFID Readings Using Machine Learning Algorithms. Expert Syst. Appl. 2018, 91, 442–451. [Google Scholar] [CrossRef]
- Alfian, G.; Syafrudin, M.; Yoon, B.; Rhee, J. False Positive RFID Detection Using Classification Models. Appl. Sci. 2019, 9, 1154. [Google Scholar] [CrossRef]
- Rumelhart, D.E.; Hinton, G.E.; Williams, R.J. Learning Representations by Back-Propagating Errors. Nature 1986, 323, 533–536. [Google Scholar] [CrossRef]
- Han, J.; Kamber, M.; Pei, J. Data Mining; Elsevier: Amsterdam, The Netherlands, 2012; ISBN 978-0-12-381479-1. [Google Scholar]
- Pedregosa, F.; Varoquaux, G.; Gramfort, A.; Michel, V.; Thirion, B.; Grisel, O.; Blondel, M.; Müller, A.; Nothman, J.; Louppe, G.; et al. Scikit-Learn: Machine Learning in Python. J. Mach. Learn. Res. 2012, 12, 2825–2830. [Google Scholar] [CrossRef]
- Sokolova, M.; Lapalme, G. A Systematic Analysis of Performance Measures for Classification Tasks. Inf. Process. Manag. 2009, 45, 427–437. [Google Scholar] [CrossRef]
- Bradley, A.P. The Use of the Area under the ROC Curve in the Evaluation of Machine Learning Algorithms. Pattern Recognit. 1997, 30, 1145–1159. [Google Scholar] [CrossRef]
- Huang, J.; Ling, C.X. Using AUC and Accuracy in Evaluating Learning Algorithms. IEEE Trans. Knowl. Data Eng. 2005, 17, 299–310. [Google Scholar] [CrossRef]
- Alfian, G.; Syafrudin, M.; Farooq, U.; Ma’arif, M.R.; Syaekhoni, M.A.; Fitriyani, N.L.; Lee, J.; Rhee, J. Improving Efficiency of RFID-Based Traceability System for Perishable Food by Utilizing IoT Sensors and Machine Learning Model. Food Control 2020, 110, 107016. [Google Scholar] [CrossRef]
- Rau, H.-H.; Hsu, C.-Y.; Lin, Y.-A.; Atique, S.; Fuad, A.; Wei, L.-M.; Hsu, M.-H. Development of a Web-Based Liver Cancer Prediction Model for Type II Diabetes Patients by Using an Artificial Neural Network. Comput. Methods Programs Biomed. 2016, 125, 58–65. [Google Scholar] [CrossRef]
- Ahmed, N.; Ahammed, R.; Islam, M.M.; Uddin, M.A.; Akhter, A.; Talukder, M.A.-A.; Paul, B.K. Machine Learning Based Diabetes Prediction and Development of Smart Web Application. Int. J. Cogn. Comput. Eng. 2021, 2, 229–241. [Google Scholar] [CrossRef]
- Anceschi, E.; Bonifazi, G.; De Donato, M.C.; Corradini, E.; Ursino, D.; Virgili, L. SaveMeNow.AI: A machine learning based wearable device for fall detection in a workplace. In Enabling AI Applications in Data Science; Hassanien, A.-E., Taha, M.H.N., Khalifa, N.E.M., Eds.; Studies in Computational Intelligence; Springer International Publishing: Cham, Switzerland, 2021; Volume 911, pp. 493–514. ISBN 978-3-030-52066-3. [Google Scholar]


| Metric | Formula |
|---|---|
| Precision | |
| Recall/Sensitivity | |
| Specificity | |
| F1 score | |
| Accuracy |
| Model | Accuracy | Precision | Specificity | Recall | F1 Score |
|---|---|---|---|---|---|
| LR | 92.197 ± 8.389 | 93.472 ± 8.392 | 90.536 ± 9.968 | 90.536 ± 9.968 | 91.268 ± 9.610 |
| KNN | 95.606 ± 8.304 | 95.833 ± 8.690 | 94.786 ± 9.804 | 94.786 ± 9.804 | 95.079 ± 9.506 |
| DT | 89.470 ± 13.638 | 91.972 ± 10.861 | 88.929 ± 13.870 | 88.929 ± 13.870 | 88.290 ± 14.926 |
| SVM | 97.424 ± 3.939 | 97.750 ± 3.571 | 97.286 ± 4.211 | 97.286 ± 4.211 | 97.282 ± 4.154 |
| NB | 93.939 ± 8.906 | 94.806 ± 8.571 | 93.321 ± 9.335 | 93.321 ± 9.335 | 93.527 ± 9.413 |
| AdaBoost | 91.970 ± 13.035 | 92.817 ± 12.689 | 91.929 ± 13.233 | 91.929 ± 13.233 | 91.469 ± 13.824 |
| XGBoost | 91.970 ± 13.035 | 92.817 ± 12.689 | 91.929 ± 13.233 | 91.929 ± 13.233 | 91.469 ± 13.824 |
| RF | 92.879 ± 11.217 | 93.913 ± 10.074 | 93.179 ± 10.542 | 93.179 ± 10.542 | 92.577 ± 11.575 |
| Proposed Model | 97.778 ± 6.667 | 98.000 ± 6.000 | 98.333 ± 5.000 | 98.333 ± 5.000 | 97.750 ± 6.750 |
| Authors | Input Feature | Model | Result | Model Deployment |
|---|---|---|---|---|
| [16] | Count (total RFID tag read occurrences) | K-Means clustering | The data from tag reads were grouped into multiple zones, with one of these zones representing customer browsing behavior. | Not reported |
| [12] | Phase shift | Gaussian model, ShopMiner | The model aimed to identify customer behaviors such as browsing and product interaction (turnaround), achieving an overall detection accuracy of more than 93%. | Not reported |
| [13] | RFID phase | Threshold based behavior recognition | The study attempted to identify customer behaviors, including browsing and product rotation, with an average precision of 89%. | Not reported |
| [15] | RSS with time-domain features | ANN | The model aimed to predict customer movement as they passed through the RFID gate, achieving an accuracy of 98.59%. | Not reported. |
| [17] | RSS with time-domain features | MLP + Extra Trees Feature Selection | The model’s objective was to predict customer actions, achieving an accuracy of 97.00%, a precision of 96.67%, a recall of 97.50%, and an F1-score of 96.57%. | Not reported |
| Proposed Model | RSS with time-domain features | MLP + iForest outler detection + ADASYN data balancing | The model successfully predicted customer activity, achieving an accuracy of 97.778%, a precision of 98.008%, a specificity of 98.333%, a recall of 98.333%, and an F1-score of 97.750%. | Yes |
Disclaimer/Publisher’s Note: The statements, opinions and data contained in all publications are solely those of the individual author(s) and contributor(s) and not of MDPI and/or the editor(s). MDPI and/or the editor(s) disclaim responsibility for any injury to people or property resulting from any ideas, methods, instructions or products referred to in the content. |
© 2023 by the authors. Licensee MDPI, Basel, Switzerland. This article is an open access article distributed under the terms and conditions of the Creative Commons Attribution (CC BY) license (https://creativecommons.org/licenses/by/4.0/).
Share and Cite
Alfian, G.; Octava, M.Q.H.; Hilmy, F.M.; Nurhaliza, R.A.; Saputra, Y.M.; Putri, D.G.P.; Syahrian, F.; Fitriyani, N.L.; Atmaji, F.T.D.; Farooq, U.; et al. Customer Shopping Behavior Analysis Using RFID and Machine Learning Models. Information 2023, 14, 551. https://doi.org/10.3390/info14100551
Alfian G, Octava MQH, Hilmy FM, Nurhaliza RA, Saputra YM, Putri DGP, Syahrian F, Fitriyani NL, Atmaji FTD, Farooq U, et al. Customer Shopping Behavior Analysis Using RFID and Machine Learning Models. Information. 2023; 14(10):551. https://doi.org/10.3390/info14100551
Chicago/Turabian StyleAlfian, Ganjar, Muhammad Qois Huzyan Octava, Farhan Mufti Hilmy, Rachma Aurya Nurhaliza, Yuris Mulya Saputra, Divi Galih Prasetyo Putri, Firma Syahrian, Norma Latif Fitriyani, Fransiskus Tatas Dwi Atmaji, Umar Farooq, and et al. 2023. "Customer Shopping Behavior Analysis Using RFID and Machine Learning Models" Information 14, no. 10: 551. https://doi.org/10.3390/info14100551
APA StyleAlfian, G., Octava, M. Q. H., Hilmy, F. M., Nurhaliza, R. A., Saputra, Y. M., Putri, D. G. P., Syahrian, F., Fitriyani, N. L., Atmaji, F. T. D., Farooq, U., Nguyen, D. T., & Syafrudin, M. (2023). Customer Shopping Behavior Analysis Using RFID and Machine Learning Models. Information, 14(10), 551. https://doi.org/10.3390/info14100551